Embed Size (px)
Citation preview

JOIMwww.joim.com
Journal Of Investment Management, Vol. 10, No. 4, (2012), pp. 64–90
© JOIM 2012
THE ROLE OF STRESS TESTINGIN CREDIT RISK MANAGEMENT
Roger M. Stein a,∗
In this paper, we outline some concepts relating to the use of stress testing in credit risk man-agement. We begin by providing a simple taxonomy of stress scenarios and discussing thetrade-offs that different approaches require for implementation. Our taxonomy is modeledafter one that is common in the credit literature and involves concepts related to reduced-form and structural approaches to credit modeling. Recently, some have expressed theview that the use of distribution-based measures such as VaR and expected shortfall (ES)for credit risk management should be deemphasized in favor of stress testing and scenarioanalysis. We consider this question in the main portion of this article. We discuss the ben-efits of stress testing and scenario analysis as well as describing some limitations of usingscenario-based approaches as a sole mechanism for assessing portfolio risk. We providea number of examples to illustrate these limitations. In particular, except in special cases,it is difficult to use stress scenarios alone, ex ante, for allocating capital across disparateportfolios. However, stress testing and scenario analysis are integral to prudent credit riskmanagement and can complement measures such as VaR and ES, thereby better informingboth risk assessment and business strategy development. While neither stress testing norVaR type measures, in and of themselves, provide complete descriptions of credit portfoliorisk, combining both approaches results in more robust risk analysis. This permits riskmanagers to integrate quantitative measures with managerial intuition and judgment toarrive at more comprehensive assessments of both portfolio risk and overall firm strategy.
aMoody’s Corporation, New York, NY 10007.∗The views expressed in this article are those of the author and do not represent the views of current or former employers(Moody’s Research Labs, Moody’s Investors Service, Moody’s Risk Management Services, Moody’s KMV) or any oftheir affiliates. Accordingly, all of the foregoing companies and their affiliates expressly disclaim all responsibility for thecontent and information contained herein.
Fourth Quarter 2012 64

The Role of Stress Testing in Credit Risk Management 65
1 Introduction
A BIS study (Committee on the Global Finan-cial System, 2005) compiled survey results on thestress-testing practices of 64 banks and securitiesfirms across 16 countries. At that time, the authorsfound that:
“The exercise illustrated the wide range of stress testpractices at banks and securities firms. The use of stresstests continues to broaden from the exploration of excep-tional, but plausible events—the traditional focus of stresstesting—to cover a much wider range of applications. Theexpanded usage of stress testing derives from its wideracceptance within firms. Aside from its inherent flexibil-ity, it benefits from explicitly linking potential impacts tospecific events.”
Although banks evidenced increasing growth inthe use of stress testing prior to the crisis, thefocus at that time appears to have been primar-ily on applications to market risk. For example,the BIS study found that market risk-relatedstress-testing exercises represented about 80%of all tests reported. In contrast, stress testingfor nontraded portfolios (e.g., loan books, retail,and other credit portfolios) was nascent in mostinstitutions, as were practical methods for inte-grating the risks of different portfolios across aninstitution.
Since the crisis, however, there has been consid-erably more attention given to these issues. This isevidenced by the sudden and pronounced growthin the literature on stress testing (starting in about2006) and the frequent focus of regulators andrisk managers on the design and implementationof stress tests since the onset of the crisis.
Stress tests are being used in a broader variety ofcontexts than even in the recent past and beingapplied to a wider set of tasks. These applicationsrange from the more traditional regulatory report-ing and risk management to newer uses as part ofthe due diligence process for acquisition analy-sis and in strategic planning to set a bank’s risk
appetite or determine which business segments togrow or stem. Within the regulatory community,stress testing has also emerged as a key tool inmonitoring systemic risk.
In this paper, we focus primarily on how stresstesting can be used to enhance credit portfoliorisk management and the analysis of systemiccredit risk. We present perspectives on both thegreat strengths and the important limitations ofstress testing and scenario analysis for these appli-cations. Although our focus is on credit risk, anumber of our observations also carry over tostress-testing exercises related to market risk andliquidity risk; we do not, however, consider thesein detail here.
The recent resurgence of interest in stress test-ing has occurred, in part, because there isarguably no more intuitive form of risk analy-sis than a stress test. The selection of scenariosfor and the analysis of output resulting fromstress-testing exercises often precipitate intenseand productive discussions between businessmanagers and risk managers within a financialinstitution.
For example, in setting a firm’s risk appetite,stress testing provides means for a bank to gobeyond generic statements such as: “The bankwill not take on any risks that put the enterprise atrisk.” to more concrete ones such as: “The bankshould be able to withstand a mild recession whilestill achieving break-even profitability and main-taining a 4% Tier I capital reserve,” and to provideanalysis to support this.
Stress tests also offer alternative perspectives andadditional flexibility. It can be difficult to use morequantitative techniques to examine the extremetails of distributions that fall outside of the dynam-ics (or the data) of historical experience (Bohn andStein, 2009). Stress-testing exercises provide ameans to associate concrete views on states of the
Fourth Quarter 2012 Journal Of Investment Management

66 Roger M. Stein
world with model outputs and to evaluate thoseoutputs for reasonableness.
Some market participants have gone as far as toadvocate the use of stress testing as a substitutefor more traditional loss-distribution type mea-sures (e.g., multifactor VaR or expected shortfall[ES]).1 Our view is more measured. While we findstress testing to be valuable for gaining insightinto an institution’s portfolios and models, we seeit as a complement to rather than a replacementfor distribution-based methods. Said differently,stress tests may best be used for motivation ratherthan measurement.
In this paper, we discuss views on the practi-cal role of stress testing within the credit risk-management function. We differentiate the use ofstress testing as a qualitative approach to under-standing and providing reality checks for a modelor portfolio on the one hand, from the use of stresstesting in a quantitative setting as a capital mea-sure, on the other. While there exist techniquesfor assigning specific probabilistic interpretationsto individual stress scenarios in bespoke analyticsettings, in most cases, it appears to be difficultto use stress testing as the sole mechanism formaking quantitative statements, ex ante, about theprobabilities of large future losses on a bank’s var-ious holdings; it is also difficult to find a singleor small set of general stress scenarios that willbe adequate to measure risk consistently acrossportfolios.2 This implies that setting capital basedsolely on stress tests results can be challenging.
This conclusion is based on three observations:
(1) It can be hard, in general, to order macroeco-nomic stress scenarios (from worst to best),even when point probabilities can be assignedto them, except through ex post reference tothe portfolio-specific losses that are forecastunder the scenarios.
(2) The cumulative loss probability under a stressscenario will vary from portfolio to portfolio
(or for a single portfolio over time), mak-ing designing generic stress thresholds hardex ante.
(3) It is difficult to assert that the behavior of mar-ket participants during moments of extremestress will be similar to (or an extrapolationof) the behavior of participants during normalor even “very bad” times. Ultimately, there-fore, the linkage between an extreme stateof the economy and the behavior of assets inthat extreme state is a matter of judgment, notempirical fact. While this is not a limitationunique to scenario analysis, it can be partic-ularly pronounced, given the extreme natureof many stress scenarios.
Despite its limitations as a stand-alone capitalallocation approach, stress testing is nonethe-less a valuable component of a robust credit–riskmanagement program as it can help mitigatemodel risk and provide insight into macroeco-nomic cases outside of a model’s construct. Saidmore strongly, not performing stress-testing exer-cises may lead to significant oversights in creditrisk management.
In addition to informing the risk manage-ment process, however, stress testing can alsoinform discussions of business strategy. As risk-management functions at financial institutionshave evolved, considerations of downside riskhave become a larger component of strategic dis-cussions regarding an institution’s risk appetite.Assessing the impact of stress scenarios on abusiness provides one effective method for gain-ing insight into which strategies may lead aninstitution to operate outside the bounds of itsoverall risk appetite (as specified by its board-level risk committee). For example, the resultsof a bank-wide stress-testing exercise may sug-gest certain business lines for which lending orexposure limits should be reduced or increased,or the results may inform the allocation of risk
Journal Of Investment Management Fourth Quarter 2012

The Role of Stress Testing in Credit Risk Management 67
management staff and resources in the bank.Furthermore, identifying trends in stress-testingresults compiled over time can serve as earlywarning signals for senior managers.
As stress scenarios are easier for business man-agers to grasp, they can be applied more readilyto strategic decisions. Capital sufficiency discus-sions can then merge with risk-strategy discus-sions and thus bring the objectives of businessmanagers risk managers closer in line. Stress-testing exercises make risk models more tangible,thereby making it easier for business managersand risk managers to communicate about theimplications and severity of extreme losses.3
In the remainder of this article, we outline someof the arguments that motivate these observations.We begin in Section 2 by describing a simple tax-onomy of stress scenarios and discuss the trade-offs that different stress scenario constructionapproaches imply. Our taxonomy is modeled afterone that is common in the credit risk literatureand involves concepts related to reduced-formand structural approaches to credit modeling. Sec-tion 3 describes some of the challenges in usingstress test results probabilistically across portfo-lios. Section 4 discusses applications of stresstesting in both internal risk management and reg-ulatory settings. Finally, Section 5 concludes bysummarizing some of our key observations.
2 Types of stress scenarios
The term “stress scenario” is frequently usedwithout definition. This may be due, in part, tothe evolution of stress testing, which started inmany institutions primarily as a tool for examin-ing the market risk of portfolios (Committee onthe Global Financial System, 2005). In a market-risk context, the definition of a stress test isgenerally self-evident since the factors in a stressscenario typically involve variables like interestrate levels and term structure, the levels of equity
indices, and so forth. The primary concern inmarket-risk is the level and volatility of the fac-tors themselves, since these directly determine theprice of the asset. Therefore, stressing a portfoliois exactly equivalent to stressing underlying mar-ket factors. Interest rate swaps derive their marketvalue directly from the underlying rate structure,and equity positions often track closely the valueof broad market indices, so shocking interest ratesor equity indices forms a straightforward stresstest.
However, recently, interest has expanded beyondmarket risk. As a result, more general macroeco-nomic factors (such as GDP, oil prices or homeprices) or asset–class-specific loss rates (such asdefault rates for mortgages or small and mediumenterprises [SMEs]) have become components ofstress tests. In these cases, it is not always easy tofind a direct link4 between the factor level and theasset value that depends on it. Instead, some sortof more complex linking function is required totranslate a change in the factor level to a changein the asset value.
For purposes of this paper, we define two broadtypes of stress scenarios: those that we term struc-tural stress scenarios and those that we termreduced-form stress scenarios. We adopt this ter-minology from the credit-modeling literature inwhich a structural model refers to one in whichthere is a causal, economically intuitive relation-ship between the level of a firm’s asset value andits probability of default. In contrast, reduced-form models treat default events as “surprises,”the causes of which are not part of the model, butthe behavior of which can be observed.
Though the analogy is imperfect, in our taxon-omy, a structural stress scenario is one that positsa particular state of the economy, as describedby macroeconomic state variables (e.g., the levelof unemployment), and relies on some form of
Fourth Quarter 2012 Journal Of Investment Management
68 Roger M. Stein
model to link this state of the world, in an econom-ically plausible manner, to the resulting state ofthe assets. A reduced-form scenario, on the otherhand, directly posits the state of the assets (e.g.,the level of default rates), without necessarily pro-viding an economic cause for this state. In theremainder of this section, we discuss the form andproperties of these different approaches as well asthe constraints that each places on stress-testingexercises.
We begin with stress tests based on economicallymotivated scenarios. These involve examiningthe effects on a portfolio or firm of some par-ticular macroeconomic path, which we term astructural scenario. These scenarios can be par-ticularly helpful for communicating risks becausea firm’s management and risk managers can usethe tangible nature of the macroeconomic factorsto evaluate the plausibility of the scenario andto imagine how individual factors might evolve,given the states of the others. In order to use suchscenarios, the stress-testing exercise must alsomake use of one or more linking functions thatserve to relate the value of these macroeconomicfactors to asset behavior. For example, stress test-ing an SME portfolio using, say, changes in GDP,would require a function that translated changesin GDP into changes in the individual or aggregateloan losses.
Virolainen (2004) provides one example of thisapproach. The author uses a nonlinear aggregatemodel to determine the relationships between keymacroeconomic factors and the aggregate corpo-rate default rates in different sectors in Finlandby estimating a model in a SURE framework andthen using these estimates to stress the aggre-gate sector default rates.5 Otani et al. (2009) giveanother example of such a stress-testing exer-cise from a regulatory perspective. The authorsdescribe their implementation of an aggregatemodel for borrower-rating transitions, driven by
GDP and Debt. In their model, aggregation occursat the rating category level.
Although they are intuitive, structural stress sce-narios make high demands on stress testers sincenot only must the movements of the economic fac-tors be internally consistent, but the resulting assetbehaviors, given those movements, must also becharacterized through the linking function.
Far less demanding are the reduced-form6 sce-narios that do not require such links: a stresstester must define only the asset behaviors them-selves. The economic mechanism that led to thebehaviors is superfluous to the exercise. Prior tothe crisis, use of such reduced-form scenarioswas common. For example, at the time of theBIS’s 2004 study, most banks credit-stress testedtheir loan books by simply shocking quantitiessuch as PD and LGD levels or rating transitionrates (Committee on the Global Financial System,2005). Rösch and Scheule (2007) offer a morerecent example of a reduced-form framework forstress testing retail portfolios at the aggregatelevel. In their approach, PDs and correlations arestressed in various ways. The authors assume asingle-factor credit model for PD that they applyto each (homogeneous) asset class.7
Finally, some factors, such as interest rates, maytake on either a structural or reduced-form role.In the case of interest rates, exposures such asinterest rate swaps or risk-free securities may beevaluated directly through their explicit depen-dence on the level of interest rates at a specificpoint on the yield curve. However, for otherinstruments, interest rates might be a structuralfactor. For example, mortgages have more com-plex relationships to interest rate levels since thespeed of prepayments, the interest burden, andso forth depend in part on interest rate levels,in part on other macroeconomic factors such ashome prices and in part on non-macro factors suchas the initial coupon of the mortgage or the loan
Journal Of Investment Management Fourth Quarter 2012

The Role of Stress Testing in Credit Risk Management 69
structure. In this case, more complicated linkingfunctions are required to determine the impact ofchanges in interest rate levels.
We can understand better the differences in theseapproaches by examining their respective charac-teristics. Table 1 provides a brief comparison ofthe two approaches along some key dimensions.
There is a natural interplay between the dimen-sions of Asset Relationships and Economic Ratio-nale, which might be considered the definingcharacteristics of each approach. In general, thegreat benefit of the reduced-form approach is therelaxation of the requirement that there be a linkbetween the fundamental macroeconomic factorsand the asset behavior. (“Default rates increaseby 30%…”) The structural approach imposes thisrelationship. The payoff for this imposition comesin that there is typically a clear economic expla-nation for why the assets behave the way they do(“…because unemployment rates rise to 10%.”).The direct causal relationship between a changein a macroeconomic variable and a specific riskparameter is a salient attribute of the structuralapproach.
The recourse back to fundamental relationshipsalso provides a means for ensuring that the behav-ior across assets or portfolios is consistent—at
Table 1 A comparison of structural and reduced-form scenario approaches.
Reduced form Structural
Shock default-rate of portfolio Example of a scenario Shock levels of home prices or GDP
None Asset relationships required Link between asset behavior andstress factor
Not required and typically notgiven
Economic rationale for portfolioeffect
Explicit changes in fundamentalmacroeconomic factors
Not usually enforced Cross asset class/portfoliocoherence
High due to dependence oncommon factors
None. Portfolio state given as partof stress scenario
Impact of within portfolioheterogeneity
High. Depends on macro factorsselected and the factor loadings
least with respect to assumptions about states ofthe world. In a reduced-form stress scenario, if thedefault rate on asset class A doubles, should thedefault rate for another asset class (B) also dou-ble, increase by only 1.5 times, or stay flat? Thereduced-form approach provides little guidance.
In contrast, under a structural stress scenario,if the default rate on asset A increases by 30%because unemployment rises to 10% on one port-folio, we can examine what happens to the defaultrate on asset B when unemployment rises to 10%.In this way the default-rate shocks will be moreconsistent across portfolios. The macro factorsserve as an anchor to ensure that the same statesof the world obtain in each portfolio—though thebehavior is still subject to the individual linkingfunctions.
The issue of how robust a stress scenario isto differences in portfolio structure (last row inTable 1) is one that we deal with in more detailin Section 3.2. It turns out that heterogeneitywithin and across portfolios implies that a specificmacroeconomic stress scenario will be more orless stressful for some portfolios than others, evenwhen the assets are of the same broad type. Thisis because different macroeconomic behaviorsmay affect different individual assets differently.
Fourth Quarter 2012 Journal Of Investment Management

70 Roger M. Stein
Reduced-form stress scenarios simply impose aspecific level of asset behavior without refer-ence to the macroeconomic scenario and therebysidestep this issue.
3 Using stress tests probabilistically
Berkowitz (2000) proposes a formal definition ofstress tests and goes on to argue that stress tests becombined with distributional analyses (e.g., VaR)in a coherent framework. The proposed mecha-nism through which this is achieved is for eachscenario (or for the stressed-scenario distributionas a whole) to be assigned a probability (eitherbased on historical data or subjectively) and forthe distribution underlying a VaR model be sim-ilarly assigned a realization probability. Thesedistributions (of the various scenarios and VaRdistributions) are then sampled proportionatelyto their probabilities. Embedded in the author’srecommendation are the assumptions that it isfeasible to assign probabilities (and factor dis-tributions) to the stress scenarios and that theobjective of the stress testing is to examine a sin-gle portfolio, rather than to stress across multipleportfolios.
To some degree these assumptions may hold forsingle portfolios. However, it does not appear tobe the case more generally. One of the emergingrequirements for stress testing is that portfoliosbe comparable both within a single institution(e.g., the SME and mortgage portfolios) andacross multiple institutions (e.g., SME portfo-lios across large institutions), and in this setting,it is not clear that the implicit assumptions of(Berkowitz, 2000) are practically feasible, whenthe goal is to keep the cumulative probabilityof the losses constant across portfolios (e.g., forcapital allocation).
As we will discuss in this section, with the excep-tion of some special cases, it is typically notpossible ex ante to derive, in a manner that permits
generalization across portfolios, the probabilityof losses exceeding the loss obtained under a spe-cific scenario without reference to the full lossdistribution of the portfolio.
For example, some mistakenly assert that thecumulative probability of a loss being greater thana loss under a specific stress scenario is equiva-lent to the probability of the scenario. Thus, ifa certain scenario has, say, a 1 in 50 probabilityof occurring, the assertion would be that 98% oflosses on a portfolio would be less severe than thelosses under the scenario (1−1/50 = 0.98). Thisis generally not true.8
In the remainder of this section, we will explorewhy this might be so.
3.1 The mappings required to move from ascenario to a cumulative loss quantile(economic capital)
Consider the steps needed to move from thedefinition of a particular stress scenario to deter-mining the probability of a loss exceeding the lossunder that scenario, as would be required for cap-ital allocation purposes. (For ease of exposition,we only contemplate the steps of such a mappingfor a single portfolio.):
(1) First, define a method for constructing coher-ent and realistic scenarios. By coherent andrealistic, we mean that the scenarios reflectreasonable behaviors for interactions of thefactors in the scenario. That is, the combi-nation of scenario factors must be plausible.This should be true even if the scenario itselfrepresents an extreme case. For example, itwould be unusual to find a state of the worldin which unemployment in each major regionin a country increased by 1% but the nationallevel unemployment increased by 4%. Tobe clear, there may be specific reasons fordesigning such scenarios, but such instances
Journal Of Investment Management Fourth Quarter 2012

The Role of Stress Testing in Credit Risk Management 71
are rare and their use should be deliberaterather than unintentional or ad hoc.In practice, a number of approaches maybe used for generating such stress scenar-ios. By far the most common is the use ofheuristics and judgment. Such approaches areconvenient. However, as the number of fac-tors stressed becomes greater (e.g., more thana few) it becomes increasingly difficult toenforce coherence.9 This is particularly so ininstances where forecasts are averaged frommultiple sources to form a consensus forecast.In preference to heuristic forecasts, someanalysts sample from historical time periodsby choosing historically stressful windowsor by bootstrapping historical samples. Themost sophisticated forecasts are produced byusing some form of structural or reduced-form model of the economy, which maythen be shocked in various ways to producemore internally consistent forecasts for multi-ple series simultaneously (Zandi and Blinder,2010; Stein et al., 2010).
(2) Assign a probability to the scenario. Thoughnot strictly required, it is often desired.This may be done by means of expert judg-ment, the use of more formal Bayesianapproaches (Rebonato, 2010), through histor-ical sampling, or through the use of economicsimulations. Note that this scenario prob-ability is only the probability that such ascenario will occur, not the probability thatother “worse” or “better” scenarios will takeplace.10
(3) Map the scenario to an asset- or portfolio-specific loss. This is done through a linkingfunction of some sort. For example, an SMEprobability of default model might take asinput GDP and other factors and produce apoint-in-time PD. Alternatively, a mortgagemodel might make use of the loan-to-value(LTV) of a mortgage in which the “value”component is calculated as a function of
the original LTV and change in the homeprice index for the region under the stressscenario.
(4) Assign a cumulative probability to the expo-sure loss. Strictly speaking, the point prob-ability of the specific loss associated with aspecific stress scenario may be the same asthat of the scenario as specified in (2). How-ever, for capital allocation purposes we needthe cumulative probability of the loss, whichrequires that the losses be ordered. To esti-mate how much capital to allocate, we alsotypically need a sufficiently large number ofscenarios to be able determine the typical oraverage loss of an exposure or sub-portfoliowhen the entire portfolio loss exceeds the cap-ital threshold. Analyses that use only a smallnumber of scenarios may understate the cap-ital usage of a particular exposure or groupof exposures. Also note that for reasons wewill articulate in more detail below, theseprobabilities (or even the scenario orderings)cannot usually be transferred from one port-folio to the other or from the same portfoliofrom one date to a later date after trading hasoccurred and instruments have become moreseasoned.
The difficulty in ordering scenarios ex ante makesit challenging to use stress testing as a generaltechnique for capital allocation across portfolios.This is the subject of Section 3.2.
3.2 Ordering individual stress scenarios
It is typically not possible to order macro-economic scenarios themselves ex ante. Forexample:
• Is a 2% rise in national unemployment worsethan a 10% drop in national home prices?
• Is a 10% drop in national home prices worsethan a $20/barrel rise in the price of oil?
Fourth Quarter 2012 Journal Of Investment Management

72 Roger M. Stein
In both cases, the resolution of which scenariois “worse” depends on a number of factors,including an understanding of which types ofassets are being stressed. Consider an institutionthat has an active business lending to energy pro-ducers and airlines. For this portfolio, a $20/barrelrise in oil prices might be a very bad thing asits borrowers will face economic constraints intheir businesses. However, if the lending institu-tion also holds a portfolio of RMBS tranches thatare sensitive to home prices, the ranking of stresscases becomes more complicated. Inevitably, thequestion of which scenario is “worse” raises thecorresponding retort “For whom?”
This has only a little to do with whethereconomists can assign probabilities to differentscenarios. Even if the probabilities are givenexogenously and we can rely on them, determin-ing the ranking of two scenarios, in terms of theirgeneric severity, is typically possible for only thestarkest cases (e.g., a 1% increase in GDP vs. a1% decline in GDP).11 Knowing that a particularscenario has a 1 in 50 or a 1 in 25 probability ofoccurring does not usually imply a ranking of itsseverity for a particular portfolio.
Some authors explicitly recognize this. Breueret al. (2008), for example, suggest a searchapproach for identifying portfolio-specific “bad”stress scenarios in order to “be sure not to missout any harmful but plausible scenarios, whichis a serious danger when considering only stan-dard stress scenarios.” The authors assume factorreturns are elliptically distributed and then use theMahalanobis distance (between the scenario andthe “mean” economic path) as a measure of plau-sibility. Flood and Korenko (2010) propose analternative methodology, also under the assump-tion of elliptically distributed factors, but basedon an efficient grid search. While these paperspresents specific approaches to finding stress sce-narios, the difficulty in identifying “universally
stressful” scenarios has also led to more gen-eral proposals by regulators for “reverse stresstesting,” in which a firm is required to searchfor scenarios representing states of the world thatwould result in high losses on the firm’s individ-ual portfolio (FSA, 2008). We discuss this topicbriefly in Section 4.2.
To delve a bit deeper into the scenario order-ing problem, in the next subsection we decom-pose macroeconomic stress scenarios along twodimensions: (1) the number of factors includedin the stress scenario (i.e., a single factor ormore than one factor); and (2) the number of(time) periods over which the factors are pro-jected. Both of these attributes affect the abilityto order scenarios.
3.2.1 Cross-portfolio coherence of scenariosof more than one factor
In the case of a single factor, all asset behaviorsare determined by a single macroeconomic series.In this case, assets will behave differently depend-ing on their factor loadings. However, if we addanother factor (or two, three,…), the presenceof multiple factor loadings for each asset makesdetermining the severity ordering for scenariosmore involved.
For example, imagine two scenarios
A. US national home prices drop by 5%. Eachstate experiences a 5% decline.
B. US national home prices drop by 4.5%. Eachstate experiences a 4% decline but New Yorkexperiences a 25% decline.
Determining which scenario is “worse” is notstraightforward. For many portfolios, Scenario B,which involves a national home price decline ofonly 4.5% is less stressful than Scenario A, whichinvolves a 5% national home price decline. How-ever, for a New York-based banking institutionthat is heavily exposed to New York real estate,
Journal Of Investment Management Fourth Quarter 2012

The Role of Stress Testing in Credit Risk Management 73
Scenario A, with a 5% decline in national homeprices may actually be preferred to the 4.5%national decline under Scenario B, since thedecline for New York properties under ScenarioB is 25% versus only 5% under Scenario A.
3.2.2 Cross-portfolio coherence of scenariosof more than one period
The time dimension raises similar, but a bit moresubtle issues. Imagine three 10-year home pricestress scenarios12:
A. Slowdown in growth, but growth remains pos-itive: Home prices rise ½% each year over 10years.
B. Prices drop: Home prices decline by 5% over5 years (ending in year 5 at pre-decrease levelsminus 5%). After year 5, prices rise at 4.5%per year.
C. Prices drop severely: Home prices decline by25% over the first 3 years and then rise to pre-decrease levels minus 5% over the subsequent2 years. After year 5, prices rise at 4.5% peryear.
Figure 1 The impact of multiperiod stress scenarios on different loans.
These three scenarios are shown in each of thepanels of Figure 1.
Also shown are the coupon reset dates for threehomogenous portfolios of mortgages:
(1) A portfolio of 3/27 loans (loans that pay alow fixed coupon payment for the first 3 yearsand then convert to a floating coupon, with atypically higher interest payment);
(2) A portfolio of 5/25 loans (loans that pay alow fixed coupon payment for the first 5 yearsand then convert to a floating coupon, with atypically higher interest payment); and
(3) A portfolio of 7/1 loans (loans that pay a lowfixed coupon payment for the first 7 yearsand then convert to a floating coupon, with atypically higher interest payment) that resetseach year.
For simplicity, in this example, we focus on onedimension of loan performance: payment resets(and the borrower’s ability to refinance to avoidresetting to a higher monthly coupon payment).We also assume that most borrowers tend repay
Fourth Quarter 2012 Journal Of Investment Management

74 Roger M. Stein
their loans when coupon rates reset at the end ofthe fixed-rate period.13 However, it can be difficultto refinance a mortgage when the value of theproperty is less than the face value of the loan.This implies that when home prices have declinedsubstantially, the risk is highest that the borrowerwill not be able to refinance and will thus be forcedto accept higher interest payments, which, in turn,place a higher financial burden on the borrower.
When we consider the three scenarios generically,it is clear that Scenario C (prices drop severely) isworse than Scenario B (prices decline) since thepeak-to-trough home price decline is more severein Scenario C than in B, and the two are identicalafter year 5. Scenario A (slowdown in growth,
but growth remains positive) would be viewedby many as the least stressful. From the figure,though, it is obvious that the timing and levels ofhome prices affect the reset risk of each type ofmortgage differently.
From a reset risk perspective, Figure 1 showsthat given the different structure of the exposuresin each portfolio, there is no clear ordering ofworst or best scenarios. The scenario orderingsfor each portfolio are summarized in Table 2, anddiscussed in more detail in the Appendix.
From the table, it is clear that regardless of theprobability associated with a specific economicoutcome, the impact on reset risk will be high orlow depending on the structure of the loans in theportfolio being analyzed. It should also be clearthat for any scenario chosen to stress portfolios,there is another scenario that is as bad or worsefor others.
Table 2 Summary of implied reset risk on different mortgage portfolios under differentstress scenarios.
Portfolio 1 (3/27) Portfolio 2 (5/25) Portfolio 3 (7/23)
Highest reset risk in C B or C ALowest reset risk in A A B or C
In this example, we only focused on the bor-rower’s ability to avoid increases in monthlyinterest payments by prepaying. Clearly, losseson real loans and loan portfolios are governedby a host of other behaviors that interact in avariegated fashion.14 All of these can affect theordering of losses under different scenarios fora specific portfolio. The high dimensional natureof the asset behavior makes the ordering problemmore acute.
3.3 A schematic for the ease of rankingscenarios
We can generalize our discussion of scenarioranking, albeit in a stylized fashion. In Figure 2,we construct a 2 × 2 matrix that outlines thestress scenario dimensions we have been using.The x-axis defines the number of factors usedin constructing the stress scenario and the y-axisdescribes the number of periods.
Starting in the upper left, the quadrant repre-sents those assets for which, in general, wecan rank single-factor single period scenarios.15
These cases apply to assets that do not exhibit pathdependence of the sort in our mortgage example.Moving down to the lower left, if we extend thesingle period framing to a multiple period one, butremain in a single-factor world, we can now addpath dependent assets, provided they are homo-geneous in their characteristics (both within andacross portfolios).
In the upper right, we move to a multifactor world,but revert back to a single-period scenario (this
Journal Of Investment Management Fourth Quarter 2012

The Role of Stress Testing in Credit Risk Management 75
Figure 2 Schematic describing scenarios character-istics and ease of ranking.
would be analogous to “shocking” a number ofkey macro variables). In this set-up, there arerelatively few assets for which we can rank sce-narios. Those assets are characterized as beinghomogeneous and nonpath dependent. Finally,the lower right represents the richest (and mostrealistic) set of scenarios that allow for multi-ple factors and a multiperiod setting. This setuppermits the most detailed representation of assetbehavior, but at the cost of forgoing any practi-cal ability to rank scenarios in a manner that isconsistent across portfolios.
This returns us to a common mathematical mod-eling trade-off: the most stylized representationsof the world enjoy the nicest analytic regulari-ties, while the most realistic representations aremessy and inconvenient to deal with. As ourmortgage example demonstrated, it is unfortunatethat many assets about which we might be con-cerned do exhibit path dependence. Furthermore,the behaviors of many assets are driven by morethan a single factor16 and thus different portfo-lio construction strategies create different state-contingent payoffs. Duffie (2010) articulates thissuccinctly:
“Essentially any stress measurement system is subject toa financial risk management analogue of the HeisenbergUncertainty Principle, by which increasing the precision
of one’s measurement of one aspect of a system merelyincreases uncertainty regarding other dimensions of the sys-tem. …[I]f a regulator measures the exposure of a bank toa 25% change in the value of an asset, the bank could buyand sell options on the asset so as to lower this particularexposure, while raising its exposure to a 30% change in thevalue of the asset.”
In light of observations such as these, it is rea-sonable to consider how much of a difference theranking of scenarios might make. To give somesense of this, we present the results of an informalexperiment, structured as follows: we took a sin-gle (multifactor/multiperiod) scenario and, usinga set of linking functions, estimated the portfoliolosses under the scenario for a set of mortgageportfolios.17 We then simulated a full loss distri-bution for each portfolio, using the same linkingfunctions as in the scenario analysis.18 Each of thethree mortgage portfolios contained an the samenumber of mortgages (just under 20,000) whichwere drawn randomly from a large database ofover 20 million US mortgage loans).
Because we conducted a full simulation of port-folio losses, in addition to examining losses underthe stress scenario, we had access to the full lossdistribution for each portfolio. As a result, wewere able to assign a loss percentile to the stress-scenario loss for each portfolio. For example, ifunder the stress scenario, a Pool X experienceda loss of 15% of par, we would look up 15% inthe loss distribution for Pool X to determine whatpercent of losses were greater than 15%.
To simplify the presentation, we focus on evalu-ating the amount of capital required so that losseswill be no greater than L with probability 1 − α.This is commonly referred to as the “1 − α valueat risk level” or the “1 − α VaR.”
In Figure 3 we show both numerically and graph-ically the VaR levels that would be implied bythe stress scenario. It is clear from the figurethat, even under identical linking functions (the
Fourth Quarter 2012 Journal Of Investment Management

76 Roger M. Stein
0.0 0.05 0.10 0.15
040
080
0
Losses
Port A: p(loss>loss in Protracted Slump)=0.0312.~ one in 32
0.0 0.02 0.04 0.06 0.08 0.10
040
080
014
00
Losses
Port B: p(loss>loss in Protracted Slump)=0.0099.~ one in 101
0.0 0.02 0.04 0.06 0.08 0.10
040
080
014
00
Losses
Port C: p(loss>loss in Protracted Slump)=0.001.~ one in 1000
Figure 3 VaR level implied by the same scenario on different portfolios.
same linking models were used in all cases), theprobability of exhausting the capital required to“pass” a stress test using this one scenario canvary greatly. For one portfolio (i.e., Portfolio C),this capital would represent a 99.9% VaR, whilefor another (e.g., Portfolio A), it would offer a farweaker buffer, equating to only a 97% VaR. Said
differently, for the identical stress scenario, theprobability of exhausting “stress capital” in Port-folio C would be 1 in 1,000 while the probabilityof exhausting “stress capital” in PortfolioA wouldbe only 1 in about 30.19 In other experiments wecan observe examples of even higher variability(e.g., see Chinchalkar and Stein [2010], Appendix
Journal Of Investment Management Fourth Quarter 2012
The Role of Stress Testing in Credit Risk Management 77
for examples of the same stress scenario resultingin percentiles ranging from 99.99% down to 75%or 80%).
The reason for this disparity is that the scenario isboth multifactor and multiperiod in nature. Thusloans in different geographic regions and loans ofdifferent types, ages, etc. will all experience thescenario differently.
3.4 Behavior of assets in extreme economicenvironments
While it is clear that stress tests should explorestates of the economy beyond those containedin the historical record, in some cases, acknowl-edging that the macroeconomic environment canbe different and potentially worse than thoseobserved in the historical record is not sufficient.In many settings, borrower and market behaviorsalso change materially during a crisis in ways thatdo not permit simple extrapolation of the relation-ships observed during normal or even “pretty bad”times.
On its face, there is nothing new here. Introduc-tory statistics texts admonish students to carefullydistinguish between relatively simpler interpola-tion problems and more tenuous extrapolationones. However, the point is more subtle. Thereare at least two ways in which the world may bedifferent during times of stress than our linkingfunctions suggest.
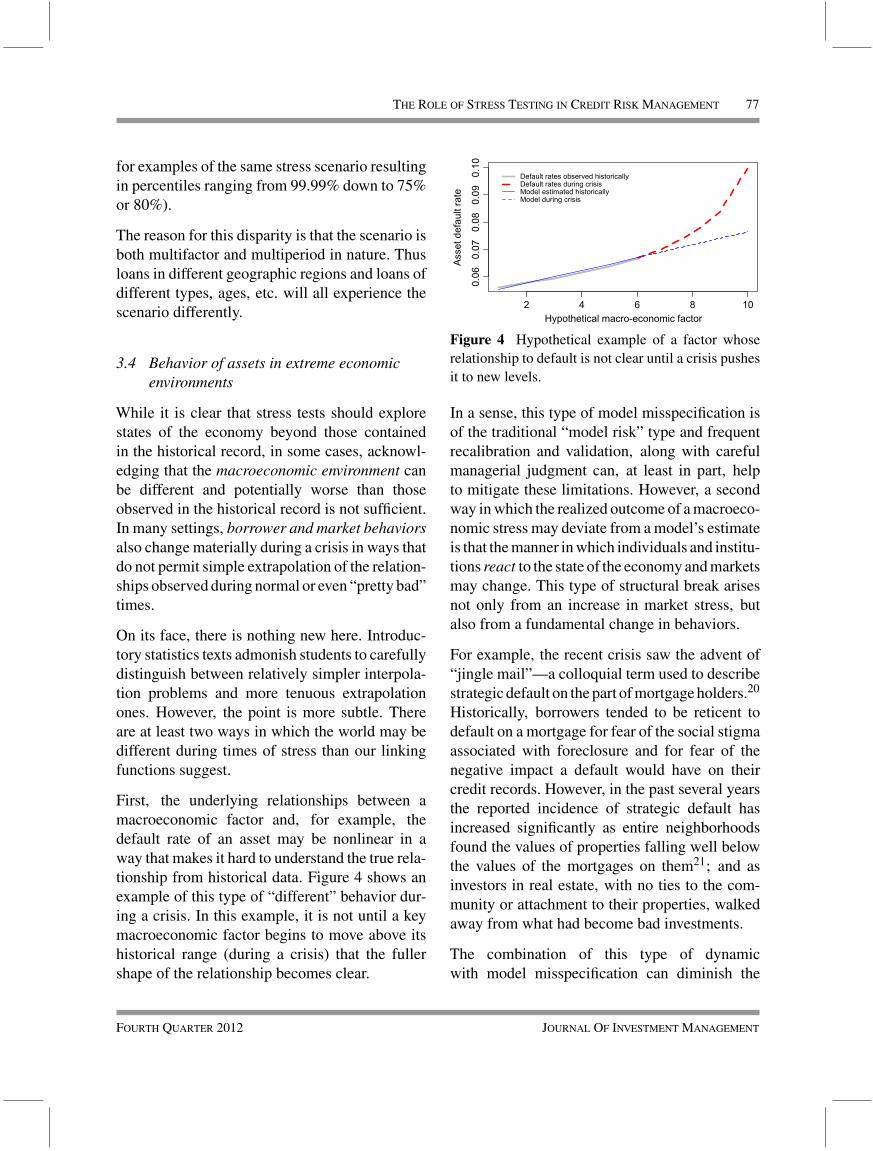
First, the underlying relationships between amacroeconomic factor and, for example, thedefault rate of an asset may be nonlinear in away that makes it hard to understand the true rela-tionship from historical data. Figure 4 shows anexample of this type of “different” behavior dur-ing a crisis. In this example, it is not until a keymacroeconomic factor begins to move above itshistorical range (during a crisis) that the fullershape of the relationship becomes clear.
2 4 6 8 10
0.06
0.07
0.08
0.09
0.10
Hypothetical macro-economic factor
Ass
et d
efau
lt ra
te
Default rates observed historicallyDefault rates during crisisModel estimated historicallyModel during crisis
Figure 4 Hypothetical example of a factor whoserelationship to default is not clear until a crisis pushesit to new levels.
In a sense, this type of model misspecification isof the traditional “model risk” type and frequentrecalibration and validation, along with carefulmanagerial judgment can, at least in part, helpto mitigate these limitations. However, a secondway in which the realized outcome of a macroeco-nomic stress may deviate from a model’s estimateis that the manner in which individuals and institu-tions react to the state of the economy and marketsmay change. This type of structural break arisesnot only from an increase in market stress, butalso from a fundamental change in behaviors.
For example, the recent crisis saw the advent of“jingle mail”—a colloquial term used to describestrategic default on the part of mortgage holders.20
Historically, borrowers tended to be reticent todefault on a mortgage for fear of the social stigmaassociated with foreclosure and for fear of thenegative impact a default would have on theircredit records. However, in the past several yearsthe reported incidence of strategic default hasincreased significantly as entire neighborhoodsfound the values of properties falling well belowthe values of the mortgages on them21; and asinvestors in real estate, with no ties to the com-munity or attachment to their properties, walkedaway from what had become bad investments.
The combination of this type of dynamicwith model misspecification can diminish the
Fourth Quarter 2012 Journal Of Investment Management

78 Roger M. Stein
effectiveness of macroeconomic stress scenariossince the links between macroeconomic environ-ments and asset behavior become less reliable inextreme settings. Based on an analysis of pre-crisis stress-testing models, Alfaro and Drehmann(2009) explicitly describe the need to accommo-date the type of change in market dynamics thatmake crisis environments different than environ-ments that are just “very bad.” They note:
“[Our] results highlight that the structural assumptionsunderlying stress-testing models do not match outputgrowth around many crises. Furthermore, unless macro con-ditions are already weak prior to the eruption of the crisis,the vast majority of stress scenarios based on historical dataare not severe enough. Last, stress-testing models are notrobust, as statistical relationships tend to break down duringcrises.”
However, this implies that, in general, the onlyapproach, ex ante, to systematically accommo-dating such structural breaks in building stress-testing models is to apply managerial judgmentand modelers’ subjective views.
In light of these types of unobservable dynam-ics, it can be informative to conduct stress-testingexercises using combinations of both reduced-form and structural approaches. For example, amacroeconomic stress scenario can be run and,at the same time, the default probabilities withinthe linking functions can be increased as well (forcertain assets or the entire portfolio) to determinehow this might impact the results of the stresstest.
Typically, this will require more than simply, forexample, doubling the losses on a portfolio, par-ticularly if path-dependent assets are included.(For example, one could also imagine decreas-ing prepayment rates, increasing LGD, adjustingrecovery times, assuming that financial guar-antees are not honored, etc.) Though such anapproach is less satisfying theoretically, it doesprovide a means to contemplate ex ante unknownstructural changes, albeit in an abstract sense.
3.5 “Plausibility” and probability
In considering probabilistic interpretations of sce-nario analysis, it is also natural to think aboutthe notion of the plausibility of a stress sce-nario. The topic of plausibility has been exploredin other literature streams in varying contexts.22
In the domain of stress testing, it is relevant inthat many definitions of a stress test require thatthe scenarios chosen be “exceptional, but plausi-ble.” Although these terms are used often, theirdefinitions are not always explicit.23
In considering stress testing, some authors (e.g.,Breuer et al., 2008) take the term to be a sta-tistical one and measure plausibility in terms ofdeviations from an “average” case. However, suchrepresentations may not capture the potential forvery different outcomes than have been observedhistorically (or than those that might be drawnfrom a candidate distribution of some sort).
An alternative view is that plausibility is moresubjective but that reasonable individuals shouldbe able to agree on whether a specific scenariois plausible or not. In this sense, plausibilityinitially involves not the analysis of the preciseprobability of a scenario occurring, but rathersimply determining that the scenario is not prac-tically impossible. Once it has been establishedthat a scenario could take place, the problemreduces again to that of assigning probabilities.The admissibility of a stress scenario as “plau-sible” may be further refined by also stipulatingthat an exceptional scenario have a sufficientlyhigh probability to be considered relevant. (Toalso be “extreme,” the probability must simi-larly be sufficiently low that it not be somethingtypically encountered in historical data or dailyobservation.)
Thus, plausibility may be thought of as a proba-bility assignment problem with the added require-ment that a (subjective) probability threshold for
Journal Of Investment Management Fourth Quarter 2012

The Role of Stress Testing in Credit Risk Management 79
plausibility also be defined. There are a numberof mechanisms one might contemplate for bothgenerating and evaluating potential “exceptional,but plausible” scenarios. However, practically, itmay be difficult to elicit useful probabilities forvery rare events, even from experts. This canbe particularly so of events with negative con-sequences (Tversky and Kahneman, 1986). Assuch, the assessment of plausibility remains chal-lenging and largely subjective for very extremescenarios.
4 Discussion of internal risk managementand regulatory applications
Despite some drawbacks as a stand-alone capi-tal allocation measure, stress testing does have avaluable role to play in credit–risk management.
In addition to providing a snapshot of the expo-sures that a firm or markets face, given a specificscenario, stress testing can provide decision mak-ers with a monitoring tool that allows them tomeasure credit risks over time, observing trendsand changes in the risk profile of those entitiesrelevant to their analysis. In this regard, stresstesting seems well suited to providing both riskmanagers and senior management with a broaddirectional view on the holdings and portfolioof their institution; it can also provide regula-tors with tools to understand the evolution ofrisk in a regulated entity or across a market overtime.
Importantly, some forms of stress testing mayalso provide a means to mitigate model riskby enabling intuitive interpretations of statesof the world that may cause a portfolio ororganization to experience high losses. Thisintuitiveness makes stress testing useful in eval-uating a model’s behavior in general, and theappropriateness of a model’s linking functionsin particular. Their intuitiveness also permitsmore transparent communications about models
and risks and thereby fosters considerations ofcredit risk as part of a firm’s broader businessstrategy.
In this section, we discuss the role of stress testingin the risk management of individual institutions’credit portfolios and strategies as well as its rolein aiding regulators in monitoring the stability ofindividual institutions and of the financial systemoverall.
4.1 The role of stress testing for internalcredit–risk management and strategicplanning at financial institutions
Stress testing provides a unique means to under-standing both risk models and the portfolios thatinstitutions analyze with them. In fact, even if riskmodels (e.g., VaR tools) were perfect (i.e., had noerror associated with their estimates), stress testswould still provide a measure of intuition that isgenerally not feasible otherwise.
The exercise of selecting factors, creating scenar-ios and evaluating the impact of those scenarioson a portfolio induces a connection to both themodels and the risks in the portfolio that is typ-ically far richer than with quantitative portfolioanalytics alone. The scenarios provide intuitivedescriptions of states of the world that might occur(but may never have been seen in the historicalrecord) and the losses associated with those states(under a linking function). This provides insightsinto both the model’s behavior and the drivers ofcredit risk for the portfolio.
It is natural to consider using the two approachesin combination. For day-to-day risk manage-ment, VaR (or ES,…) provides useful mech-anisms for sizing capital and for identifyingwhich positions contribute the most to the tail-risk of the portfolio. This also leads naturallyto the use of such measures in implementingtransfer-pricing mechanisms within a financial
Fourth Quarter 2012 Journal Of Investment Management

80 Roger M. Stein
institution. Credit transfer-pricing can be usefulas a common language across the organization foraligning the incentives of those using the institu-tion’s capital (i.e., those who create risk expo-sures through lending and trading operations)and those managing the risk of the institution.This type of transfer-pricing also naturally pro-duces warnings about dangerous concentrationsthat may be developing in the portfolio and, atthe same time, it provides disincentives to origi-nate additional exposures that contribute to thoseconcentrations.24
However, even the best designed portfolio toolscannot always contemplate states of the worldthat are very, very different, both in magni-tude and character, from those in the historicalrecord (or that are outside of the theoretical con-structs of a model). Stress testing provides abridge to permit just this analysis. It is one ofthe most direct and intuitive ways for managersto impart a judgmental overlay on routine riskmanagement.
Stress testing also provides a reality check that canhelp mitigate some types of model risk. A user canevaluate losses under a stress scenario and com-pare these to the simulated distribution of losses(e.g., as in the results shown in Figure 3). If thelosses appear much higher than under most statesof the simulation, the user can use this informa-tion to delve into the source of the differences.It may also happen that losses under what theuser considers to be a very stressful scenario donot appear high compared to those under, say,extreme outcomes in a portfolio simulation. Inthis case, again, the user can take advantage ofthis information to better understand the driversof portfolio risk. Differences between a user’sexpectation and the model’s output for a stresscase may be due to limitations of the model. Theymay also arise because of disagreements about therelative likelihood of the stress case.
To this end, recently, Rebonato (2010) has pro-posed a promising approach for developing coher-ent subjective probabilities for scenarios to beused on single portfolios. The approach relies onthe use of Bayesian networks, a form of proba-bilistic directed graph, popularized in the artificialintelligence community in the 1990s, as a meansfor collapsing and calculating conditional prob-abilities. A key feature of this approach is theability to reduce the dimensionality of conditionaldistributions through the careful application ofBayes rule. The author recommends elicitingprobability distributions from experts for collec-tions of factors that are relevant to a particularportfolio and then using these elicited scenariodistributions to form loss distributions for eachasset class.
For institutions particularly concerned about spe-cific stress scenarios, the results of a stress test canalso be used as a capital hurdle. That is, an insti-tution may elect to set capital levels based on thegreater of the stress-test results and the results of,say, VaR analysis. In this sense, having adequatecapital to pass the stress test becomes a necessary,but not sufficient condition.
Using both portfolio simulation and scenario-based approaches permits users to combine man-agerial and analytic judgment with the portfoliosimulation results in a way that is often moresatisfying and informative that either one alone.
This may be done by benchmarking losses undera stress scenario to quantiles of a loss distributiongenerated under a portfolio model, as in Figure 3.But stress testing can also provide a much richerand more flexible setting in which to ask andanswer questions. By trading off quantitativespecificity of the outcomes against the breadth ofthe scenarios examined, risk managers can exper-iment with the impact of quite different assump-tions than those they might typically consider.
Journal Of Investment Management Fourth Quarter 2012

The Role of Stress Testing in Credit Risk Management 81
Figure 5 Example combining reduced-form stress testing, structural stress testing and portfolio simulation toassess the changes in the shapes of loss distributions assuming different “mean” economic paths in the simulation.
For example, Figure 5 shows the impact of usingdifferent baseline macroeconomic paths for VaRanalysis. The figure shows the estimated loss dis-tributions for a portfolio of about 20,000 primeUS mortgages under different stress scenarios.25
The median path for the simulator used to estimatethe leftmost two loss distributions is a baselineeconomic forecast. However, the remaining lossdistributions were simulated using a macroeco-nomic simulator that was calibrated so that themedian path was a generally more severe one.In this way, structural stress scenarios are usedto inform the VaR analysis. Some of the simula-tions are also further stressed using reduced-formshocks to different processes (e.g., default orseverity) within the simulations.
While it is unclear how to interpret precisely themany distributions that one might generate in sucha setting (we have only shown a few), the insight
that this analysis provides can still be valuable.26
For example, from the figure, it is clear that inaddition to the expected movement of the meanlosses to the right as scenarios get more stressfulfor this portfolio, we also observe that the shapesof the distributions change as well.As more stress-ful scenarios are introduced, the associated lossdistributions become broader, suggesting moreuncertainty, while also exhibiting less skewness(and actually reversing skewness at one point).
Finally, as an institution’s senior managementdevelops its business strategy, stress testing canserve as a mechanism to bring to bear insightsabout the impact of various strategic options onthe risk profile of the firm. Conversely, it canserve to highlight risk management challenges forwhich strategic solutions are sought. Often, finan-cial institutions relegate considerations of riskmanagement to a compliance-based review of afinal strategy rather than involving risk managers
Fourth Quarter 2012 Journal Of Investment Management
82 Roger M. Stein
at the outset as part of the process of developingthe strategy itself. Discussion of stress scenariosand stress tests can be useful in strategy develop-ment as these discussions may motivate managersto alter business plans in order to build moresustainable franchises, so too can discussions oftrends in stress test results over time.
Even in cases in which an organization may haveless confidence in the robustness of a specific link-ing model (particularly when applied to extremeeconomic outcomes), stress test results can beused to inform a financial institution’s manage-ment about on trends in their credit risk exposure.For example, by forming a time series of stresstest results, a management team may gain at leastdirectional insight as to whether their franchisesmay be becoming more or less risky over time.27
In addition to exploring the impact on the state of aportfolio (or the whole firm) of a macroeconomicstress scenario, stress testing at the strategic levelmay involve exploring the reaction of a firm toa stress event as well. For example, consider themost extreme version of a reduced form stress sce-nario. This type of test is perhaps better termed a“thought experiment” or “war game.” The sce-nario might take the form of an open-endedquestion such as28:
“The firm has just lost 10% of its capital, and most ofour competitors have also lost between 5% and 20% oftheir capital. Hedge funds are suffering withdrawals andare pulling positions back from their prime brokers. Howdo you respond?”
By forcing managers to think through this typeof scenario, stress testing aids senior managersin understanding the implications of key strate-gic decisions. It can also highlight weaknessesin business strategies that make tacit assump-tions about how markets function or about theflexibility with which the firm can operate inthem. The observations from such stress tests caneventually form the basis for fail-safe plans that
better prepare an organization for future economicshocks.
4.2 The role of stress testing in regulatorymonitoring and systemic credit riskanalysis
It is useful to consider what our observations onstress testing imply from a regulatory and sys-temic risk measurement perspective. Here wefocus in particular on the macroprudential (sys-temic) perspective, since much of the precedingdiscussion on internal risk management and strat-egy also applies to regulatory uses of stresstesting for the microprudential (individual firm)perspective.
4.2.1 Microprudential applications
Before leaving the discussion of microprudentialstress testing, it is useful to reiterate the difficultyof defining one or a few scenarios for use acrossmany portfolios and institutions. The discussionin Section 3.2 suggests that stress scenarios mayneed to be tailored to individual institutions ifthe goal is to determine the robustness of theinstitutions themselves to financial shocks. Saiddifferently, each financial institution will likelyhave a different set of scenarios that constitutethe worst outcomes for their specific portfolios.Thus, it is not likely that one set of scenarios willbe equally relevant (in a credit risk sense) to allfinancial institutions even if the institutions are ofsimilar size and operate in similar markets.
For regulators, the challenge may be to developscenarios that are rigorous enough to provide con-fidence in an institution’s resilience, given therisks to which that institution is exposed, but thatat the same time do not favor or disadvantage anyone institution. Reverse stress testing may pro-vide a partial solution, as might the assignment ofsubjective probabilities, by regulators, to a larger
Journal Of Investment Management Fourth Quarter 2012

The Role of Stress Testing in Credit Risk Management 83
set of stress scenarios as a first approximation toensuring that the (different) scenarios used at dif-ferent institutions have approximately the same(subjective) probabilities.
The use of subjective probabilities for a broad setof factor outcomes has the potential to result ina large set of factors and a correspondingly largenumber of probability assignments. However, byusing, for example, the approach described in(Rebonato, 2010), the dimensions of the probabil-ity space may be reduced considerably. Nonethe-less, this approach explicitly requires that stresstesters enumerate “all relevant factors” for a port-folio, which, in many realistic settings may be isa difficult task (e.g., see Footnote 10). Also, byconstruction, applying this approach across port-folios would require a large enough number offactors to sufficiently blanket all portfolios.
Reverse stress testing offers an alternative, model-driven approach. However, there may be trade-offs here as well. On the one hand, samplingof macroeconomic states in search of the partic-ularly severe ones can provide macroeconomicstress scenarios that are customized for an individ-ual portfolio; examining these bespoke scenarioscan provide new insights into regions of fragilityin the portfolio. On the other hand, performingsuch a search using more complex macro eco-nomic models can produce results that becomedecoupled from intuition, reducing the search to aless informative statistical exercise. In this sense,the stress test may actually introduce model riskrather than help mitigate it.
4.2.2 Macroprudential applications
From the macroprudential perspective, the objec-tives are different than those that focus on individ-ual banks. While it is clearly regrettable when anyinstitution fails, macroprudential stress tests aremost concerned with the failure of one or more ofthe key links in the financial system since failures
of such institutions may cascade through the sys-tem, spreading financial distress. To this end, thegoals of stress tests for systemic risk may be lessambitious from a precision perspective than inthe microprudential case, even as the implemen-tation of the systemic stress tests becomes morecomplex.
Given the large number of institutions poten-tially involved in such a systemic stress test,the scenarios, by necessity, must be standard-ized across institutions at the expense of analyticdetail.29 For example, Duffie (2010) has proposedan approach30 that both holds great promise andappears to be gaining wide acceptance due toits practical feasibility. Under this approach, aregulator requires the most significant N finan-cial institutions to report their exposure to theirlargest K counterparties under each of M stressscenarios, where N, K and M are not too large(e.g., O(10)).Under this method, to ensure thatasset-specific scenarios could be run, the institu-tions would choose the K counterparties stress-scenario by stress-scenario. Once the results ofeach scenario had been computed by each insti-tution, the regulator would then aggregate theseresults, scenario-wise, to permit the regulator toget a snapshot of the state of the financial sys-tem “one tick after” the scenario takes place. Themethod is a general one that could be applied tostress testing many forms of risk.
An important feature of (Duffie, 2010) is therecursive nature of the method. Conceptually, ifa regulator observes that a nonreporting counter-party appears to represent a large exposure for oneor more of the reporting entities, the nonreport-ing entity would then be asked to similarly reportstress test results for its own exposures (thus effec-tively becoming a significant entity itself, therebyresulting in N + 1 reporting entities).
Almost certainly, systemic monitoring willrequire some form of network analysis as well.
Fourth Quarter 2012 Journal Of Investment Management

84 Roger M. Stein
Given the number of entities reporting and themyriad of counterparty relationships that natu-rally emerge as a result, a network representationis a natural one. This also affords regulators yetanother means to combine both reduced-form andstructural approaches to stress testing.
For example, having reviewed the results of testsunder an initial stress scenario, a regulator mayidentify a specific hedge fund as a systemicallyimportant counterparty in the banking system.A reasonable next stress test might be to askfirms to report their hypothetical losses shouldthat fund default for any reason under the same(or different) macroeconomic conditions. Suchexposures can be determined readily in a net-work setting. Figure 6 shows an example of one
Figure 6 Example of network representation of stress test.
such hypothetical stress test from the networkperspective. In this hypothetical example, the(nonreporting) hedge fund “Hedge Fund A” is ofinterest systemically, given the large volume ofexposures for which it is a counterparty.31
Finally, it is worth noting that the high-dimensional nature of financial markets and theinteractions of the instruments, individuals andinstitutions that make them up imply that it isunlikely that the source of some future financialcrisis will be exactly the same as, or even verysimilar to, the scenarios that were examined dur-ing a stress-testing exercise.32 Some detractorshighlight this as a reason to forgo stress testingentirely. There is an alternative view, however,that argues that even if a future crisis is caused by
Journal Of Investment Management Fourth Quarter 2012

The Role of Stress Testing in Credit Risk Management 85
such a very different event, stress testing is stillvaluable in that, for the scenarios for which stresstesting was done, the tests provided a measureprotection against just those sorts of events, whichis still better than not examining any stress scenar-ios at all.33 Furthermore, the very act of preparingfor and performing stress tests, provides the par-ticipants with training on how to think about direscenarios.
5 Conclusions
The recent increased interest in stress testingamong academics, regulators and practitionershas led to much new discussion of the topic.While there has been a sizeable increase in thevolume of published research describing stress-testing approaches, there has been relatively littlein the way of corresponding work on theory. Thispaper does little to change that trend. However,the intent has been to provide some basis for riskmanagers and regulators to think about the appro-priate use of credit stress-testing exercises in thecontext of their broader activities.
Stress testing provides users with a rich paletteto explore the impacts of changes in the state ofthe world on the financial performance of portfo-lios, institutions and the broader financial system.However, often, stress scenarios are drawn fromthe realm beyond historical data and the modelsestimated on it. This inherently requires that judg-ment be applied in the construction of scenarios,the evaluation of the probabilities of the scenarios,the linking of scenarios to losses and the analysisof the results of the stress tests themselves.
This is not necessarily a bad thing.
The exercise of constructing stress tests requiresthat the parties to the test engage in active dis-cussion and analysis of all aspects of the stressscenarios, the models that translate them into port-folio or institutional losses and the interpretation
of the results. As a qualitative component of arisk-management program, stress testing and sce-nario analysis provide an important complementto quantitative risk-management approaches. Theaccessible, intuitive nature a stress scenario andthe resulting stress test result also provide a bridgebetween discussions of credit risk and discussionsof strategy that senior management can use toevaluate the impact of different business optionson their firm’s risk appetite.
It is also reasonable to expect that the increasedapplication of stress testing—both by institu-tions as part of a risk-management program andby regulators as a means to understanding thefragility of a single institution or the broaderfinancial system—will lead to improvements ininformation technology, data quality and datainfrastructure. These improvements will havebenefits that extend beyond transparency and riskmanagement.
Acknowledgments
I am grateful to Jeff Bohn, Ashish Das, DarrellDuffie, Mark Flood, Joe Langsam and an anony-mous referee for detailed comments on earlierdrafts of this paper. I had useful conversations ona number of the topics in this paper with RichardCantor, Shirish Chinchalkar, Francis Gross, JuanLicari, Yaacov Mutnikas, and Mark Zandi. Allerrors are, of course, my own.
Appendix
Details of scenario orderings from examplein Section 3.2.1
Recall that three 10-year home price stress sce-narios in this example, are defined as follows:
A. Slowdown in growth, but growth remains pos-itive: Home prices rise ½% each year over 10years.
Fourth Quarter 2012 Journal Of Investment Management

86 Roger M. Stein
B. Prices drop: Home prices decline by 5% over5 years (ending in year 5 at pre-decrease levelsminus 5%). After year 5, prices rise at 4.5%per year.
C. Prices drop severely: Home prices decline by25% over the first 3 years and then rise topre-decrease levels minus 5% over the sub-sequent 2 years. After year 5, prices rise at4.5% per year.
We also assume three homogenous portfolios ofmortgages are defined as follows:
(1) A portfolio of 3/27 loans (loans that pay alow fixed coupon payment for the first 3 yearsand then convert to a floating coupon, with atypically higher interest payment).
(2) A portfolio of 5/25 loans (loans that pay alow fixed coupon payment for the first 5 yearsand then convert to a floating coupon, with atypically higher interest payment);
(3) A portfolio of 7/1 loans (loans that pay a lowfixed coupon payment for the first 7 years andthen convert to a floating coupon, with a typi-cally higher interest payment) that resets eachyear.
Consider now how each scenario affects Portfo-lio 1 (3/27 loans) and Portfolio 2 (5/25 loans).For both portfolios, Scenario A is the least dis-ruptive from a refinancing perspective. As thecoupon reset approaches, loans in both portfolioshave realized positive equity growth and (assum-ing refinancing makes sense from an interestrate environment standpoint) positive equity willallow them to refinance in order to avoid increasedcoupon payments.
The other scenarios are less clear:
• For Portfolio 1 (3/27 loans), scenario C (pricesdrop severely) is far more challenging than Sce-nario B (prices drop) and refinance risk will behigher under C than B. This is true because
at the very time the interest payments on themortgage are due to reset to a higher rate inyear 3, the borrower has experienced substan-tial declines in the value of home equity. Homeprices have dropped 25% since origination andfor many borrowers, their mortgages will be“underwater.” Thus, even though they wouldlike to refinance, they may not be able to, due tothe negative equity. This is shown in the upperleft panel of Figure 1.In contrast, under Scenario B (prices drop)these same borrowers will have experienceda much smaller decrease in equity, makingrefinancing still sensible in many cases. Forthese borrowers, the sharp increase in couponpayments will be avoided.
• For Portfolio 2 (5/25 loans), both Scenario Band Scenario C affect losses similarly. This isbecause by the time the loans reset in year 5,home prices are the same level under both sce-narios and they then move identically in bothcases. This is shown in the upper right panel ofFigure 1.
Now consider how the three scenarios affect Port-folio 3 (7/1 loans, shown in the lower left panel ofFigure 1). In this case, either one of the “bad”scenarios (Scenario B or C) is slightly prefer-able to Scenario A (slowdown in growth, butgrowth remains positive). To see why considerthat when the loans in the portfolio are due forrate resets in year 7, the home prices under Sce-narios B and C will have experienced continuedgrowth at 4.5% per year, which, starting froma 5% decline in year 5, puts the home prices atabout 3.75% over the initial value. In contrast,under Scenario A, the 10 year growth has been abit slower with 7 years of 0.5% growth resultingprices levels of about 3.5%. Thus, under ScenarioA, the loans in Portfolio 3 will have experienceda bit less home price appreciation than underB or C.
Journal Of Investment Management Fourth Quarter 2012

The Role of Stress Testing in Credit Risk Management 87
Figure 1 The impact of multiperiod stress scenarios on different loans.
Figure 1, reproduced below, shows these relation-ships.
Notes1 Note that when we refer to VaR, we are not referring to
single-factor copula type models or percentiles of his-torical data, but rather to more sophisticated models thatcapture more fully the structure of individual assets andheterogeneous portfolios.
2 Interestingly, Alfaro and Drehmann (2009) report on astudy of stress tests done prior to the Crisis of 2007–9and conclude that most stress tests were not adequate,since the majority did not raise any red flags with respectto banking system fragility.
3 While we do not discuss it here, the alignment ofincentives must naturally be addressed in any robustrisk management program. Transparency and intuition,while useful in providing managers with insight intomodel behavior and usage, cannot prevent individualsfrom acting against the long-run interests of an insti-tution. However, by increasing intuition for the risksbeing addressed in a particular scenario, stress-testingexercises make some of the assumptions underlying riskassessments more concrete and thus make the analy-ses themselves more accessible to both technical andnon-technical managerial oversight.
4 Berkowitz (2000) uses the term pricing function todescribe a similar concept, though primarily in a mar-ket risk setting. We prefer the term linking function bothfor its statistical connotations and for its generality to abroad variety of asset behaviors (e.g., default likelihood,cashflow generation, prepayment likelihood, etc.) aswell as to other more general cases such as the impactof an event on the revenue of a business segment.
5 The author implicitly assumes that the composition offirms (with respect to factor sensitivities) remains con-stant and also that behavior in the stressed economicenvironment is a direct extrapolation from the unstressedbehavior (the author alludes to this in Footnote 23 of thearticle).
6 Note that Lopez (2005) terms these tests, scenario andsensitivity tests, respectively. Other authors use the termsensitivity to refer to any perturbing of key risk modelparameters for purposes of better understanding themodel.
7 Note also that in some practical settings, regardlessof how the stressed state of the assets is determined(through structural or reduced-form scenarios) it maybe necessary to further translate the stressed state of theassets an ultimate portfolio loss through the use of someportfolio tool. This translation might be the case for aninstitution using a software tool that takes as input theasset state (e.g., PDs or CDR curves), and then translatesthese into losses through the application of functions
Fourth Quarter 2012 Journal Of Investment Management

88 Roger M. Stein
to calculate cash flows or lost interest under suchscenarios.
8 Mathematically, we might write that the probability ofan event e being worst than a particular event Ei, p
ci , is
not equivalent to the probability of a loss l being worsethan the loss. Li under event Ei, p
li : p(e ≺ Ei) = pc
i �=pl
i = p(l > Li).9 For example, there are 50 states in the United States.
Using the NAR index of median home prices, the changein State-level median home prices between 2005Q1and 2010Q4 varied substantially from state to state,from a maximum decline of −57% (NV) to a 4% netincrease (OK). Interestingly, the paths of the changeswere also quite different, with some States hitting theirlowest values in 2006Q1 and others still in decline asof 2010Q4. Clearly, assuming the national level homeprice change of −26% with a low in 2009Q2 wouldseverely understate declines in some regions while over-stating it in others. Depending on the exposures of aparticular portfolio, this would make the losses more orless extreme.
10 If the number of factors in a scenario is small and thenumber of factor-states is similarly constrained, it isfeasible, under the assumption that the factors fully spanthe space of all portfolio behaviors, to map out a fullerdistribution of economic factors in a Bayesian contextas in Rebonato (2010). However, even in this setting,the distribution will not necessarily order the scenarioswith respect to the severity losses for a given portfolio.
11 Even here, it is easy to construct cases in which the sever-ity of two simple scenarios is reversed for two portfolios.A trivial way to accomplish this is to create two port-folios on identical assets and to reverse the direction ofthe position (long or short) in the second portfolio forevery asset in the first portfolio.
12 This example is based on one given in (Chinchalkar andStein, 2010).
13 This is consistent with data on loan prepayments, whichtypically exhibit a major spike around the time of therate reset. However, empirically, after month 12, there isoften also a much more modest increase in prepaymentsas borrowers with lower FICO scores take advantageof their newly established track record of mortgagepayments to re-negotiate.
14 For example, the default probability of a 5/25 mortgagewith a 70% LTV is clearly affected by a 25% decline inhome prices differently than a mortgage with an LTV of85%. After the decline, the borrower on the 70% LTVloan still retains approximately 5% equity in the home,
while the borrower on the 85% LTV home is underwaterwith significant negative borrower’s equity of approx-imately −10%. This difference materially affects theborrower’s propensity to default, as do numerous otherloan and borrower-attributes.
15 Here again, we assume strictly long-only or short-onlyportfolios.
16 Extending the mortgage example a bit more demon-strates this point. Mortgage defaults can be driven notonly by home-price changes, but also by the levels andchanges of unemployment and interest rates.
17 The scenario, provided by Moody’s Economy.com, wasa severe downturn stress case. It contained national-levelinterest rates and home price and unemployment seriesforecasts for several hundred local regions.
18 The models use macro-economic simulation to generateloss distributions and are described more fully in (Steinet al., 2010).
19 We also estimated 95% bootstrap confidence boundson the estimates as (0.0278, 0.0346), (0.0079, 0.0118)and (0.0003, 0.0016), respectively, suggesting that theobserved differences are reasonably robust.
20 The “jingle” refers to the notion that defaulting borrow-ers would simply drop the keys to a property into anenvelope and mail them to the lender before walkingaway from their mortgage.
21 A recent study (Guiso et al., 2009) provides an analysisof survey respondents’ reported willingness to defaulton a mortgage, should it be economically sensibleto do so. The authors find that “the most importantvariables in predicting the likelihood of a strategicdefault are moral and social considerations. Social con-siderations are directly affected by the frequency offoreclosures (in the same zip code) and the probabilitythat somebody knows somebody else who strategicallydefaulted.”
22 The notion of plausibility was particularly actively dis-cussed in the Artificial Intelligence community. Forearly examples, see Nilsson (1986) or Collins andMichalski (1989) for logical frameworks for calculatingplausibility; or Shafer (1976) for an approach to calcu-lating plausibility as an upper bound on probability inevidential reasoning.
23 I am indebted to Mark Flood for suggesting that thistopic be included in this paper and for useful discussionson the topic.
24 See Bohn and Stein (2011) for a discussion of transferpricing as a link between managing the risk of a creditportfolio and the risk of a financial services franchise.
Journal Of Investment Management Fourth Quarter 2012

The Role of Stress Testing in Credit Risk Management 89
25 The macro-economic scenarios used in this examplewere provided by Moody’s Economy.com and the var-ious loss distributions were generated using MortgagePortfolio Analyzer.
26 Berkowitz (2000) provides an approach to combiningstressed distributions with a non-stressed distributionsubject to an assumed scenario probability. This can begeneralized to multiple stress scenarios, provided prob-abilities were known for each of the stress scenarios.However, this implicitly assumes that the universe of allstress scenarios is enumerated, which will typically bechallenging. (Not explicitly including a particular stressscenario implies assigning a zero probability to it.)
27 Because the usefulness of such indicators depends heav-ily on the quality and characteristics of the linkingfunctions, such analyses may best be considered warn-ing flags, rather that being viewed the sole means forperforming such analysis.
28 I am grateful to Joe Langsam for this example.29 This may be more a statement about the current state of
data infrastructure and availability in financial institu-tions than an immutable tenant. With appropriate datainfrastructure, standards and ontology, in principle itwould be possible to run much more detailed scenarios.There have been proposals that move in the directionof more common and standardized data infrastructure(Flood, 2009; Gross, 2010), though implementations ofthese may take some time.
30 The approach was actually originally presented infor-mally in 2007.
31 For examples of applying network analysis using onlypublicly available data, see (Billio, Getmansky, Lo andPelizzon, 2010).
32 Indeed, in hindsight, it is interesting to note that over85% of the banks reporting in a pre-crisis survey didnot indicate that they performed residential real-estate-specific stress tests (Committee on the Global FinancialSystem, 2005).
33 Darrell Duffie first brought this observation to myattention.
References
Alfaro, R. and Drehmann, M. (2009, December). “Macrostress tests and crises: what can we learn?” BIS QuarterlyReview.
Basurto, M. A. and Padilla, P. (2006). Portfolio CreditRisk and Macroeconomic Shocks: Applications to Stress
Testing Under Data-Restricted Environments. Interna-tional Monetary Fund, Monetary and Capital MarketsDepartment. International Monetary Fund.
Berkowitz, J. (2000). “A Coherent Framework for Stress-testing.” Journal of Risk 2, 1–11.
Billo, M., Getmansky, M., Lo, A. W. and Pelizzon, L.(2010). “Measuring Systemic Risk in the Finance andInsurance Sectors”, MIT Sloan School Working Paper4774-10.
Bohn, J. R. and Stein, R. M. (2009). Active Credit PortfolioManagement in Practice. Hobokken, NJ: Wiley.
Bohn, J. R. and Stein, R. M. (2011). Some Observa-tions on Improving a Bank’s Share Value with CreditPortfolio Management, Credit-Transfer Pricing andStress Testing. New York, NY. URL: available atwww.moodysresearchlabs.com
Breuer, T., Jandacka, M., Rheinberger, K., and Summer, M.(2008). “Macro Stress and Worst Case Analysis of LoanPortfolios.” Working Paper, Research Centre PPE.
Chinchalkar, S. and Stein, R. M. (2010). A Comparissonof Loan-Level and Pool-Level Mortgage Analysis. NewYork, NY: Moody’s Research Labs.
Collins, A. and Michalski, R. (1989). “The Logic of Plau-sible Reasoning: A Core Theory.” Cognitive Science 13,1–49.
Committee on the Global Financial System. (2005). StressTesting at Major Financial Institutions: Survey Resultsand Practice. Bank for International Settlements, Com-mittee on the Global Financial System. Bank for Interna-tional Settlements.
Drehmann, M. (2008). Stress tests: objectives, challengesand modelling choices. Riksbank Economic Review(June).
Duffie, D. (2010). Systemic Risk Exposures: A 10-by-10-by-10 Approach. Graduate School of Business, StanfordUniversity.
Flood, M. D. and Korenko, G. G. (2010). Systemic ScenarioSelection: A Methodology for Selecting a RepresentativeGrid of Shock Scenarios from a Multivariaiate EllipticalDistribution. Washington, DC: Federal Housing FinanceAgency.
Flood, M. (2009). “Embracing Change: Financial Infor-matics and Risk Analytics.” Quantitative Finanace 9(3),243–256.
Financial Services Authority. (2008). “Stress and Sce-nario Testing.” Consultation Paper, Financial ServicesAuthority, London.
Gross, F. (2010 15-16-December). InternationalReference Data Utility: a necessary infrastructure for
Fourth Quarter 2012 Journal Of Investment Management

90 Roger M. Stein
measuring systemic risk. Presentation at the Measur-ing Systemic Risk Conference—The Milton FriedmanInstitute. Chicago. URL: http://mfi.uchicago.edu/events/20101215_systemicrisk/ppts/12.16.2010_FGross.ppt
Guiso, L., Sapienza, P., and Zingales, L. (2009). Moraland Social Constraints to Strategic Default on Mortgages.European University Institute.
Howard, S. (2008). Stress Testing with Incomplete Data: APractical Guide. IFC Bulletin, IFC.
Lopez, J. A. (2005). “Stress Tests: Useful Complements toFinancial Risk Models.” FRBSF Economic Letter (No.2005-14).
Nilsson, N. J. (1986). “Probabilistic logic.” ArtificialIntelligence 28(1), 71–87.
Otani, A., Shiratsuka, S., Tsurui, R., and Yamadaa, T.(2009). Macro Stress-Testing on the Loan Portfolio ofJapanese Banks. Bank of Japan, Financial Systems andBank Examination Department.
Rebonato, R. (2010). Coherent Stress Testing: A BayesianApproach to the Analysis of Financial Stress. West Sussex,UK: John Wiley & Sons, Ltd.
Rösch, D. and Scheule, H. (2007). “Stress-Testing CreditRisk Parameters—An Application to Retail Loan Portfo-lios.” Working Paper.
Shafer, G. (1976). A Mathematical Theory of Evidence.Princeton: Princeton University Press.
Stein, R. M., Das, A., Ding, Y., and Chinchalkar, S. (2010).Moody’s Mortgage Metrics Prime: A Quasi-StructuralModel of Prime Mortgage Portfolio Losses. New York,NY: Moody’s Research Labs.
Tversky, A. and Kahneman, D. (1986). “Rational Choiceand the Framing of Decisions.” The Journal of Business54(1), S251–S278.
Virolainen, K. (2004). Macro Stress Testing with a Macroe-conomic Credit Risk Model for Finland. Bank of Finland,Research Department.
Zandi, M. and Blinder, A. (2010). How the Great Reces-sion was Brought to an End. West Chester, PA: Moody’sAnalytics.
Keywords: Stress testing, scenario analysis, port-folio analysis, systemic risk, model risk, VaR,macroeconomic analysis, credit risk
Journal Of Investment Management Fourth Quarter 2012