Embed Size (px)
Citation preview
1
The role of TXNIP in the hepatic
glucose homeostasis
Seong Ho Jo
Department of Medical Science
The Graduate School, Yonsei University

2
The role of TXNIP in the hepatic
glucose homeostasis
Directed by Professor Yong Ho Ahn
The Doctoral Dissertation submitted to
the Department of Medical Science
the Graduate School of Yonsei University
in partial fulfillment of the requirements
for the degree of Doctor of Philosophy
Seong Ho Jo
June 2014

3

4
ACKNOWLEDGEMENTS
제 인생에서 새로운 시작인 학위 논문을 마무리하게 되었습니다. 실험실
생활을 하며 교수님들과 선후배 및 동료들에게 정말 많은 도움을
받았습니다. 이 논문을 마무리하는데 도움을 주신 모든 분들께 감사인사를
드립니다.
먼저, 부족한 저를 제자로 받아주시고 넓은 아량으로 기다려주시고
지도해주신 저의 멘토 안용호 교수님께 진심으로 감사와 존경의 마음을
전합니다. 앞으로도 교수님의 존함에 누가되지 않게 열정을 가지고 열심히
하겠습니다. 그리고 이 논문을 완성하는데 많은 도움을 주시고 조언을
해주신 이은직 교수님, 김재우 교수님, 윤호근 교수님 그리고 강신애
교수님께 진심으로 감사 드립니다. 또한 생화학 교실에서 많은 조언과
관심을 보내주신 김경섭 교수님, 김건홍 교수님, 허만욱 교수님, 박상욱
교수님 그리고 전경희 교수님께 감사 드립니다.
또한 학위과정 중 많은 도움을 주고 격려를 보내준 가장 중요한
생화학분자생물학 선후배 및 동료들에게 고마움을 전합니다. 이 논문이
나오는데 가장 많은 도움을 주신 우리 팀, 김미영 선생님, 김태현 선생님
그리고 주만에게 고마움을 전합니다. 그리고 제게 큰 도움을 주신 김하일
선생님, 차지영 선생님, 임승순 선생님 그리고 윤미진 선생님께 감사
드립니다. 또한 교실에서 생활하면서 정신적으로 많은 도움을 준 친구 수연,
희은 그리고 김효정 선생님께 진심으로 고마움을 전하고 싶고 고은진
선생님, 양경미 선생님, 효경누나, 재성, 승현, 혜정, 은정, 혜리, 미선,

5
부남이형, 민경, 동인, 재현, 민영, 해민, 최경화 선생님, 수빈, 한슬, 찬주,
동국, 현숙, 나래, 현진, 유정환 선생님, 윤정, 석준, 승원, 윤희, 정환, 현우,
혁구, 선혁, 혜영, 예슬, 이세정 선생님, 전은지 선생님 그리고 권석철
선생님께 고마움을 전하며 현재 생화학 교실은 아니지만 제게 많은 도움을
준 배진식 선생님, 정윤이형, 유정누나, 혜련, 아름, 미희, 은주, 혜인, 은정,
선영, 혜지, 아라, 그리고 정윤승 선생님께 고마움을 전합니다. 또한 저의
든든한 친구들인 부준, 병익, 영준, 헌 그리고 은영에게 고마움을 전합니다.
제가 힘들 때 중간에 포기하지 않고 의과학을 계속 할 수 있게 많은
도움을 주시고 배려해주신 저의 또 다른 멘토 배외식 교수님께 감사 드리며
같은 분야에서 계속적인 연구를 할 수 있게 정말 큰 도움을 준 대학후배
하영이와 선영이에게 고마움을 전합니다.
마지막으로 제가 학위과정을 마치고 논문을 마무리하는데 가장 큰 힘이
되고 든든한 지원군이 된 우리 가족에게 진심으로 고마움을 전합니다. 저를
믿어준 가족이 있었기에 제가 학위를 마무리 할 수 있었던 것 같습니다.
항상 저를 믿어주시고 지원해주신 부모님, 공부하는 동생을 위해 많은
이해를 해준 누나와 매형에게 감사의 마음을 전하고 저를 배려해주신
장인어른과 장모님, 그리고 처형에게 감사의 마음을 전합니다. 제게 가장 큰
힘과 지원을 해준 나의 아내 영지에게 너무 고맙고 많이 놀아주지도 못한
사랑하는 딸 은아에게 고마움과 사랑을 전합니다.
2014년 6월, 논문을 마무리하며 모든 분께 감사의 마음을 전합니다.
감사합니다.
조 성 호

6
TABLE OF CONTENTS
ABSTRACT ········································································ 1
I. INTRODUCTION ······························································· 4
II. MATERIALS AND METHODS ············································ 8
1. Cell culture and reagents ················································· 8
2. Animals ····································································· 8
3. Adenoviral production and Tail Vein Injection ······················· 9
4. Glucose tolerance test (GTT), insulin tolerance test (ITT), and
pyruvate tolerance test (PTT)············································ 10
5. Metabolites measurement ················································ 10
6. Quantitative real time PCR ·············································· 11
7. Western blot analysis ····················································· 14
8. Plasmids ···································································· 14
9. Transient transfection and luciferase assays ·························· 17
10. Small-interfering RNAs ················································ 17
11. Immunoprecipitation (IP) ·············································· 18

7
12. Chromatin immunoprecipitation (ChIP) assay ······················ 19
13. Statistical analysis ······················································· 20
III. RESULTS ······································································ 21
1. TXNIP is upregulated in fasting, STZ-diabetic and db/db mice
liver ·········································································· 21
2. Ad-Txnip administration impairs glucose, insulin, and pyruvate
tolerance in normal mice ················································· 24
3. The effect of Ad-Txnip on the expression of genes involved in
glucose metabolism in the livers of normal mice ····················· 27
4. Transduction of Ad-Txnip upregulates G6pc expression in
primary hepatocytes ······················································ 34
5. G6PC expression was increased by TXNIP ··························· 38
6. SHP negatively modulates transcriptional activities of TXNIP
through direct interaction ················································ 41
7. TFE3 downregulates Txnip expression in STZ-diabetic and db/db
mice ········································································· 45
8. TFE3 and ChREBP regulate the activity of the Txnip promoter in
a reciprocal manner ······················································· 47

8
IV. DISCUSSION ································································· 54
V. CONCLUSION ································································· 60
REFERENCES ····································································· 61
ABSTRACT (IN KOREAN) ····················································· 69

9
LIST OF FIGURES
Figure 1. TXNIP is upregulated in the livers of STZ-induced
diabetic and db/db mice ··································· 23
Figure 2. Ad-Txnip administration impairs glucose, insulin,
and pyruvate tolerance in normal mice ·················· 26
Figure 3. Effect of Ad-Txnip on the expression of the genes
involved in glucose metabolism in the liver of normal
mice ·························································· 30
Figure 4. Effect of Ad-Txnip on lipogenic gene expression in
the liver ······················································ 32
Figure 5. Transduction of Ad-Txnip upregulates G6pc
expression in primary cultured hepatocytes ············ 37
Figure 6. Glucagon potentiates TXNIP-mediated G6PC
expression ··················································· 39
Figure 7. TXNIP negatively modulates transcriptional activity
of SHP through direct interaction ························ 43
Figure 8. TFE3 downregulates Txnip expression in STZ-
diabetic and db/db mice ··································· 46
10
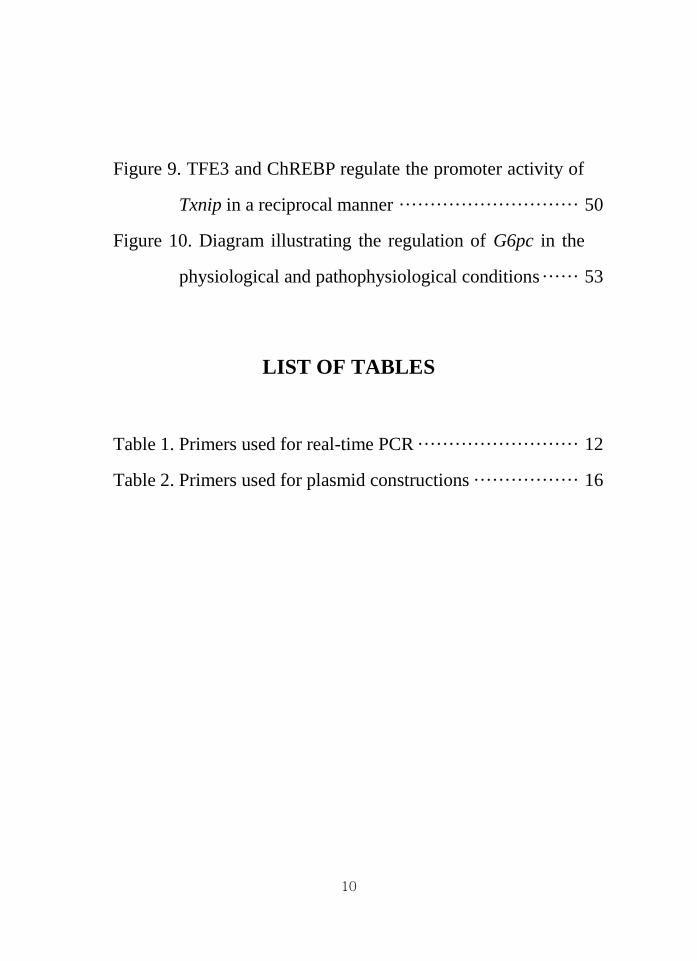
Figure 9. TFE3 and ChREBP regulate the promoter activity of
Txnip in a reciprocal manner ····························· 50
Figure 10. Diagram illustrating the regulation of G6pc in the
physiological and pathophysiological conditions ······ 53
LIST OF TABLES
Table 1. Primers used for real-time PCR ·························· 12
Table 2. Primers used for plasmid constructions ················· 16

11
Abstract
The role of TXNIP in the hepatic glucose homeostasis
Seong Ho Jo
Department of Medical Science
The Graduate School, Yonsei University
(Directed by Professor Yong Ho Ahn)
Thioredoxin interacting protein (TXNIP) has multiple functions in several
pathways involved in the reactive oxygen species (ROS) generation, apoptosis,
inflammation and glucose metabolism. TXNIP is upregulated in the
hyperglycemic state and represses glucose uptake into several peripheral tissues,
12
resulting in a homeostatic imbalance of glucose. Although TXNIP has relevance
to metabolic syndromes such as obesity and type I and II diabetes mellitus, the
role and regulation of TXNIP in liver is unclear. To investigate a metabolic role
of TXNIP in the liver, Ad-Txnip is administrated to normal mice and an
intraperitoneal glucose tolerance test (IPGTT), insulin tolerance test (ITT), and
pyruvate tolerance test (PTT) were performed. Overexpression of TXNIP
resulted in an impaired glucose, insulin, and pyruvate tolerance in normal mice.
After Ad-Txnip administration, the expression of genes involved in glucose
metabolism, including glucose-6-phosphatase (G6pc) and glucokinase (Gck)
were analysed using qPCR and western blot. Ad-Txnip transduction upregulated
G6pc expression and caused a decrease in Gck levels in the liver of normal mice
and primary hepatocytes. To understand increased G6pc expression in the liver
as a result of TXNIP overexpression, pull down assays for TXNIP and small
heterodimer partner (SHP) were performed and confirmed that TXNIP

13
increased G6pc expression by forming a complex with SHP which is known to
be a negative modulator of gluconeogenesis. To study for the regulation of
Txnip gene expression, luciferase reporter assays and chromatin
immunoprecipitation (ChIP) assays using the Txnip promoter were performed to
elucidate the interrelationship between carbohydrate response element binding
protein (ChREBP) and transcription factor E3 (TFE3) in the regulation of Txnip
expression. Furthermore, Txnip expression in diabetic mouse models was
decreased by Ad-Tfe3 administration, suggesting that TFE3 may play a negative
role through competition with ChREBP at the E-box of the Txnip promoter.
These findings demonstrated that TXNIP impairs glucose and insulin tolerance
in mice by upregulating G6pc through interaction with SHP and modulating
TXNIP expression.
Key words: TXNIP, SHP, ChREBP, TFE3, G6PC, GCK, gluconeogenesis,
transcriptional regulation

14
The role of TXNIP in the hepatic glucose homeostasis
Seong Ho Jo
Department of Medical Science
The Graduate School, Yonsei University
(Directed by Professor Yong Ho Ahn)
I. INTRODUCTION
Obesity-linked inflammation plays a causal role in various metabolic
disorders, including type 2 diabetes mellitus, nonalcoholic fatty liver disease,
and atherosclerosis. This condition is provoked by ER stress, hypoxia,
lipotoxicity, reactive oxygen species, and altered adipokine signaling 1. Liver
plays a key role in maintaining blood glucose level. Hepatic gluconeogenesis is
15
influenced by varieties of hormones including glucagon, insulin and
glucocorticoid, etc. 2. Other signals affecting hepatic gluconeogenesis include
mitochondrial dysfunction 3 and cellular redox states
4. In the uncontrolled
states of diabetes, abnormal production of glucose in the liver contributes to the
development of hyperglycemia 5.
Thioredoxin (TRX) is known to be one of the key regulators of cellular
metabolism with regard to cellular redox states. TRX mediates a redox signaling
by interacting with various transcription factors and signaling proteins 6, 7
.
Among those, thioredoxin interacting protein (TXNIP), also called vitamin D
upregulated protein (VDUP1) or thioredoxin binding protein (TBP2), is known
to be involved in the regulation of various metabolic processes, including fatty
acid synthesis and cholesterol accumulation in the liver 8. TXNIP dissociated
from TRX due to reactive oxygen species (ROS) causes an activation of NLRP3
(nucleotide-binding domain and leucine-rich repeat containing protein 3)
inflammasome with conversion of pro-IL-1 to active IL-1 9, which is known
to be implicated in the obesity to type 2 diabetes mellitus (T2DM) progression 10
.
In vitro, IL-1 over-produced by high glucose, free fatty acid and leptin
mediates autoinflammatory response resulting in -cell death 11
. TXNIP is
increased in patients with T2DM 12
, however the role of TXNIP in the liver is

16
largely unknown. Thus, detailed studies on the molecular mechanism governing
the control of Txnip expression at the transcriptional level and the function of
TXNIP in the liver are critical for understanding pathogenesis of T2DM. The
expression of Txnip is known to be suppressed by insulin 12
, Foxo1 13
and nitric
oxide (NO) 14
. In contrast, glucose 15
, glucocorticoid 16
, vitamin D 17
, Krueppel-
like factor 6 (KLF-6) 18
and H2O2 19
upregulate the transcription of Txnip. The
effect of peroxisome proliferator-activated receptor-gamma (PPAR on the
expression of Txnip gene varies depending on the tissues. In the macrophages,
GW929, one of PPAR agonists increases Txnip mRNA level 20
, whereas
pioglitazone and rosiglitazone, other PPAR agonists, decreased Txnip
expression in the kidney derived cell lines 18
.
In this study, the Txnip expression is increased in STZ-induced mouse
model of type I diabetes (STZ-diabetic mice) and db/db mice. Overexpression
of Txnip using adenovirus in normal mice impaired glucose tolerance by
upregulating a hepatic glucose-6-phosphatase gene (G6pc). Furthermore,
transduction of Ad-Txnip to the primary cultured hepatocytes increased G6pc
expression whereas knock-down of Txnip using siRNA ameliorated impaired
glucose tolerance, suggesting that TXNIP might act at the transcriptional level
in the hepatocytes. TXNIP increases the expression of G6pc by forming

17
complex with SHP, a negative modulator of gluconeogenic gene expression.
These finding also showed that Txnip expression is down-regulated by TFE3, a
transcription factor that increases Irs2 21
and Gck 22
expression. TFE3 down-
regulates Txnip expression by competing carbohydrate responsive element
binding protein (ChREBP) at the carbohydrate responsive element (ChoRE) in
the Txnip promoter.

18
II. MATERIALS AND METHODS
1. Cell culture and reagents
HepG2 and HEK293T cells were maintained in Dulbecco's modified
Eagle's medium (DMEM) containing 10% (v/v) fetal bovine serum (FBS), 100
units/ml penicillin, and 100 μg/ml streptomycin. Primary hepatocytes were
isolated C57BL/6J mouse livers and cultured for 6 h in DMEM high glucose
containing 10% (v/v) FBS, 100 units/ml penicillin, 100 g/ml streptomycin, 10
nmol/l dexamethasone, and 10 nmol/l insulin. And then, FBS, dexamethasone,
and insulin were excluded from the medium and cultured for an additional 48 h
in the presence or absence of Ad-Txnip. Cells were grown at 37C/5% CO2
humidified incubator. Glucagon (#G3157) and Insulin (#I9278) were purchased
from Sigma-Aldrich (Oakville, Ontario, Canada).
2. Animals
C57BL/6J (C57BL/6JJmsSlc), db/m+
(C57BLKS/J lar-m+/Lepr
db), and
db/db (C57BLKS/J lar-Leprdb
/Leprdb
) male mice (Shizuoka laboratory,
Hamamatsu, Japan) were fed a regular chow diet and housed under a 12-h
light/12-h dark cycle. For the fasted and refed experiments, the mice were
divided into fasted or refed groups. The fasted group was fasted for 12 h, and

19
the refed group was fasted for 12 h and refed a rodent chow diet for 1, 2, 4, 12
or 24 h prior to study. The starting times for experiments were adjusted so that
all mice were sacrificed at the same time, which was at the end of dark cycle.
STZ-diabetic mice were prepared as described previously 22
. Fourteen days after
STZ treatment, mice possessing blood glucose levels greater than 25 mmol/l for
3 consecutive days were used as STZ-diabetic mice. Male db/db and db/m+
mice were used at 10 weeks of age after 2 weeks of acclimation period. All
animal experiments were approved by the Institutional Animal Care and Use
Committee of Yonsei University College of Medicine.
3. Adenoviral production and Tail Vein Injection
Adenoviral GFP (Ad-GFP) or Txnip (Ad-Txnip, a generous gift from R.T.
Lee, Harvard Univ.) was injected into the tail vein of control mice at a level of
1 × 10⁹ plaque-forming units (pfu) per mouse. Eight days after adenovirus
injection, mice in the fed state were anesthetized with Zoletil (30 mg/kg) and
Rompun (10 mg/kg) via intramuscular injection 4 h after an overnight dark
cycle. Whole liver was frozen in liquid nitrogen for subsequent mRNA and
protein preparation. Adeno-Tfe3 (Ad-Tfe3, a generous gift from N. Yamada,
Japan) was injected into the tail vein of control, STZ-diabetic, and db/db mice at

20
1 × 10⁷ (pfu). Basal glucose levels were measured in blood drawn from the
mouse tail vein using a glucose monitor (ONE TOUCH Ultra, Life Scan,
Milpitas, CA).
4. Glucose tolerance test (GTT), insulin tolerance test (ITT), and pyruvate
tolerance test (PTT)
GTT was performed 8 days after adenovirus administration; mice were
fasted for 16 h and then glucose was injected intraperitoneally (2 g/kg body
weight). Blood glucose levels were monitored at the indicated time points. For
the ITT, mice were fasted for 6 h and then insulin (0.75 units/kg Humulin R, Eli
Lilly, Indianapolis, IN) was administered intraperitoneally. For the PTT, mice
were fasted for 16 h and then injected with sodium pyruvate at a dose of 2 g/kg
for lean mice. The area under the curve (AUC) of glucose was calculated during
the course of the tests.
5. Metabolites measurement
Blood samples were collected from the inferior vena cava. Plasma insulin
levels were measured by enzyme-linked immunosorbent assay (ELISA) kit
(ALPCO Immunoassays, Salem, NH). Glycogen content was detected using a

21
glycogen measurement kit (#ab65620, Abcam, Cambridge, MA).
6. Quantitative real time PCR
Total RNA was isolated from mouse liver or primary hepatocytes using an
Easy Spin RNA extraction kit (iNtRON, Gyeonggi-do, Korea), and cDNA was
generated using the ImProm-II Reverse Transcription System (Promega,
Madison, WI). Quantitative real time PCR (qPCR) was performed using the
Step One Real-Time PCR Systems (Applied Biosystems, Foster City, CA). The
relative amount of mRNA in each sample was normalized to Rplp0 transcript
levels. The sequences for gene-specific PCR primers are listed in Table 1.

22
Table 1. Primers used for real-time PCR
Gene
symbol
Genbank
Accession No. Sequence (5’-3’)
Txnip NM_023719.2 FW: GTCAGTGTCCCTGGCTCCAAGA
RV: AGCTCATCTCAGAGCTCGTCCG
G6pc NM_008061.3 FW: TGGTAGCCCTGTCTTTCTTTG
RV: TTCCAGCATTCACACTTTCCT
Pck1 NM_011044.2 FW: ACACACACACATGCTCACAC
RV: ATCACCGCATAGTCTCTGAA
Slc2a2 NM_031197.2 FW: GCAACTGGGTCTGCAATTTT
RV: CCAGCGAAGAGGAAGAACAC
Gck NM_010292.4 FW: CTGTTAGCAGGATGGCAGCTT
RV: TTTCCTGGAGAGATGCTGTGG
Irs2 NM_001081212.1 FW: GCCTGGGGATAATGGTGACT
RV: TCCATGAGACTTAGCCGCTT
Tfe3 NM_172472.3 FW: CCAGGCTCAGGAACAGGAGA
RV: TACTGTTTGACCTGCTGCCG
Srebp1a NM_023719.2 FW: GGCCGAGATGTGCGAACT
RV: TTGTTGATGAGCTGGAGCATGT
Srebp1c NM_008061.3 FW: GGAGCCATGGATTGCACATT
RV: GGCCCGGGAAGTCACTGT
Srebp2 NM_011044.2 FW: CAAGTGGGAGAGTTCCCTGA
RV: GCAGGACTTGAAAGCTGGTC

23
Elovl6 NM_031197.2 FW: GTCGCTGACTCTTGCCGTCTTC
RV: TCACCTAGTTCGGGTGCTTTGC
Acacb NM_010292.4 FW: TATTCCAAGTGGCTTGGGTGGA
RV: TCTGGATTCGCCTTCATCTTCG
Fasn NM_001081212.1 FW: TTTGCTGCCGTGTCCTTCTACC
RV: ATGTGCACAGACACCTTCCCGT
Scd1 NM_172472.3 FW: GCCACCTGGCTGGTGAACAG
RV: AGCGTACGCACTGGCAGAGTAG
Shp NM_007475.5 FW: CCAGTATACTTAAGAAGATCCT
RV: ACGCATACTCCTTGGGACC
Rplp0 NM_007475.5 FW: GCAGGTGTTTGACAACGGCAG
RV: GATGATGGAGTGTGGCACCGA
24
7. Western blot analysis
Western blot was performed as described previously 22
. Briefly, proteins
were transferred to nitrocellulose membrane (Whatman, Germany) and blocked
with non-fat milk and incubated with the following primary antibodies: anti-
TXNIP (K0205-3, MBL international, Woburn, MA), anti-G6PC (sc-27198),
anti-PCK1 (sc-32879), anti-GCK (sc-7908), anti-SHP (sc-30169) and anti--
Tubulin (sc-5286) (Santa Cruz Biotechnology Inc., Santa Cruz, CA), anti-
GLUT2 (AB1342, Millipore, Temecula, CA), anti-TFE3 (ab70008, Abcam,
Cambridge, MA), anti-IRS2 (3089) and anti-Myc (2276) (Cell Signaling, St.
Louis, MO), anti-Flag (G188, Applied Biological Materials Inc., Richmond,
BC), and anti-HA (ADI-MSA-106-E, Enzo Life Sciences, Farmingdale, NY).
The protein bands were detected using an Imager (Fujifilm LAS-3000, Fujifilm,
Tokyo, Japan).
8. Plasmids
Mouse Txnip promoter-luciferase reporter constructs were constructed by
amplifying the promoter region of mTxnip (-1119/+279) using primers. The
PCR products were inserted into the pGL4 basic vector (pGL4b). The serial
deletion constructs of the Txnip promoter reporter (-879, -600, -400, -200, -138

25
and -30) were prepared by PCR with mTxnip (-1119/+279) as template.
Luciferase reporter constructs with the mG6pc promoter (-500/+66bp), mL-Pk
promoter (-697/+106) and mScd1 (-1175/+300) were prepared by PCR
using primers. The PCR products were inserted into the pGL4 basic vector
(pGL4b). Expression vectors such as HA-tagged SHP, Myc-tagged Foxo1,
Flag-tagged ChREBP (generous gift from Towle HC, Minnesota Univ.), and
V5-tagged Tfe3 were described previously 21
. Hnf1, Hnf3 and Hnf4plasmid
vectors were generous gift from Im SS (Keimyung Univ). The primers used for
amplifying the promoter region are shown in Table 2.
26
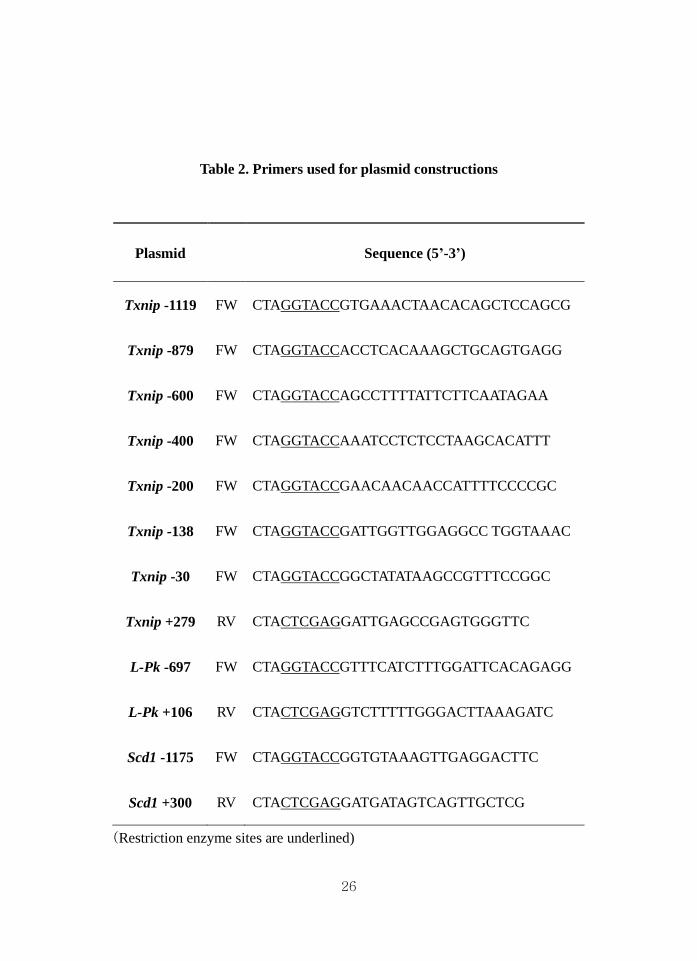
Table 2. Primers used for plasmid constructions
Plasmid Sequence (5’-3’)
Txnip -1119 FW CTAGGTACCGTGAAACTAACACAGCTCCAGCG
Txnip -879 FW CTAGGTACCACCTCACAAAGCTGCAGTGAGG
Txnip -600 FW CTAGGTACCAGCCTTTTATTCTTCAATAGAA
Txnip -400 FW CTAGGTACCAAATCCTCTCCTAAGCACATTT
Txnip -200 FW CTAGGTACCGAACAACAACCATTTTCCCCGC
Txnip -138 FW CTAGGTACCGATTGGTTGGAGGCC TGGTAAAC
Txnip -30 FW CTAGGTACCGGCTATATAAGCCGTTTCCGGC
Txnip +279 RV CTACTCGAGGATTGAGCCGAGTGGGTTC
L-Pk -697 FW CTAGGTACCGTTTCATCTTTGGATTCACAGAGG
L-Pk +106 RV CTACTCGAGGTCTTTTTGGGACTTAAAGATC
Scd1 -1175 FW CTAGGTACCGGTGTAAAGTTGAGGACTTC
Scd1 +300 RV CTACTCGAGGATGATAGTCAGTTGCTCG
(Restriction enzyme sites are underlined)

27
9. Transient transfection and luciferase assays
HepG2 cells were plated in 12-well tissue culture dishes at a density of
2 × 10⁵ cells/well in 1 mL DMEM medium. Expression plasmids for Tfe3 (0, 50,
100, and 200 ng) and ChREBP (200 ng), the mTxnip promoter reporter (200 ng)
and the Renilla luciferase plasmid were co-transfected using the FuGENE 6
Transfection Reagent (Roche, Mannheim, Germany) at a ratio of 4:1. For the
G6pc promoter activity assay, the promoter reporter (200 ng) was used with
expression plasmids for Txnip (0, 10, 20, 50, 100, and 200 ng), SHP (200 ng),
Foxo1 (200 ng), Hnf1(200 ng), Hnf3 (200 ng) and Hnf4 (200 ng). Total
amount of transfected plasmid was adjusted to 600 ng by the addition of empty
vector plasmids. For L-Pk and Scd1 promoter assay, HepG2 cells were
transfected with ChREBP (200 ng), firefly luciferase fusion promoter reporter
constructs of L-Pk (200 ng) or Scd1 (200 ng) and expression plasmid Renilla
luciferase in the presence (+) or in the absence (-) of Tfe3 expression vector.
All luciferase experiments were performed using Dual-Luciferase Reporter
Assay System (Promega, Madison, WI).
10. Small-interfering RNAs
RNA oligonucleotides for scramble (5′-UUCUCCGAACGUGUCACGUdTdT-

28
3′), Txnip (forward, 5’-GUCUCUGCUCGAAUUGACAdTdT-3’ (No. 1), 5’-
GCAACAUCCUCAAAGUCGAdTdT-3’ (No. 2)) (Genolution, Seoul, Korea)
and Tfe3 (forward, 5′-GCAGGCGAUUCAA CAUUAAdTdT-3′) (GenePharma,
Shanghai, China) were synthesized. The siRNA-Txnip (20 nmol/l) and siRNA-
Tfe3 (10 nmol/l) were transfected into appropriate experimental sets of primary
hepatocytes for 24 h after seeding using Lipofectamine RNA iMAX (Invitrogen,
Carlsbad, CA). After 48 h, cells were lysed for RNA isolation and protein
extraction.
11. Immunoprecipitation (IP)
Myc or Flag-tagged Txnip (2 g) and HA-tagged SHP (2 g) were
co-transfected into HEK293T cells. After 24 h, cells were lysed in cold lysis
buffer (50 mmol/l Tris-HCl pH 7.2, 250 mmol/l NaCl, 0.1% NP-40, 2 mmol/l
EDTA, 10% (v/v) glycerol) containing appropriate protease inhibitors. The
supernatant was precleared with protein A/G PLUS (Santa Cruz, County, CA)
and incubated with 2 l of the indicated antibody, such as anti-Flag (F3165,
Sigma-Aldrich, St. Louis, MO), anti-HA (MMS-101R, Covance, Princeton, NJ),
or anti-TXNIP (K0205-3, MBL international, Woburn, MA) for 16 h and protein
A/G PLUS for additional 4 h at 4C. Protein pellets were washed 4 times with

29
lysis buffer, resuspended in sample buffer, and then subjected to SDS-PAGE.
For in vivo experiments, proteins were extracted from liver using Pro-Prep
protein extraction solution (iNtRON, Gyeonggi-do, Korea) and immunoprecipitated
with anti-TXNIP.
12. Chromatin immunoprecipitation (ChIP) assay
ChIP experiments on primary hepatocytes were performed as previously
described 22
. Briefly, protein extracts were incubated with 4 g of anti-ChREBP
(#NB400-135, NOVUS Biologicals LLC, Littleton, CO) or anti-TFE3
antibodies for 16 h at 4°C. Protein/DNA complexes were precipitated for 1 h at
4°C using 60 L of 50% protein A or G agarose/salmon sperm DNA slurry.
DNA fragments were purified using a Qiagen PCR purification kit (#28106) and
quantified by qPCR. For in vivo studies, 50 mg of liver tissue was used for each
ChIP assay. The mouse Txnip promoter region (-203/-18) with ChoRE was
amplified using specific primers (forward, 5’-CGCACCCGAACAACAACCAT
-3’ and reverse, 5’- GGCTTATATAGCCGCCTGGCTT-3’). As a negative control,
the mouse Txnip promoter region not included in ChoRE (-907/-773) was
amplified using primers (forward, 5’-GCTGCAGTGAGGAACAAGGGAA-3’
and reverse, 5’- CTGCTACTGTTCCTCGCCCATT-3’).

30
13. Statistical analysis
Three to five experiments were performed for all in vitro studies, using
triplicate replicates of each transfection. The data are represented as means
standard error of the mean (SEM). All data sets were analyzed for statistical
significance using a two-tailed unpaired Student’s t test. All P values less than
0.05 were considered significant. Statistical analysis was carried out using SPSS
(Ver. 11.5; SPSS Inc. Chicago, IL).
31
III. RESULTS
1. TXNIP is upregulated in fasting, STZ-diabetic and db/db mice liver
To observe the Txnip expression in the liver, mice were subjected to fasting
and refeeding (Fig. 1A). mRNA level of Txnip in the 16 h fasted mice was
increased 6-fold compared to ad libitum group (p<0.05) whereas refeeding the
mice resulted in a decrease in its mRNA level. A previous study showed that
Txnip expression is decreased by insulin 12
in the myocytes and adipocytes.
However, its expression in the liver was not known yet. As shown in (Fig. 1B
and 1C), Txnip mRNA expression was decreased in primary cultured
hepatocytes in the presence of insulin and refed mice. These data suggest that
the expression of Txnip could be downregulated by insulin in liver. In fact,
hepatic Txnip mRNA was upregulated in the type 1 and 2 diabetic model mice,
where insulin signaling is impaired (Fig. 1D and 1E) (p<0.01). And insulin
administration resulted in a significant decrease in its mRNA level in these
animal models.

32

33
Figure 1. TXNIP is upregulated in the livers of fasting, STZ-induced
diabetic and db/db mice
A, Nine-week-old C57BL/6J male mice were fasted 12 h and refed 12 h or 24 h
with a chow diet. B, Mouse primary hepatocytes were maintained under the
indicated concentrations of glucose (5 and 25 mmol/l) with or without insulin
(10 nmol/l). C, Mice fasted 12h and refed with a chow diet at indicated times,
respectively. Mice grouped into control (buffer) and STZ-treated mice. STZ-
diabetic (D) and db/db mice (E) were prepared as described in the text. TXNIP
mRNA and protein levels were measured by qPCR and western blot,
respectively α-Tubulin was used as an internal control. Data are expressed as
the mean ± SEM (n=8 per group) (*p<0.05, **p<0.01). Buffer, buffer control;
STZ, streptozotocin.

34
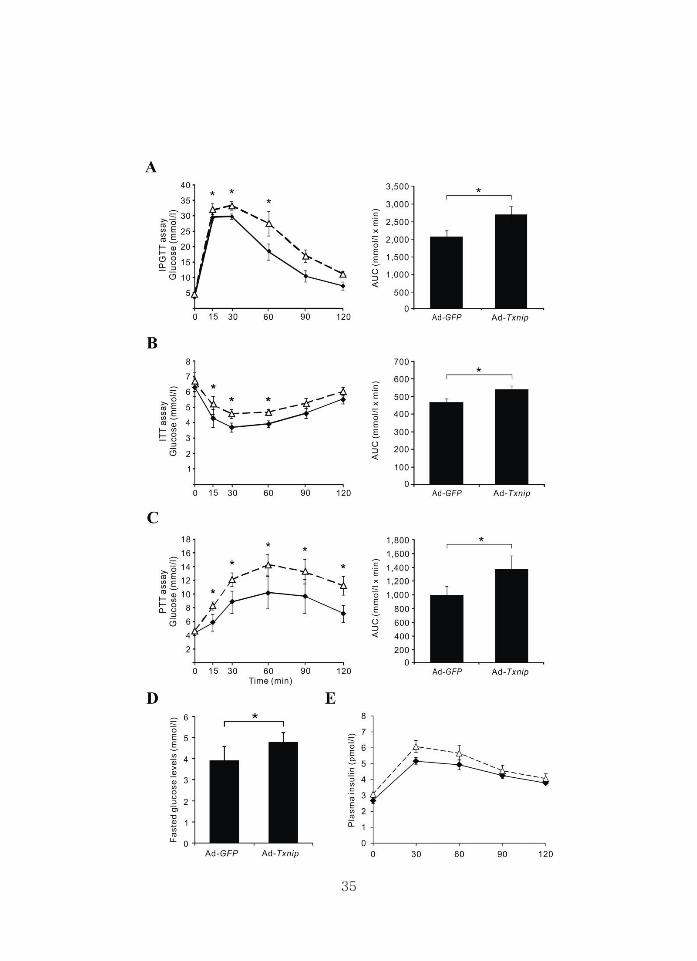
2. Ad-Txnip administration impairs glucose, insulin, and pyruvate
tolerance in normal mice
To examine the effects of Txnip expression on glucose homeostasis, Ad-
Txnip was injected via the tail vein into normal mice. Eight days after Ad-Txnip
injection, intraperitoneal glucose tolerance test (IPGTT) and insulin tolerance
test (ITT) were performed. As shown in Fig. 2A and 2B, overexpression of
Txnip in the liver impairs both glucose and insulin tolerance. An impaired
pyruvate tolerance test (PTT) suggested that gluconeogenesis was increased by
Txnip (Fig. 2C). Furthermore, fasting glucose levels in the Ad-Txnip group are
significantly higher than those in the Ad-GFP group (Fig. 2D). Overexpression
of Txnip did not change insulin secretion in response to a glucose in vivo (Fig.
2E). Thus, it is speculated that long time term elevation of TXNIP may further
impair glucose tolerance.
35

36
Figure 2. Ad-Txnip administration impairs glucose, insulin, and pyruvate
tolerance in normal mice
Eight days after Ad-Txnip injection, IPGTT, ITT, and PTT were performed. A,
GTT was performed in mice fasted for 16 h. Glucose was injected intraperitoneally.
B, For ITT, mice were fasted for 6 h, and insulin was injected intraperitoneally.
C, For PTT, mice were fasted for 16 h and injected with sodium pyruvate. Black
diamond, Ad-GFP injected mice; white triangle, Ad-Txnip injected mice. AUC
of glucose was calculated during the course of the tests. Blood glucose levels
were measured at the indicated time points shown in the Figure. D, The blood
glucose levels in the GTT experiment at zero time. E, Plasma insulin levels
measured at the indicated time during IPGTT. Data are expressed as the mean
±SEM (n=8 per group, *p<0.05). GTT, glucose tolerance test; ITT, insulin
tolerance test; PTT, pyruvate tolerance test; AUC, area under curve; GFP; green
fluorescent protein.
37
3. The effect of Ad-Txnip on the expression of genes involved in glucose
metabolism in the livers of normal mice
Because TXNIP is responsible for the impaired IPGTT, ITT, and PTT, the
expression levels of glycolytic and gluconeogenic genes were quantitated in the
liver. As shown (Fig. 3A and 3F, p<0.01), G6pc expression was significantly
increased by Txnip; the increase in Pck1 mRNA expression was not statistically
significant (Fig. 3B, p>0.05). In contrast, GCK expression was significantly
decreased by Txnip (Fig. 3D and 3F, p<0.01), with a slight increase in slc2a2
(GLUT2) mRNA levels (Fig. 3C, p>0.05). To prove that the impaired glucose
and insulin tolerance was not caused by Ad-Txnip action in peripheral tissues,
the expression of TXNIP in major glucose consumption tissues such as skeletal
muscle (Fig. 3G) and adipose tissue (Fig. 3H) was measured. As shown in Fig.
3F, TXNIP overexpression was restricted to the liver. Although the basal
glucose level was significantly increased (Fig. 3I, p<0.05), the serum insulin
level in normal mice was not significantly affected by Txnip treatment (Fig. 3J,
p>0.05). Because upregulation of Gck was shown to be accompanied by hepatic
lipogenesis 23
, the expression of representative genes of lipid metabolism were
measured which showed no significant change (Fig. 4). Measurement of
glycogen content in the Ad-Txnip-treated mice revealed that glycogen content in

38
this group was not significantly different than controls (Fig. 3K), indicating that
G6p is derived from gluconeogenesis.

39

40
Figure 3. Effect of Ad-Txnip on the expression of the genes involved in
glucose metabolism in the liver of normal mice

41
qPCR (A-E) and western blot (F) of genes involved in glucose metabolism in
the livers of normal mice injected with Ad-Txnip. Each value represents the
amount of mRNA relative to that of the Ad-GFP-treated group, which was
arbitrarily defined as 1. The expression levels of TXNIP on skeletal muscle (G)
and adipose tissue (H). The effect of Ad-Txnip on the basal serum glucose levels
(I), insulin levels (J), and hepatic glycogen content (K). All the values are
expressed as the mean ± SEM (*p<0.05, **p<0.01). G6pc, glucose-6-
phosphatase; Pck1, phosphoenol-pyruvate carboxykinase; Slc2a2, glucose
transporter type 2 isoform; Gck, glucokinase.

42
Figure 4. Effect of Ad-Txnip on lipogenic gene expression in the liver
A-C. mRNA levels of Srebp-1a, 1c and 2 genes in the livers of normal mice
injected with Ad-Txnip. D-G. mRNA levels of genes involved in lipid
metabolism in the livers of normal mice injected with Ad-Txnip. Bars represent
the mean ± SEM (n=8). The amount of mRNA in each sample was normalized

43
to Rplp0 transcript levels. Srebp, Sterol regulatory element-binding protein;
Elovl6, Elongation of very long chain fatty acids protein 6; Acacb, Acetyl-CoA
carboxylase beta; Fasn, Fatty acid synthase; Scd1, Stearoyl-CoA desaturase 1.

44
4. Transduction of Ad-Txnip upregulates G6pc expression in primary
hepatocytes
To study the direct role of TXNIP on gluconeogenic gene expression in the
liver, Ad-Txnip was transduced into primary hepatocytes. As shown, G6PC
mRNA (Fig. 5A, p<0.05) and protein levels (Fig. 5F) were significantly
increased by Txnip, with marginal increase in PCK1 expression (Fig. 5B and 5F),
which correlates well with the in vivo experiment (Fig. 3). Similarly, Txnip
decreased GCK mRNA and protein levels (Fig. 5D and 5F, p<0.05) with no
significant change in SLC2A2 expression (Fig. 5C and 5F, p>0.05). Treatment
of hepatocytes with siRNA-Txnip (clones si-Txnip No. 1 and No. 2) resulted in
significantly decreased G6PC expression (Fig. 5G and 5L, p<0.05). Although
Pck1 mRNA expression was unchanged (Fig. 5H, p>0.05), protein level was
slightly decreased (Fig. 5L). In contrast, GCK expression was increased
significantly (Fig. 5J and 5L, p<0.05) with no change in SCL2A2 expression
(Fig. 5I and 5L, p>0.05).

45

46
47
Figure 5. Transduction of Ad-Txnip upregulates G6pc expression in
primary cultured hepatocytes
Primary cultured hepatocytes were treated with the indicated amounts of Ad-
Txnip. mRNA levels of G6pc (A), Pck1 (B), Slc2a2 (C), Gck (D), and Txnip (E)
were measured by qPCR. Each value represents the amount of mRNA relative
to that of the Ad-GFP-treated group, which was arbitrarily defined as 1. (F)
Western blot of G6PC, PCK1, GLUT2, and GCK. The effect of si-Txnip on the
mRNA (G-K) and protein levels (L) of TXNIP, G6PC, PCK1, GLUT2, and
GCK. Scrambled siRNA (Scram) or si-Txnip (No. 1 and No. 2) was transfected
as described in the text. Each value represents the amount of mRNA relative to
that of the Scram group in the same set of experiments, which was arbitrarily
defined as 1. Bars represent the mean ± SEM for three plates per group,
performed in triplicate (*p<0.05, **p<0.01). Scram: scramble, si-Txnip; siRNA-
Txnip.
48
5. G6PC expression was increased by TXNIP
To investigate whether Txnip expression is correlated with G6pc expression
in hyperglycemic condition, STZ-diabetic and db/db mice models were used.
Protein levels of TXNIP and G6PC were increased in the liver of both diabetic
models (Fig. 6A and 6B), which were consistent with the mRNA level of G6pc
in these mice 22, 28
.
Because G6pc gene expression is regulated by hormones such as glucagon
or insulin in vivo 24
, effects of glucagon and insulin is observed in terms of
TXNIP-G6pc relationship. To this end, glucagon was administrated to the Ad-
Txnip-treated primary cultured hepatocytes (Fig. 6C), which show that G6pc
expression is increased by 1.5-fold. Knockdown of Txnip using siRNA resulted
in an inhibition of the glucagon effect (Fig. 6D). When primary cultured
hepatocytes were treated with insulin, the expression of G6pc was decreased.
However, the repressive effect of insulin on G6pc expression was rescued by
Ad-Txnip overexpression (Fig. 6E). Treatment with si-Txnip resulted in
decreased G6pc mRNA levels, which did not further accentuate the insulin
effect (Fig. 6F).

49
Figure 6. Glucagon potentiates TXNIP-mediated G6PC expression
Western blot of G6PC and TXNIP in the control (buffer), STZ-diabetic and
db/db mice. α-Tubulin was used as an internal control. Effect of glucagon on the
G6pc mRNA level in Ad-Txnip (C) and si-Txnip (D) treated primary cultured
hepatocytes. Effect of insulin on the G6pc mRNA level in Ad-Txnip (E) and si-

50
Txnip (F) treated hepatocytes. The hepatocytes were treated with 50 moi of Ad-
Txnip. After 24 h incubation, culture media were changed with conditioned
media containing 1% FBS for 6 h and cells were treated with the indicated
amounts of glucagon or insulin for 30 min. Black bar, Ad-GFP-treated
hepatocyte samples; white bars, Ad-Txnip-treated hepatocyte samples.
Scrambled siRNA (Scram) or si-Txnip was transfected as described in the text.
After 48 h incubation, culture media were changed as above (*p<0.05). Black
bar, Scrambled siRNA-treated hepatocyte samples; white bars, si-Txnip-treated
hepatocyte samples.
51
6. SHP negatively modulates transcriptional activities of TXNIP through
direct interaction
To better understand how TXNIP upregulates G6pc, the effects of TXNIP
on the G6pc promoter is studied. Activity of this promoter is increased after
Txnip transfection in a dose dependent manner (Fig. 7A). Co-transfection of
SHP resulted in a significant decrease in G6pc promoter activity both in the
negative control and the Txnip-transfected group (Fig. 7B, p<0.05). In addition,
when Foxo1, a transcription factor known to increase promoter activity of G6pc,
was co-transfected with SHP, Foxo1-driven promoter activities were decreased
as shown in Fig. 7B. Co-transfection of Foxo1 and Txnip increased G6pc
promoter activity to a greater extent than Txnip transfection alone, and
transfection of SHP to this system resulted in a significant decrease in promoter
activity. In addition, HNFs mediated G6pc promoter activity was also inhibited
by SHP (Fig. 7C-E). Immunoprecipitation experiments in 293T cells using myc-
Txnip or flag-Txnip with HA-SHP revealed that these two proteins interact with
each other (Fig. 7F and 7G). Furthermore, the protein interaction between
TXNIP and SHP was increased in the liver of both normal mice which were
transduced with Ad-Txnip (Fig. 7H) and db/db mice (Fig. 7I), suggesting that
TXNIP-driven gluconeogenesis is suppressed by SHP.

52

53
Figure 7. TXNIP negatively modulates transcriptional activity of SHP
through direct interaction
A, Effect of Txnip on the promoter activity of G6pc. HepG2 cells were
transfected with Txnip, firefly luciferase fusion promoter reporter constructs of
G6pc (-500/+66 bp) and expression plasmid Renilla luciferase. B-E, The effect
of SHP on the Txnip-driven G6pc promoter activity in the presence (+) or in the
absence (-) of a Foxo1 (B), Hnf1 (C), Hnf3 (D) and Hnf4 (E) expression
vectors. The expression plasmids for SHP (200 ng) and Txnip (200 ng) were
transfected with or without expression vectors (200 ng). Bars represent the

54
mean ± SEM for three plates per group, performed in triplicate (*p<0.05). F,
Identification of interaction between SHP and TXNIP. HA-SHP and Myc-Txnip
were transfected to HEK293T cells. Cell lysates were precipitated with anti-HA
antibodies and incubated with anti-Myc antibody. G, Dose response of protein
interaction between SHP and TXNIP. Flag-Txnip and HA-SHP construct (0, 1,
and 2 μg) were transfected to HEK293T cells and precipitated with anti-Flag
antibodies. Identification of the SHP-TXNIP interaction in the Ad-Txnip treated
mice or db/db mice. H, Ad-Txnip (1 × 10⁹
pfu) was injected into tail vein of
normal mice. Eight days after infection, the homogenates of liver tissue (50 mg)
were precipitated using anti-SHP antibodies. I, Male db/db and db/m+ mice
were sacrificed and used as above. SHP, small heterodimer partner.
55
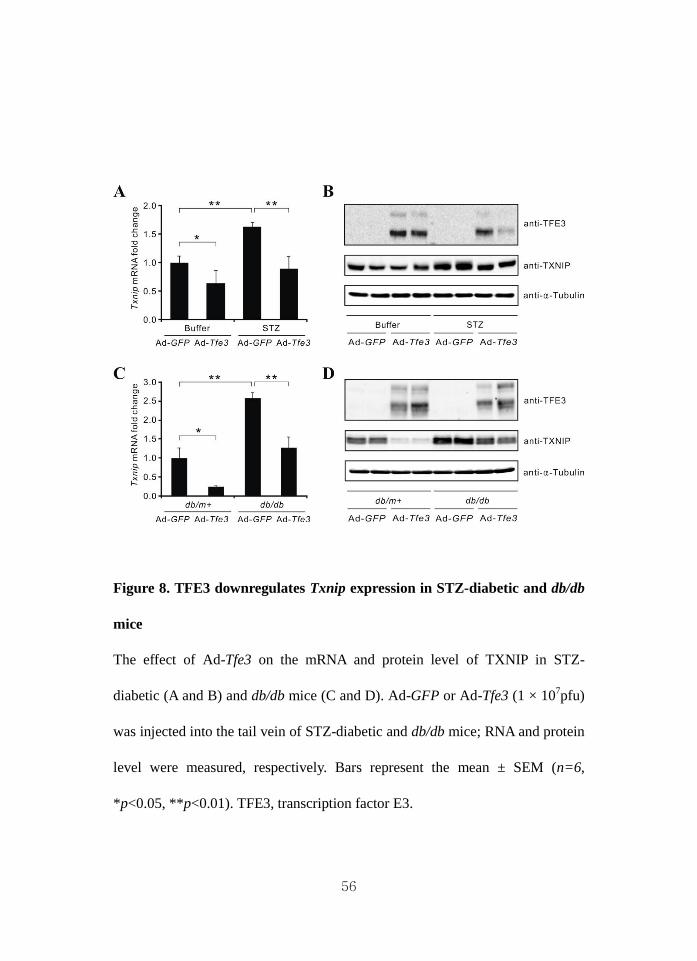
7. TFE3 downregulates Txnip expression in STZ-diabetic and db/db mice
Previous study showed that TFE3 upregulates Gck in the liver, resulting in
the improvement of the GTT and the ITT 22
. Based on this observation, TFE3
could regulate Txnip expression in a negative manner. Indeed, Ad-Tfe3
administration to normal or STZ-diabetic mice resulted in a significant decrease in
Txnip expression when compared to that of the Ad-GFP group (Fig. 8A and 8B).
Similarly, Txnip expression was significantly decreased by Ad-Tfe3 either in
db/m+ or db/db mice (Fig. 8C and 8D).
56
Figure 8. TFE3 downregulates Txnip expression in STZ-diabetic and db/db
mice
The effect of Ad-Tfe3 on the mRNA and protein level of TXNIP in STZ-
diabetic (A and B) and db/db mice (C and D). Ad-GFP or Ad-Tfe3 (1 × 10⁷pfu)
was injected into the tail vein of STZ-diabetic and db/db mice; RNA and protein
level were measured, respectively. Bars represent the mean ± SEM (n=6,
*p<0.05, **p<0.01). TFE3, transcription factor E3.

57
8. TFE3 and ChREBP regulate the activity of the Txnip promoter in a
reciprocal manner
To better understand how TFE3 regulates Txnip expression, primary
hepatocytes were incubated with various concentrations of glucose and with 0,
10, or 50 moi of Ad-Tfe3. Txnip expression, which increased with glucose
concentration, was decreased by Ad-Tfe3 in a dose dependent manner (Fig. 9A
and 9B). Treatment of primary hepatocytes with siRNA-Tfe3 (si-Tfe3) resulted
in an increase in Txnip mRNA, contrary to the decrease in Irs2 and Tfe3
expression (Fig. 9C-F). TFE3 belongs to the Class III basic helix-loop-helix
transcription factors, such as the Srebp family that binds to E-box 25
, and the
promoter of Txnip contains a non-palindromic E-box (CACGAG). ChREBP,
which binds to the E-box of Txnip 15
, is a key transcription factor activated by
glucose in the liver 26
. Thus, it is possible that both of these proteins may bind to
the E-box of the Txnip promoter. To determine if there is a functional
relationship between these proteins on the Txnip promoter, a Txnip promoter-
luciferase construct (-1,119/+279 bp) was transfected with ChREBP into HepG2
cells and observed the effect of Tfe3 on ChREBP-driven promoter activity (Fig.
9G). As shown, TFE3 decreased promoter reporter activity in a dose dependent
manner. These results suggest that ChREBP and TFE3 act antagonistically on

58
the E-box. A promoter activity assay using various serial deletion constructs of
the Txnip promoter revealed that TFE3 suppresses promoter activity of Txnip
(Fig, 9H). Furthermore, Tfe3 showed similar inhibitory effect on the
ChREBP target genes such as L-Pk (Fig. 9I) and Scd1 (Fig. 9J). To identify
TFE3 binding sites, a ChIP assay is performed. As shown, ChREBP binds to the
E-box of the promoter in a glucose dependent manner in the absence of TFE3.
However, co-transfection of Tfe3 with ChREBP resulted in a decrease of
ChREBP binding, even in the presence of high glucose (Fig. 9K). As a negative
control, qPCR of the promoter region from -907 to -773 (Fig. 9L), lacking the
E-box, revealed that TFE3 binds competitively with ChREBP to the endogenous
Txnip promoter. Binding of ChREBP to the E-box in STZ-diabetic and db/db
mice was significantly decreased by the addition of Ad-Tfe3 (Fig. 9M and N,
p<0.05).

59

60
Figure 9. TFE3 and ChREBP regulate the promoter activity of Txnip in a
reciprocal manner

61
Mouse primary hepatocytes were maintained under the indicated concentrations
of glucose (0. 5, 11, and 25 mmol/l) and Ad-Tfe3 (0, 10, and 50 moi). After 24 h
of Ad-Tfe3 infection, the mRNA level (A) of Txnip (*p<0.05, **p<0.01) and
protein level of TFE3, TXNIP, and IRS2 (B) were measured. The effect of si-
Tfe3 on the mRNA (C-E) and protein levels (F) of TXNIP and IRS2. Each value
represents the amount of mRNA relative to that of the Ad-GFP-treated group,
which was arbitrarily defined as 1. Bars represent the mean ± SEM, performed
in triplicate. G. The effect of TFE3 on ChREBP-driven Txnip promoter
activities. HepG2 cells were transfected with the mouse Txnip promoter
construct from -1119 bp to +279 bp linked to a luciferase reporter gene (200 ng
of subcloned mTxnip-Luc vectors) and ChREBP (200 ng) with the indicated
amount of Tfe3. H. The effect of TFE3 on ChREBP-driven Txnip promoter
activities. Various deletion constructs of the Txnip promoter and Tfe3 expression
plasmids were co-transfected to HepG2 cells which were cultured under 25
mmol/l glucose. White bars, Empty vector; black bars, Tfe3 expression vector.
Previously reported ChoRE was indicated as a grey box. The effect of Tfe3 on
ChREBP-driven L-Pk (I) and Scd1 (J) promoter activities. HepG2 cells were
transfected with firefly luciferase fusion reporter constructs of L-Pk (-697/+106
bp) or Scd1 (-1175/+300 bp) promoter, respectively and expression plasmid

62
Renilla luciferase in the presence (+) or absence (-) of ChREBP or Tfe3
expression vector as indicated. K and L. A ChIP assay using primary cultured
hepatocytes. Hepatocytes were cultured either at 0 or 25 mmol/l glucose in the
presence (+) or absence (-) of Ad-Tfe3. Cell lysate was precipitated with anti-
ChREBP and DNA was amplified using primers shown in Material and Method.
Bars represent the mean ± SEM for three plates per group, performed in
triplicate. The effect of TFE3 on ChREBP binding to ChoRE in STZ-diabetic
(M) and db/db mice (N). Normal IgG was used as a negative control. The
regions of -203/-18 bp for Txnip were amplified. White bar, Ad-GFP injected
mice liver samples; black bars, Ad-Tfe3 injected mice liver samples. Bars
represent the mean ± SEM (n=6). IRS2, insulin receptor substrate 2.

63
Figure 10. Diagram illustrating the regulation of G6pc in the physiological
and pathophysiological conditions
A, In the normal states, insulin represses TXNIP expression resulting in
downregulation of G6pc. B, In the diabetes states, overexpression of G6pc
occurs through ChREBP-mediated TXNIP upregulation.

64
IV. DISCUSSION
TXNIP expression is increased in both the hyperglycemic STZ and db/db
animal models (Fig. 1) and Txnip expression is known to be increased in the
muscle and adipose tissue of diabetics 12
. A previous study showed that Txnip-/-
animals exhibit a hypoglycemic phenotype because of increased peripheral
glucose utilization and decreased hepatic glucose production 27
. Therefore, it is
believed that overexpression of Txnip could lead to dysregulation of glucose
metabolism and might contribute to hyperglycemia. To determine whether
increased expression of Txnip in normal liver contributes to the diabetes
phenotype, IPGTT, ITT, and PTT were performed (Fig. 2). Overexpression of
Txnip in the liver by an adenovirus impaired glucose and insulin tolerance due
to increased G6pc and concomitant decreased Gck expression (Fig. 3). In
addition, Ad-Txnip or siRNA-Txnip treatment of primary cultured hepatocytes
showed that the level of G6pc expression is proportional to that of Txnip (Fig.
5A and 5G), whereas the level of Gck mRNA is inversely proportional (Fig. 5D
and 5J), which was similar to what was observed in an in vivo study. Under
physiological conditions, Txnip expression is correlated with G6pc expression
(both are increased in a fasted state and decreased in a refed state 28
, and Fig.

65
1A). In diabetic mice, the expression of TXNIP in the liver is also correlated
with that of G6PC 22, 28
(Fig. 6A and 6B).
Because G6pc expression is subject to hormonal regulation, it is studied
the effects of insulin or glucagon on Txnip-mediated G6pc expression in
primary cultured hepatocytes. Glucagon treatment on Ad-Txnip-treated primary
hepatocytes increased the expression of G6pc 1.5 fold (Fig. 6C). Knockdown of
Txnip using siRNA inhibited the glucagon effect (Fig. 6D). Although the
expression of Txnip is not affected by glucagon (data not shown), there may be
an additive effect of Txnip and glucagon on G6pc expression (Fig. 6C and 6D).
When primary hepatocytes were treated with insulin, endogenous Txnip
expression was decreased (Fig. 1B). In a postprandial hyperglycemic state,
increased insulin inhibited Txnip expression (Fig. 1A and 1C). The repressive
effect of insulin on G6pc expression was reversed by Ad-Txnip overexpression
(Fig. 6E). As previously reported, these data suggest that TXNIP could impair
insulin signaling 12
. Treatment with si-Txnip decreased G6pc mRNA levels (Fig.
6F), but did not further increase the insulin effect. It is speculated that there is
negative feedback between TXNIP and insulin signaling. However, the
molecular mechanism underlying the control of TXNIP expression via insulin
signaling in the liver needs to be further studied.

66
The repression of Gck and concomitant induction of G6pc in response to
high glucose are generally viewed as paradoxical responses 29
. However, the
repressive effect of TXNIP on Gck expression could be explained by a previous
study, which showed that elevated glucose repressed Gck gene expression,
which facilitates the entry of glucose into the phosphometabolite pool 30
.
Furthermore, the induction of G6pc by TXNIP might help maintain the
homeostasis of phosphorylated intermediates 29
and inhibit glucose uptake 30
.
Indeed, several hepatic enzymes are allosterically regulated by Pi, including
AMP-deaminase 31
. Patients with mutations that inactivate G6pc with Pi
depletion have severe hyperuricemia 32
. This result is consistent with the
hypothesis that TXNIP-mediated upregulation of G6pc expression (Fig. 3A and
5A) contributes to hepatic glucose output and decreases Gck levels (Fig. 3D and
5D).
Because TXNIP does not function as a transcription factor, it is searched
for transcription factors that could serve as mediators of TXNIP in the
regulation of G6pc expression. Glucocorticoid receptor (GR) 33
, HNF1
,
HNF3
, HNF4 and FOXO1 36
are positive transcriptional modulators of
G6pc. SHP is known to suppress gluconeogenesis by forming a complex with
these transcription factors 33-36
. SHP knockout mice are hyperglycemic in both

67
the fed and fasted state 37
. Co-transfection with either Foxo1 or Hnfs and a G6pc
promoter reporter construct increased promoter activity (Fig. 7). The
stimulatory effect of these transcription factors was decreased by co-
transfection with SHP, and the repressive effect of SHP was inhibited by Txnip
in HepG2 cells (Fig. 7). In this study, it is demonstrated that SHP interacts with
TXNIP at the protein level both in a cell culture system and in db/db mice (Fig.
7F-I) suggesting that TXNIP-SHP complex formation may derepress G6pc. In
Ad-Txnip-transduced primary hepatocytes, SHP protein levels, but not SHP
mRNA levels, were decreased, suggesting that TXNIP may decrease SHP
stability (data not shown). Recent studies have shown that -arrestin family
proteins with a PPxY motif, including TXNIP, bind with an adaptor protein to
the E3 ubiquitin ligase ITCH 38-40
, resulting in the ubiquitination of both the
adaptor protein and TXNIP. Therefore, it is thought that SHP bound to TXNIP
could be degraded by ubiquitination. Although TXNIP does not significantly
affect Pck1 mRNA levels (Figs. 3B/5B/5H), it regulates PCK1 protein
expression (Figs. 3F/5F/5L). PCK1 is regulated primarily at the transcriptional
level 41
; however, recent data suggest that PCK1 degradation is dependent upon
acetylation-mediated ubiquitination via recruitment of the UBR5 ubiquitin

68
ligase 42
. Studies on the ubiquitination of PCK1 in the presence of TXNIP are
required to determine if it is involved in the stabilization of PCK1.
In high glucose conditions, Txnip expression is increased by ChREBP,
which is dephosphorylated and translocated into nucleus 43
. In muscle and
adipose tissue, elevated glucose induces the expression of Txnip via ChREBP
binding to the E-box on the Txnip promoter, 12, 15, 44
. Recently, overexpression of
the transcription factor Tfe3 was shown to increase glucose and insulin
sensitivity by upregulating the expression of insulin signaling pathway genes,
such as Irs2, Akt1, Insig1, HK2, and Gck by binding to the E-box 21, 22
. Because
ChREBP upregulates Txnip expression, whereas TFE3 downregulates Txnip
expression (Fig. 9), it is possible that these two transcription factors will
compete for binding to the E-box of the Txnip promoter. ChIP assays for
ChREBP and TFE3 demonstrated that they bind competitively to the E-box in
the Txnip promoter (Fig. 9I-L). To confirm the competitive effect of TFE3, it is
performed luciferase assays with the promoters of other ChREBP target genes
(L-Pk and Scd1) (Fig. 9G and 9H) and showed that TFE3 has an inhibitory
effect on ChREBP activity. In this study, it is overexpressed Tfe3, which
decreased the binding of ChREBP to the E-box. Because the physiological role
of Tfe3 and its regulation of ChREBP at the levels of transcription and

69
translation in vivo are not well understood, the relationship between ChREBP
and TFE3 in terms of Txnip gene regulation is not clear. It is speculated that
TFE3 may play an inhibitory role when it binds to the E-Box of the Txnip
promoter. However, the conditions that regulate the transcriptional activity of
Tfe3 need to be further studied.
Taken together, the expression of Txnip is regulated by ChREBP and TFE3
to the control of hepatic gluconeogenic gene expression. Txnip overexpression
relieves SHP-dependent G6pc repression. Consequently, hepatic
gluconeogenesis is increased by Txnip overexpression leading to reducing
systemic glucose tolerance and insulin sensitivity. The physiological and
pathophysiological regulation of gluconeogenic gene expression by TXNIP is
illustrated in Fig. 10.

70
V. CONCLUSION
TXNIP is upregulated in fasting, STZ-diabetic and db/db mice liver and
administration of Ad-Txnip into normal mice impairs glucose, insulin
sensitivity and pyruvate tolerance. When TXNIP expression was increased by
hyperglycemia in pathogenic condition such as diabetes mellitus, TXNIP
increased G6pc expression by forming a complex with SHP, which is known to
be a negative modulator of gluconeogenesis. Txnip expression in mouse models
of diabetes was decreased by Ad-Tfe3 administration, suggesting that TFE3 may
play a antagonistic role by competitive binding of the promoter regions (E-
box) of ChREBP target genes.

71
REFERENCES
1. Hotamisligil GS. Inflammation and metabolic disorders. Nature 2006;444
(7121):860-7.
2. Herman MA, Kahn BB. Glucose transport and sensing in the maintenance of
glucose homeostasis and metabolic harmony. J Clin Invest. 2006;116
(7):1767-75.
3. Pryor HJ, Smyth JE, Quinlan PT, Halestrap AP. Evidence that the flux
control coefficient of the respiratory chain is high during gluconeogenesis
from lactate in hepatocytes from starved rats. Implications for the hormonal
control of gluconeogenesis and action of hypoglycaemic agents. Biochem J
1987;247(2):449-57.
4. Hausler N, Browning J, Merritt M, Storey C, Milde A, Jeffrey FM, et al.
Effects of insulin and cytosolic redox state on glucose production pathways
in the isolated perfused mouse liver measured by integrated 2H and 13C
NMR. Biochem J 2006;394(Pt 2):465-73.
5. Kahn SE, Hull RL, Utzschneider KM. Mechanisms linking obesity to insulin
resistance and type 2 diabetes. Nature 2006;444(7121):840-6.
6. Meuillet EJ, Mahadevan D, Berggren M, Coon A, Powis G. Thioredoxin-1
binds to the C2 domain of PTEN inhibiting PTEN's lipid phosphatase
activity and membrane binding: a mechanism for the functional loss of
PTEN's tumor suppressor activity. Arch Biochem Biophys 2004;429
(2):123-33.

72
7. Das KC, Das CK. Thioredoxin, a singlet oxygen quencher and hydroxyl
radical scavenger: redox independent functions. Biochem Biophys Res
Commun 2000;277(2):443-7.
8. Spindel ON, World C, Berk BC. Thioredoxin interacting protein: redox
dependent and independent regulatory mechanisms. Antioxid Redox Signal
2012;16(6):587-96.
9. Stienstra R, Tack CJ, Kanneganti TD, Joosten LA, Netea MG. The
inflammasome puts obesity in the danger zone. Cell Metab 2012;15(1):10-8.
10. Donath MY, Storling J, Maedler K, Mandrup-Poulsen T. Inflammatory
mediators and islet beta-cell failure: a link between type 1 and type 2
diabetes. J Mol Med (Berl) 2003;81(8):455-70.
11. Dinarello CA, Donath MY, Mandrup-Poulsen T. Role of IL-1beta in type 2
diabetes. Curr Opin Endocrinol Diabetes Obes 2010;17(4):314-21.
12. Parikh H, Carlsson E, Chutkow WA, Johansson LE, Storgaard H, Poulsen P,
et al. TXNIP regulates peripheral glucose metabolism in humans. PLoS Med
2007;4(5):e158.
13. Papadia S, Soriano FX, Leveille F, Martel MA, Dakin KA, Hansen HH, et
al. Synaptic NMDA receptor activity boosts intrinsic antioxidant defenses.
Nat Neurosci 2008;11(4):476-87.
14. Schulze PC, Liu H, Choe E, Yoshioka J, Shalev A, Bloch KD, et al. Nitric
oxide-dependent suppression of thioredoxin-interacting protein expression
enhances thioredoxin activity. Arterioscler Thromb Vasc Biol
2006;26(12):2666-72.
15. Cha-Molstad H, Saxena G, Chen J, Shalev A. Glucose-stimulated expression

73
of Txnip is mediated by carbohydrate response element-binding protein,
p300, and histone H4 acetylation in pancreatic beta cells. J Biol Chem
2009;284(25):16898-905.
16. Reich E, Tamary A, Sionov RV, Melloul D. Involvement of thioredoxin-
interacting protein (TXNIP) in glucocorticoid-mediated beta cell death.
Diabetologia 2012;55(4):1048-57.
17. Chen KS, DeLuca HF. Isolation and characterization of a novel cDNA from
HL-60 cells treated with 1,25-dihydroxyvitamin D-3. Biochim Biophys Acta
1994;1219(1):26-32.
18. Qi W, Chen X, Holian J, Tan CY, Kelly DJ, Pollock CA. Transcription
factors Kruppel-like factor 6 and peroxisome proliferator-activated receptor-
{gamma} mediate high glucose-induced thioredoxin-interacting protein. Am
J Pathol 2009;175(5):1858-67.
19. Zhou R, Tardivel A, Thorens B, Choi I, Tschopp J. Thioredoxin-interacting
protein links oxidative stress to inflammasome activation. Nat Immunol
2010;11(2):136-40.
20. Billiet L, Furman C, Larigauderie G, Copin C, Page S, Fruchart JC, et al.
Enhanced VDUP-1 gene expression by PPARgamma agonist induces
apoptosis in human macrophage. J Cell Physiol 2008;214(1):183-91.
21. Nakagawa Y, Shimano H, Yoshikawa T, Ide T, Tamura M, Furusawa M, et
al. TFE3 transcriptionally activates hepatic IRS-2, participates in insulin
signaling and ameliorates diabetes. Nat Med 2006;12(1):107-13.
22. Kim MY, Jo SH, Park JM, Kim TH, Im SS, Ahn YH. Adenovirus-mediated
overexpression of Tcfe3 ameliorates hyperglycaemia in a mouse model of

74
diabetes by upregulating glucokinase in the liver. Diabetologia
2013;56(3):635-43.
23. Peter A, Stefan N, Cegan A, Walenta M, Wagner S, Konigsrainer A, et al.
Hepatic glucokinase expression is associated with lipogenesis and fatty liver
in humans. J Clin Endocrinol Metab 2011;96(7):E1126-30.
24. Argaud D, Zhang Q, Pan W, Maitra S, Pilkis SJ, Lange AJ. Regulation of
rat liver glucose-6-phosphatase gene expression in different nutritional and
hormonal states: gene structure and 5'-flanking sequence. Diabetes.
1996 ;45(11):1563-71.
25. Massari ME, Murre C. Helix-loop-helix proteins: regulators of transcription
in eucaryotic organisms. Mol Cell Biol 2000;20(2):429-40.
26. Yamashita H, Takenoshita M, Sakurai M, Bruick RK, Henzel WJ, Shillinglaw
W, et al. A glucose-responsive transcription factor that regulates
carbohydrate metabolism in the liver. Proc Natl Acad Sci U S A
2001;98(16):9116-21.
27. Chutkow WA, Patwari P, Yoshioka J, Lee RT. Thioredoxin-interacting
protein (Txnip) is a critical regulator of hepatic glucose production. J Biol
Chem 2008;283(4):2397-406.
28. Im SS, Kim MY, Kwon SK, Kim TH, Bae JS, Kim H, et al. Peroxisome
proliferator-activated receptor {alpha} is responsible for the up-regulation
of hepatic glucose-6-phosphatase gene expression in fasting and db/db Mice.
J Biol Chem 2011;286(2):1157-64.
29. Agius L. High-carbohydrate diets induce hepatic insulin resistance to protect
the liver from substrate overload. Biochem Pharmacol 2013;85(3):306-12.

75
30. Arden C, Petrie JL, Tudhope SJ, Al-Oanzi Z, Claydon AJ, Beynon RJ, et al.
Elevated glucose represses liver glucokinase and induces its regulatory
protein to safeguard hepatic phosphate homeostasis. Diabetes
2011;60(12):3110-20.
31. Mayes PA. Intermediary metabolism of fructose. Am J Clin Nutr 1993;58(5
Suppl):754S-65S.
32. Chou JY, Mansfield BC. Mutations in the glucose-6-phosphatase-alpha
(G6PC) gene that cause type Ia glycogen storage disease. Hum Mutat
2008;29(7):921-30.
33. Borgius LJ, Steffensen KR, Gustafsson JA, Treuter E. Glucocorticoid
signaling is perturbed by the atypical orphan receptor and corepressor SHP.
J Biol Chem 2002;277(51):49761-6.
34. Jung D, Kullak-Ublick GA. Hepatocyte nuclear factor 1 alpha: a key
mediator of the effect of bile acids on gene expression. Hepatology
2003;37(3):622-31.
35. Kim JY, Kim HJ, Kim KT, Park YY, Seong HA, Park KC, et al. Orphan
nuclear receptor small heterodimer partner represses hepatocyte nuclear
factor 3/Foxa transactivation via inhibition of its DNA binding. Mol
Endocrinol 2004;18(12):2880-94.
36. Yamagata K, Daitoku H, Shimamoto Y, Matsuzaki H, Hirota K, Ishida J Y,
et al. Bile acids regulate gluconeogenic gene expression via small
heterodimer partner-mediated repression of hepatocyte nuclear factor 4 and
Foxo1. J Biol Chem 2004;279(22):23158-65.
76
37. Ma K, Saha PK, Chan L, Moore DD. Farnesoid X receptor is essential for
normal glucose homeostasis. J Clin Invest 2006;116(4):1102-9.
38. Lin CH, MacGurn JA, Chu T, Stefan CJ, Emr SD. Arrestin-related
ubiquitin-ligase adaptors regulate endocytosis and protein turnover at the
cell surface. Cell 2008;135(4):714-25.
39. Rauch S, Martin-Serrano J. Multiple interactions between the ESCRT
machinery and arrestin-related proteins: implications for PPXY-dependent
budding. J Virol 2011;85(7):3546-56.
40. Zhang P, Wang C, Gao K, Wang D, Mao J, An J, et al. The ubiquitin ligase
itch regulates apoptosis by targeting thioredoxin-interacting protein for
ubiquitin-dependent degradation. J Biol Chem 2010;285(12):8869-79.
41. Hanson RW, Reshef L. Regulation of phosphoenolpyruvate carboxykinase
(GTP) gene expression. Annu Rev Biochem 1997;66:581-611.
42. Jiang W, Wang S, Xiao M, Lin Y, Zhou L, Lei Q, et al. Acetylation
regulates gluconeogenesis by promoting PEPCK1 degradation via recruiting
the UBR5 ubiquitin ligase. Mol Cell 2011;43(1):33-44.
43. Poupeau A, Postic C. Cross-regulation of hepatic glucose metabolism via
ChREBP and nuclear receptors. Biochim Biophys Acta 2011;1812(8):995-
1006.
44. Stoltzman CA, Peterson CW, Breen KT, Muoio DM, Billin AN, Ayer DE.
Glucose sensing by MondoA:Mlx complexes: a role for hexokinases and
direct regulation of thioredoxin-interacting protein expression. Proc Natl
Acad Sci U S A 2008;105(19):6912-7.

77
Abstract (in Korean)
간 조직의 포도당항상성 유지에서 TXNIP의 역할
<지도교수 안 용 호>
연세대학교 의과대학 의과학과
조 성 호
Thioredoxin interacting protein (TXNIP)는 활성산소종의 발생,
세포사멸, 염증반응 그리고 세포의 포도당 대사과정 등에서 다양한
역할을 한다. TXNIP는 고혈당 상태에서 발현이 증가되고 다양한
조직에서 포도당 흡수를 저해하여 체내 포도당 항상성의 불균형을
일으킨다. 비록 TXNIP가 포도당 대사과정과 관련된 대사성 질환인

78
비만과 제 1, 2형 당뇨병과 관련이 있다고 보고되어 있지만 간장에서
TXNIP의 역할은 자세히 보고되지 않았다. 본 연구에서는 간장에서
대사성 질환과 관련된 TXNIP의 역할을 밝히기 위하여 생쥐의 간에
TXNIP가 결합된 아데노바이러스 (Ad-Txnip)를 처리하여 복강 내
당부하 검사 (IPGTT), 인슐린 저항성 검사 (ITT) 그리고 피루브산염
저항성 검사 (PTT)를 시행하였고 그 결과 저항성이 약화되는 것을
보였다. Ad-Txnip의 처리 후, 생쥐의 간장조직과 일차 간세포 배양에서
실시간 중합효소연쇄반응 (qPCR)과 웨스턴블롯 분석을 이용하여
글루코오스-6-포스파타아제 (G6pc)의 발현 증가와 클루코키나아제
(Gck)의 발현 감소를 확인하였다. 간장 조직에서 증가된 TXNIP
발현에 따른 G6pc 발현 증가를 연구하기 위하여 포도당신생합성
과정에서 저해적인 역할을 하는 small heterodimer partner (SHP)와
TXNIP의 상호작용을 확인하고 이에 따라 G6pc의 발현이 조절되는
것을 확인하였다. 그리고 Txnip 유전자 발현조절을 연구하기 위하여
Txnip promoter를 이용한 luciferase assay와 염색질 면역침전반응 (ChIP)
을 수행하여 Txnip 발현을 조절하는 carbohydrate response element
binding protein (ChREBP)와 transcription factor E3 (TFE3)의 연관성을
확인하였다. 뿐만 아니라 당뇨병 질환 생쥐 모델에 TFE3가 결합된
아데노바이러스 (Ad-Tfe3)를 처리하여 Txnip 발현이 감소하는 것을

79
확인하고 이는 TFE3가 Txnip promoter의 E-box에서 ChREBP와
경쟁적인 관계를 통해 Txnip의 발현을 저해하는 역할을 한다고
추정된다. 이런 발견은 TXNIP가 SHP와 상호작용을 통하여 G6pc
발현이 증가하여 포도당 및 인슐린 저항성을 약화시키며 이를
조절하는 것은 당뇨병에 의한 고혈당 상태를 개선하는데 도움이
된다고 설명할 수 있다.
핵심되는 말: TXNIP, SHP, ChREBP, TFE3, G6PC, GCK, 포도당신생합성,
전사적 조절