Embed Size (px)
Citation preview
Ecological Applications, 25(4), 2015, pp. 1016–1033� 2015 by the Ecological Society of America
The role of wood hardness in limiting nest site selection in aviancavity excavators
TERESA J. LORENZ,1,4 KERRI T. VIERLING,1 TIMOTHY R. JOHNSON,2 AND PHILIP C. FISCHER3
1Department of Fish and Wildlife Sciences, University of Idaho, P.O. Box 441136, Moscow, Idaho 83844 USA2Department of Statistical Sciences, University of Idaho, Moscow, Idaho 83844 USA
3Retired Civil Engineer, 1405 Jesica Drive, Selah, Washington 98942 USA
Abstract. Woodpeckers and other primary cavity excavators (PCEs) are importantworldwide for excavating cavities in trees, and a large number of studies have examined theirnesting preferences. However, quantitative measures of wood hardness have been omittedfrom most studies, and ecologists have focused on the effects of external tree- and habitat-levelfeatures on nesting. Moreover, information is lacking on the role of wood hardness in limitingnesting opportunities for this important guild. Here, we used an information theoreticapproach to examine the role of wood hardness in multi-scale nest site selection and in limitingnesting opportunities for six species of North American PCEs. We found that interior woodhardness at nests (n¼ 259) differed from that at random sites, and all six species of PCE hadnests with significantly softer interior wood than random trees (F1, 517¼ 106.15, P , 0.0001).Accordingly, interior wood hardness was the most influential factor in our models of nest siteselection at both spatial scales that we examined: in the selection of trees within territories andin the selection of nest locations on trees. Moreover, regardless of hypothesized excavationabilities, all the species in our study appeared constrained by interior wood hardness, and only4–14% of random sites were actually suitable for nesting. Our findings suggest that paststudies that did not measure wood hardness counted many sites as available to PCEs whenthey were actually unsuitable, potentially biasing results. Moreover, by not accounting for nestsite limitations in PCEs, managers may overestimate the amount of suitable habitat. Wetherefore urge ecologists to incorporate quantitative measures of wood hardness into PCE nestsite selection studies, and to consider the limitations faced by avian cavity excavators in forestmanagement decisions.
Key words: Black-backed Woodpecker; nest limitations; nest site selection; primary cavity excavator;resource selection; secondary cavity user; snag decay class; White-headed Woodpecker; wood hardness; woodmass density.
INTRODUCTION
Most woodpeckers (Piciformes: Picidae) are members
of an important and influential guild called primary
cavity excavators (PCEs). PCEs are ecosystem engineers
that are unique among vertebrates because of their
ability and propensity to excavate nest cavities in solid
wood. They also differ from the majority of birds that
construct nests with materials from the external
environment surrounding nest sites because the nests
of PCEs are entirely constructed by removing wood
from a tree’s interior. This makes the nest sites of PCEs
relatively well protected against environmental variabil-
ity and predators, and many vertebrates that cannot
excavate wood themselves readily use and compete for
old, vacant PCE nests (Martin et al. 2004, Aitken and
Martin 2008, Gentry and Vierling 2008). This guild of
animals, called secondary cavity users (SCUs), is large
and diverse. In some regions, SCUs comprise up to one-
third of all vertebrate species and include all major taxa
(Bunnell et al. 1999). Because of this, many species of
PCE are considered both ecosystem engineers and
ecological keystones (Daily et al. 1993, Bednarz et al.
2004, Blanc and Walters 2008), and the presence of
PCEs has well-documented and far-reaching effects on
species richness and ecosystem health (Lindenmayer et
al. 2000, Virkkala 2006, Drever et al. 2008).
Given their importance, a great deal of research has
focused on PCE nesting ecology, especially nest site
selection. Despite this attention, however, research
studies have come to different conclusions about
influential factors in nest site selection. These differences
began more than 50 years ago, when some early studies
suggested that PCEs select sites based on external
tree- or habitat-level factors, such as tree size, tree
species, and vegetation cover (e.g., Lawrence 1967).
Others proposed that internal wood density drove PCE
nest site selection (Conner et al. 1976, Miller and Miller
1980), and PCEs selected sites with ‘‘soft’’ or ‘‘decayed’’
wood (Kilham 1971, Conner et al. 1976, Miller and
Manuscript received 6 June 2014; revised 24 October 2014;accepted 5 November 2014. Corresponding Editor: J. M.Marzluff.
4 E-mail: [email protected]
1016
Miller 1980, Daily 1993) rather than trees with
particular external features or characteristics. More
recently, research studies have come to different
conclusions even for the same species of PCE. For
selection of nest trees within territories (third-order
selection; Johnson 1980), Saab et al. (2009) reported that
tree size and surrounding snag density were important
for selection by Hairy Woodpeckers (Picoides villosus),
while Schepps et al. (1999) concluded Hairy Woodpeck-
ers select sites based on wood hardness.
Some of this dichotomy may stem from the fact that,
while methods for measuring external tree- and habitat-
level features have been available for decades, methods
for quantifying wood density lagged behind. An
economical and practical tool for estimating wood
density inside PCE nest trees was not available until
Matsuoka (2000) improved on Schepps et al.’s (1999)
method for measuring wood hardness. In lieu of
quantitative measures, studies have used visual indica-
tions of wood decay, such as the presence of fungal
conks (Pasinelli 2007, Cockle et al. 2012) or tree decay
classes (Martin et al. 2004, Vierling et al. 2008, Bonnot
et al. 2009, Wightman et al. 2010) as a surrogate for
wood density. However, recent research has revealed
two downsides of such visual markers for predicting
PCE use. First, PCE nest trees do not always display
fungal fruiting bodies even when wood decay fungi are
present (Conner et al. 1976). Secondly, when tested in
forestry studies, decay classes at best only roughly
correlate with wood density (Saint-Germain et al. 2007,
Aakala 2010, Strukelj et al. 2013). Probably because of
these shortcomings, PCEs reportedly use a variety of
decay classes, ranging from entirely live trees with no
conks or defects, to trees in advanced decay classes,
indicating that fungal conks and decay classes are fairly
unreliable indicators of nest site availability.
While past studies have advanced our understanding
of PCE nest site selection in multiple ways, incorporat-
ing quantitative measures of wood harness might
advance our understanding further. In particular,
studies are needed that simultaneously consider the
effects of external habitat-level factors and wood
hardness on nest site selection. We reviewed a large
number of studies published since Schepps et al. (1999)
and Matsuoka (2000) that modeled habitat-level factors
in nest site selection, but did not quantify wood hardness
(Martin et al. 2004, Vierling et al. 2008, Bonnot et al.
2009, Saab et al. 2009, Wightman et al. 2010,
Hollenbeck et al. 2011). Meanwhile, the only studies
we found that quantified wood hardness restricted their
analysis of nest site selection to nest tree factors
(Schepps et al. 1999), measured hardness but did not
specifically examine nest site selection (Matsuoka 2008,
Tozer et al. 2009), or measured hardness only at the
outer surface of trees (Schepps et al. 1999, Tozer et al.
2009), when early studies indicated that interior wood
hardness was more important (Conner et al. 1976, Miller
and Miller 1980). Assuming that wood hardness is an
influential factor, information is also needed on what
proportion of wood in different decay classes is suitable
for PCE nesting, and whether external features of trees
can be used to estimate nest site availability for PCEs.
While forestry studies have measured wood hardness for
trees in different decay classes, this information has not
been used to estimate PCE nest site availability because
there is no quantitative information on the density of
wood at nests for any North American PCE. Such
information would also be important for determining
whether PCEs have nest site limitations similar to SCUs
(Newton 1994, Martin et al. 2004, Wiebe 2011).
Given these information gaps, we designed a study to
examine the role of wood hardness in PCE nest site
selection and in limiting nesting opportunities. We had
four primary objectives. First, we compared wood
hardness at nests to wood at random sites, to determine
whether nest wood was distinctive and limiting in
natural systems. Second, we explored variation in wood
hardness for nests of different species of PCE, and we
tested whether species differed in their excavation
abilities. Third, we examined the relative role of wood
hardness in nest site selection by PCEs. To do this, we
modeled wood hardness in comparison with external
tree- and habitat-level features that have been implicated
in past studies of nest site selection by PCEs. We tested
for selection at two spatial scales: selection of nest trees
within territories and selection of nest cavities on trees.
Lastly, we examined whether external features of trees
were a reliable indicator of interior wood hardness. We
did this by comparing wood hardness for random trees
within different decay classes and with different external
properties.
METHODS
Study area and study species
We conducted this study from 2011 through 2013 in
the eastern Cascade Range of Washington State, USA,
in Yakima, Kittitas, and Chelan Counties (approxi-
mately 478000 N and 1218000 W). Land ownership
included private, state, and the United States Forest
Service. We searched for nests in all major forest types
native to the eastern Cascade Range, including ponder-
osa pine (Pinus ponderosa), Douglas-fir (Pseudotsuga
menziesii ), grand fir (Abies grandis), western hemlock
(Tsuga heterophylla), subalpine fir (Abies lasiocarpa),
and western larch (Larix occadentalis) forests (Lilly-
bridge et al. 1995). Elevation ranged from 350 m to 2000
m, and dominant tree species varied among sites and by
elevation. In general, 1350-m elevation marked the
division between lower elevation ponderosa pine and
Douglas-fir forest types and higher elevation grand fir or
western larch forest types (Lillybridge et al. 1995). Some
forests had been burned in U.S. Forest Service
prescribed burns or wildfires in the last 10 years, and
nests were found in patches ranging from unburned to
severely burned (100% mortality of overstory trees).
June 2015 1017WOOD HARDNESS AND CAVITY EXCAVATORS
We selected six species of PCEs for our study that
occur in forests of western North America: American
Three-toed Woodpecker (Picoides dorsalis), Black-
backed Woodpecker (P. arcticus), Hairy Woodpecker,
Northern Flicker (Colaptes auratus), White-headed
Woodpecker (P. albolarvatus), and Williamson’s Sap-
sucker (Sphyrapicus thyroideus). We chose these species
because they represent two presumed but unconfirmed
guilds in excavation ability among PCEs. American
Three-toed, Black-backed, and Hairy Woodpeckers
have been classified as ‘‘strong’’ excavators (Dudley
and Saab 2003, Edworthy et al. 2012), compared to
Northern Flicker, White-headed Woodpecker, and
Williamson’s Sapsucker (Saab and Dudley 1998,
Schepps et al. 1999, Bunnell 2013).
Field methods
We searched for PCE nests from March through July,
2011–2013, in 10 study sites ;600–3000 ha in size. We
searched for nests in both live and dead trees. To make
finding nests easier, we used playbacks of calls and
drumming to locate adult birds (Johnson et al. 1981) and
followed adults until we located their nest cavities. We
considered nests occupied if we observed eggs or
nestlings using inspection cameras (Cen-tech, Camarillo,
California, USA) or if adult behavior indicated that
incubation or nestling feeding was underway (Jackson
1977), and we marked the locations of all occupied nests
on portable GPS units. PCEs may reuse cavities among
years, and for nests that we found after nest excavation,
we looked for fresh wood chips on the ground
surrounding nests to determine whether nests were
current-year excavations.
After the nesting season, we returned to all current-
year nests and measured vegetation features that were
hypothesized to influence PCE nest site selection in past
studies. We measured the diameter at breast height
(dbh) of the nest tree, nest and tree height, and noted the
species of tree. Most nests were in standing dead trees
(hereafter, snags) and for these nests, we examined the
remaining bark, tree growth form, and other features to
determine species following Parks et al. (1997). We used
a compass to determine the orientation of the nest cavity
entrance, a spherical densitometer to estimate canopy
cover at the nest tree, and estimated the proportion of
the ground covered by shrubs within a 5 m radius plot
(Martin et al. 1997). We also measured the dbh and
noted the species of all trees and snags within 11.3 m of
the nest for trees and snags at least 1.4 m height and 8
cm dbh (Martin et al. 1997). These measures were used
to calculate tree and snag density at nest sites. We then
estimated prefire canopy cover at nest sites because Saab
et al. (2009) suggested it is important for nest site
selection in Black-backed Woodpeckers. To estimate
prefire canopy cover we used Gradient Nearest Neigh-
bor (GNN) Classified Landsat (ETMþ) satellite imagery
flown between two and eight years prior to each fire
(IMAP: Interagency mapping and assessment project,
Landscape Ecology Mapping Modeling and Analysis
[LEMMA]; available online).5 This data set averaged
prefire canopy cover within 30 3 30 m pixels, and for
nests we assumed that the canopy cover from each 30 3
30 m pixel was representative of canopy cover at the
actual nest site. We used ArcGIS 10 (ESRI 2010) to
extract these data for nest sites.
For assessing nest site selection at the territory scale,
we measured all of the features mentioned in the
previous paragraph at one random tree associated with
each nest. We included only snags in our sample of
random trees, since only a small proportion of nests
occurred in live trees. We selected random snags by
walking .75 m from nests in a random orientation until
we encountered a snag within ;10 m of the bearing.
Following Bonnot et al. (2009), we assumed that nest
territories were no greater than 250 m radius. Therefore,
if no snag was encountered within 250 m of a nest site,
we returned to the nest and selected another random
orientation. For random snags, we included only those
larger than 20 cm for the large-bodied Northern Flicker
and 15 cm for the smaller woodpeckers and sapsuckers,
because this corresponded to the smallest dbh trees used
in our study by the large- and small-bodied PCEs,
respectively.
Characterizing wood hardness at nests and random sites
At each nest site we measured the hardness of wood
using a method developed by Matsuoka (2000) in which
wood mass density is proportional to the torque
required to spin an increment borer into a pre-drilled
hole. It is similar to the more commonly used resisto-
graph (Isik and Li 2003, Farris et al. 2004), but requires
the operator to manually record torque associated with
predetermined distance increments. We accessed cavities
.2 m high using climbing ladders, tree climbing spikes,
and by felling snags, although we minimized felling to
extremely high cavities or unstable snags (,1% of all
snags).
As suggested by Matsuoka (2000), we used torque
measured in newton meters (N�m) for all statistical
analysis involving wood hardness, although we also
present summary statistics on wood mass density
(Appendix A). In the first year of our study, the
horizontal depth of our widest cavity was 14 cm, so
we measured hardness at 1-cm increments, beginning at
the tree’s surface and ending 15 cm deep toward the
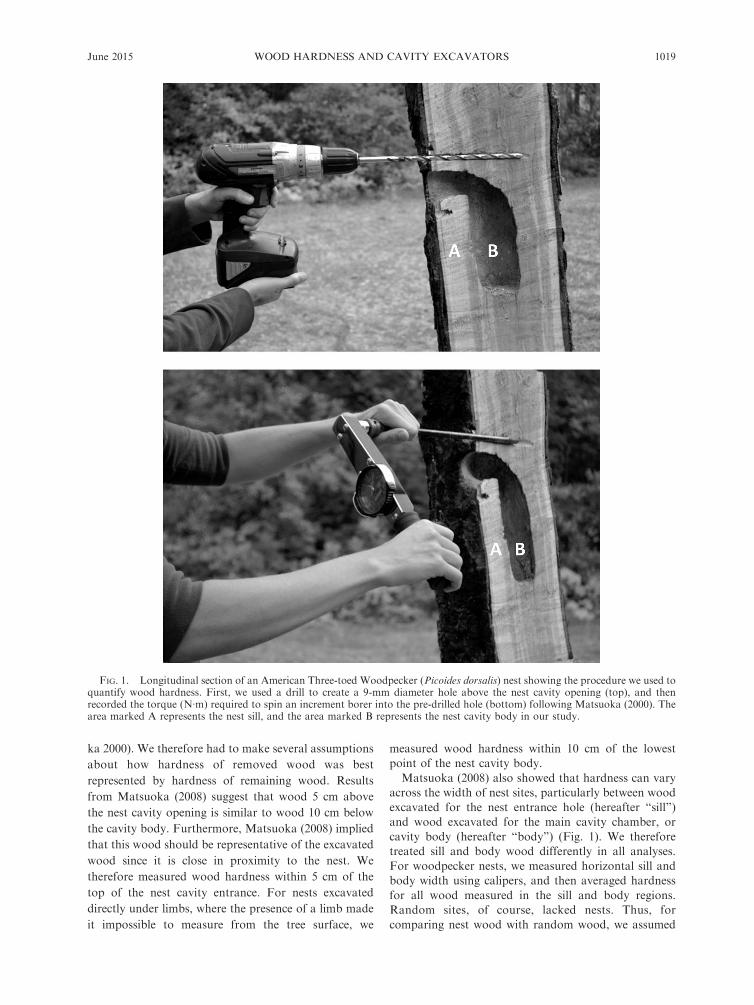
heartwood, similar to Farris et al. (2004) (Fig. 1). Thus,
for each hardness measurement, we measured hardness
at one spot on the exterior of the tree, but recorded 16
measures of wood hardness as we drilled in toward the
tree’s center.
A fundamental problem with this method is that it is
impossible to measure the hardness of wood that has
already been removed by PCEs (Conner 1977, Matsuo-
5 http://lemma.forestry.oregonstate.edu/data
TERESA J. LORENZ ET AL.1018 Ecological ApplicationsVol. 25, No. 4
ka 2000). We therefore had to make several assumptions
about how hardness of removed wood was best
represented by hardness of remaining wood. Results
from Matsuoka (2008) suggest that wood 5 cm above
the nest cavity opening is similar to wood 10 cm below
the cavity body. Furthermore, Matsuoka (2008) implied
that this wood should be representative of the excavated
wood since it is close in proximity to the nest. We
therefore measured wood hardness within 5 cm of the
top of the nest cavity entrance. For nests excavated
directly under limbs, where the presence of a limb made
it impossible to measure from the tree surface, we
measured wood hardness within 10 cm of the lowest
point of the nest cavity body.
Matsuoka (2008) also showed that hardness can vary
across the width of nest sites, particularly between wood
excavated for the nest entrance hole (hereafter ‘‘sill’’)
and wood excavated for the main cavity chamber, or
cavity body (hereafter ‘‘body’’) (Fig. 1). We therefore
treated sill and body wood differently in all analyses.
For woodpecker nests, we measured horizontal sill and
body width using calipers, and then averaged hardness
for all wood measured in the sill and body regions.
Random sites, of course, lacked nests. Thus, for
comparing nest wood with random wood, we assumed
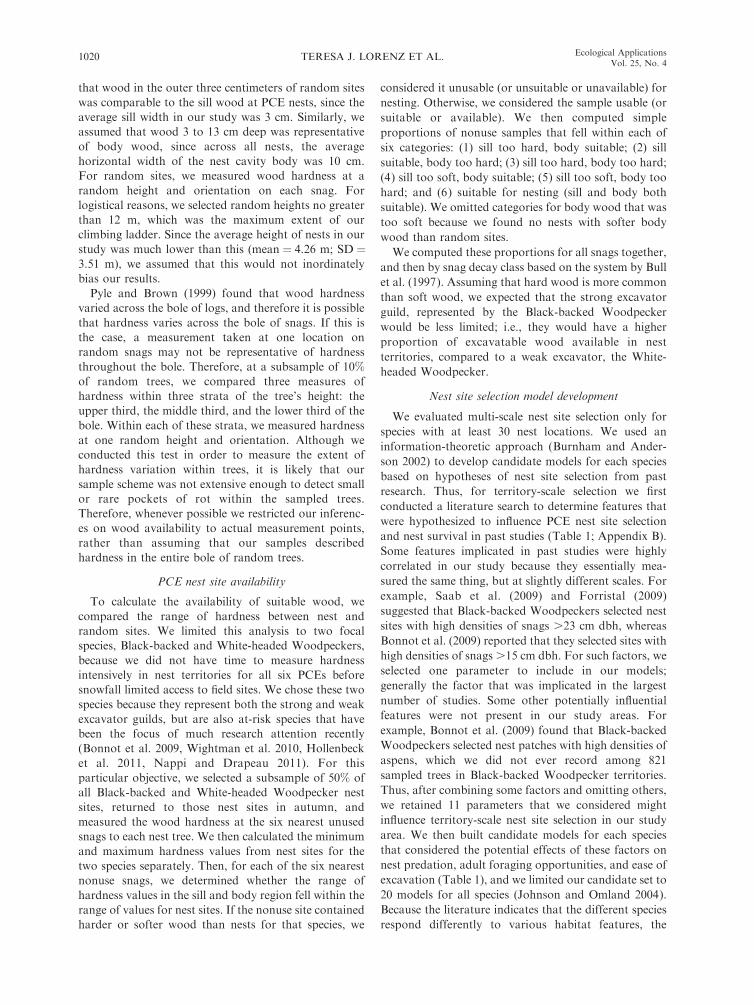
FIG. 1. Longitudinal section of an American Three-toed Woodpecker (Picoides dorsalis) nest showing the procedure we used toquantify wood hardness. First, we used a drill to create a 9-mm diameter hole above the nest cavity opening (top), and thenrecorded the torque (N�m) required to spin an increment borer into the pre-drilled hole (bottom) following Matsuoka (2000). Thearea marked A represents the nest sill, and the area marked B represents the nest cavity body in our study.
June 2015 1019WOOD HARDNESS AND CAVITY EXCAVATORS
that wood in the outer three centimeters of random sites
was comparable to the sill wood at PCE nests, since the
average sill width in our study was 3 cm. Similarly, we
assumed that wood 3 to 13 cm deep was representative
of body wood, since across all nests, the average
horizontal width of the nest cavity body was 10 cm.
For random sites, we measured wood hardness at a
random height and orientation on each snag. For
logistical reasons, we selected random heights no greater
than 12 m, which was the maximum extent of our
climbing ladder. Since the average height of nests in our
study was much lower than this (mean ¼ 4.26 m; SD ¼3.51 m), we assumed that this would not inordinately
bias our results.
Pyle and Brown (1999) found that wood hardness
varied across the bole of logs, and therefore it is possible
that hardness varies across the bole of snags. If this is
the case, a measurement taken at one location on
random snags may not be representative of hardness
throughout the bole. Therefore, at a subsample of 10%of random trees, we compared three measures of
hardness within three strata of the tree’s height: the
upper third, the middle third, and the lower third of the
bole. Within each of these strata, we measured hardness
at one random height and orientation. Although we
conducted this test in order to measure the extent of
hardness variation within trees, it is likely that our
sample scheme was not extensive enough to detect small
or rare pockets of rot within the sampled trees.
Therefore, whenever possible we restricted our inferenc-
es on wood availability to actual measurement points,
rather than assuming that our samples described
hardness in the entire bole of random trees.
PCE nest site availability
To calculate the availability of suitable wood, we
compared the range of hardness between nest and
random sites. We limited this analysis to two focal
species, Black-backed and White-headed Woodpeckers,
because we did not have time to measure hardness
intensively in nest territories for all six PCEs before
snowfall limited access to field sites. We chose these two
species because they represent both the strong and weak
excavator guilds, but are also at-risk species that have
been the focus of much research attention recently
(Bonnot et al. 2009, Wightman et al. 2010, Hollenbeck
et al. 2011, Nappi and Drapeau 2011). For this
particular objective, we selected a subsample of 50% of
all Black-backed and White-headed Woodpecker nest
sites, returned to those nest sites in autumn, and
measured the wood hardness at the six nearest unused
snags to each nest tree. We then calculated the minimum
and maximum hardness values from nest sites for the
two species separately. Then, for each of the six nearest
nonuse snags, we determined whether the range of
hardness values in the sill and body region fell within the
range of values for nest sites. If the nonuse site contained
harder or softer wood than nests for that species, we
considered it unusable (or unsuitable or unavailable) for
nesting. Otherwise, we considered the sample usable (or
suitable or available). We then computed simple
proportions of nonuse samples that fell within each of
six categories: (1) sill too hard, body suitable; (2) sill
suitable, body too hard; (3) sill too hard, body too hard;
(4) sill too soft, body suitable; (5) sill too soft, body too
hard; and (6) suitable for nesting (sill and body both
suitable). We omitted categories for body wood that was
too soft because we found no nests with softer body
wood than random sites.
We computed these proportions for all snags together,
and then by snag decay class based on the system by Bull
et al. (1997). Assuming that hard wood is more common
than soft wood, we expected that the strong excavator
guild, represented by the Black-backed Woodpecker
would be less limited; i.e., they would have a higher
proportion of excavatable wood available in nest
territories, compared to a weak excavator, the White-
headed Woodpecker.
Nest site selection model development
We evaluated multi-scale nest site selection only for
species with at least 30 nest locations. We used an
information-theoretic approach (Burnham and Ander-
son 2002) to develop candidate models for each species
based on hypotheses of nest site selection from past
research. Thus, for territory-scale selection we first
conducted a literature search to determine features that
were hypothesized to influence PCE nest site selection
and nest survival in past studies (Table 1; Appendix B).
Some features implicated in past studies were highly
correlated in our study because they essentially mea-
sured the same thing, but at slightly different scales. For
example, Saab et al. (2009) and Forristal (2009)
suggested that Black-backed Woodpeckers selected nest
sites with high densities of snags .23 cm dbh, whereas
Bonnot et al. (2009) reported that they selected sites with
high densities of snags .15 cm dbh. For such factors, we
selected one parameter to include in our models;
generally the factor that was implicated in the largest
number of studies. Some other potentially influential
features were not present in our study areas. For
example, Bonnot et al. (2009) found that Black-backed
Woodpeckers selected nest patches with high densities of
aspens, which we did not ever record among 821
sampled trees in Black-backed Woodpecker territories.
Thus, after combining some factors and omitting others,
we retained 11 parameters that we considered might
influence territory-scale nest site selection in our study
area. We then built candidate models for each species
that considered the potential effects of these factors on
nest predation, adult foraging opportunities, and ease of
excavation (Table 1), and we limited our candidate set to
20 models for all species (Johnson and Omland 2004).
Because the literature indicates that the different species
respond differently to various habitat features, the
TERESA J. LORENZ ET AL.1020 Ecological ApplicationsVol. 25, No. 4
number of candidate models differed by species and
ranged from 12 to 18 models.
For most species in this study, selection for a site on a
tree had not been examined in past research studies.
Thus, for the selection of a site on a nest tree, we
included four covariates for all species: cavity orienta-
tion, cavity height, body wood hardness, and sill wood
hardness. For this analysis, orientation was divided into
four categories around the ordinal directions: north as
315–458, east as 46–1158, south as 116–2058, and west as
206–2958. Similar to territory-scale selection, we built
models for each species that considered the effects of
nest predation, ease of excavation, and also nest
thermoregulation on nest site selection.
Tree external appearance and wood hardness
Snag decay classification systems are a common
means of grouping snags into categories that are
assumed to reflect the underlying wood hardness and
associated decay. However, we could find no past
woodpecker studies that tested whether snag decay
classes provided accurate information on wood hardness
in a tree’s interior. Therefore, we noted the decay class
for every tree and snag sampled in our study using three
established classification systems that have been used in
past studies with our focal species. For these systems,
trees are classified into three (Bull et al. 1997; hereafter
Bull), five (Cline et al. 1980; hereafter Cline), or nine
classes (Thomas et al. 1979, hereafter Thomas) based on
TABLE 1. Description of model parameters used to examine nest site selection by four primary cavity excavators (PCEs) in centralWashington, USA, 2011–2013.
Possible variables Parameter BBWO HAWO NOFL WHWO Hypothesized reason Source
Territory scale
Nest tree dbh dbh x x x x protection from predationand/or search image
3, 4, 8, 9, 10, 12, 13, 15,17, 19, 20, 21
Snag decay classfrom Cline
cline x x x x protection from predation,ease of excavation, and/or search image
3, 4, 9, 10, 13, 17, 19
Nest tree sill woodhardness
sill x x x x protection from predation,thermoregulation, orease of excavation
1, 5, 16, 20
Nest tree body woodhardness
body x x x x ease of excavation 2, 11
Density of live trees.50 cm dbh nearnest
dlive50 x preferred foraging habitat 8, 18
Density of live trees.10 cm dbh nearnest
dlive10 x x x protection from predation 4, 22
Density of snags .23cm dbh near nest
dsnag x x x preferred foraging habitat 4, 7, 13, 14, 15, 19, 22
Prefire canopy cover prefire x preferred foraging habitat 15Shrub cover around
nestshrub x protection from predation 22
Percent slope at nest slope x unknown (perhaps relatedto travel ease and thuspredation)
8, 18
Percent canopy coverat nest
canopy x x protection from predation,thermoregulation, and/orpreferred foraginghabitat
6, 18
Nest tree scale
Nest cavityorientation
orientation x x x x . . .
Nest cavity height height x x x x . . .Nest tree sill wood
hardnesssill x x x x . . .
Nest tree body woodhardness
body x x x x . . .
Notes: An ‘‘x’’ indicates that the given parameter was included in models for that species. The PCE species are: BBWO, Black-backed Woodpecker (Picoides arcticus); HAWO, Hairy Woodpecker (P. villosus); NOFL Northern Flicker (Colaptes auratus); andWHWO, White-headed Woodpecker (P. albolarvatus). The hypothesized reason for including a given parameter was sometimesbased on our interpretation of study results; the sources used to create this table did not always provide a reason for the importanceof the different parameters. An ellipsis indicates a lack of research on nest site selection; thus we included all possible parametersand did not attempt to provide a hypothesized reason. Sources are: 1, Conner 1977; 2, Miller and Miller 1980; 3, Raphael andWhite 1984; 4, Saab and Dudley 1998; 5, Schepps et al. 1999; 6, Wiebe 2001; 7, Saab et al. 2002; 8, Buchanan et al. 2003; 9, Spieringand Knight 2005; 10, Bagne et al. 2008; 11, Matsuoka 2008; 12, Vierling et al. 2008; 13, Bonnot et al. 2009; 14, Forristal 2009; 15,Saab et al. 2009; 16, Tozer et al. 2009; 17, Wightman et al. 2010; 18, Hollenbeck et al. 2011; 19, Nappi and Drapeau 2011; 20, Strauset al. 2011; 21, Cooke and Hannon 2012; and 22, Kozma and Kroll 2012. See Appendix B for sources used to create this table andAppendix C for the set of final models.
June 2015 1021WOOD HARDNESS AND CAVITY EXCAVATORS
whether they are alive or dead, the amount of bark
remaining, condition of the top (intact or broken), and
condition of the limbs (limbs or branches intact or
broken), and higher numbers are supposed to indicate
more advanced stages of decay (Table 2). We then tested
whether wood hardness varied by decay class.
As noted by others (e.g., Larjavaara and Muller-
Landau 2010), snag decay classes are inherently
subjective; many trees are difficult to place into
categories because they do not lose their bark, top, or
limbs following the progression described by the various
decay classes. Therefore, for each tree we also noted the
approximate percentage of each of these features
remaining. We then counted the number of old
woodpecker cavities and starts, estimated the proportion
of the tree surface that was blackened from fire, and
noted the presence of fungal conks and woodpecker
foraging evidence, using Farris et al. (2004) as a guide.
We then related wood hardness at these trees with their
external characteristics to determine if any external
features were reliable predictors of internal wood
hardness.
Statistical analysis
We used two-way repeated-measures ANOVA tocompare hardness between the nest sill and body, and
between nests of different species and random samples,where sill and body wood were treated as repeated, or
within-subjects factors, and species was treated as abetween-subjects factor. For this analysis we combined
all random samples into a separate group to comparewith samples from the nests of the different PCE species.
Thus, our between-subjects factor had seven levels, onefor nests of each of the six species of PCE and one for
random samples. We used one-way repeated-measuresANOVA to test for differences in wood hardness at
different heights within random trees, and simple, one-way ANOVA to compare wood hardness for trees
within different snag decay classes. Whenever appropri-ate, data were assessed for normality. When overall F
statistics indicated a significant difference among means,we used post hoc multiple comparison Tukey-Kramertests.
We used multiple regression to determine whether any
external features of random snags were reliable predic-tors of wood hardness. Variables considered as possiblepredictors were the percentage of bark, branches,
needles, limbs, and top remaining on the snag,percentage of bark that was blackened from fire, and
the presence of fungal conks, woodpecker foragingevidence, and old cavities or cavity starts. We looked for
correlations among explanatory variables beforehand,and found that branches, needles, and limbs were
correlated. Consequently, we omitted limbs and needlesfrom our final model. We assessed model fit using R2
and looked for violations of model assumptions usingstandard residual tests and diagnostic plots.
To compare different models of nest site selection byPCEs, we used conditional logistic regression models
with matched-pairs case–control sampling, and wherethe ‘‘cases’’ were nest sites and the ‘‘controls’’ were
random sites (Keating and Cherry 2004). Prior tobuilding our models we assessed possible correlations
between all pairwise combinations of covariates andomitted covariates if their coefficient . 0.5. We usedAkaike’s Information Criterion corrected for small
sample sizes (AICc) to assess the amount of supportfor the different models. Based on Akaike weights, we
considered models in the 90% confidence set ofcandidate models as the best approximating models
given the data. For each variable in the 90% confidenceset we computed model averaged parameter estimates,
their standard errors, and 95% confidence intervals(61.96 SE), following Mazerolle (2006) and Symonds
and Moussalli (2011). When confidence intervals did notinclude 0, we concluded that the associated parameter
had an effect on nest site selection. To assess theimportance of variables, we computed a relative
importance value by summing the Akaike weights (wi )for all models containing each variable, and for
variables with equal representation across models
TABLE 2. Description of snag decay classes by Thomas, Cline,and Bull used to categorize snags in central Washington,USA, 2011–2013.
Class Description
Thomas
1 Live tree with no defects2 Live tree with defects3 Snag with limbs bark and top present4 Snag with top remaining, but some bark and limbs
absent5 Snag with top remaining, some limbs absent, and
all bark absent6 Snag with some top missing, and all limbs and
bark absent7 Snag with most of top missing, and all limbs and
bark absent8 Stump-sized snag (no bark or limbs) with top lying
at base9 Stump-sized snag (no bark or limbs) with top
disintegrated
Cline
1 Snag with top, branches, limbs, and bark 100%intact
2 Snag with few limbs, no fine branches, broken top,and variable bark sloughing
3 Snag with limb stubs only, broken top, andvariable bark sloughing
4 Snag with few or no limb stubs, broken top, andvariable bark sloughing
5 Snag with no limb stubs, broken top, and 20%bark remaining
Bull
1 Snag retaining 100% of its bark, branches, and top2 Snag that has lost some bark, branches, and often
a portion of the top3 Snag missing bark, most of the branches, and has a
broken top
Note: Data sources for each system are: Bull (Bull et al.1997), Cline (Cline et al. 1980), and Thomas (Thomas et al.1979).
TERESA J. LORENZ ET AL.1022 Ecological ApplicationsVol. 25, No. 4
(Burnham and Anderson 2002). For variables that
showed quasi-complete separation, we computed pa-
rameter estimates using Firth’s penalized maximum
likelihood method (Firth 1993) following recommenda-
tions by Allison (2008).
Goodness-of-fit tests for conditional logistic regres-
sion in case–control studies have not been well
developed, except for very special cases (Hosmer and
Lemeshow 1985, Arbogast and Lin 2004), and the lack
of predicted probabilities preclude the use of tools like
prediction error and cross-validation. For all models in
our 90% confidence set we therefore provided likeli-
hood-based pseudo R2 measures based on McFadden’s
proposed measures of goodness of fit (McFadden 1973),
with the caveat that these do not necessarily have the
same properties as R2 values in linear regression with
least squares estimation, but they are roughly analo-
gous. We computed McFadden’s adjusted pseudo R2,
which penalizes models for including too many predic-
tors, and we considered values close to 1 as indicative of
adequate model predictive power.
We used SAS version 9.3 statistical software (SAS
Institute 2011) for all statistical analyses, and we
considered statistical results significant at a ¼ 0.05.
RESULTS
General characteristics of nest and random sites
We found 259 PCE nests across a range of forest types
and substrates. Most were in dead ponderosa pines
(53%) or Douglas-firs (24%). Seven nests (3%) occurred
in live trees, including live trembling aspen (Populus
tremuloides), ponderosa pine, and Douglas-fir. One nest
was excavated into the cedar siding of a cabin, two were
in cut stumps, and one was in a fallen log on the ground.
The remaining 19% of nests were in snags representing
seven other tree species: grand fir, subalpine fir,
trembling aspen, western red cedar (Thuja plicata),
western larch, lodgepole pine (Pinus contorta), and
Engelmann spruce (Picea engelmannii ). Average cavity
height was 4.26 m (range 0.00–23.68 m) and average nest
tree dbh was 41.90 cm (range 15.67–104.49 cm). The
smallest nest tree in our sample was used by a White-
headed Woodpecker (dbh¼ 15.67 cm) and the largest by
a Hairy Woodpecker (dbh ¼ 104.49 cm). For compar-
ison, average height of random sample locations was
4.12 m (range 0.76–16.74 m), and average dbh of
random trees was 38.40 cm (range 15.49–108.20 cm).
Characteristics of wood hardness at nests
and random sites
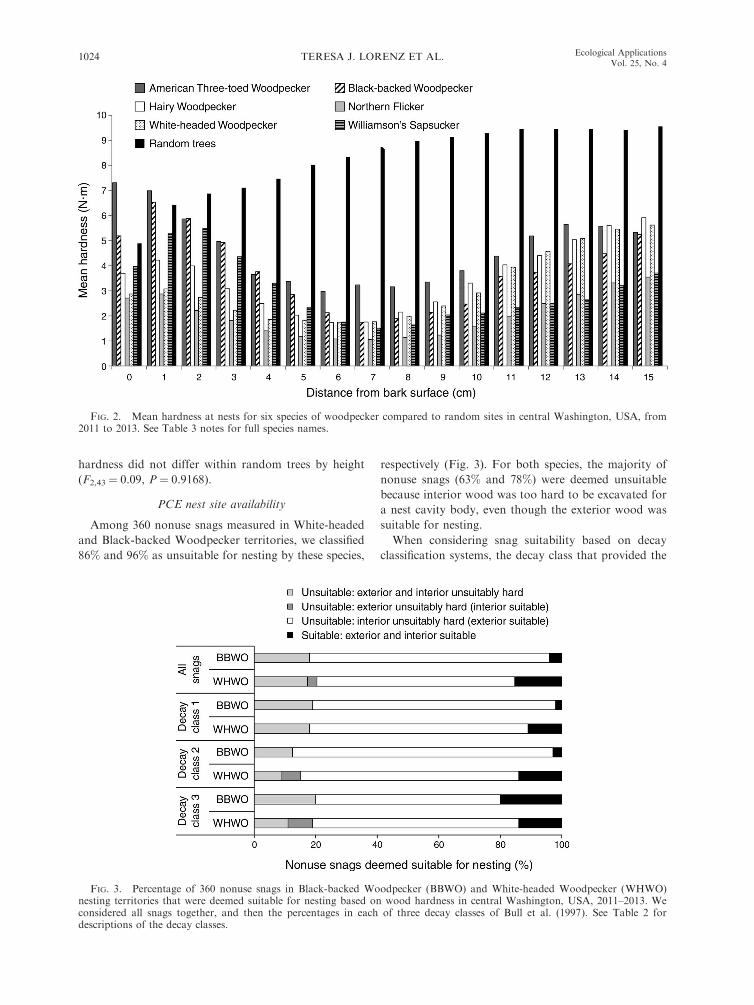
Mean wood hardness differed between the nest sill
and body regions (F1, 517 ¼ 65.66, P , 0.0001), and
between nests and random sites (F1, 517 ¼ 106.15, P ,
0.0001). For all PCE nests, wood in the sill region was
harder than wood in the body region, but for random
sites wood in the body region was harder (Table 3). This
resulted in a different hardness profile between nests and
random sites where nests showed a distinctive drop in
wood hardness in the tree interior, but samples from
random snags increased in hardness from the bark
surface until ;9 cm deep, at which point hardness
leveled off (Fig. 2). Nest sites also increased in hardness
beginning approximately 10 cm deep (Fig. 1), and
overall woodpeckers appeared to align the nest cavity
body with the patch of softest wood at each site.
For wood in the body region, we found no differences
in hardness by species, although random samples had
significantly harder body wood than nests for all species
(Table 3). For wood in the sill region, on average,
American Three-toed Woodpecker nests had the hardest
sills among all species, and Northern Flicker had the
softest sills. However, we observed considerable overlap
in minimum and maximum sill hardness among species.
For example, on average, Williamson’s Sapsucker and
White-headed Woodpecker had sills of intermediate
hardness, but they also had the hardest recorded sills of
any species (16.61 and 14.46 N�m, respectively; Table 3).
For assessing variation in hardness within trees, we
randomly selected a subsample of 23 random trees
(;10%) from our larger sample of all random trees. For
logistical reasons, we restricted this subsampling to
snags within 200 m of roads. For this subsample, wood
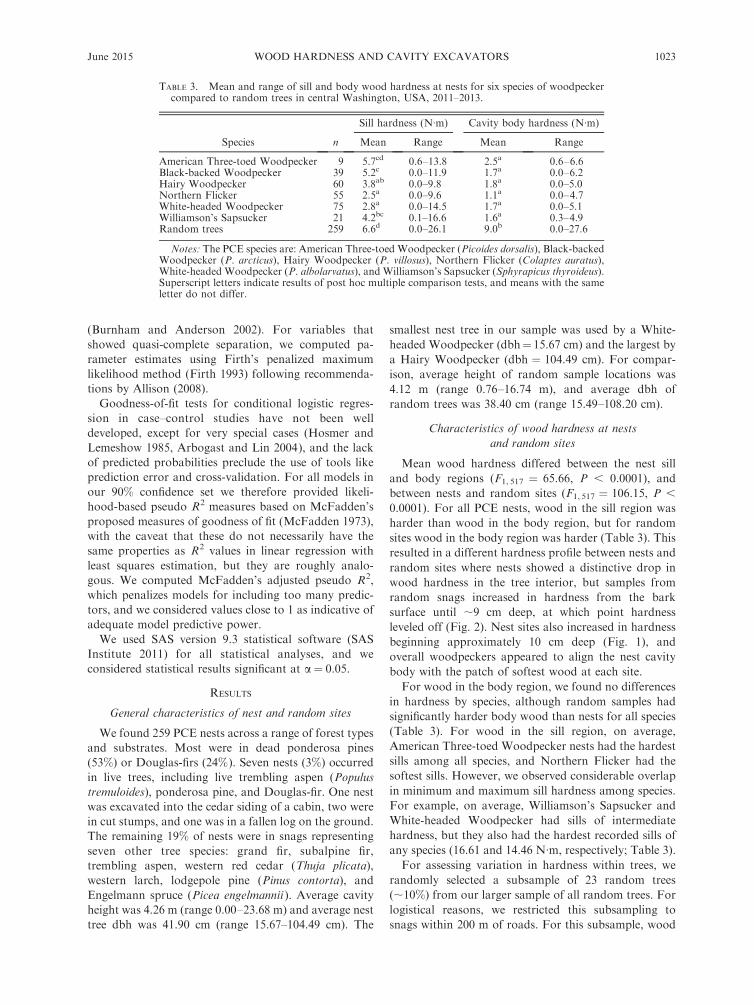
TABLE 3. Mean and range of sill and body wood hardness at nests for six species of woodpeckercompared to random trees in central Washington, USA, 2011–2013.
Species n
Sill hardness (N�m) Cavity body hardness (N�m)
Mean Range Mean Range
American Three-toed Woodpecker 9 5.7cd 0.6–13.8 2.5a 0.6–6.6Black-backed Woodpecker 39 5.2c 0.0–11.9 1.7a 0.0–6.2Hairy Woodpecker 60 3.8ab 0.0–9.8 1.8a 0.0–5.0Northern Flicker 55 2.5a 0.0–9.6 1.1a 0.0–4.7White-headed Woodpecker 75 2.8a 0.0–14.5 1.7a 0.0–5.1Williamson’s Sapsucker 21 4.2bc 0.1–16.6 1.6a 0.3–4.9Random trees 259 6.6d 0.0–26.1 9.0b 0.0–27.6
Notes: The PCE species are: American Three-toed Woodpecker (Picoides dorsalis), Black-backedWoodpecker (P. arcticus), Hairy Woodpecker (P. villosus), Northern Flicker (Colaptes auratus),White-headed Woodpecker (P. albolarvatus), and Williamson’s Sapsucker (Sphyrapicus thyroideus).Superscript letters indicate results of post hoc multiple comparison tests, and means with the sameletter do not differ.
June 2015 1023WOOD HARDNESS AND CAVITY EXCAVATORS
hardness did not differ within random trees by height
(F2,43 ¼ 0.09, P ¼ 0.9168).
PCE nest site availability
Among 360 nonuse snags measured in White-headed
and Black-backed Woodpecker territories, we classified
86% and 96% as unsuitable for nesting by these species,
respectively (Fig. 3). For both species, the majority of
nonuse snags (63% and 78%) were deemed unsuitable
because interior wood was too hard to be excavated for
a nest cavity body, even though the exterior wood was
suitable for nesting.
When considering snag suitability based on decay
classification systems, the decay class that provided the
FIG. 2. Mean hardness at nests for six species of woodpecker compared to random sites in central Washington, USA, from2011 to 2013. See Table 3 notes for full species names.
FIG. 3. Percentage of 360 nonuse snags in Black-backed Woodpecker (BBWO) and White-headed Woodpecker (WHWO)nesting territories that were deemed suitable for nesting based on wood hardness in central Washington, USA, 2011–2013. Weconsidered all snags together, and then the percentages in each of three decay classes of Bull et al. (1997). See Table 2 fordescriptions of the decay classes.
TERESA J. LORENZ ET AL.1024 Ecological ApplicationsVol. 25, No. 4
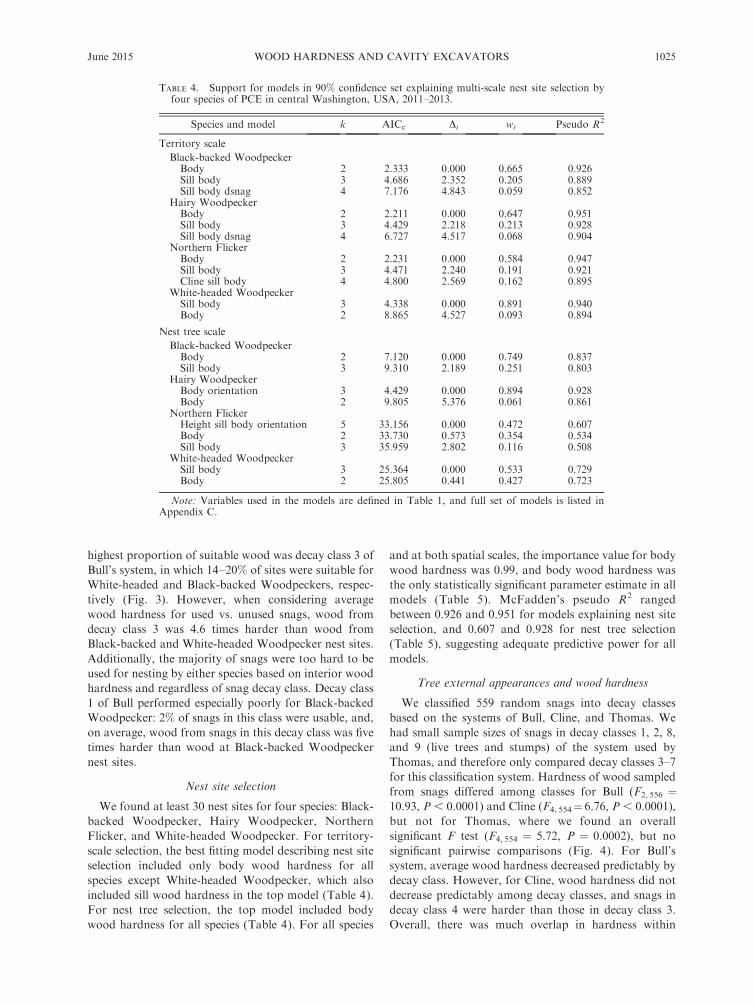
highest proportion of suitable wood was decay class 3 of
Bull’s system, in which 14–20% of sites were suitable for
White-headed and Black-backed Woodpeckers, respec-
tively (Fig. 3). However, when considering average
wood hardness for used vs. unused snags, wood from
decay class 3 was 4.6 times harder than wood from
Black-backed and White-headed Woodpecker nest sites.
Additionally, the majority of snags were too hard to be
used for nesting by either species based on interior wood
hardness and regardless of snag decay class. Decay class
1 of Bull performed especially poorly for Black-backed
Woodpecker: 2% of snags in this class were usable, and,
on average, wood from snags in this decay class was five
times harder than wood at Black-backed Woodpecker
nest sites.
Nest site selection
We found at least 30 nest sites for four species: Black-
backed Woodpecker, Hairy Woodpecker, Northern
Flicker, and White-headed Woodpecker. For territory-
scale selection, the best fitting model describing nest site
selection included only body wood hardness for all
species except White-headed Woodpecker, which also
included sill wood hardness in the top model (Table 4).
For nest tree selection, the top model included body
wood hardness for all species (Table 4). For all species
and at both spatial scales, the importance value for body
wood hardness was 0.99, and body wood hardness was
the only statistically significant parameter estimate in all
models (Table 5). McFadden’s pseudo R2 ranged
between 0.926 and 0.951 for models explaining nest site
selection, and 0.607 and 0.928 for nest tree selection
(Table 5), suggesting adequate predictive power for all
models.
Tree external appearances and wood hardness
We classified 559 random snags into decay classes
based on the systems of Bull, Cline, and Thomas. We
had small sample sizes of snags in decay classes 1, 2, 8,
and 9 (live trees and stumps) of the system used by
Thomas, and therefore only compared decay classes 3–7
for this classification system. Hardness of wood sampled
from snags differed among classes for Bull (F2, 556 ¼10.93, P , 0.0001) and Cline (F4, 554¼6.76, P , 0.0001),
but not for Thomas, where we found an overall
significant F test (F4, 554 ¼ 5.72, P ¼ 0.0002), but no
significant pairwise comparisons (Fig. 4). For Bull’s
system, average wood hardness decreased predictably by
decay class. However, for Cline, wood hardness did not
decrease predictably among decay classes, and snags in
decay class 4 were harder than those in decay class 3.
Overall, there was much overlap in hardness within
TABLE 4. Support for models in 90% confidence set explaining multi-scale nest site selection byfour species of PCE in central Washington, USA, 2011–2013.
Species and model k AICc Di wi Pseudo R2
Territory scale
Black-backed WoodpeckerBody 2 2.333 0.000 0.665 0.926Sill body 3 4.686 2.352 0.205 0.889Sill body dsnag 4 7.176 4.843 0.059 0.852
Hairy WoodpeckerBody 2 2.211 0.000 0.647 0.951Sill body 3 4.429 2.218 0.213 0.928Sill body dsnag 4 6.727 4.517 0.068 0.904
Northern FlickerBody 2 2.231 0.000 0.584 0.947Sill body 3 4.471 2.240 0.191 0.921Cline sill body 4 4.800 2.569 0.162 0.895
White-headed WoodpeckerSill body 3 4.338 0.000 0.891 0.940Body 2 8.865 4.527 0.093 0.894
Nest tree scale
Black-backed WoodpeckerBody 2 7.120 0.000 0.749 0.837Sill body 3 9.310 2.189 0.251 0.803
Hairy WoodpeckerBody orientation 3 4.429 0.000 0.894 0.928Body 2 9.805 5.376 0.061 0.861
Northern FlickerHeight sill body orientation 5 33.156 0.000 0.472 0.607Body 2 33.730 0.573 0.354 0.534Sill body 3 35.959 2.802 0.116 0.508
White-headed WoodpeckerSill body 3 25.364 0.000 0.533 0.729Body 2 25.805 0.441 0.427 0.723
Note: Variables used in the models are defined in Table 1, and full set of models is listed inAppendix C.
June 2015 1025WOOD HARDNESS AND CAVITY EXCAVATORS
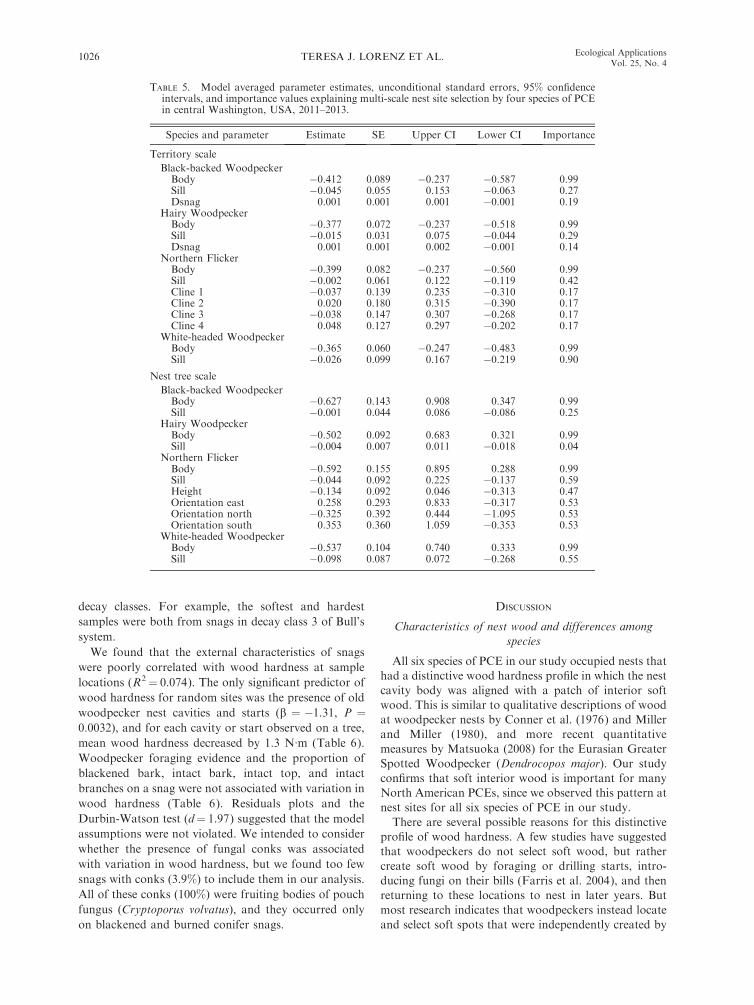
decay classes. For example, the softest and hardest
samples were both from snags in decay class 3 of Bull’s
system.
We found that the external characteristics of snags
were poorly correlated with wood hardness at sample
locations (R2¼ 0.074). The only significant predictor of
wood hardness for random sites was the presence of old
woodpecker nest cavities and starts (b ¼ �1.31, P ¼0.0032), and for each cavity or start observed on a tree,
mean wood hardness decreased by 1.3 N�m (Table 6).
Woodpecker foraging evidence and the proportion of
blackened bark, intact bark, intact top, and intact
branches on a snag were not associated with variation in
wood hardness (Table 6). Residuals plots and the
Durbin-Watson test (d¼ 1.97) suggested that the model
assumptions were not violated. We intended to consider
whether the presence of fungal conks was associated
with variation in wood hardness, but we found too few
snags with conks (3.9%) to include them in our analysis.
All of these conks (100%) were fruiting bodies of pouch
fungus (Cryptoporus volvatus), and they occurred only
on blackened and burned conifer snags.
DISCUSSION
Characteristics of nest wood and differences among
species
All six species of PCE in our study occupied nests that
had a distinctive wood hardness profile in which the nest
cavity body was aligned with a patch of interior soft
wood. This is similar to qualitative descriptions of wood
at woodpecker nests by Conner et al. (1976) and Miller
and Miller (1980), and more recent quantitative
measures by Matsuoka (2008) for the Eurasian Greater
Spotted Woodpecker (Dendrocopos major). Our study
confirms that soft interior wood is important for many
North American PCEs, since we observed this pattern at
nest sites for all six species of PCE in our study.
There are several possible reasons for this distinctive
profile of wood hardness. A few studies have suggested
that woodpeckers do not select soft wood, but rather
create soft wood by foraging or drilling starts, intro-
ducing fungi on their bills (Farris et al. 2004), and then
returning to these locations to nest in later years. But
most research indicates that woodpeckers instead locate
and select soft spots that were independently created by
TABLE 5. Model averaged parameter estimates, unconditional standard errors, 95% confidenceintervals, and importance values explaining multi-scale nest site selection by four species of PCEin central Washington, USA, 2011–2013.
Species and parameter Estimate SE Upper CI Lower CI Importance
Territory scale
Black-backed WoodpeckerBody �0.412 0.089 �0.237 �0.587 0.99Sill �0.045 0.055 0.153 �0.063 0.27Dsnag 0.001 0.001 0.001 �0.001 0.19
Hairy WoodpeckerBody �0.377 0.072 �0.237 �0.518 0.99Sill �0.015 0.031 0.075 �0.044 0.29Dsnag 0.001 0.001 0.002 �0.001 0.14
Northern FlickerBody �0.399 0.082 �0.237 �0.560 0.99Sill �0.002 0.061 0.122 �0.119 0.42Cline 1 �0.037 0.139 0.235 �0.310 0.17Cline 2 0.020 0.180 0.315 �0.390 0.17Cline 3 �0.038 0.147 0.307 �0.268 0.17Cline 4 0.048 0.127 0.297 �0.202 0.17
White-headed WoodpeckerBody �0.365 0.060 �0.247 �0.483 0.99Sill �0.026 0.099 0.167 �0.219 0.90
Nest tree scale
Black-backed WoodpeckerBody �0.627 0.143 0.908 0.347 0.99Sill �0.001 0.044 0.086 �0.086 0.25
Hairy WoodpeckerBody �0.502 0.092 0.683 0.321 0.99Sill �0.004 0.007 0.011 �0.018 0.04
Northern FlickerBody �0.592 0.155 0.895 0.288 0.99Sill �0.044 0.092 0.225 �0.137 0.59Height �0.134 0.092 0.046 �0.313 0.47Orientation east 0.258 0.293 0.833 �0.317 0.53Orientation north �0.325 0.392 0.444 �1.095 0.53Orientation south 0.353 0.360 1.059 �0.353 0.53
White-headed WoodpeckerBody �0.537 0.104 0.740 0.333 0.99Sill �0.098 0.087 0.072 �0.268 0.55
TERESA J. LORENZ ET AL.1026 Ecological ApplicationsVol. 25, No. 4
wood decay fungi (Kilham 1983, Jackson and Jackson
2004, Losin et al. 2006). Our results support this. First,
woodpecker foraging evidence was not associated with
softened wood on random snags. Second, many
woodpeckers were attracted to recent burns (,1 year
postfire) for nesting, which almost certainly lacked
appreciable numbers of preburn excavations. Third,
some snags in our study were monitored as part of a
concurrent study on woodpecker space use, and for
these snags we knew the locations of past starts and
observed woodpeckers creating cavities from start to
finish within a single breeding season. Losin et al. (2006)
pointed out that even if woodpeckers carry fungi on
their bill tips (Farris et al. 2004), cavity starts are an
unlikely medium for fungal growth because they are
exposed to drying effects of wind and sun. Also, early
studies noted the tapping behavior of woodpeckers in
spring near future excavations (Kilham 1983, Wilkins
and Ritchison 1999), indicating that PCEs search for
and detect subtle changes in wood resonance while
pecking or climbing trees (Conner et al. 1976). Given the
rarity of soft wood in our study and the absence of
obvious visual cues associated with soft wood, our
findings support these suppositions that PCEs find soft
spots as they visit trees and snags, and they possess
sensory abilities lacking in humans that enable them to
perceive changes in wood density within a tree’s interior.
Assuming that PCEs find, rather than create soft
spots, Kilham (1968, 1971) suggested that PCEs prefer
sites with soft interior wood for excavation ease, but
which also had hard exteriors to protect future nest
contents from predators. It is also possible that PCEs
select sites based on future cavity microclimate. Wood
hardness may directly or indirectly (by constraining sill
or body thickness, or cavity orientation; Losin et al.
2006) affect microclimate of nests, which in turn may
affect clutch size under some environmental conditions
(Wiebe 2001). PCEs may also simply prefer wood with
the maximum hardness they are capable of excavating.
However, they are likely capable of leveraging more
power when they are positioned vertically on the outside
of the tree rather than when head and body movements
are confined and horizontal inside of a cavity start
(Miller and Miller 1980). This might force them to select
trees with soft interiors. Alternatively, they may instead
prefer the softest, easiest sites available and trees with
soft interiors often have hard exteriors.
After measuring large numbers of random sites, our
findings indicate that ease of excavation is a major factor
driving nest wood hardness and site selection. We
observed a consistent preference for sites with soft
interiors, despite their rarity on the landscape. Addi-
tionally, not all nests followed the pattern of hard
exterior/soft interior. Some nests had soft exteriors and
interiors, although no nests followed the reverse pattern
(soft exterior and hard interior). The notion that PCEs
select sites that are easy to excavate is supported by
Losin et al. (2006), who reported that Red-naped
Sapsuckers (Syphrapicus nuchalis) preferred nest sites
with thin sapwood and that would be easier to excavate.
However, within the range of wood hardness that they
are physically capable of excavating, PCEs probably
also face trade-offs when selecting nest sites, because
sites that are easy to excavate could be riskier in terms of
nest predation (Kilham 1983, Tozer et al. 2009) and
FIG. 4. Variation in wood hardness by snag decay class for559 random snags in central Washington, USA, 2011–2103,classified by the decay class systems of Bull (top), Cline (center),and Thomas (bottom). See Table 2 for descriptions of the decayclasses. Dashed and dotted lines on plots indicate mean bodyand sill wood hardness at nests, respectively. Letters show theresults of post hoc multiple comparison tests, and means withthe same letter do not differ.
June 2015 1027WOOD HARDNESS AND CAVITY EXCAVATORS
more exposed to climate variability. We suggest that
future studies examine some of these trade-offs, and
determine the extent to which PCEs are limited by
excavation abilities that may force them to compromise
on thermal benefits and safety. An important first step in
this process is to measure wood hardness in available
trees to more accurately estimate the number of
potential nest sites, which prior to this study has
probably been grossly overestimated.
Another important consideration is that species likely
differ in their excavation abilities, and this may affect
trade-offs in nest site selection decisions. In support of
this, while we found no difference in internal wood
hardness, we did observe differences in exterior, or sill
wood hardness among the six species in this study. On
average, nests of three-toed woodpeckers (P. dorsalis
and P. arcticus) had harder sills than those of
sapsuckers, which in turn had harder sill wood than
Hairy Woodpecker, White-headed Woodpecker, and
Northern Flicker nests. Despite these differences and
their implications for nest site selection, our results
suggest that researchers should be cautious about using
excavator guilds (e.g., Ingold 1994, Dudley and Saab
2003, Bunnell 2013) without more study, particularly
controlled tests in laboratory settings. This is partly
because, despite differences in mean sill hardness, we
observed a lot of overlap suggesting excavator guilds are
overly simplistic. Moreover, even if guilds reflect
biological differences in ability, they may not be realized
in natural settings where birds appear most limited by
soft interior wood. For example, our results suggest that
in some locations, Black-backed Woodpeckers (see Plate
1) may be more limited than White-headed Woodpeck-
ers for nest sites, possibly because Black-backed
Woodpeckers nest in recent burns where less wood has
had time to soften following death. Thus, even if
excavator guilds provide biologically accurate informa-
tion, they may not provide reliable information for
management or conservation purposes, and therefore
should be used with caution.
Nest site selection
We found that interior wood hardness was the most
important predictor of nest site selection at the nest tree
and territory scale for all species examined suggesting
that PCEs are limited to a small subset of trees on the
landscape for nesting. These findings may explain why
some species that do not forage on snags are neverthe-
less attracted to patches of burned forest, or other areas
of high snag density. For example, aerial insectivores
like Lewis’s Woodpecker (Melanerpes lewis), ground-
foragers like Northern Flicker, and live-tree specialists
like White-headed Woodpecker are all known to
converge in burned forests during the nesting season
(Saab et al. 2009). If soft wood is rare, then the
probability of soft wood occurring in any given area is
probably somewhat proportional to the sheer amount of
dead or diseased wood. The more snags that occur in an
area, the higher the probability that at least a few have
suitable soft spots, and these PCEs may be attracted to
burns because they provide opportunities for nesting
that are not commonly found in nearby unburned
forests.
Our findings may also explain previously inexplicable
regional variation in woodpecker nesting preferences
noted by others. For example, Bonnot et al. (2009)
called attention to regional variation in nest tree size for
the at-risk Black-backed Woodpecker. In California,
USA, Raphael and White (1984) reported that Black-
backed Woodpeckers nested in trees with an average
dbh of 45 cm, whereas in Quebec, Canada, Nappi and
Drapeau (2011) found them nesting in trees half that size
(mean dbh¼ 22 cm). Similarly, large-diameter snags are
promoted for nests sites of the declining White-headed
Woodpecker based on research from Oregon, USA
(Wightman et al. 2010), while we found them selecting
trees as small as 16 cm dbh. Since internal wood
softening is likely caused by wood-rotting fungi, and
since fungi likely grow differently in different trees and
regions, woodpeckers in different regions might select
sites with highly variable external properties, but to
them, very similar internal properties. If this is the case,
it is not possible to make generalizations about nest site
selection across regions without accounting for wood
hardness or decay fungi: Providing large-diameter snags
in a region where PCEs are using rot in small-diameter
trees could be detrimental. It also suggests that it would
be more beneficial for PCEs if managers focus on
providing trees with rot, or which are susceptible to rot,
rather than trees with particular external features or
dimensions.
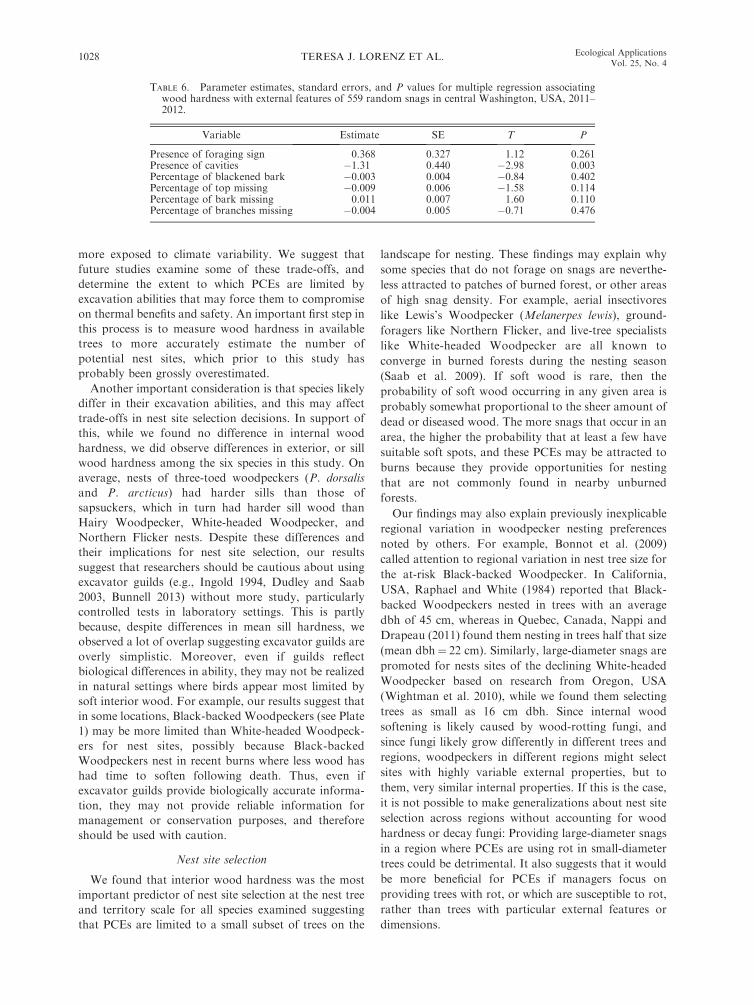
TABLE 6. Parameter estimates, standard errors, and P values for multiple regression associatingwood hardness with external features of 559 random snags in central Washington, USA, 2011–2012.
Variable Estimate SE T P
Presence of foraging sign 0.368 0.327 1.12 0.261Presence of cavities �1.31 0.440 �2.98 0.003Percentage of blackened bark �0.003 0.004 �0.84 0.402Percentage of top missing �0.009 0.006 �1.58 0.114Percentage of bark missing 0.011 0.007 1.60 0.110Percentage of branches missing �0.004 0.005 �0.71 0.476
TERESA J. LORENZ ET AL.1028 Ecological ApplicationsVol. 25, No. 4
The notion that wood-rotting fungi are important to
PCE nesting ecology is not new. Jackson and Jackson
(2004) provided a review of the evidence that wood-rotting fungi are central for PCE nesting ecology, and
suggested that woodpeckers select for sites with rot orwith fungal conks. However, we propose that PCEs do
not select specifically for rot or fungal conks, but ratherthat they select trees with soft interiors, and soft interior
wood is often caused by wood decay fungi. This wouldexplain why PCEs sometimes use manufactured nest
boxes or human buildings for nesting, which should
contain little or no trace of wood-rotting fungi, butwhich are filled with soft materials such as wood
shavings or insulation. If this is the case, then woodhardness is ultimately the mode by which PCEs select
nest sites, and it just so happens that in natural systems,wood-rotting fungi are a common mechanism by which
wood is softened.
Nevertheless, we do not intend to downplay the roleof wood-rotting fungi in PCE nesting ecology. On the
contrary, we agree with Jackson and Jackson (2004) thatmore research is needed on the species of fungi that
cause wood softening at PCE nests and how they can bepromoted. This is especially true for coniferous forests.
With the exception of the endangered Red-cockaded
Woodpecker (Picoides borealis) of the southeastern
USA, past research has focused on PCE use of heart
rot-infected deciduous trees (Conner et al. 1976, Daily
1993, Schepps et al. 1999, Matsuoka 2008). In conifer-ous forests of the northwestern USA, we observed that
many nests were excavated into the sapwood of conifersnags, indicating that sapwood rot is an underappreci-
ated mechanism of wood softening in some regions.Research on rot in coniferous forests is particularly
needed because several at-risk PCEs rely on coniferous
forests for population persistence, including the White-headed, Black-backed, Lewis’s, and American and
Eurasian Three-toed Woodpecker (Picoides tridactylus)(e.g., Garrett et al. 1996, Dixon and Saab 2000, Vierling
et al. 2013).
Tree external appearances and wood hardness
We found that commonly used snag decay classeswere a poor predictor of nest site selection compared to
wood hardness. There are several reasons why decayclasses poorly predict PCE use in this and past studies
(Chambers and Mast 2005, Bagne et al. 2008). First,decay classes attempt to categorize and simplify a
continuous and complex phenomenon (Creed et al.2004, Angers et al. 2012). Second, factors that enable
trees to compartmentalize decay can function long after
a tree’s death (Shigo 1984). Thus, indicators of decay
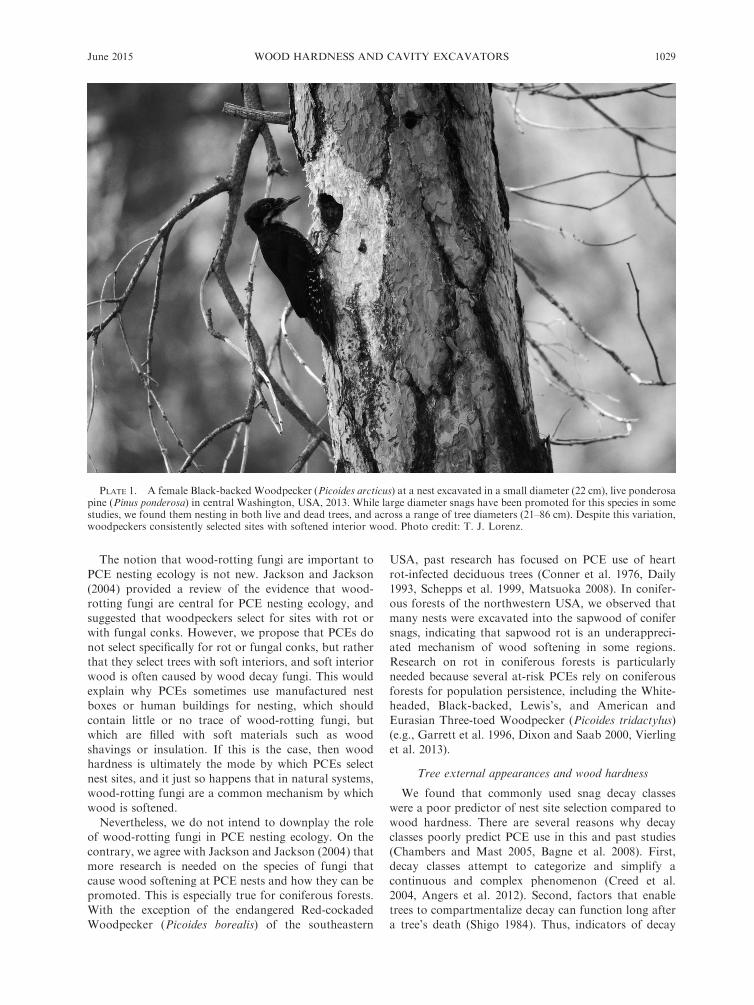
PLATE 1. A female Black-backed Woodpecker (Picoides arcticus) at a nest excavated in a small diameter (22 cm), live ponderosapine (Pinus ponderosa) in central Washington, USA, 2013. While large diameter snags have been promoted for this species in somestudies, we found them nesting in both live and dead trees, and across a range of tree diameters (21–86 cm). Despite this variation,woodpeckers consistently selected sites with softened interior wood. Photo credit: T. J. Lorenz.
June 2015 1029WOOD HARDNESS AND CAVITY EXCAVATORS
class that should be used to identify localized pockets of
decay are in practice applied to describe decay in the
entire bole of a tree. Third, snag decay classes group
snags based on their exterior features, whereas wood-
peckers appear to select snags based on internal features,
specifically wood hardness. Factors that cause a tree to
take on the outward appearance of a snag decay class
are not necessarily those that cause fungal colonization
and wood softening in the interior. For example, top
breakage is often listed as a major factor associated with
advanced snag decay (Cline et al. 1980, Bull et al. 1997).
Yet, top breakage may occur from factors besides decay,
such as from excessive wind, snow, mechanical thinning,
or fire, and thus, a broken-top snag may contain hard
wood in all of its bole. When tops do break from decay,
the portion of bole containing soft wood may fall to the
ground. Although dead-topped trees are said to provide
a good surface for fungal colonization (Haggard and
Gaines 2001), we could not find studies that specifically
tested this hypothesis, and fungal growth could be
inhibited in some broken-topped trees, because they
subject the bole’s interior to the drying effects of wind
and sun (Losin et al. 2006). In sum, a broken-top tree or
snag would be favorable for PCE use only under fairly
specific conditions. It is not surprising therefore that,
while PCEs consistently selected soft interior wood in
our study, nests occurred in sites ranging from entirely
live trees to live trees with dead tops and snags with both
intact and broken tops.
Snag decay classes have likely enjoyed such popularity
because they are easy to use. However, they can be fairly
subjective (Larjavaara and Muller-Landau 2010), and
their limitations for predicting wood density were
appreciated early on by foresters (Gale 1973). Since
then, the majority of studies on snag decay classes report
findings very similar to ours; for random spots on snags,
there is large variation within and overlap among decay
classes in wood density. Thus, while decay classes may
sometimes point to localized pockets of decay, for
describing wood in the entire bole of a tree they only
indicate changes in wood mass density at coarse scales;
for example, between the two most extreme decay classes
within one system, and they poorly describe variation at
finer scales (Saint-Germain et al. 2007, Aakala 2010,
Paletto and Tosi 2010, Strukelj et al. 2013). This is
potentially problematic for studies of PCE nest site
selection, since PCEs appear to perceive changes in
wood density at very fine scales (Matsuoka 2008, Zahner
et al. 2012).
Despite these concerns, we could find no other studies
of PCE nest site selection that acknowledged the
shortcomings of decay classes and tested their accuracy.
Additionally, ours is the first study to relate hardness of
snag decay classes with hardness at PCE nests. We
found that regardless of snag decay class, the majority of
wood in nesting territories was unsuitably hard for
nesting by our two focal species, the Black-backed and
White-headed Woodpecker. We also found no external
features of snags that were associated with interior wood
softness at our random measurement points. While we
acknowledge that sampling at random spots on snags,
rather than near broken tops or limbs, likely led to a
conservative estimate of soft wood, we recommend that
ecologists avoid using snag decay classifications for
determining the suitability of sites for PCE nests until
more intensive sampling of snags is done. When decay
classes are used, ecologists should recognize that the
majority of wood on all snags is likely unsuitable for
nesting.
Implications for research and management
Our findings suggest that higher densities of snags and
other nest substrates should be provided for PCEs than
generally recommended, because past research studies
likely overestimated the abundance of suitable nest sites
and underestimated the number of snags required to
sustain PCE populations. Accordingly, the felling or
removal of snags for any purpose, including commercial
salvage logging and home firewood gathering, should
not be permitted where conservation and management
of PCEs or SCUs is a concern (Scott 1978, Hutto 2006).
Managers should also take particular care that pro-
grams designed to increase the number of nesting
substrates do not end up providing large numbers of
unusable sites. Several studies attempting to create nest
snags for PCEs have reported low use by woodpeckers,
indicating that this should be a major concern. For
example, Bednarz et al. (2013) inoculated 330 trees with
Fomitopsis pinicola in western Washington, USA, and
found no avian nest cavities eight to nine years later.
Likewise, for 883 and 1111 snags created by tree-topping
in western Oregon, USA, by Walter and Maguire (2005)
and Kroll et al. (2012), only 2–3% were used by
woodpeckers for nesting 10 to 12 years later. In these
cases, managers may have unknowingly provided large
numbers of unsuitably hard snags that PCEs were not
physically capable of excavating. Yet the alternative
situation could also be detrimental. If managers provide
large numbers of unsuitably soft snags, PCEs may
experience high depredation rates and be incapable of
successfully fledging broods (Conner 1977, Tozer et al.
2009). This second case could have significant popula-
tion-wide ramifications for rare or sensitive species since
it could attract nesting birds to sink habitats. But either
situation may be costly for managers while not beneficial
for PCEs.
For researchers, future studies of PCE nesting
ecology must include quantitative measures of wood
hardness for unbiased results. Past research studies
that did not measure wood hardness probably counted
some trees as available for PCEs that were not actually
available. In addition to causing bias (Jones 2001), this
may explain ‘‘nonideal’’ selection decisions reported by
PCEs in past studies. Sadoti and Vierling (2010) and
Frei et al. (2013) reported that woodpeckers selected
sites where they experienced low productivity, and
TERESA J. LORENZ ET AL.1030 Ecological ApplicationsVol. 25, No. 4
then concluded that PCEs made maladaptive or
nonideal selection decisions. But these studies did not
measure wood hardness, and therefore some sites
counted as available were probably not available. In
order to determine the extent and frequency of bias,
new studies should be conducted to revisit old research
questions, and these new studies should quantitatively
measure wood hardness to obtain a more accurate
assessment of nest site availability. Additionally, until
wood hardness is incorporated into nest site selection
models, ecologists should remain cautious of interpre-
tations made without measures of wood hardness, at
least at the territory scale and smaller. We also
encourage researchers to further explore the role of
wood hardness in PCE nest site limitations and nest
survival (Tozer et al. 2009), and to conduct intensive
studies of wood hardness to better estimate the
availability of suitable nest wood in different forest
types. Lastly, as suggested by Jackson and Jackson
(2004), much could be gained by identifying and
promoting wood decay fungi associated with PCE nest
sites, rather than simply measuring and modeling
patterns in external features.
ACKNOWLEDGMENTS
This study was partially funded by the U.S. Department ofAgriculture, Forest Service. For logistical support, we thank R.Huffman from the Washington Department of Fish andWildlife, and A. Lyons, K. Mellen-McLean, J. St. Hiliare,and D. Youkey from the U.S. Forest Service. C. Harringtonand C. Raley loaned us equipment, and A. Adamson, T. Kogut,J. Kozma, J. Millard, and H. Murphy shared nest locations. Weare grateful to J. Millard for also helping with field datacollection. C. Coffin, T. Bass, J. Ashbaugh, and the Carlsonfamily allowed access to their land, and Sleeping Lady Resort inLeavenworth, Washington, graciously allowed us to measure anest in one of their lodges. J. Rachlow, M. Raphael, L.Svancara, and two anonymous reviewers provided commentsthat improved the manuscript.
LITERATURE CITED
Aakala, T. 2010. Coarse woody debris in late-successional Piceaabies forests in northern Europe: variability in quantities andmodels of decay class dynamics. Forest Ecology andManagement 260:770–779.
Aitken, K. E. H., and K. Martin. 2008. Resource selectionplasticity and community responses to experimental reduc-tion of a critical resource. Ecology 89:971–980.
Allison, P. D. 2008. Convergence failures in logistic regression.SAS Institute, Cary, North Carolina, USA.
Angers, V. A., Y. Bergeron, and P. Drapeau. 2012. Morpho-logical attributes and snag classification of four NorthAmerican boreal tree species: relationships with time sincedeath and wood density. Forest Ecology and Management263:138–147.
Arbogast, P. G., and D. Y. Lin. 2004. Goodness-of-fit methodsfor matched case-control studies. Canadian Journal ofStatistics 32:373–386.
Bagne, K. E., K. L. Purcell, and J. T. Rotenberry. 2008.Prescribed fire, snag population dynamics, and avian nest siteselection. Forest Ecology and Management 255:99–105.
Bednarz, J. C., M. J. Huss, T. J. Benson, and D. E. Varland.2013. The efficacy of fungal inoculation of live trees to createwood decay and wildlife-use trees in managed forests of
western Washington, USA. Forest Ecology and Management307:186–195.
Bednarz, J. C., D. Ripper, and P. M. Radley. 2004. Emergingconcepts and research directions in the study of cavity-nesting birds: keystone ecological processes. Condor 103:1–4.
Blanc, L. A., and J. R. Walters. 2008. Cavity excavation andenlargement as mechanisms for indirect interactions in anavian community. Ecology 89:506–514.
Bonnot, T. W., J. J. Millspaugh, and M. A. Rumble. 2009.Multi-scale nest-site selection by black-backed woodpeckersin outbreaks of mountain pine beetles. Forest Ecology andManagement 259:220–228.
Buchanan, J. B., R. E. Rogers, D. J. Pierce, and J. E. Jacobson.2003. Nest-site habitat use by white-headed woodpeckers inthe eastern Cascade Mountains, Washington. NorthwesternNaturalist 84:119–128.
Bull, E. L., C. G. Parks, and T. R. Torgersen. 1997. Trees andlogs important to wildlife in the interior Columbia Riverbasin. General Technical Report PNW-GTR-391. USDAForest Service, Pacific Northwest Research Station, Portland,Oregon, USA.
Bunnell, F. L. 2013. Sustaining cavity-using species: patterns ofcavity use and implications to forest management. ISRNForestry 2013:1–33.
Bunnell, F. L., L. L. Kremsater, and E. Wind. 1999. Managingto sustain vertebrate richness in forests of the PacificNorthwest: relationships within stands. Environmental Re-views 7:97–146.
Burnham, K. P., and D. R. Anderson. 2002. Model selectionand multimodel inference: a practical information-theoreticapproach. Springer, New York, New York, USA.
Chambers, C. L., and J. N. Mast. 2005. Ponderosa pine snagdynamics and cavity excavation following wildfire innorthern Arizona. Forest Ecology and Management216:227–240.
Cline, S. P., A. B. Berg, and H. M. Wight. 1980. Snagcharacteristics and dynamics in Douglas-fir forests, westernOregon. Journal of Wildlife Management 44:773–786.
Cockle, K. L., K. Martin, and G. Robledo. 2012. Linking fungi,trees, and hole-using birds in a Neotropical tree-cavitynetwork: Pathways of cavity production and implicationsfor conservation. Forest Ecology and Management 264:210–219.
Conner, R. N. 1977. The effect of tree hardness on woodpeckernest entrance orientation. Auk 94:369–370.
Conner, R. N., O. K. Miller, Jr., and C. S. Adkisson. 1976.Woodpecker dependence on trees infected by fungal heartrots. Wilson Bulletin 88:575–581.
Cooke, H. A., and S. J. Hannon. 2012. Nest-site selection byold boreal forest cavity excavators as a basis for structuralretention guidelines in spatially-aggregated harvests. ForestEcology and Management 269:37–51.
Creed, I. F., K. L. Webster, and D. L. Morrison. 2004. Acomparison of techniques for measuring density and con-centrations of carbon and nitrogen in coarse woody debris atdifferent stages of decay. Canadian Journal of ForestResearch 34:744–753.
Daily, G. C. 1993. Heartwood decay and vertical distribution ofred-naped sapsucker nest cavities. Wilson Bulletin 105:674–679.
Daily, G. C., P. R. Ehrlich, and N. M. Haddad. 1993. Doublekeystone bird in a keystone species complex. Proceedings ofthe National Academy of Sciences USA 90:592–594.
Dixon, R. D., and V. A. Saab. 2000. Black-backed Woodpecker(Picoides arcticus). The birds of North America online. A.Poole, editor. Cornell Lab of Ornithology, Ithaca, NewYork, USA.
Drever, M. C., K. E. H. Aitken, A. R. Norris, and K. Martin.2008. Woodpeckers as reliable indicators of bird richness,forest health, and harvest. Biological Conservation 141:624–634.
June 2015 1031WOOD HARDNESS AND CAVITY EXCAVATORS
Dudley, J., and V. Saab. 2003. A field protocol to monitorcavity-nesting birds. Research Paper RMRS-RP-44. USDAForest Service, Rocky Mountain Research Station, FortCollins, Colorado, USA.
Edworthy, A. B., K. L. Wiebe, and K. Martin. 2012. Survivalanalysis of a critical resource for cavity-nesting communities:patterns of tree cavity longevity. Ecological Applications22:1733–1742.
Esri [Environmental Systems Research Institute]. 2010. ArcGIS10.0. Esri, Redlands, California, USA.
Farris, K. L., M. J. Huss, and S. Zack. 2004. The role offoraging woodpeckers in the decomposition of ponderosapine snags. Condor 106:50–59.
Firth, D. 1993. Bias reduction of maximum likelihoodestimates. Biometrika 80:27–38.
Forristal, C. D. 2009. Influence of postfire salvage logging onblack-backed woodpecker nest-site selection and nest surviv-al. Thesis. Montana State University, Bozeman, Montana,USA.
Frei, B., J. W. Fyles, and J. J. Nocera. 2013. Maladaptivehabitat use of a North American woodpecker in populationdecline. Ethology 119:1–12.
Gale, R. M. 1973. Snags, chainsaws, and wildlife: one aspect ofhabitat management. Pages 97–112 in J. Yoakum, editor.Presentation to the 4th annual joint conference of theAmerican Fisheries Society and Wildlife Society. Wildlife inmanaged forests: Cal-Nev wildlife 1973 transactions. Amer-ican Fisheries Society, Bethesda, Maryland, USA
Garrett, K. L., M. G. Raphael, and R. D. Dixon. 1996. White-headed Woodpecker (Picoides albolarvatus). In A. Poole,editor. The birds of North America online. Cornell Lab ofOrnithology, Ithaca, New York, USA.
Gentry, D. J., and K. T. Vierling. 2008. Reuse of woodpeckercavities in the breeding and non-breeding seasons in old burnhabitats in the Black Hills, South Dakota. AmericanMidland Naturalist 171:413–429.
Haggard, M., and W. L. Gaines. 2001. Effects of stand-replacement fire and salvage logging on a cavity-nesting birdcommunity in Eastern Cascades, Washington. NorthwestScience 75:387–396.
Hollenbeck, J. P., V. A. Saab, and R. W. Frenzel. 2011. Habitatsuitability and nest survival of white-headed woodpeckers inunburned forests of Oregon. Journal of Wildlife Manage-ment 75:1061–1071.
Hosmer, D. W., and S. Lemeshow. 1985. Goodness-of-fit testsfor the logistic regression model for matched case-controlstudies. Biometrical Journal 27:511–520.
Hutto, R. L. 2006. Toward meaningful snag-managementguidelines for postfire salvage logging in North Americanconifer forests. Conservation Biology 20:984–993.
Ingold, D. J. 1994. Nest-site characteristics of red-bellied andred-headed woodpeckers and northern flickers in east-centralOhio. Ohio Journal of Science 94:2–7.
Isik, F., and B. Li. 2003. Rapid assessment of wood density oflive trees using the resistograph for selection in treeimprovement programs. Canadian Journal of Forest Re-search 33:2426–2435.
Jackson, J. A. 1977. How to determine the status of awoodpecker nest. Living Bird 15:205–221.
Jackson, J. A., and B. J. S. Jackson. 2004. Ecologicalrelationships between fungi and woodpecker cavity starts.Condor 106:37–49.
Johnson, D. H. 1980. The comparison of usage and availabilitymeasurements for evaluating resource performance. Ecology61:65–71.
Johnson, J. B., and K. S. Omland. 2004. Model selection inecology and evolution. Trends in Ecology and Evolution19:101–108.
Johnson, R. R., B. T. Brown, L. T. Haight, and J. M. Simpson.1981. Playback recordings as a special avian censusingtechnique. Studies in Avian Biology 6:68–75.
Jones, J. 2001. Habitat selection studies in avian ecology: acritical review. Auk 118:557–562.
Keating, K. A., and S. Cherry. 2004. Use and interpretation oflogistic regression in habitat-selection studies. Journal ofWildlife Management 68:774–789.
Kilham, L. 1968. Reproductive behavior of hairy woodpeckersII. Nesting and habitat. Wilson Bulletin 80:286–305.
Kilham, L. 1971. Reproductive behavior of yellow-belliedsapsuckers I. Preference for nesting in Fomes-infected aspensand nest hole interrelations with flying squirrels, raccoons,and other animals. Wilson Bulletin 83:159–171.
Kilham, L. 1983. Life history studies of woodpeckers of easternNorth America. Publication Number 20. Nuttall OrnithologyClub, Cambridge, Massachusetts, USA.
Kozma, J. M., and A. J. Kroll. 2012. Woodpecker nest survivalin burned and unburned managed ponderosa pine forests ofthe northwestern United States. Condor 114:1–13.
Kroll, A. J., S. D. Duke, M. E. Hane, J. R. Johnson, M.Rochelle, M. G. Betts, and E. B. Arnett. 2012. Landscapecomposition influences avian colonization of experimentallycreated snags. Forest Ecology and Management 152:145–151.
Larjavaara, M., and H. C. Muller-Landau. 2010. Comparisonof decay classification, knife test, and two penetrometers forestimating wood density of coarse woody debris. CanadianJournal of Forest Research 40:2313–2321.
Lawrence, L. D. K. 1967. A comparative life-history study forfour species of woodpeckers. Ornithological Monographs5:1–156.
Lillybridge, T. R., B. L. Kovalchik, C. K. Williams, and B. G.Smith. 1995. Field guide to forested plant associations of theWenatchee National Forest. General Technical ReportPNW-GTR-359. USDA Forest Service, Portland, Oregon,USA.
Lindenmayer, D. B., C. R. Margules, and D. B. Botkin. 2000.Indicators of biodiversity for ecologically sustainable forestmanagement. Conservation Biology 14:941–950.
Losin, N., C. H. Floyd, T. E. Schweitzer, and S. J. Keller. 2006.Relationship between aspen heartwood rot and the locationof cavity excavation by a primary cavity-nester, the red-naped sapsucker. Condor 108:709–710.
Martin, K., K. E. H. Aitken, and K. L. Wiebe. 2004. Nest-sitesand nest webs for cavity-nesting communities in interiorBritish Columbia, Canada: nest characteristics and nichepartitioning. Condor 106:5–19.
Martin, T. E., C. R. Paine, C. J. Conway, W. M. Hochachka, P.Allen, and W. Jenkins. 1997. BBIRD field protocol. MontanaCooperative Wildlife Research Unit, University of Montana,Missoula, USA.
Matsuoka, S. 2000. A method to measure the hardness of woodin standing woodpecker nest trees. Japanese Journal ofOrnithology 49:151–155.
Matsuoka, S. 2008. Wood hardness in nest trees of the greatspotted woodpecker Dendrocopos major. OrnithologicalScience 7:59–66.
Mazerolle, M. J. 2006. Improving data analysis in herpetology:using Akaike’s Information Criterion (AIC) to assess thestrength of biological hypotheses. Amphibia-Reptilia 27:169–180.
McFadden, D. 1973. Conditional logit analysis of qualitativechoice behavior. Pages 104–142 in P. Zarembka, editor.Frontiers in econometrics. Academic Press, New York, NewYork, USA.
Miller, E., and D. R. Miller. 1980. Snag use by birds. Pages337–356 in R. M. DeGraaf, editor. Management for non-game birds. General Technical Report INT-GTR-86. USDAForest Service, Intermountain Forest and Range ExperimentStation, Ogden, Utah, USA.
Nappi, A., and P. Drapeau. 2011. Pre-fire forest conditions andfire severity as determinants of the quality of burned forestsfor deadwood-dependent species: the case of the black-
TERESA J. LORENZ ET AL.1032 Ecological ApplicationsVol. 25, No. 4
backed woodpecker. Canadian Journal of Forest Research41:994–1003.
Newton, I. 1994. The role of nest-sites in limiting the numbersof hole nesting birds: a review. Biological Conservation70:265–276.
Paletto, A., and V. Tosi. 2010. Deadwood density variationwith decay class in seven tree species of the Italian Alps.Scandinavian Journal of Forest Research 25:164–173.
Parks, C. G., E. L. Bull, and T. R. Torgersen. 1997. Field guidefor the identification of snags and logs in the interiorColumbia River Basin. General Technical Report PNW-GTR-390. USDA Forest Service, Portland, Oregon, USA.
Pasinelli, G. 2007. Nest site selection in middle and greatspotted woodpeckers Dendrocopos medius and D. major:implications for forest management and conservation.Biodiversity and Conservation 16:1283–1298.
Pyle, C., and M. M. Brown. 1999. Heterogeneity of wood decayclasses within hardwood logs. Forest Ecology and Manage-ment 114:253–259.
Raphael, M. G., and M. White. 1984. Use of snags by cavity-nesting birds in the Sierra Nevada. Wildlife Monographs86:1–66.
Saab, V. A., R. Brannon, J. G. Dudley, L. Donohoo, D.Vanderzanden, B. Johnson, and H. Lackowski. 2002.Selection of fire-created snags at two spatial scales bycavity-nesting birds. General Technical Report PSW-GTR-181. USDA Forest Service, Pacific Southwest ResearchStation, Ogden, Utah, USA.
Saab, V. A., and J. G. Dudley. 1998. Responses of cavity-nesting birds to stand-replacement fire and salvage logging inponderosa pine/Douglas-fir forests of southwestern Idaho.Research Paper PMRS-RP-11. USDA Forest Service, RockyMountain Research Station, Fort Collins, Colorado, USA.
Saab, V. A., R. E. Russell, and J. G. Dudley. 2009. Nest-siteselection by cavity-nesting birds in relation to postfire salvagelogging. Forest Ecology and Management 257:151–159.
Sadoti, G., and K. T. Vierling. 2010. Nonideal habitat selectionby a North American cavity excavator: pecking up the wrongtree? Canadian Journal of Zoology 88:527–535.
Saint-Germain, M., P. Drapeau, and C. M. Buddle. 2007. Host-use patterns of saproxylic phloeophagus and xylophagousColeoptera adults and larvae along the decay gradient instanding dead black spruce and aspen. Ecography 30:737–748.
SAS Institute. 2011. SAS 9.3. SAS Institute, Cary, NorthCarolina, USA.
Schepps, J., S. Lohr, and T. E. Martin. 1999. Does treehardness influence nest-tree selection by primary cavitynesters? Auk 116:658–665.
Scott, V. E. 1978. Characteristics of ponderosa pine snags usedby cavity-nesting birds in Arizona. Journal of Forestry76:26–28.
Shigo, A. L. 1984. Compartmentalization: a conceptualframework for understanding how trees grow and defendthemselves. Annual Review of Phytopathology 22:189–214.
Spiering, D. J., and R. L. Knight. 2005. Snag density and use bycavity-nesting birds in managed stands of the Black HillsNational Forest. Forest Ecology and Management 241:40–52.
Straus, M. A., K. Bavrlic, E. Nol, D. M. Burke, and K. E.Elliot. 2011. Reproductive success of cavity-nesting birds inpartially harvested woodlots. Canadian Journal of ForestResearch 41:1004–1017.
Strukelj, M., S. Brais, S. A. Quideau, V. A. Angers, H. Kebli, P.Drapeau, and S. Oh. 2012. Chemical transformations indowned logs and snags of mixed boreal species duringdecomposition. Canadian Journal of Forest Research43:785–798.
Symonds, M. R. E., and A. Moussalli. 2011. A brief guide tomodel selection, multimodel inference and model averagingin behavioral ecology using Akaike’s Information Criterion.Behavioral Ecology and Sociobiology 65:13–21.
Thomas, J. W., R. G. Anderson, C. Maser, and E. L. Bull.1979. Snags. Pages 60–77 in J. W. Thomas, editor. Wildlifehabitats in managed forests: the Blue Mountains of Oregonand Washington. Agriculture Handbook Number 553.USDA Forest Service, Portland, Oregon, USA.
Tozer, D. C., E. Nol, D. M. Burke, K. A. Elliott, and K. J.Falk. 2009. Predation by bears on woodpecker nests: Arenestling begging and habitat choice risky business? Auk126:300–309.
Vierling, K. T., L. B. Lentile, and N. Nielsen-Pincus. 2008.Preburn characteristics and woodpecker use of burnedconiferous forest. Journal of Wildlife Management 72:422–427.
Vierling, K. T., V. A. Saab, and B. W. Tobalske. 2013. Lewis’sWoodpecker (Melanerpes lewis). In A. Poole, editor. Thebirds of North America online. Cornell Lab of Ornithology,Ithaca, New York, USA.
Virkkala, R. 2006. Why study woodpeckers? The significance ofwoodpeckers in forest ecosystems. Annales Zoologici Fennici43:82–85.
Walter, S. T., and C. C. Maguire. 2005. Snags, cavity-nestingbirds, and silvicultural treatments in western Oregon. Journalof Wildlife Management 69:1578–1591.
Wiebe, K. L. 2001. Microclimate of tree cavity nests: Is itimportant for reproductive success in northern flickers? Auk118:412–421.
Wiebe, K. L. 2011. Nest-sites as limiting resources for cavity-nesting birds in mature forest ecosystems: a review of theevidence. Journal of Field Ornithology 82:239–248.
Wightman, C. S., V. A. Saab, C. Forristal, K. Mellen-McLean,and A. Markus. 2010. White-headed woodpecker nestingecology after wildfire. Journal of Wildlife Management74:1098–1106.
Wilkins, H. D., and G. Ritchison. 1999. Drumming andtapping by red-bellied woodpeckers: description and possiblecausation. Journal of Field Ornithology 70:578–586.
Zahner, V., L. Sikora, and G. Pasinelli. 2012. Heart rot as a keyfactor for cavity tree selection in the black woodpecker.Forest Ecology and Management 271:98–103.
SUPPLEMENTAL MATERIAL
Ecological Archives
Appendices A–C are available online: http://dx.doi.org/10.1890/14-1042.1.sm
June 2015 1033WOOD HARDNESS AND CAVITY EXCAVATORS