Embed Size (px)
Citation preview
Seediscussions,stats,andauthorprofilesforthispublicationat:https://www.researchgate.net/publication/280716715
TheRomanCityofAltinum,VeniceLagoon,fromRemoteSensingandGeophysicalProspection
ArticleinArchaeologicalProspection·August2015
DOI:10.1002/arp.1520
CITATIONS
0
READS
109
6authors,including:
Someoftheauthorsofthispublicationarealsoworkingontheserelatedprojects:
Masterdisecondolivello(EQF8)inGIScienceandUnmannedSystemfortheintegrated
managementoftheterritoryandthenaturalresources-withmajorsViewproject
PaoloMozzi
UniversityofPadova
71PUBLICATIONS419CITATIONS
SEEPROFILE
AlessandroFontana
UniversityofPadova
64PUBLICATIONS384CITATIONS
SEEPROFILE
FrancescoFerrarese
UniversityofPadova
39PUBLICATIONS112CITATIONS
SEEPROFILE
StefanoCampana
UniversitàdegliStudidiSiena
89PUBLICATIONS254CITATIONS
SEEPROFILE
Allin-textreferencesunderlinedinbluearelinkedtopublicationsonResearchGate,
lettingyouaccessandreadthemimmediately.
Availablefrom:AlessandroFontana
Retrievedon:10November2016
* Correspondence to: P.Università di Padova, via GE-mail: paolo.mozzi@unipd
Copyright © 2015 John
Archaeological ProspectionArchaeol. Prospect. 23, 27–44 (2016)Published online 3 August 2015 in Wiley Online Library(wileyonlinelibrary.com) DOI: 10.1002/arp.1520
The Roman City of Altinum, Venice Lagoon,from Remote Sensing and GeophysicalProspection
PAOLO MOZZI1*, ALESSANDRO FONTANA1, FRANCESCO FERRARESE2,ANDREA NINFO1, STEFANO CAMPANA3 AND ROBERTO FRANCESE4,5
1 Dipartimento di Geoscienze, Università di Padova, Padova, Italy2 Dipartimento di Scienze Storiche, Geografiche e dell’Antichità, Università di Padova, Padova, Italy3 Faculty of Classics, University of Cambridge, United Kingdom4 Istituto Nazionale di Oceanografia e di Geofisica Sperimentale, Sgonico, Italy5 Dipartimento di Fisica e Scienze della Terra, Università di Parma, Parma, Italy
ABSTRACT Geophysical prospection on 14 ha integra
tes the processing and interpretation of vertical multispectral and obliqueaerial images for uncovering the archaeology of the Roman city of Altinum. This Iron Age and Roman harbour citywas completely abandoned in the early Middle Ages, when people moved to nearby lagoon islands, and so the siteis particularly fit for the application of non-invasive techniques. Primary aims of the research were to test the interpre-tation of archaeological structures in the city centre, estimate their degree of preservation in the subsoil, and updateprevious knowledge on the urban landscape. Target areas were identified first through remote sensing with latermagnetic gradiometer mapping of the consular road (via Annia) and its adjoining streets, foundations of large buildings,theatres, temple and forum, a main canal with possible boatyard/storing place and workshops. Multi-electrodeautomatic resistivity profile produced a very detailed survey of the little theatre (odeon) and basilica. The ground-penetrating radar traced the city walls, while frequency-domain electromagnetics mapped the street pattern.Buried archaeological structures were located with an estimated error < 0.5 m. Floors and foundations of Romanbuildings and infrastructures appear to be preserved between 0.5 and 2 m depth. They probably relate to a re-organization of the city, which occurred between the second half of the second century and the end of the first centuryBC, having via Annia and the forum as the main city axis, and incorporating few elements of the Iron Age settlement,such as the canal and city boundary. Eight city districts could be recognized, each one showing prevalent public,residential and other productive functions. In the ancient past the monumental buildings of the city were potentiallyvisible from ships in the Adriatic Sea, and could act as nautical signals of the entrance to the lagoon along this lowand otherwise monotonous coast. Copyright © 2015 John Wiley & Sons, Ltd.Key words: Remote sensing; geophysical prospection; Roman Empire; topography of ancient towns; northern Italy;Venice Lagoon
Introduction
The exploration for and mapping of buried archaeo-logical features using technologies that leave thestructures untouched in the ground, represents thecutting-edge frontier of field archaeology (Campanaand Piro, 2009; Conyers and Leckebusch, 2010;Vermeulen et al., 2012; Johnson and Millett, 2012;Lasaponara and Masini, 2012; Schmidt, 2013; Corsi
Mozzi, Dipartimento di Geoscienze,. Gradenigo 6, 35131 Padova, Italy..it
Wiley & Sons, Ltd.
et al., 2013). Remote sensing and geophysics havethe potential to produce two-dimensional and three-dimensional maps of buried features providing infor-mation on the geometry of objects as well as theburied topography (Horsley et al., 2014; Keay et al.,2014; Fassbinder, 2015). These methods can indicatethe best location for future excavations in order to un-derstand the stratigraphic framework of buried sitesand determine ages of buried features. A drawback ofthe non-destructive approach is the lower resolutioncompared to excavations, but modern imaging technol-ogy is rapidly filling this gap (Novo et al., 2013). Geo-physical prospection has been applied in diverse
Received 11 February 2015Accepted 20 June 2015
28 P. Mozzi et al.
archaeological settings, spanning from large Prehistoricand Protohistoric sites (Conyers et al., 2013; Mele et al.,2013; De Smedt et al., 2014), to Roman military settle-ments (Drahor et al., 2008; Fassbinder, 2010) and cities(Gaffney et al., 2008; Papadopoulos et al., 2012;Vermeulen, 2012; Boschi, 2012).Here we present a geophysical analysis of the
Roman city of Altinum near Venice, Italy, usingmultispectral aerial and satellite images, magneticgradiometer, electrical resistivity, ground-penetratingradar (GPR), and frequency domain electromagnetics(FDEM). The aim of the investigation was to definethe three-dimensional geometry and degree of preser-vation of buried features such as the forum, theatres,temple, city walls, main roads and canals, in order tobetter understand functions and relationships betweenpublic, religious, residential and more productiveareas of the city.Strategically located along the inner margin of the
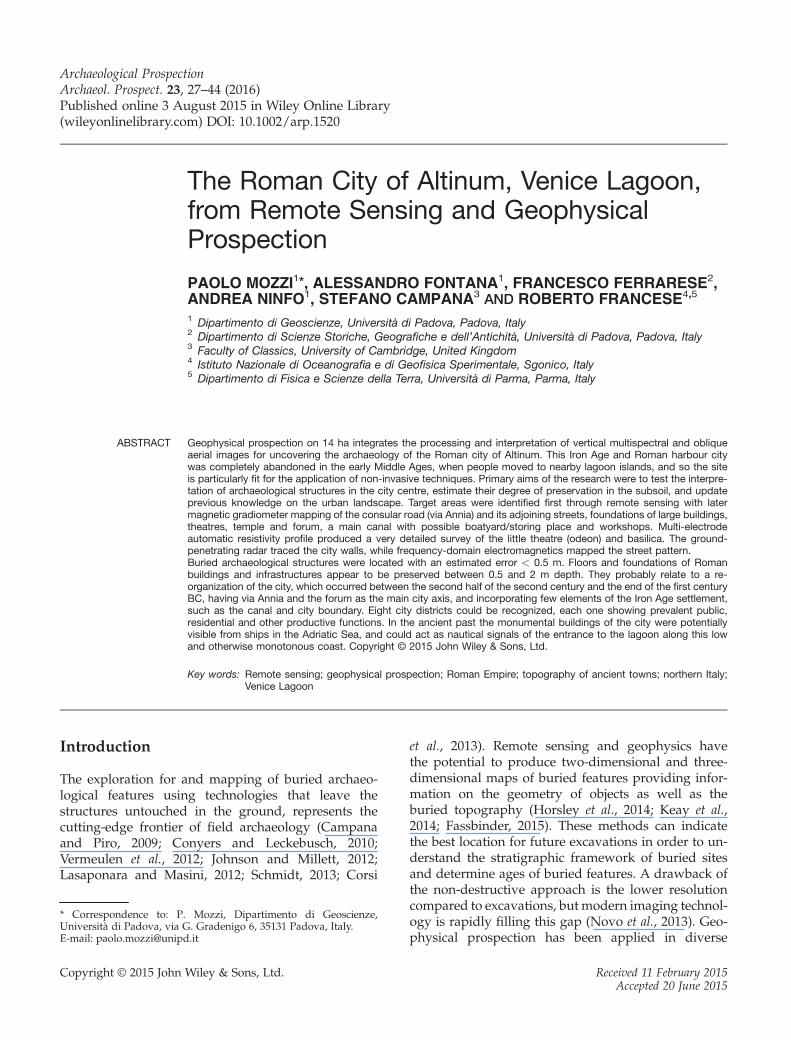
Venice Lagoon (Figure 1), Altinum was a major IronAge and Roman harbour city, which took full advantage
Figure 1. Location of the study area. (A) The city of Altinum, with red lines repmodel of the eastern sector of Venice Lagoon and its mainland where a topoin colour online at wileyonlinelibrary.com/journal/arp
Copyright © 2015 John Wiley & Sons, Ltd.
of its central position in the network of trades fromthe eastern Mediterranean to central Europe (Tirelli,2011a). It was abandoned between the sixth and theseventh century AD, as its inhabitants sought refugefrom warfare and insecurity by moving to the lagoonisland of Torcello (De Min, 2000; Ammerman andMcClennen, 2001; Calaon, 2014), and others nearby(Traviglia and Cottica, 2011; Gelichi et al., 2012).Altinum is a unique example of a Roman city in Italy
and Europe, as it has not been buried by later build-ings and other infrastructures from the Middle Agesuntil modern times. The ancient city is now farmlandthat was reclaimed between the nineteenth and earlytwentieth century. Furthermore, the urban centre hasnot been the object of extensive archaeological excava-tions during the last two centuries (Paveggio, 2011), aswas the case at most other abandoned cities in Italyand the Mediterranean area (Christie, 2012). The lackof excavations and other construction activity haspreserved the archaeological record, which can nowbe investigated with modern scientific methods.
orting the urban walls and the major Roman roads; (B) digital elevationgraphic mound corresponds to the ancient site. This figure is available
Archaeol. Prospect. 23, 27–44 (2016)DOI: 10.1002/arp
29Altinum from Remote Sensing and Geophysics
Archaeological research in Altinum has produced awealth of new data on the structure, organization andevolution of a Roman city over a long period of timefrom the end of the Iron Age to Late Antiquity. Thoughheavily despoiled during the Middle Ages, processingand interpretation of digital aerial pictures show thatthe Roman city is well-preserved at shallow depth(Ninfo et al., 2009). The high visibility of buried struc-tures from remote sensing evidences the exceptionalpreservation of the site (Renfrew and Bahn, 2012). Inaddition to aerial photographs only a small magneto-metric survey had been conducted prior to this researchto test the presence of buried streets and wall founda-tions in an area where information from aerial imageswas lacking (Veronese, 2000). Using this informationwe then focused our research on the integration ofnewly acquired remote sensing images with geophysi-cal investigations in key areas of the city centre.Another key issue that was focused on relates to
Altinum’s early colonization along the lagoon. Therewere Roman settlements at Torcello since the secondcentury AD (Ammerman and McClennen, 2001;Calaon, 2014), and nearby at San Lorenzo di Ammianasince the fourth century AD (Gelichi et al., 2012) (seeFigure 1 for location). There probably was a directand active role by the people from Altinum in the de-velopment of the early Medieval settlement of Torcello,
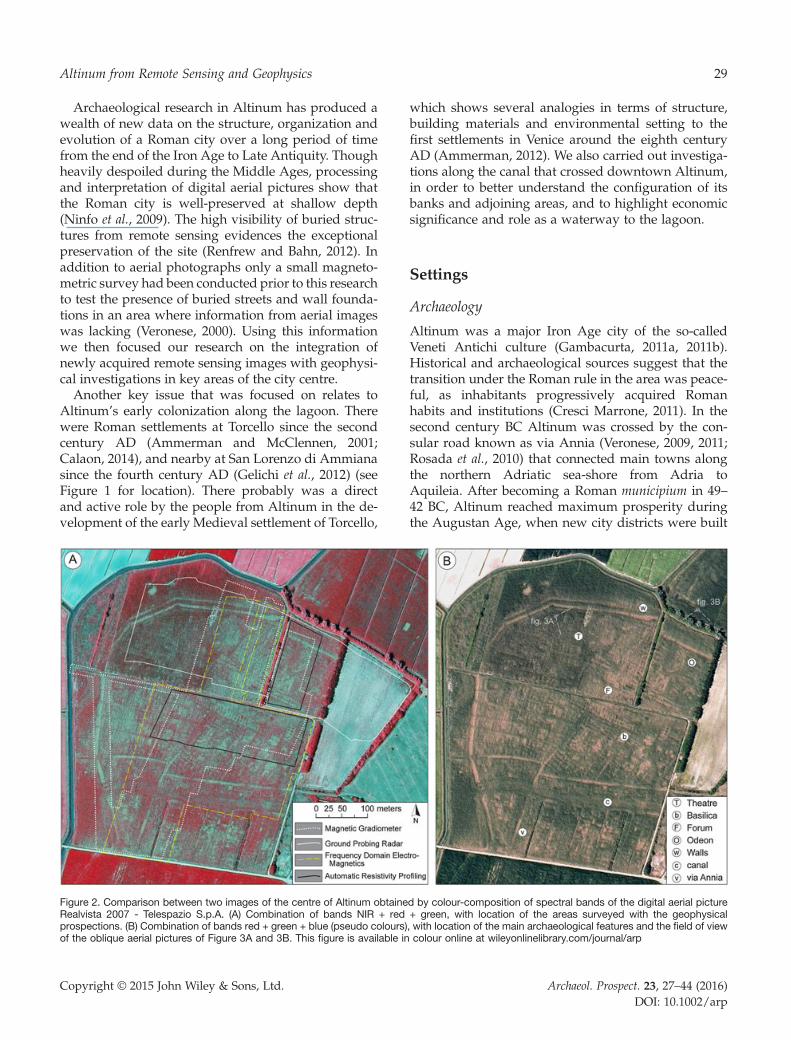
Figure 2. Comparison between two images of the centre of Altinum obtaineRealvista 2007 - Telespazio S.p.A. (A) Combination of bands NIR + redprospections. (B) Combination of bands red + green + blue (pseudo colours)of the oblique aerial pictures of Figure 3A and 3B. This figure is available in
Copyright © 2015 John Wiley & Sons, Ltd.
which shows several analogies in terms of structure,building materials and environmental setting to thefirst settlements in Venice around the eighth centuryAD (Ammerman, 2012). We also carried out investiga-tions along the canal that crossed downtown Altinum,in order to better understand the configuration of itsbanks and adjoining areas, and to highlight economicsignificance and role as a waterway to the lagoon.
Settings
Archaeology
Altinum was a major Iron Age city of the so-calledVeneti Antichi culture (Gambacurta, 2011a, 2011b).Historical and archaeological sources suggest that thetransition under the Roman rule in the area was peace-ful, as inhabitants progressively acquired Romanhabits and institutions (Cresci Marrone, 2011). In thesecond century BC Altinum was crossed by the con-sular road known as via Annia (Veronese, 2009, 2011;Rosada et al., 2010) that connected main towns alongthe northern Adriatic sea-shore from Adria toAquileia. After becoming a Roman municipium in 49–42 BC, Altinum reached maximum prosperity duringthe Augustan Age, when new city districts were built
d by colour-composition of spectral bands of the digital aerial picture+ green, with location of the areas surveyed with the geophysical, with location of the main archaeological features and the field of viewcolour online at wileyonlinelibrary.com/journal/arp
Archaeol. Prospect. 23, 27–44 (2016)DOI: 10.1002/arp
30 P. Mozzi et al.
east of the pre-Roman centre towards the lagoon(Ninfo et al., 2009, Figure 2 in Supporting Online Mate-rials; Tirelli, 2011b). The city was characterized by thepresence of theatres, an amphitheatre and forum, largeresidential areas, a harbour, and was crossed by a largeeast–west (E–W) oriented canal (Ninfo et al., 2009;Mozzi et al., 2011a, 2011b). A new road connectingAltinum with the town of Tarvisium (Treviso) and theAlpine area, called via Claudia Augusta, was con-structed in AD 47 (Rosada, 2002).The decline of Altinum started in the third century
AD and continued during the Late Antiquity(Danckers, 2011). In the fourth century Altinum wasstill an urban centre of importance that was recurrentlyvisited by Roman emperors and also the location of aBishop’s seat at the beginning of the fifth century AD(Calaon, 2006). In a twelfth–thirteenth century faithfulreproduction of a fourth century map of the road net-work in the Roman Empire, the Tabula Peutingeriana,Altinum is reported as an important city along thevia Annia. Altinum was sacked by the Huns in AD452 and during the following decades it turned into amilitary stronghold involved in the Goth–Byzantinewar. Altinum was taken by the Lombards in 568, butthe Bishop’s seat was retained until 639, when it wasrelocated in the cathedral of Torcello Island.The remains of multiple superimposed structures
from this millennium-long history is an anthropogenicmound that extends for about 1 km2 and reaches amaximum thickness of about 3.5 m above the underly-ing alluvial deposits (Ninfo et al., 2009; Mozzi et al.,2011a). Archaeological excavations have been carriedout rather systematically in the pre-Roman and Romannecropolis around the town since the 1950s, and in lim-ited sectors at the margin of the Roman city (Tirelli,2011c), but not in the core of the urban area. In this corearea 3–1.5 m below the present surface, test excava-tions show the presence of earth floors, hearths andremnants of clay-and-wood walls, which are the re-mains of dwellings and associated work areas fromthe fourth to the end of the second century BC (Groppoand Pujatti, 2009; Gambacurta, 2011a). Above thoserelatively simple structures are the foundations of afirst century BC to a first century AD wealthy Romanhouse (domus), decorated with rich mosaics, whichwas destroyed and robbed of building material in thefourth–fifth century AD. Two inhumation tombs with-out grave goods were then cut into the rubble levels,perhaps in Late Antiquity or early Medieval times.Nearby there are the wall foundations and pools of abath built at the end of the first century BC to the be-ginning of the first century AD, which faced a 4.5-mlarge road constructed of trachyte cobbles (Cipriano,
Copyright © 2015 John Wiley & Sons, Ltd.
2010). These thermal bath structures were also partlydestroyed in the fourth–fifth century AD.
Geomorphology
Altinum lies at the margin of the Venice Lagoon, on aportion of alluvial plain at the distal fringe of a largedistributary fluvial system (megafan) formed by theBrenta River during the Last Glacial Maximum(LGM) (Mozzi, 2005; Fontana et al., 2010, 2014).Alluvial sediments below archaeological depositsare silt and clay with occasional intercalated peatbeds and sandy lenses. A well-developed soil withcharacteristic calcic horizons, locally known as‘caranto’ (Mozzi et al., 2003; Donnici et al., 2011), iscommonly present around Altinum, and was ob-served in cores in the city centre at the top of theLGM sediments below the archaeological mound(Mozzi et al., 2011a).The Holocene fluvial network around the city is rep-
resented by the Sile, Zero, and Dese rivers (Figure 1A),which are fed by springs originating in the alluvial plainabout 40 km from the coastline. The relative sea levelrise after the first century BC is estimated 1.7 ± 0.5 min this sector of the lagoon (Antonioli et al., 2009). So,in response to relative sea level rise, these rivers havebeen building small deltas in the lagoon during post-Roman times (Tosi et al., 2007; Primon and Mozzi,2014). In the Middle Ages brackish swamps surroundedthe urban area of Altinum.Since the Renaissance, significant reclamation works
were carried out as the Sile River was diverted from thelagoon in 1684 through an artificial canal (‘Taglio delSile’). A dike was built to defend land from the transgres-sion of lagoon water, due to continuous land subsidenceaveraging 0.6 mm/yr (Antonioli et al., 2009). Duringthe first half of the twentieth century the area, which isnow largely below mean sea level (Figure 1B), wasreclaimed and the hydrography is now controlled bydraining pumps, which keep the underground watertable at average depth of 2 m.
Methods
Remote sensing
A large set of images acquired from aerial and satelliteplatforms at different times, with visible and multi-spectral sensors, was used in the research (Table 1).Processing of panchromatic images was conductedthrough stretching and filtering (directional, low andhigh pass, Laplacian, Erode, Dilate) (Haralick et al.,
Archaeol. Prospect. 23, 27–44 (2016)DOI: 10.1002/arp
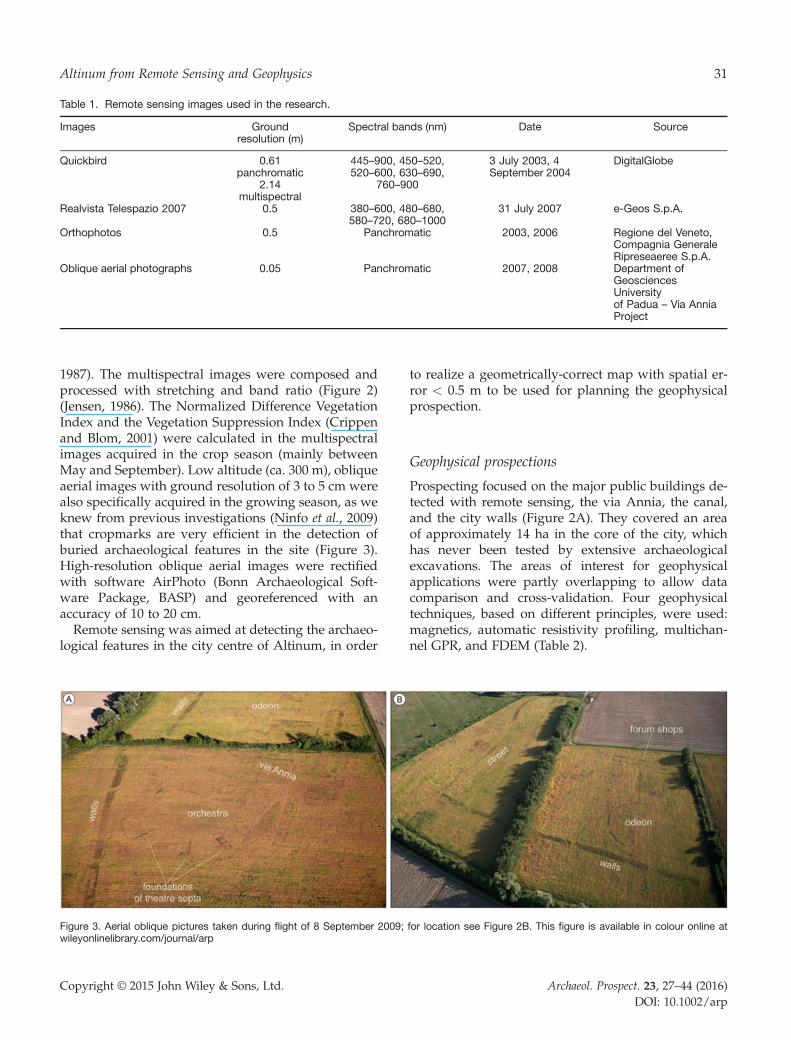
Table 1. Remote sensing images used in the research.
Images Groundresolution (m)
Spectral bands (nm) Date Source
Quickbird 0.61panchromatic
2.14multispectral
445–900, 450–520,520–600, 630–690,
760–900
3 July 2003, 4September 2004
DigitalGlobe
Realvista Telespazio 2007 0.5 380–600, 480–680,580–720, 680–1000
31 July 2007 e-Geos S.p.A.
Orthophotos 0.5 Panchromatic 2003, 2006 Regione del Veneto,Compagnia GeneraleRipreseaeree S.p.A.
Oblique aerial photographs 0.05 Panchromatic 2007, 2008 Department ofGeosciencesUniversityof Padua – Via AnniaProject
31Altinum from Remote Sensing and Geophysics
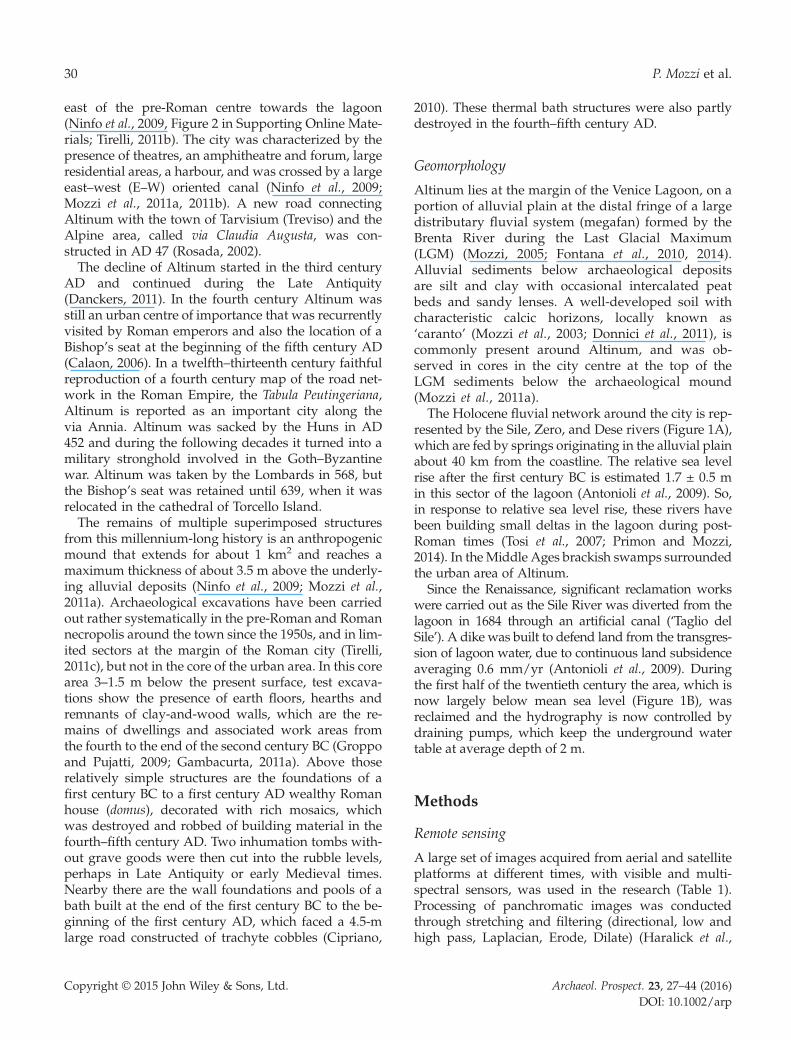
1987). The multispectral images were composed andprocessed with stretching and band ratio (Figure 2)(Jensen, 1986). The Normalized Difference VegetationIndex and the Vegetation Suppression Index (Crippenand Blom, 2001) were calculated in the multispectralimages acquired in the crop season (mainly betweenMay and September). Low altitude (ca. 300 m), obliqueaerial images with ground resolution of 3 to 5 cm werealso specifically acquired in the growing season, as weknew from previous investigations (Ninfo et al., 2009)that cropmarks are very efficient in the detection ofburied archaeological features in the site (Figure 3).High-resolution oblique aerial images were rectifiedwith software AirPhoto (Bonn Archaeological Soft-ware Package, BASP) and georeferenced with anaccuracy of 10 to 20 cm.Remote sensing was aimed at detecting the archaeo-
logical features in the city centre of Altinum, in order
Figure 3. Aerial oblique pictures taken during flight of 8 September 2009;wileyonlinelibrary.com/journal/arp
Copyright © 2015 John Wiley & Sons, Ltd.
to realize a geometrically-correct map with spatial er-ror < 0.5 m to be used for planning the geophysicalprospection.
Geophysical prospections
Prospecting focused on the major public buildings de-tected with remote sensing, the via Annia, the canal,and the city walls (Figure 2A). They covered an areaof approximately 14 ha in the core of the city, whichhas never been tested by extensive archaeologicalexcavations. The areas of interest for geophysicalapplications were partly overlapping to allow datacomparison and cross-validation. Four geophysicaltechniques, based on different principles, were used:magnetics, automatic resistivity profiling, multichan-nel GPR, and FDEM (Table 2).
for location see Figure 2B. This figure is available in colour online at
Archaeol. Prospect. 23, 27–44 (2016)DOI: 10.1002/arp
Table 2. Instruments, field conditions and times of acquisition of geophysical data.
Method Instrument Area(ha)
Surface field condition Last rainfallbeforesurvey
Topsoilmoisture
Time ofacquisition
Magnetic gradiometer Foersterfluxgate
10 Smooth in S sector;N–S furrows, depth
10–20 cm, spacing 50cm in N sector
30 mm, 6days before
Slightlymoist
early May2009, 6 days
Electrical resistivity ARP© 4 Smooth 15 mm, 5days before
Slightly moist early April2009, 1 day
Ground-penetratingradar (GPR)
Stream-IDS 10 Rough <1 mm inthe last 15 days
dry earlyOctober2009, 5 days
Frequency domainelectromagnetics(FDEM)
Gssi EMP-400 11 Smooth <1 mm inthe last 15 days
dry earlyOctober2009, 5 days
32 P. Mozzi et al.
The magnetometry and FDEM surveys (10 and 11ha, respectively) were carried out in southwest–northeast (SW–NE) transects, which comprised thevia Annia and the bridge on the large W–E canal,the forum, theatre, odeon (small theatre) and limitedsectors of the hypothesized city walls (Figure 2A).ARP (4 ha) was concentrated on the forum andthe odeon, while GPR (10 ha) covered the northernsector of the city, including the city walls andtheatres.All the tested systems were equipped with a geo-
detic global positioning system (GPS), operating in realtime kinematic (RTK) mode, which provided precisenavigation and positioning data. General field condi-tions, characteristics and times of geophysical surveyare synthesized in Table 2.
Magnetometry surveyIn this research, a two-wheeled Foerster fluxgate gra-
diometer was equipped with four probes mountedwith equal spacing on a 1.5 m bar. This device issensitive to microvariations of the magnetic field,performing high-resolution measurements (Becker,2009). Data acquisition took place along profiles withsampling density of 5 to 10 cm. The cart with the instru-ment was moved manually. Profiles were spaced 0.5 mapart resulting in a very dense grid. Data acquisitiontook six consecutive days in early May 2009, when thesouthern fields had already been sown for maize andthe ground surface was rather smooth. The fields northof the major E–Wroad were ready for soy-bean sowingand had been ploughed, which made them rougherwith regular north–south (N–S) furrows (maximumdepth 10–20 cm; spacing ca. 50 cm) that introduced aslight background noise in the magnetic measure-ments. Data acquired along the grids were processedusing GIS software Gsys (Powlesland and May, 2010),
Copyright © 2015 John Wiley & Sons, Ltd.
and interpolated emphasizing values in the range±15 nT (Figure 4).
Automatic resistivity profilingElectrical resistivity data were collected with auto-
matic resistivity profiling ARP© system, developedby French CNRS and Geocarta (Dabas, 2009). Elec-trodes for injecting the current into the ground andmeasuring the potential are mounted on cogwheels(Figure 5D). The sensors are connected to a high-speed georesistivimeter and have memory for datastorage. The device was pulled by an all-terrainvehicle (ATV).Data acquisition was undertaken at the beginning of
April 2009 and was completed in a single day. Theground surface was smooth as the fields were readyfor sowing. About 150,000 measures were collectedwithin each hectare (with an average density of 15samples per square metre), with an inline resolutionof 10 cm and 50 cm crossline. Apparent resistivitywas mapped on three different pseudo-depth layersfrom the surface: 0–50 cm, 0–100 cm and 0–200 cm(Figure 5).
Multichannel ground-penetrating radar (GPR)The survey was conducted using a multichannel cart
prototype (Francese et al., 2009) developed byIngegneria dei Sistemi (IDS SpA) and equipped with200MHz antennas. The prototype consists of fourmod-ules, each one comprised of eight dipoles with acrossline spacing of 0.12 m. The dipole was orientedin the towing direction.The GPR survey targeted the northern portion of the
city (Figure 6B) and was carried out in five consecutivedays in early October 2009. The field conditions werenot as good because of the presence of soil clods andcrop debris. This caused poor antenna coupling
Archaeol. Prospect. 23, 27–44 (2016)DOI: 10.1002/arp
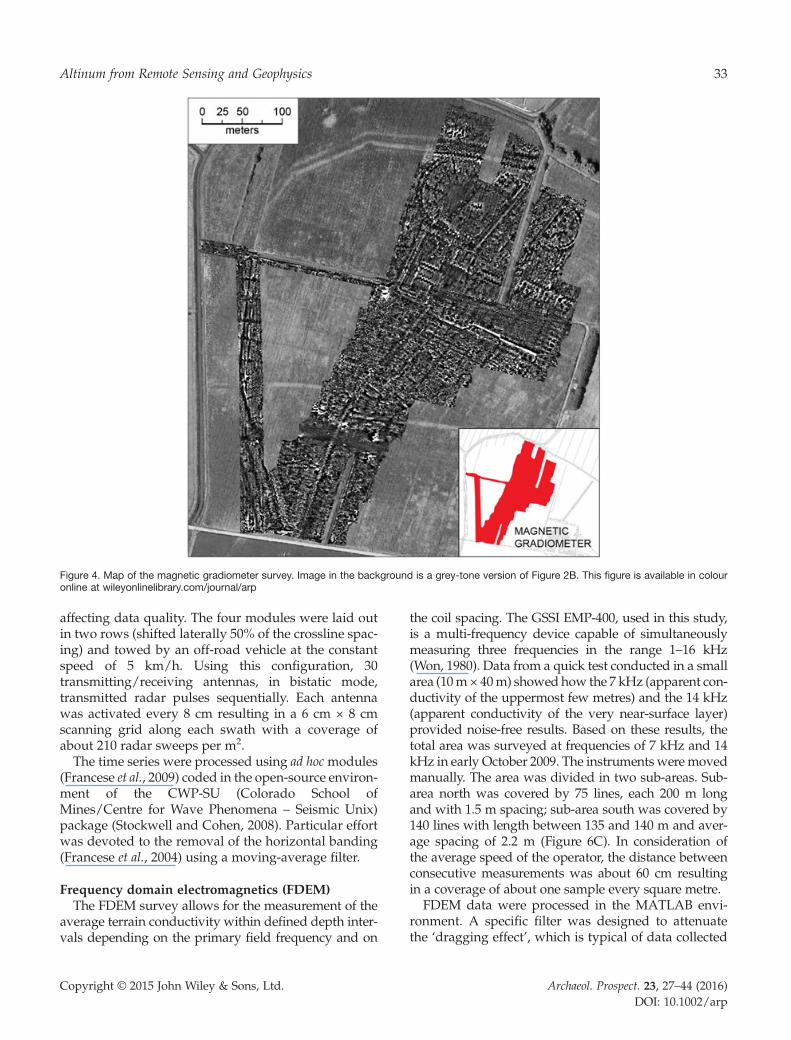
Figure 4. Map of the magnetic gradiometer survey. Image in the background is a grey-tone version of Figure 2B. This figure is available in colouronline at wileyonlinelibrary.com/journal/arp
33Altinum from Remote Sensing and Geophysics
affecting data quality. The four modules were laid outin two rows (shifted laterally 50% of the crossline spac-ing) and towed by an off-road vehicle at the constantspeed of 5 km/h. Using this configuration, 30transmitting/receiving antennas, in bistatic mode,transmitted radar pulses sequentially. Each antennawas activated every 8 cm resulting in a 6 cm × 8 cmscanning grid along each swath with a coverage ofabout 210 radar sweeps per m2.The time series were processed using ad hocmodules
(Francese et al., 2009) coded in the open-source environ-ment of the CWP-SU (Colorado School ofMines/Centre for Wave Phenomena – Seismic Unix)package (Stockwell and Cohen, 2008). Particular effortwas devoted to the removal of the horizontal banding(Francese et al., 2004) using a moving-average filter.
Frequency domain electromagnetics (FDEM)The FDEM survey allows for the measurement of the
average terrain conductivity within defined depth inter-vals depending on the primary field frequency and on
Copyright © 2015 John Wiley & Sons, Ltd.
the coil spacing. The GSSI EMP-400, used in this study,is a multi-frequency device capable of simultaneouslymeasuring three frequencies in the range 1–16 kHz(Won, 1980). Data from a quick test conducted in a smallarea (10m× 40m) showed how the 7 kHz (apparent con-ductivity of the uppermost few metres) and the 14 kHz(apparent conductivity of the very near-surface layer)provided noise-free results. Based on these results, thetotal area was surveyed at frequencies of 7 kHz and 14kHz in early October 2009. The instruments weremovedmanually. The area was divided in two sub-areas. Sub-area north was covered by 75 lines, each 200 m longand with 1.5 m spacing; sub-area south was covered by140 lines with length between 135 and 140 m and aver-age spacing of 2.2 m (Figure 6C). In consideration ofthe average speed of the operator, the distance betweenconsecutive measurements was about 60 cm resultingin a coverage of about one sample every square metre.FDEM data were processed in the MATLAB envi-
ronment. A specific filter was designed to attenuatethe ‘dragging effect’, which is typical of data collected
Archaeol. Prospect. 23, 27–44 (2016)DOI: 10.1002/arp
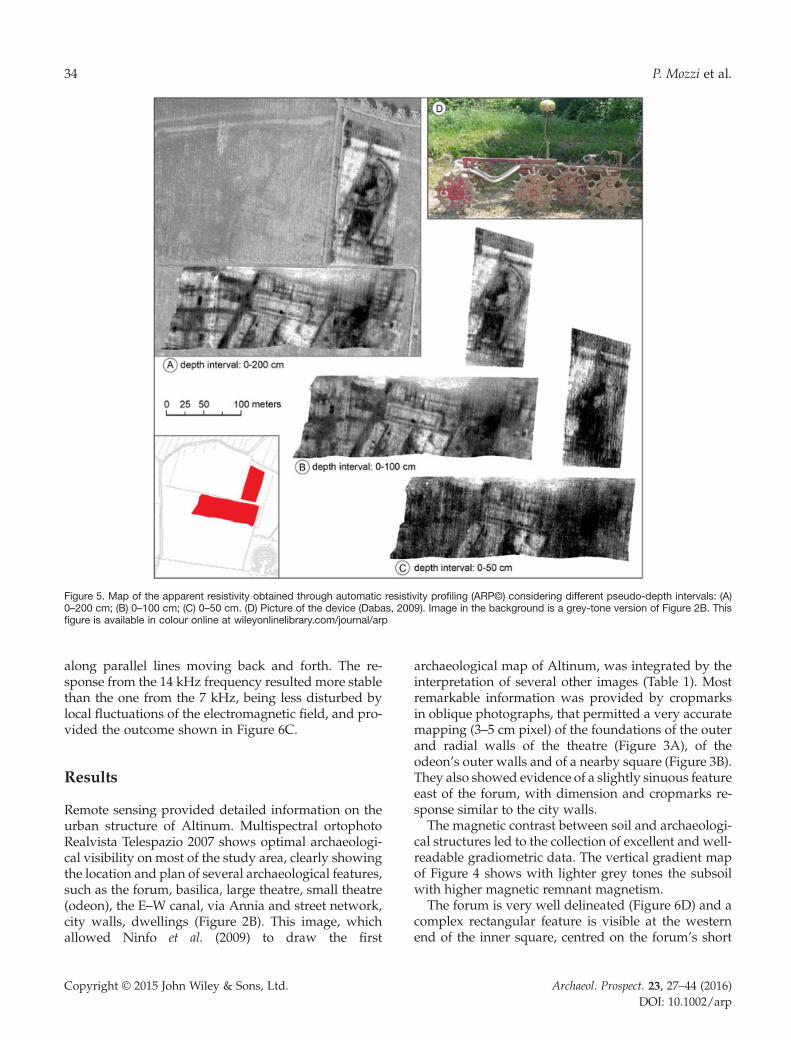
Figure 5. Map of the apparent resistivity obtained through automatic resistivity profiling (ARP©) considering different pseudo-depth intervals: (A)0–200 cm; (B) 0–100 cm; (C) 0–50 cm. (D) Picture of the device (Dabas, 2009). Image in the background is a grey-tone version of Figure 2B. Thisfigure is available in colour online at wileyonlinelibrary.com/journal/arp
34 P. Mozzi et al.
along parallel lines moving back and forth. The re-sponse from the 14 kHz frequency resulted more stablethan the one from the 7 kHz, being less disturbed bylocal fluctuations of the electromagnetic field, and pro-vided the outcome shown in Figure 6C.
Results
Remote sensing provided detailed information on theurban structure of Altinum. Multispectral ortophotoRealvista Telespazio 2007 shows optimal archaeologi-cal visibility on most of the study area, clearly showingthe location and plan of several archaeological features,such as the forum, basilica, large theatre, small theatre(odeon), the E–W canal, via Annia and street network,city walls, dwellings (Figure 2B). This image, whichallowed Ninfo et al. (2009) to draw the first
Copyright © 2015 John Wiley & Sons, Ltd.
archaeological map of Altinum, was integrated by theinterpretation of several other images (Table 1). Mostremarkable information was provided by cropmarksin oblique photographs, that permitted a very accuratemapping (3–5 cm pixel) of the foundations of the outerand radial walls of the theatre (Figure 3A), of theodeon’s outer walls and of a nearby square (Figure 3B).They also showed evidence of a slightly sinuous featureeast of the forum, with dimension and cropmarks re-sponse similar to the city walls.The magnetic contrast between soil and archaeologi-
cal structures led to the collection of excellent and well-readable gradiometric data. The vertical gradient mapof Figure 4 shows with lighter grey tones the subsoilwith higher magnetic remnant magnetism.The forum is very well delineated (Figure 6D) and a
complex rectangular feature is visible at the westernend of the inner square, centred on the forum’s short
Archaeol. Prospect. 23, 27–44 (2016)DOI: 10.1002/arp
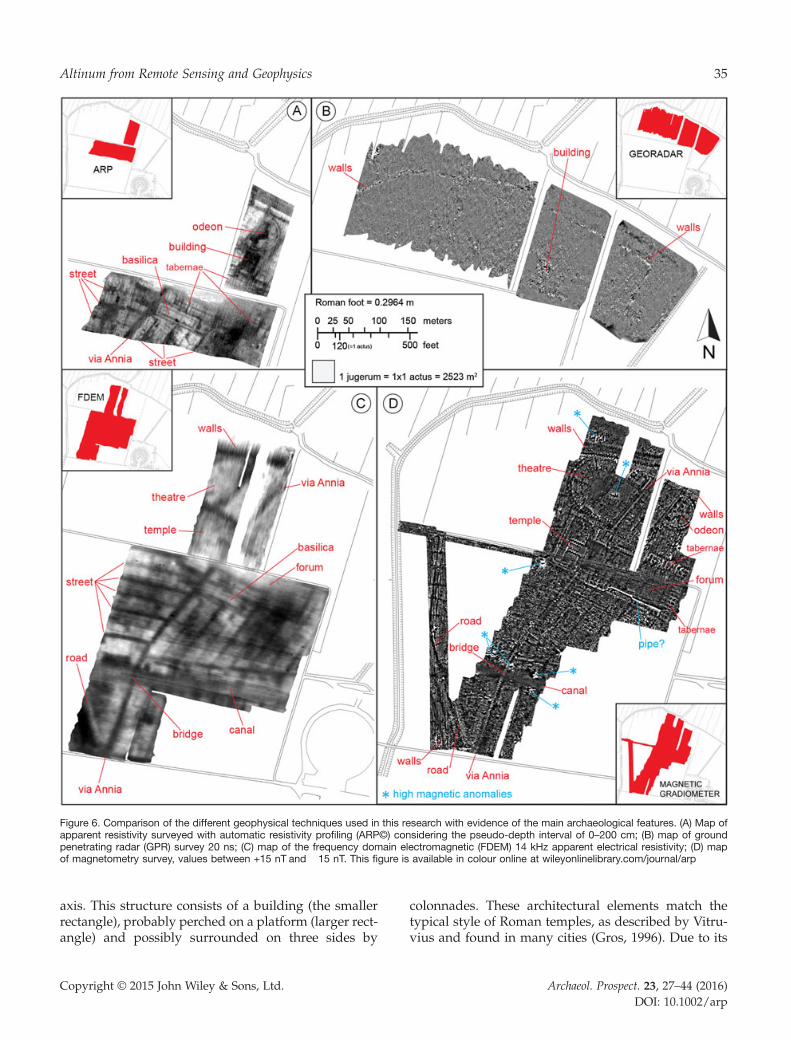
Figure 6. Comparison of the different geophysical techniques used in this research with evidence of the main archaeological features. (A) Map ofapparent resistivity surveyed with automatic resistivity profiling (ARP©) considering the pseudo-depth interval of 0–200 cm; (B) map of groundpenetrating radar (GPR) survey 20 ns; (C) map of the frequency domain electromagnetic (FDEM) 14 kHz apparent electrical resistivity; (D) mapof magnetometry survey, values between +15 nT and �15 nT. This figure is available in colour online at wileyonlinelibrary.com/journal/arp
35Altinum from Remote Sensing and Geophysics
axis. This structure consists of a building (the smallerrectangle), probably perched on a platform (larger rect-angle) and possibly surrounded on three sides by
Copyright © 2015 John Wiley & Sons, Ltd.
colonnades. These architectural elements match thetypical style of Roman temples, as described by Vitru-vius and found in many cities (Gros, 1996). Due to its
Archaeol. Prospect. 23, 27–44 (2016)DOI: 10.1002/arp
36 P. Mozzi et al.
geometry and position, it is probably a temple dedi-cated to the triad of Roman gods Jupiter, Juno and Mi-nerva, the so-called capitolium, which is a commonelement in the Roman forum. The temple faced the fo-rum’s square exactly on the continuation of via Annia.Two symmetric features lie on the sides of the temple,altogether occupying the whole western side of the fo-rum. They probably were buildings or open spaces ad-joining the capitolium. The possibility that Altinum hada capitolium was postulated (Tirelli, 2011d), but previ-ous investigations and remote sensing images did notprovide any evidence of its existence.On the other three sides of the forum square
there is a ca. 6 m-wide band suggesting the exis-tence of a colonnade, a typical architectural elementof Roman forums. A large number of rooms withan extent of 4 m × 4 m face the portico and theyare interpreted as market shops (tabernae). Eachroom is paired by a twin one, open towards the ex-terior of the forum. Remarkable is the presence of ahighly-magnetic linear feature aligned with theshops’ walls on the southern side of the forum,probably a metal pipe (fistula) used to bring/drainwater to/from the forum area. The magnetometrymap (Figure 4) shows that some linear features areoriented NNE–SSW that cross the forum, on thecontinuation of the streets which extend north andsouth. This suggests that the street network mayhave existed before the forum was built.The via Annia shows up very clearly as a highly-
magnetic linear feature. Its track is evident also acrossthe E–W oriented canal, suggesting the presence ofremnants of the bridge. Two major urban roads, oneoriginating westwards from the via Annia in thesouthern sector of the city, and another eastwardson the northern bank of the E–W canal, are evidencedby similar magnetic response. A network of minorstreets also shows up, even if more blurred. Trachyterock from the Euganean Hills, near Padua, was exten-sively used in Roman times for paving roads in thewhole northern Adriatic region, and the excavationof small portions of urban roads attests its use alsoin Altinum (Cipriano, 2010; Tirelli, 2011b). This lithol-ogy contains magnetite and ilmenite as magneticmineral constituents (Capedri et al., 2000; Maritanet al., 2013). The high remnant magnetism along viaAnnia and other roads in Altinum is probably dueto the presence of trachyte slabs in the undergroundas part of the road pavement. The northern exit ofthe via Annia from the forum appears as if cut bythe walls of the buildings facing the square. This sug-gests the via Annia entered the forum under archesbuilt between these buildings.
Copyright © 2015 John Wiley & Sons, Ltd.
The outer circular walls of the theatre are evident, aswell as the traces of some of the radial and concentricwalls which supported the seating (cavea). This latterappears subdivided in three concentric rings over-whelming the hemispheric orchestra and facing thestage (proscaenium and pulpitum). The geometry of thetheatre follows the usual Vitruvian proportions (Gros,1996) with the position of the stage front correspond-ing to the side of the equilateral triangle of 30 minscribed within the orchestra circle. The theatre mayhave been 30–40 m high and stood on the highest partof the city, about 4 m above the surrounding plain. Be-tween the theatre and the via Annia there is a largerectangular space. It resembles in shape and positionto the area located in front of the theatre next to the ‘tri-angular forum’ in Pompei, the so-called Samnite palaes-tra (Pesando, 2000), which was used for athleticcompetitions of young people and political and mili-tary meetings. A similar use can be hypothesized forthe area in Altinum, where a very high magneticanomaly may correspond to pipes or other structures,possibly related to pools/fountains.The circular walls enclosing the cavea of the smaller
theatre (odeon) are only approximately delineated bythe magnetometry survey. A much better image is pro-vided by ARP (Figures 5 and 6A), which clearly showsthe semicircular orchestra and the position of the stage.The odeon appears to be contoured at the back by anarrow street, while the front opens to a larger streetparallel to the via Annia. ARP data further show thatbetween the odeon and the forum there is a wide rect-angular space. Owing to its dimension and proximityto the forum, this may have been a public space usedfor large assemblies (curia). At the centre of the south-ern side there is a polygonal feature (dimensions 12m × 5 m), possibly the foundation of a platform forspeakers (rostrum) or a major monument. The basilicasouth of the forum consists of two concentric rectangu-lar structures, probably related to the presence of col-onnades within the hall. A southern entrance of thebasilica can be seen in correspondence of a street whichis parallel to the via Annia, and precisely aligned withthe one that faces the odeon.GPR did not provide relevant data on most of the ur-
ban area other than important linear reflectors that runat the northern boundary of the city, showing up at adepth of about 0.7–0.8 m (time slice 20 ns) just belowthe plough horizon (Figure 6B). These linear featureswere also detected in aerial images (Figures 2 and 3B)and, on short sectors, in magnetometry, ARP andFDEM surveys (Figures 6 and 7), and are interpretedas the foundations of the city walls. The poor data qual-ity in the GPR map is probably partly related to the
Archaeol. Prospect. 23, 27–44 (2016)DOI: 10.1002/arp
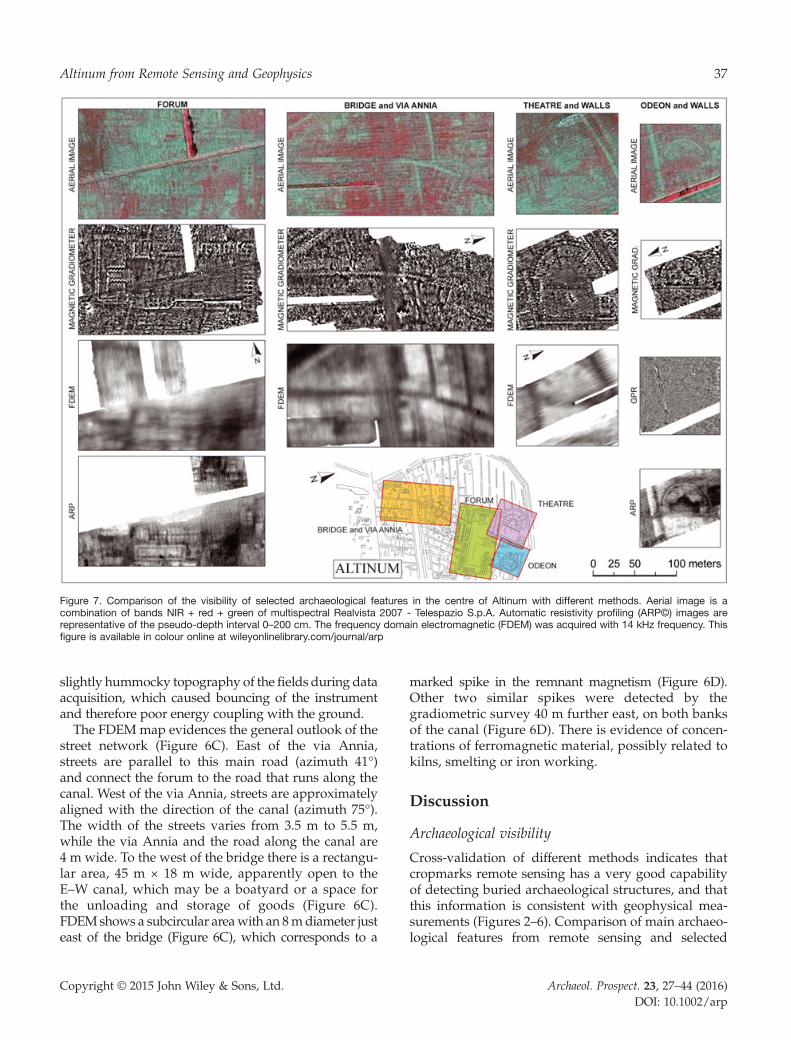
Figure 7. Comparison of the visibility of selected archaeological features in the centre of Altinum with different methods. Aerial image is acombination of bands NIR + red + green of multispectral Realvista 2007 - Telespazio S.p.A. Automatic resistivity profiling (ARP©) images arerepresentative of the pseudo-depth interval 0–200 cm. The frequency domain electromagnetic (FDEM) was acquired with 14 kHz frequency. Thisfigure is available in colour online at wileyonlinelibrary.com/journal/arp
37Altinum from Remote Sensing and Geophysics
slightly hummocky topography of the fields during dataacquisition, which caused bouncing of the instrumentand therefore poor energy coupling with the ground.The FDEMmap evidences the general outlook of the
street network (Figure 6C). East of the via Annia,streets are parallel to this main road (azimuth 41°)and connect the forum to the road that runs along thecanal. West of the via Annia, streets are approximatelyaligned with the direction of the canal (azimuth 75°).The width of the streets varies from 3.5 m to 5.5 m,while the via Annia and the road along the canal are4 m wide. To the west of the bridge there is a rectangu-lar area, 45 m × 18 m wide, apparently open to theE–W canal, which may be a boatyard or a space forthe unloading and storage of goods (Figure 6C).FDEMshows a subcircular areawith an 8mdiameter justeast of the bridge (Figure 6C), which corresponds to a
Copyright © 2015 John Wiley & Sons, Ltd.
marked spike in the remnant magnetism (Figure 6D).Other two similar spikes were detected by thegradiometric survey 40 m further east, on both banksof the canal (Figure 6D). There is evidence of concen-trations of ferromagnetic material, possibly related tokilns, smelting or iron working.
Discussion
Archaeological visibility
Cross-validation of different methods indicates thatcropmarks remote sensing has a very good capabilityof detecting buried archaeological structures, and thatthis information is consistent with geophysical mea-surements (Figures 2–6). Comparison of main archaeo-logical features from remote sensing and selected
Archaeol. Prospect. 23, 27–44 (2016)DOI: 10.1002/arp
38 P. Mozzi et al.
geophysical methods are found in Figure 7. The lowvisibility in remote sensing images of the western por-tion of the forummay be due either to slight differencesin field conditions at image acquisition, as cropmarksare very sensitive to local changes in land use and soilmoisture, or to the presence of a thicker cover of debris,which hides the underlying structures.The lack of information in the fields east of the forum
and odeon in Figure 2A is evidently related to land useat the time of image acquisition. Oblique aerial photo-graphs of the samefieldswith ripemaize, shot two yearslater, show important linear cropmarks interpreted as amain street and part of the city walls (Figure 3B). Thesefeatures were detected also by GPR, as shown inFigure 6B. A magnetometry survey carried out slightlyeast of the studied area, in the field at the eastern marginof Figure 2A (Veronese, 2000), confirms the continuationof the city in that direction (Ninfo et al., 2009).Our magnetometry survey provided good results
and when used in conjunction with ARP produced ex-cellent data with very fast acquisition routine and con-trol on the depth of subsoil acquisition. FDEM wasuseful for providing a general outlook of main struc-tures and a finer data acquisition grid is probably
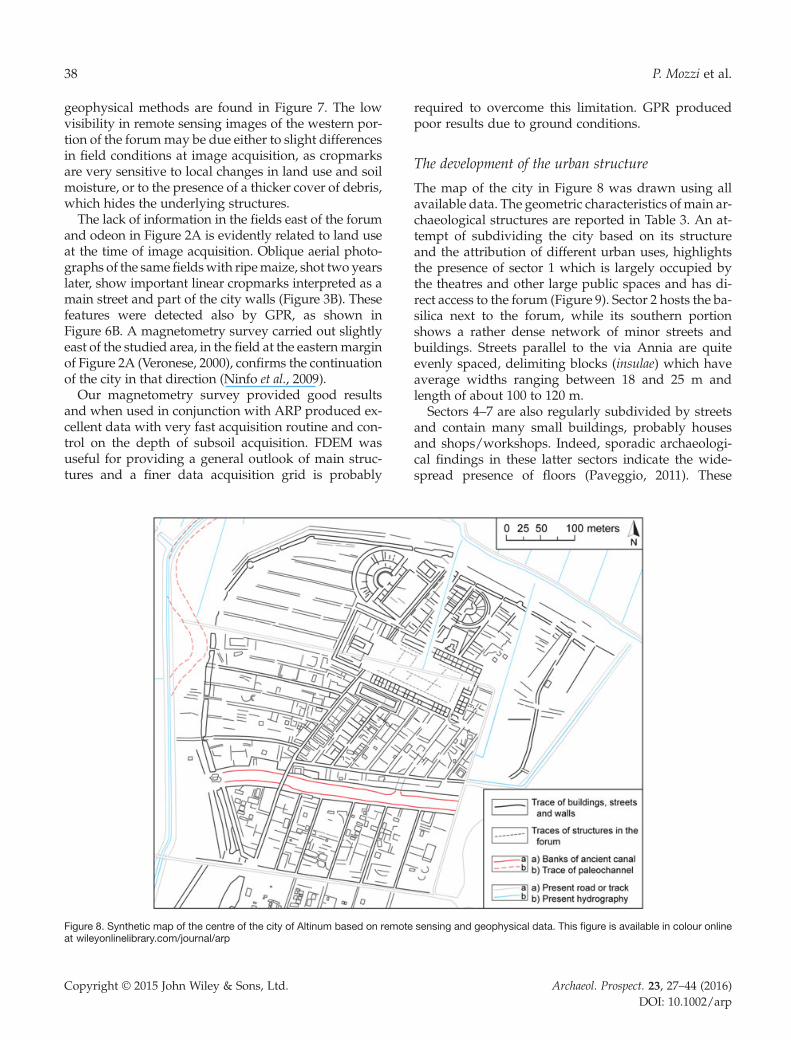
Figure 8. Synthetic map of the centre of the city of Altinum based on remoteat wileyonlinelibrary.com/journal/arp
Copyright © 2015 John Wiley & Sons, Ltd.
required to overcome this limitation. GPR producedpoor results due to ground conditions.
The development of the urban structure
The map of the city in Figure 8 was drawn using allavailable data. The geometric characteristics of main ar-chaeological structures are reported in Table 3. An at-tempt of subdividing the city based on its structureand the attribution of different urban uses, highlightsthe presence of sector 1 which is largely occupied bythe theatres and other large public spaces and has di-rect access to the forum (Figure 9). Sector 2 hosts the ba-silica next to the forum, while its southern portionshows a rather dense network of minor streets andbuildings. Streets parallel to the via Annia are quiteevenly spaced, delimiting blocks (insulae) which haveaverage widths ranging between 18 and 25 m andlength of about 100 to 120 m.Sectors 4–7 are also regularly subdivided by streets
and contain many small buildings, probably housesand shops/workshops. Indeed, sporadic archaeologi-cal findings in these latter sectors indicate the wide-spread presence of floors (Paveggio, 2011). These
sensing and geophysical data. This figure is available in colour online
Archaeol. Prospect. 23, 27–44 (2016)DOI: 10.1002/arp
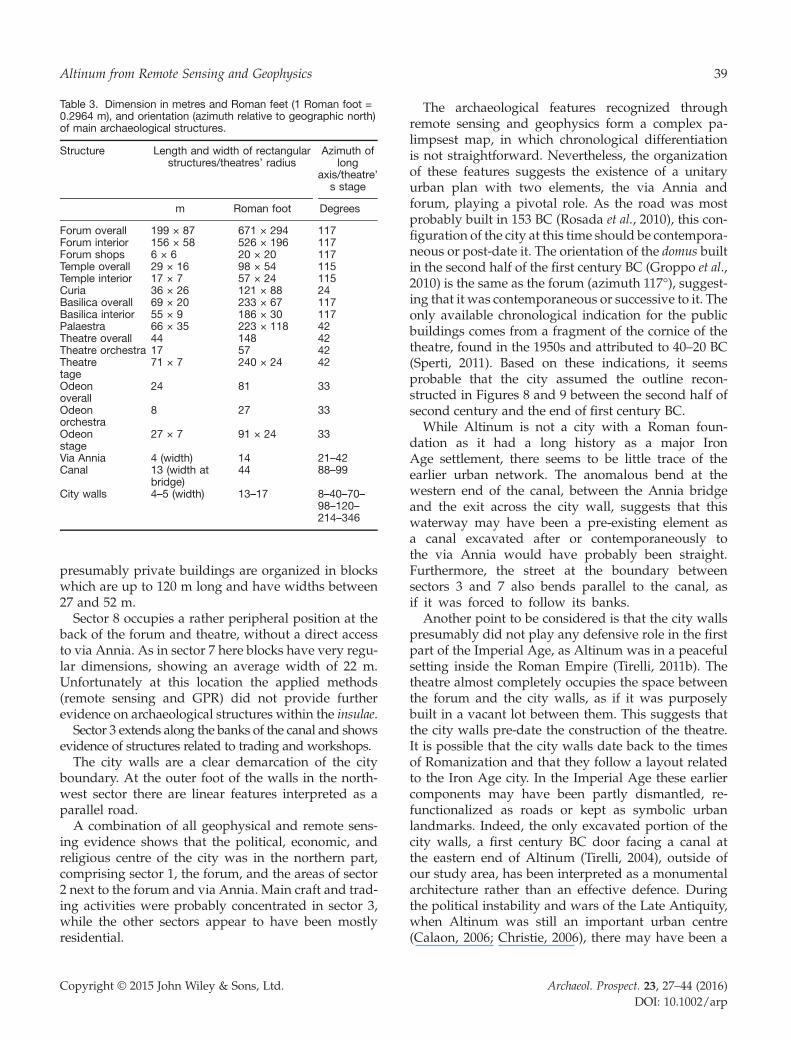
Table 3. Dimension in metres and Roman feet (1 Roman foot =0.2964 m), and orientation (azimuth relative to geographic north)of main archaeological structures.
Structure Length and width of rectangularstructures/theatres’ radius
Azimuth oflong
axis/theatre’s stage
m Roman foot Degrees
Forum overall 199 × 87 671 × 294 117Forum interior 156 × 58 526 × 196 117Forum shops 6 × 6 20 × 20 117Temple overall 29 × 16 98 × 54 115Temple interior 17 × 7 57 × 24 115Curia 36 × 26 121 × 88 24Basilica overall 69 × 20 233 × 67 117Basilica interior 55 × 9 186 × 30 117Palaestra 66 × 35 223 × 118 42Theatre overall 44 148 42Theatre orchestra 17 57 42Theatretage
71 × 7 240 × 24 42
Odeonoverall
24 81 33
Odeonorchestra
8 27 33
Odeonstage
27 × 7 91 × 24 33
Via Annia 4 (width) 14 21–42Canal 13 (width at
bridge)44 88–99
City walls 4–5 (width) 13–17 8–40–70–98–120–214–346
39Altinum from Remote Sensing and Geophysics
presumably private buildings are organized in blockswhich are up to 120 m long and have widths between27 and 52 m.Sector 8 occupies a rather peripheral position at the
back of the forum and theatre, without a direct accessto via Annia. As in sector 7 here blocks have very regu-lar dimensions, showing an average width of 22 m.Unfortunately at this location the applied methods(remote sensing and GPR) did not provide furtherevidence on archaeological structures within the insulae.Sector 3 extends along the banks of the canal and shows
evidence of structures related to trading and workshops.The city walls are a clear demarcation of the city
boundary. At the outer foot of the walls in the north-west sector there are linear features interpreted as aparallel road.A combination of all geophysical and remote sens-
ing evidence shows that the political, economic, andreligious centre of the city was in the northern part,comprising sector 1, the forum, and the areas of sector2 next to the forum and via Annia. Main craft and trad-ing activities were probably concentrated in sector 3,while the other sectors appear to have been mostlyresidential.
Copyright © 2015 John Wiley & Sons, Ltd.
The archaeological features recognized throughremote sensing and geophysics form a complex pa-limpsest map, in which chronological differentiationis not straightforward. Nevertheless, the organizationof these features suggests the existence of a unitaryurban plan with two elements, the via Annia andforum, playing a pivotal role. As the road was mostprobably built in 153 BC (Rosada et al., 2010), this con-figuration of the city at this time should be contempora-neous or post-date it. The orientation of the domus builtin the second half of the first century BC (Groppo et al.,2010) is the same as the forum (azimuth 117°), suggest-ing that it was contemporaneous or successive to it. Theonly available chronological indication for the publicbuildings comes from a fragment of the cornice of thetheatre, found in the 1950s and attributed to 40–20 BC(Sperti, 2011). Based on these indications, it seemsprobable that the city assumed the outline recon-structed in Figures 8 and 9 between the second half ofsecond century and the end of first century BC.While Altinum is not a city with a Roman foun-
dation as it had a long history as a major IronAge settlement, there seems to be little trace of theearlier urban network. The anomalous bend at thewestern end of the canal, between the Annia bridgeand the exit across the city wall, suggests that thiswaterway may have been a pre-existing element asa canal excavated after or contemporaneously tothe via Annia would have probably been straight.Furthermore, the street at the boundary betweensectors 3 and 7 also bends parallel to the canal, asif it was forced to follow its banks.Another point to be considered is that the city walls
presumably did not play any defensive role in the firstpart of the Imperial Age, as Altinum was in a peacefulsetting inside the Roman Empire (Tirelli, 2011b). Thetheatre almost completely occupies the space betweenthe forum and the city walls, as if it was purposelybuilt in a vacant lot between them. This suggests thatthe city walls pre-date the construction of the theatre.It is possible that the city walls date back to the timesof Romanization and that they follow a layout relatedto the Iron Age city. In the Imperial Age these earliercomponents may have been partly dismantled, re-functionalized as roads or kept as symbolic urbanlandmarks. Indeed, the only excavated portion of thecity walls, a first century BC door facing a canal atthe eastern end of Altinum (Tirelli, 2004), outside ofour study area, has been interpreted as a monumentalarchitecture rather than an effective defence. Duringthe political instability and wars of the Late Antiquity,when Altinum was still an important urban centre(Calaon, 2006; Christie, 2006), there may have been a
Archaeol. Prospect. 23, 27–44 (2016)DOI: 10.1002/arp
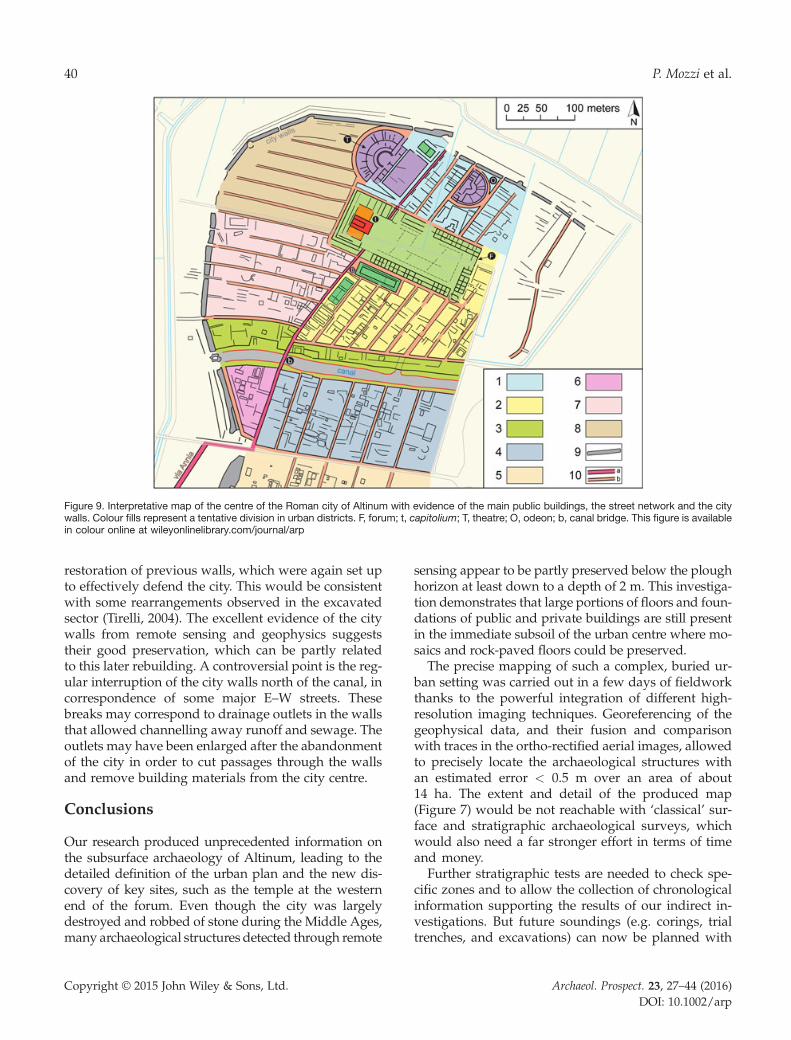
Figure 9. Interpretative map of the centre of the Roman city of Altinum with evidence of the main public buildings, the street network and the citywalls. Colour fills represent a tentative division in urban districts. F, forum; t, capitolium; T, theatre; O, odeon; b, canal bridge. This figure is availablein colour online at wileyonlinelibrary.com/journal/arp
40 P. Mozzi et al.
restoration of previous walls, which were again set upto effectively defend the city. This would be consistentwith some rearrangements observed in the excavatedsector (Tirelli, 2004). The excellent evidence of the citywalls from remote sensing and geophysics suggeststheir good preservation, which can be partly relatedto this later rebuilding. A controversial point is the reg-ular interruption of the city walls north of the canal, incorrespondence of some major E–W streets. Thesebreaks may correspond to drainage outlets in the wallsthat allowed channelling away runoff and sewage. Theoutlets may have been enlarged after the abandonmentof the city in order to cut passages through the wallsand remove building materials from the city centre.
Conclusions
Our research produced unprecedented information onthe subsurface archaeology of Altinum, leading to thedetailed definition of the urban plan and the new dis-covery of key sites, such as the temple at the westernend of the forum. Even though the city was largelydestroyed and robbed of stone during the Middle Ages,many archaeological structures detected through remote
Copyright © 2015 John Wiley & Sons, Ltd.
sensing appear to be partly preserved below the ploughhorizon at least down to a depth of 2 m. This investiga-tion demonstrates that large portions of floors and foun-dations of public and private buildings are still presentin the immediate subsoil of the urban centre where mo-saics and rock-paved floors could be preserved.The precise mapping of such a complex, buried ur-
ban setting was carried out in a few days of fieldworkthanks to the powerful integration of different high-resolution imaging techniques. Georeferencing of thegeophysical data, and their fusion and comparisonwith traces in the ortho-rectified aerial images, allowedto precisely locate the archaeological structures withan estimated error < 0.5 m over an area of about14 ha. The extent and detail of the produced map(Figure 7) would be not reachable with ‘classical’ sur-face and stratigraphic archaeological surveys, whichwould also need a far stronger effort in terms of timeand money.Further stratigraphic tests are needed to check spe-
cific zones and to allow the collection of chronologicalinformation supporting the results of our indirect in-vestigations. But future soundings (e.g. corings, trialtrenches, and excavations) can now be planned with
Archaeol. Prospect. 23, 27–44 (2016)DOI: 10.1002/arp
41Altinum from Remote Sensing and Geophysics
high accuracy and an efficient cost-effect strategy, limit-ing their number and extent to specific targets.Every technique applied in the site produced an im-
age that is itself a map of part of the city, providing im-ages of particular buried features. The multispectralaerial photo Realvista 2007 provided a complete viewof the city and extraordinary cropmarks of the buriedarchaeological features. Other vertical aerial photo-graphs gave far less information, while some of theoblique pictures taken along the crop season were verypowerful in providing detailed data and particulars,which were not detected in the photo Realvista 2007.Nevertheless, cropmarks do not always allow the dis-crimination of features that relate to spoliation trenchesfrom those relative to structures that are still in situ (e.g.walls, floors, streets). Thus, comparison with geophys-ical methods is necessary for assessing the preservationof buried structures.Among the geophysical techniques, magnetic gradi-
ometer and ARP turned out to be the most efficient inAltinum. Magnetometry survey supplied a very de-tailed and precise map, giving new important cluesabout the internal structures of large buildings andabout the underground setting of the forum square.The temple at the western side of the forum is clearlydetected in the magnetic map, while it is not visiblewith other geophysical or remote sensing methods.ARP produced a very detailed map, especially at thetime-slice at depth of 1–2 m, that allowed to detectsome inner structures not visible with other methodol-ogies. FDEM was very efficient in mapping the streetpattern, but it was only slightly sensitive to other mi-nor elements mostly because of the coarse grid. TheGPR clearly traced the perimeter of the city walls, butit failed in detecting most of the other structures, eventhe theatre that is so visible with all the other methods.Better GPR images may be possible if collected with asmoother ground surface. However, the results suggestthat future geophysical surveys, eventually with amore detailed sampling on some large building andpublic areas, should mainly focus on magnetic andARP methods.The archaeological reconstruction shows that Roman
Altinum was the product of a unitary urban plan, hav-ing the via Annia and the forum as main axis, and in-corporating few elements of the previous Iron Agesettlement. This urban structure, which illustrates thepresence of different districts with specific characteris-tics and use, derives from a re-organization of the citywhich probably occurred between the second half ofsecond century and the end of the first century BC. Itis unclear which modifications occurred during theLate Antiquity.
Copyright © 2015 John Wiley & Sons, Ltd.
Roman Altinum is evidently shaped by a centripetalurban project, which adheres to standardized modelsfound across the whole Roman Empire. Nevertheless,trading and productive activities at Altinum appear tohave been concentrated along the canal which crossedthe city centre and connected it to the lagoon. The cityitself represented a landmark of vital importance alongthis low, monotonous and misty coast, as its mainbuildings, such as the theatre, were at least 40 m highand could be seen from a distance of 20 km. While con-veying a message of political and economic power, thecity skyline may thus have also functioned as a usefulnautical way-point for the ships entering the lagoonfrom the northern Adriatic, and heading to the harbourlocated on the lagoon shore at the outskirts of the city(De Bon, 1938; Ninfo et al., 2009).All this indicates the double-fold character of
Altinum. On the one hand, it was a standard Romancity at the crossroads of two major consular roads,projected towards the mainland. On the other hand, itwas a harbour city open to the lagoon, where it couldcontrol the maritime traffic across a vast labyrinth ofsalt marshes and tidal channels, as well as the exploita-tion of strategic resources such as fish, salt, and seafood(Cresci Marrone and Tirelli, 2003; De Min, 2006). Asdiscussed by Ammerman (2012), the urban fabric ofRoman Altinum is different from the eighth centuryearly Venice, while Torcello possibly represents a firstprototype of a major, fully lagoonal settlement whichpre-dates the Venetian sites at Rivoalto. Nevertheless,people from Altinum most probably had full acquain-tance with the lagoon, which was a vital part of the eco-nomic system of the city and not just a marginalterritory.
Acknowledgements
The study was funded by Regione del Veneto – Settoreprogetti strategici e politiche comunitarie through a re-search contract with the former Department of Geogra-phy of the University of Padua (DGR n. 3917, 16December 2008; responsible Clara Peranetti and P.Mozzi). The research was carried out in the frameworkof a scientific collaboration with the Soprintendenzaper i beni archeologici del Veneto on ancient Altinum.The oblique aerial photographs were taken within theVia Annia Project (scientific direction FrancescaVeronese) with the help of pilot Franco Stoppini. Theauthors warmly acknowledge Giancarlo Zacchello forallowing to carry out investigations in his estate.The paper was prepared by P. Mozzi and A. Fon-
tana, who contributed equally to the manuscript. F.Ferrarese and A. Ninfo carried out the GIS and remotesensing processing. S. Campana coordinated the
Archaeol. Prospect. 23, 27–44 (2016)DOI: 10.1002/arp
42 P. Mozzi et al.
acquisition and processing of magnetic and ARP databy ATS Archeo Tech & Survey (Dr. Matteo Sordiniand Dr. Francesco Pericci) and SO.IN.G. Strutture eAmbiente S.r.l. (Dr. Gianfranco Morelli)., R. Franceseacquired and processed FDEM and GPR data. Allauthors contributed to data interpretation and discus-sion. The authors thank the reviewers for commentingon the manuscript and L. Conyers for discussion andhelp in the editing process.
References
Ammerman AJ. 2012. Altinum and early Venice. Journal ofRoman Archaeology 25: 696–703.
Ammerman AJ, McClennen C (eds). 2001. Venice beforeSan Marco. Recent Studies on the Origins of the City.Colgate University: Hamilton, NY; 49.
Antonioli F, Ferranti L, Fontana A, et al. 2009. Holocenerelative sea-level changes and vertical movementsalong the Italian and Istrian coastlines. Quaternary In-ternational 206: 101–133.
Becker H. 2009. Caesium-magnetometry for landscape-archaeology. In Seeing the Unseen, Geophysics andLandscape Archaeology, Campana S, Piro S (eds).CRC Press: London; 129–165.
Boschi F. 2012.Magnetic prospecting for the archaeology ofClasse (Ravenna). Archaeological Prospection 19: 219–227.
Calaon D. 2006. Altino (Ve): strumenti diagnostici (GIS eDTM) per l’analisi delle fasi tardoantiche ealtomedievali. In Missioni archeologichedell’Università Ca’ Foscari di Venezia, Atti della VGiornata di Studi 2006, Zaccaria Ruggiu A (ed.).Università Ca’ Foscari: Venezia; 143–158.
Calaon D. 2014. Età tardo-antica e altomedioevo:magazzini, èlites e insediamento. In Torcello excavated,a shared heritage. The 2012–2013 excavation campaign,Calaon D, Zendri E, Biscontin G (eds). Regione delVeneto: Venezia; 209–224.
Campana S, Piro S (eds). 2009 . Seeing the Unseen.Geophysics and Landscape Archaeology. CRC Press:London; 376.
Capedri S, Venturelli G, Grandi R. 2000. Euganean tra-chytes: discrimination of quarried sites by petro-graphic and chemical parameters and by magneticsusceptibility and its bearing on the provenance ofstones of ancient artefacts. Journal of Cultural Heritage1: 341–364.
Christie N. 2006. From Constantine to Charlemagne anarchaeology of Italy AD 300–800. Ashgate Publishing:Farnham; 586.
Christie N. 2012. Urbes Extinctae: Archaeologies of andapproaches to abandoned classical cities. In UrbesExtinctae, Christie N, Augenti A, (eds). Ashgate Pub-lishing: Farnham; 1–45.
Cipriano S. 2010. L’edificio termale di Altino. Quaderni diArcheologia del Veneto 26: 159–167.
Conyers LB, Leckebusch J. 2010. Geophysical archaeology re-search agendas for the future: some ground-penetratingradar examples. Archaeological Prospection 17: 117–123.
Conyers LB, Daniels JM, Haws JA, Benedetti MM. 2013.An Upper Palaeolithic landscape analysis of coastal
Copyright © 2015 John Wiley & Sons, Ltd.
Portugal using ground-penetrating radar. ArchaeologicalProspection 20: 45–51.
Corsi C, Slapsak B, Vermeulen F (eds). 2013. Good Practicein Archaeological Diagnostics: Non-invasive Survey ofComplex Archaeological Sites. Springer: Heidelberg; 347.
Cresci Marrone G. 2011. La città e le parole: il contributodelle fonti letterarie e delle iscrizioni. In Atti del VIConvegno di studi altinati, Altino dal cielo: la cittàtelerivelata, lineamenti di forma urbis, Venezia, 3dicembre 2009, Tirelli M, Cresci Marrone G (eds).Edizioni Quasar: Roma; 117–142.
Cresci Marrone G, Tirelli M (eds). 2003. Produzioni,Merci, Commerci in Altino preromana e romana. Attidel convegno, Venezia 12–14 dicembre 2001. EdizioniQuasar: Roma; 399.
Crippen RE, Blom RG. 2001. Unveiling the lithology ofvegetated terrains in remotely sensed imagery. Photo-grammetric Engineering & Remote Sensing 67: 935–943.
Dabas M. 2009. Theory and practice of the new fast elec-trical imaging system ARP. In Seeing the Unseen. Geo-physics and Landscape Archaeology, Campana S, PiroS (eds). Taylor & Francis Group: London; 105–126.
Danckers J. 2011. The 2nd-century AD crisis in Altinum(Venetia, northern Italy). Amixture of historiographicaldeterminism and archaeological scarcity? BABESCHAnnual Papers on Mediterranean Archaeology 86: 143–165.
De Bon A. 1938. Rilievi di campagna. In La via ClaudiaAugusta Altinate. Istituto Veneto di Scienze LettereArti: Venezia; 13–69.
De Min M. 2000. Edilizia altomedievale e medioevale nelterritorio lagunare. Nuovi dati conoscitivi dai cantieridi restauro. In Tra due elementi sospesa. Venezia,costruzione di un paesaggio urbano. Marsilio: Venezia;98–133.
De Min M. 2006. Nuovi dati sullo sviluppo insediativolagunare nel periodo delle origini della CivitasVeneciarum. Forme e tecniche del costruire. Quaderni diArcheologia del Veneto serie speciale 2: 227–243.
De Smedt P, Van Meirvenne M, Saey T, Baldwin E,Gaffney C, Gaffney V. 2014. Unveiling the prehistoriclandscape at Stonehenge through multi-receiver EMI.Journal of Archaeological Science 50: 16–23.
Donnici S, Serandrei Barbero R, Bini C, BonardiM, LezzieroA. 2011. The caranto paleosol and its role in the earlyurbanization of Venice. Geoarchaeology 26: 514–543.
Drahor MG, Berge MA, Kurtulmuş TÖ, Hartmann M,Speidel MA. 2008. Magnetic and electrical resistivity to-mography investigations in a Roman legionary campsite (Legio IV Scythica) in Zeugma, southeasternAnatolia, Turkey. Archaeological Prospection 15: 159–186.
Fassbinder JWE. 2010. Geophysical prospection of thefrontiers of the Roman Empire in southern Germany,UNESCO World Heritage Site. ArchaeologicalProspection 17: 129–139.
Fassbinder JWE. 2015. Seeing beneath the farmland,steppe and desert soil: magnetic prospecting and soilmagnetism. Journal of Archaeological Science 56: 85–95.
Fontana A, Mozzi P, Bondesan A. 2010. Late Pleistoceneevolution of the Venetian–Friulian Plain. RendicontiLincei 21: 181–196.
Fontana A, Mozzi P, Marchetti M. 2014. Alluvial fans andmegafans along the southern side of the Alps. Sedimen-tary Geology 301: 150–171.
Archaeol. Prospect. 23, 27–44 (2016)DOI: 10.1002/arp
43Altinum from Remote Sensing and Geophysics
Francese R, Galgaro A, Grespan A. 2004. Venice channelside-wall assessment with GPR technique – a casestudy. Journal of Applied Geophysics 56: 31–40.
Francese R, Finzi E, Morelli G. 2009. 3-D high-resolution multi-channel radar investigation of aRoman village in northern Italy. Journal of AppliedGeophysics 67: 44–51.
Gaffney CF, Gaffney VL, Cuttler R, Yorston R. 2008. Ini-tial results using GPS navigation with the FoersterMagnetometer System at the World Heritage site ofCyrene, Libia. Archaeological Prospection 15: 151–156.
Gambacurta G. 2011a. Altino preromana (VIII–IV secoloa.C.). In Altino antica. Dai veneti a Venezia, Tirelli M(ed.). Marsilio: Venezia; 55–61.
Gambacurta G. 2011b. Et in quem primus egressi sunt lo-cum Troia vocatur (Liv. I, 3). Note sulla topografia diAltino preromana. In Atti del VI Convegno di studialtinati, Altino dal cielo: la città telerivelata, lineamentidi forma urbis, Venezia, 3 dicembre 2009, Tirelli M,Cresci Marrone G (eds). Edizioni Quasar: Roma; 39–58.
Gelichi S, Moine C, Corrò E, et al. 2012. Isole fortunate? Lastoria della Laguna Nord di Venezia attraverso lo scavodi San Lorenzo di Ammiana. Archeologia Medievale 39:9–56.
Groppo V, Pujatti E. 2009. Altino. Nuove indagininell’insediamento protostorico. Quaderni di Archeologia delVeneto 25: 55–66.
Groppo V, Rinaldi F, Tirelli M. 2010. Sectilia pavimenta:un nuovo esemplare altinate. Quaderni di Archeologiadel Veneto 26: 65–72.
Gros P. 1996. L’architecture romaine. Tome 1, Les monu-ments publics. Picard éditeur: Paris; 504.
Haralick R, Sternberg SR, Zhuang X. 1987. Image analysisusing mathematical morphology. IEEE Transactions onPattern Analysis and Machine Intelligence PAMI-9(4):532–550.
Horsley T, Wright A, Barrier C. 2014. Prospecting for newquestions: integrating geophysics to define anthropo-logical research objectives and inform excavation strat-egies at monumental sites. Archaeological Prospection 21:75–86.
Jensen JR. 1986. Introductory Digital Image Processing.Prentice-Hall: Englewood Cliffs, NJ; 379.
Johnson P, Millett M (eds). 2012. Archaeological Surveyand the City. University of Cambridge Museum ofClassical Archaeology monograph, 2. Oxbow Books:Oxford; 288.
Keay SJ, Parcak SH, Strutt KD. 2014. High resolutionspace and ground-based remote sensing and implica-tions for landscape archaeology: the case from Portus,Italy. Journal of Archaeological Science 52: 277–292.
Lasaponara R, Masini N (eds). 2012. Satellite RemoteSensing: A New Tool for Archaeology. Springer-Verlag:Heidelberg; 64.
Maritan L, Mazzoli C, Sassi R, Speranza F, Zanco A,Zanovello P. 2013. Trachyte from the Roman aqueductsof Padua and Este (north-east Italy): a provenancestudy based on petrography, chemistry and magneticsusceptibility. European Journal of Mineralogy 25:415–427.
Mele M, Cremaschi M, Giudici M, Lozej M, Pizzi C, BassiA. 2013. The Terramare and the surrounding hydraulicstructures: a geophysical survey of the Santa Rosa site
Copyright © 2015 John Wiley & Sons, Ltd.
at Poviglio (Bronze Age, northern Italy). Journal of Ar-chaeological Science 40: 4648–4662.
Mozzi P. 2005. Alluvial plain formation during the LateQuaternary between the southern Alpine margin andthe Lagoon of Venice (northern Italy). Geografia Fisica eDinamica Quaternaria Supplement 7: 219–230.
Mozzi P, Bini C, Zilocchi L, Becattini R, Mariotti Lippi M.2003. Stratigraphy, palaeopedology and palynology ofLate Pleistocene and Holocene deposits in the land-ward sector of the Lagoon of Venice (Italy), in relationto the ‘caranto’ level. Il Quaternario – Italian Journal Qua-ternary Science 16: 193–210.
Mozzi P, Fontana A, Ninfo A, Ferrarese F. 2011a. Lastruttura urbana di altino: telerilevamento e contestogeomorfologico. In Atti del VI Convegno di studialtinati, Altino dal cielo: la città telerivelata,lineamenti di forma urbis, Venezia, 3 dicembre2009, Tirelli M, Cresci Marrone G (eds). EdizioniQuasar: Roma; 15–38.
Mozzi P, Fontana A, Ninfo F, Ferrarese F, Primon S.2011b. Nuove tecnologie per la ricostruzione dellapianta della città: il telerilevamento di Altino. In Altinoantica. Dai veneti a Venezia, Tirelli M (ed.). Marsilio:Venezia; 198–203.
Ninfo A, Fontana A, Mozzi P, Ferrarese F. 2009. The mapof Altinum, ancestor of Venice. Science 325: 577.
Novo A, Leckebusch J, Goodman D, Morelli G, Piro S,Catanzariti G. 2013. Advances in GPR imaging withmulti-channel radar systems. Journal of Surveying andMapping Engineering 1: 1–6.
Papadopoulos NG, Sarris A, Salvi MC, Dederix S,Soupios P, Dikmen U. 2012. Rediscovering the smalltheatre and amphitheatre of ancient Ierapytna (SECrete) by integrated geophysical methods. Journal ofArchaeological Science 39: 1960–1973.
Paveggio A. 2011. Work in progress: dall’archivio storicoverso la carta archeologica informatizzata di Altino. InAtti del VI Convegno di studi altinati, Altino dal cielo:la città telerivelata, lineamenti di forma urbis, Venezia,3 dicembre 2009, Tirelli M, Cresci Marrone G (eds).Edizioni Quasar: Roma; 159–174.
Pesando F. 2000. Edifici pubblici ‘antichi’ nella Pompeiaugustea: il caso della Palestra sannitica. RoemischeMitteilungen 107: 155–175.
Powlesland D, May K. 2010. DigIT: archaeological sum-mary report and experiments in digital recording inthe field. Internet Archaeology 27. DOI: 10.11141/ia.27.2
Primon S, Mozzi P. 2014. Torcello and the morphology ofthe lagoon between the Roman period and the MiddleAges. In Torcello Excavated, a Shared Heritage, CalaonD, Zendri E, Biscontin G (eds). Regione del Veneto:Venezia; 105–122.
Renfrew C, Bahn P. 2012.Archaeology: Theories, Methods andPractice (6th edition). Thames & Hudson: London; 637.
Rosada G. 2002.… viam Claudiam Augustam quam Dru-sus pater … derexserat … . In Via Claudia Augusta.Un’arteria alle origini dell’Europa: ipotesi, problemi,prospettive. Edizioni V. Galliazzo: Asolo (Treviso).
Rosada G, Frassine M, Ghiotto AR (eds). 2010. … viamAnniam influentibus palustribus aquis eververatam.Canova: Treviso; 190.
Schmidt A. 2013. Earth Resistance for Archaeologists.AltaMira Press: Walnut Creek, CA; 195.
Archaeol. Prospect. 23, 27–44 (2016)DOI: 10.1002/arp

44 P. Mozzi et al.
Sperti L. 2011. La decorazione architettonica dell’area ur-bana. In Atti del VI Convegno di studi altinati, Altinodal cielo: la città telerivelata, lineamenti di forma urbis,Venezia, 3 dicembre 2009, Tirelli M, Cresci Marrone G(eds). Edizioni Quasar: Roma; 95–116.
Stockwell JW, Cohen JC. 2008. The New SU User’s Man-ual. Center for Wave Phenomena, Colorado School ofMines: Golden, CO; 141.
Tirelli M. 2004. La porta approdo di Altinum e i ritualipubblici di fondazione: tradizione veneta e ideologiaromana a confronto. In Studi di archeologia in onoredi Gustavo Traversari, Fano Santi M (ed.). GiorgioBretschneider Editore: Roma; 849–863.
Tirelli M (ed.). 2011a. Altino antica. Dai Veneti a Venezia.Marsilio: Venezia; 229.
Tirelli M. 2011b. Il I secolo d.C.: la floridezza. In Altinoantica. Dai veneti a Venezia, Tirelli M (ed.). Marsilio:Venezia; 133–139.
Tirelli M. 2011c. Il progredire degli studi e lo sviluppo delmuseo. In Altino antica. Dai veneti a Venezia, Tirelli M(ed.). Marsilio: Venezia; 39–45.
Tirelli M. 2011d. L’immagine della città dalla ricerca traterra e cielo. In Atti del VI Convegno di studi altinati,Altino dal cielo: la città telerivelata, lineamenti diforma urbis, Venezia, 3 dicembre 2009, Tirelli M,Cresci Marrone G (eds). Edizioni Quasar: Roma;59–80.
Tosi L, Rizzetto F, Bonardi M, Donnici S, SerandreiBarbero R, Toffoletto F (eds). 2007. Note illustrative
Copyright © 2015 John Wiley & Sons, Ltd.
della Carta Geologica alla scala 1:50.000, foglio 128Venezia. APAT – Regione Veneto: Venezia; 164.
Traviglia A, Cottica D. 2011. Remote sensing applica-tions and archaeological research in the northernLagoon of Venice: the case of the lost settlement ofConstanciacus. Journal of Archaeological Science 38:2040–2050.
Vermeulen F. 2012. Potentia: a lost new town. In UrbesExtinctae Archaeologies of and Approaches to Aban-doned Classical Cities, Christie N, Augenti A (eds).Ashgate Publishing: Farnham; 77–96.
Vermeulen F, Burgers G-J, Keay SJ, Corsi C (eds). 2012.Urban Landscape Survey in Italy and the Mediterra-nean. Oxbow Books: Oxford; 288.
Veronese S. 2000. Come rendere visibile l’invisibile, Altino(Venezia) indagine magnetica. Le Scienze 379: 53–55.
Veronese F (ed.). 2009. Via Annia: Adria, Padova, Altino,Concordia, Aquileia – Atti della giornata di Studi “ViaAnnia, progetto di recupero e valorizzazione diun’antica strada romana”, Padova 19 giugno 2008. IlPoligrafo: Padova; 252.
Veronese F (ed.). 2011. Via Annia: Adria, Padova, Altino,Concordia, Aquileia – progetto di recupero evalorizzazione di un’antica strada romana. Atti dellaII giornata di studio, Padova, 17 giugno 2010. IlPoligrafo: Padova: 324.
Won IJ. 1980. A wideband electromagnetic explorationmethod – some theoretical and experimental results.Geophysics 45: 928–940.
Archaeol. Prospect. 23, 27–44 (2016)DOI: 10.1002/arp


![[ART] the Measurement of Sand Transport in Two Inlets of Venice Lagoon, Italy](https://img.pdfslide.net/doc/110x75/577cc5b61a28aba7119d02a3/art-the-measurement-of-sand-transport-in-two-inlets-of-venice-lagoon-italy.jpg)