Embed Size (px)
Citation preview

The sedimentology and geomorphology of rock avalanchedeposits on glaciers
DAN H. SHUGAR and JOHN J. CLAGUECentre for Natural Hazard Research, Department of Earth Sciences, Simon Fraser University,Burnaby, BC, Canada V5A 1S6 (E-mail: [email protected])
Associate Editor – Nick Eyles
ABSTRACT
This article describes and compares the deposits of four large landslides on
two glaciers in Alaska using field mapping and remote sensing. Digital image
analysis is used to compare the sedimentological characteristics of nearly
200 000 individual surface blocks deposited by three landslides at Black
Rapids Glacier in 2002. The debris sheets of one of the three landslides on
Black Rapids Glacier and a landslide emplaced on Sherman Glacier in 1964
are also investigated. The three landslides on Black Rapids Glacier have
undergone little post-depositional modification by glacier flow, whereas the
Sherman Glacier landslide has been transported supraglacially up to ca 1 km
over the past 46 years. The three debris sheets on Black Rapids Glacier have
coarse blocky rims at their distal edges, and all four debris sheets have
longitudinal flowbands characterized by differences in texture and produced
by shearing within the moving debris. Elongated blocks are parallel to flow,
except at the perimeter of the debris sheets, where they are aligned more
perpendicular to flow. Blocks on the Sherman Glacier debris sheet have been
reoriented by glacier flow. The matrix shows no systematic differences with
depth or distance from the source. However, it appears to become coarser over
a time scale of decades due to weathering.
Keywords Black Rapids Glacier, landslide, remote sensing, rock avalanche,sedimentology, Sherman Glacier.
INTRODUCTION
Rock avalanches are sudden, deep-seated rock-slope failures characterized by rapid and extremefragmentation of the failed rock mass, highvelocities and long run-outs (Hewitt et al.,2008). Where unimpeded by topography, theflowing debris spreads out over a large area andis deposited as a relatively thin sheet. Mostresearch on rock avalanches has focused on theirsurface morphology, dynamics and emplacementmechanisms (Nicoletti & Sorriso-Valvo, 1991;Hungr, 1995; Davies et al., 1999; Evans et al.,2001, 2009; Davies & McSaveney, 2002; McDou-gall & Hungr, 2005; Locat et al., 2006; McSaveney& Davies, 2009). However, with some notable
exceptions (Cruden & Hungr, 1986; Hewitt, 1988,1999; Couture, 1998; Dunning & Armitage, 2005;Dunning et al., 2005; Crosta et al., 2007), littleattention has been paid to the internal structureand sedimentology of rock avalanche deposits.Hewitt (2009) provides one of the few examples ofthe role of glacier ice in the evolution of a rockavalanche debris sheet, and Shulmeister et al.(2009) discuss the sedimentary and geomorphiccharacteristics of moraines derived from land-slide debris deposited on glaciers. Yet, althoughresearch on these aspects of rock avalanches islimited, landslides on glaciers are more commonthan previously thought (Geertsema et al., 2006;Hewitt, 2009), increasing the need to identify andcharacterize their deposits.
Sedimentology (2011) doi: 10.1111/j.1365-3091.2011.01238.x
� 2011 The Authors. Journal compilation � 2011 International Association of Sedimentologists 1

The sedimentology of rock avalanche depositsassumes importance because diamictons, previ-ously thought to be till or terminal moraines, havebeen reinterpreted as landslide debris, with littleor no climatic significance (Porter & Orombelli,1980; Hewitt, 1999; Larsen et al., 2005; Shulmei-ster et al., 2009). Hewitt (1999), for example,reinterpreted glacial deposits in the centralKarakoram Range in the Himalaya as productsof large rock avalanches, thereby casting doubt onthe glacial history of the region. Several research-ers (Larsen et al., 2005; Tovar et al., 2008; Shul-meister et al., 2009) question the inferred glacialevidence for Late-Glacial inter-hemisphere cli-matic synchroneity by arguing that the WaihoLoop, a conspicuous end moraine deposited byFranz Josef Glacier in New Zealand, comprisesrock avalanche debris and does not record atmo-spheric cooling.
The objectives of this article are: (i) to describethe sedimentology of some rock avalanche depos-its on glaciers; (ii) to evaluate whether patterns
exist within the debris sheets; and (iii) to deter-mine whether post-deposition modification dueto glacier flow complicates interpretation of thedeposits. Deposits of three rock avalanches thatfell onto Black Rapids Glacier, Alaska, in 2002,and one that fell onto Sherman Glacier, Alaska, in1964 are described and compared. The fourlandslides are large (>106 m3) and had run-outsthat were largely unconstrained by topography.
STUDY AREAS
Black Rapids Glacier, Alaska
Black Rapids Glacier is a 40 km long, surge-typevalley glacier in the central Alaska Range ofinterior Alaska (Fig. 1). It has an average width ofca 2Æ3 km and a mean downvalley slope of ca 2�(Fatland et al., 2003). Its ablation zone lies in aneast-trending valley that marks the trace of theDenali Fault. Most of the accumulation zone is in
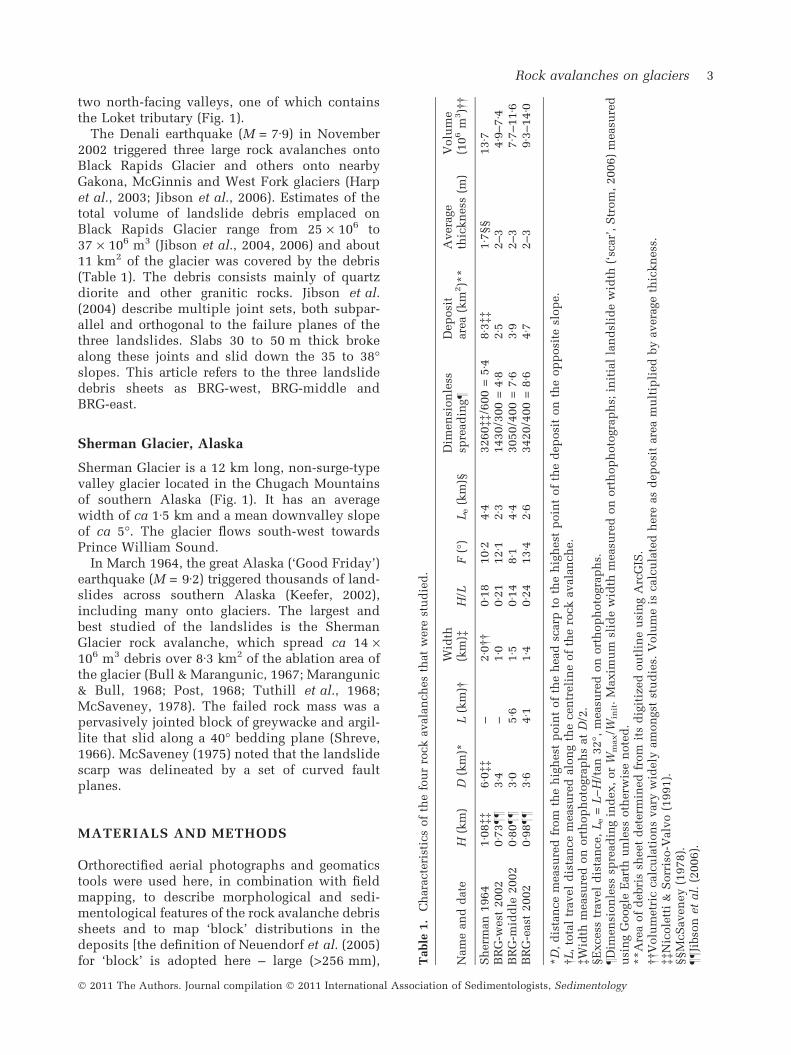
Fig. 1. Locations of Black Rapidsand Sherman glaciers and photo-graphs of the landslide debrissheets.
2 D. H. Shugar and J. J. Clague
� 2011 The Authors. Journal compilation � 2011 International Association of Sedimentologists, Sedimentology
two north-facing valleys, one of which containsthe Loket tributary (Fig. 1).
The Denali earthquake (M = 7Æ9) in November2002 triggered three large rock avalanches ontoBlack Rapids Glacier and others onto nearbyGakona, McGinnis and West Fork glaciers (Harpet al., 2003; Jibson et al., 2006). Estimates of thetotal volume of landslide debris emplaced onBlack Rapids Glacier range from 25 · 106 to37 · 106 m3 (Jibson et al., 2004, 2006) and about11 km2 of the glacier was covered by the debris(Table 1). The debris consists mainly of quartzdiorite and other granitic rocks. Jibson et al.(2004) describe multiple joint sets, both subpar-allel and orthogonal to the failure planes of thethree landslides. Slabs 30 to 50 m thick brokealong these joints and slid down the 35 to 38�slopes. This article refers to the three landslidedebris sheets as BRG-west, BRG-middle andBRG-east.
Sherman Glacier, Alaska
Sherman Glacier is a 12 km long, non-surge-typevalley glacier located in the Chugach Mountainsof southern Alaska (Fig. 1). It has an averagewidth of ca 1Æ5 km and a mean downvalley slopeof ca 5�. The glacier flows south-west towardsPrince William Sound.
In March 1964, the great Alaska (‘Good Friday’)earthquake (M = 9Æ2) triggered thousands of land-slides across southern Alaska (Keefer, 2002),including many onto glaciers. The largest andbest studied of the landslides is the ShermanGlacier rock avalanche, which spread ca 14 ·106 m3 debris over 8Æ3 km2 of the ablation area ofthe glacier (Bull & Marangunic, 1967; Marangunic& Bull, 1968; Post, 1968; Tuthill et al., 1968;McSaveney, 1978). The failed rock mass was apervasively jointed block of greywacke and argil-lite that slid along a 40� bedding plane (Shreve,1966). McSaveney (1975) noted that the landslidescarp was delineated by a set of curved faultplanes.
MATERIALS AND METHODS
Orthorectified aerial photographs and geomaticstools were used here, in combination with fieldmapping, to describe morphological and sedi-mentological features of the rock avalanche debrissheets and to map ‘block’ distributions in thedeposits [the definition of Neuendorf et al. (2005)for ‘block’ is adopted here – large (>256 mm), T
able
1.
Ch
ara
cte
rist
ics
of
the
fou
rro
ck
avala
nch
es
that
were
stu
die
d.
Nam
ean
dd
ate
H(k
m)
D(k
m)*
L(k
m)�
Wid
th(k
m)�
H/L
F(�
)L
e(k
m)§
Dim
en
sion
less
spre
ad
ing–
Dep
osi
tare
a(k
m2)*
*A
vera
ge
thic
kn
ess
(m)
Volu
me
(10
6m
3)�
�
Sh
erm
an
1964
1Æ0
8��
6Æ0
��–
2Æ0
��0Æ1
810Æ2
4Æ4
3260��
/600
=5Æ4
8Æ3
��1Æ7
§§
13Æ7
BR
G-w
est
2002
0Æ7
3––
3Æ4
–1Æ0
0Æ2
112Æ1
2Æ3
1430/3
00
=4Æ8
2Æ5
2–3
4Æ9
–7Æ4
BR
G-m
idd
le2002
0Æ8
0––
3Æ0
5Æ6
1Æ5
0Æ1
48Æ1
4Æ4
3050/4
00
=7Æ6
3Æ9
2–3
7Æ7
–11Æ6
BR
G-e
ast
2002
0Æ9
8––
3Æ6
4Æ1
1Æ4
0Æ2
413Æ4
2Æ6
3420/4
00
=8Æ6
4Æ 7
2–3
9Æ3
–14Æ0
*D
,d
ista
nce
measu
red
from
the
hig
hest
poin
tof
the
head
scarp
toth
eh
igh
est
poin
tof
the
dep
osi
ton
the
op
posi
tesl
op
e.
�L,
tota
ltr
avel
dis
tan
ce
measu
red
alo
ng
the
cen
treli
ne
of
the
rock
avala
nch
e.
�Wid
thm
easu
red
on
ort
hop
hoto
gra
ph
sat
D/2
.§E
xcess
travel
dis
tan
ce,
Le
=L)
H/t
an
32
�,m
easu
red
on
ort
hop
hoto
gra
ph
s.–D
imen
sion
less
spre
ad
ing
ind
ex,
or
Wm
ax/W
init.
Maxim
um
slid
ew
idth
measu
red
on
ort
hop
hoto
gra
ph
s;in
itia
lla
nd
slid
ew
idth
(‘sc
ar’
,S
trom
,2006)
measu
red
usi
ng
Eart
hu
nle
ssoth
erw
ise
note
d.
**A
rea
of
debri
ssh
eet
dete
rmin
ed
from
its
dig
itiz
ed
ou
tlin
eu
sin
gA
rcG
IS.
��V
olu
metr
iccalc
ula
tion
svary
wid
ely
am
on
gst
stu
die
s.V
olu
me
iscalc
ula
ted
here
as
dep
osi
tare
am
ult
ipli
ed
by
avera
ge
thic
kn
ess
.��
Nic
ole
tti
&S
orr
iso-V
alv
o(1
991).
§§M
cS
aven
ey
(1978).
––Ji
bso
net
al.
(2006).
Rock avalanches on glaciers 3
� 2011 The Authors. Journal compilation � 2011 International Association of Sedimentologists, Sedimentology

angular rock fragments]. No universally acceptedprotocols exist for documenting the sedimento-logy of rock avalanche deposits (Dunning, 2004),although Hewitt (1999) provides a useful check-list for describing related landforms in the field.A major difficulty in describing these deposits istheir large range in particle size – from clay-sizepowder (McSaveney & Davies, 2007) to house-sized blocks.
Grain-size distribution
A modified version of the Dunning (2004) methodof characterizing the particle size distribution ofrock avalanche debris was used here. Dunningdeveloped a sampling strategy, termed the‘Evolved Sample Method’, for obtaining the dis-tribution of particle size in rock avalanche debris,from 0Æ002 to 256 mm. The method involves fieldsieving of the 8 to 256 mm fraction and laboratoryanalysis of the £8 mm fraction using a combina-tion of sieving and laser diffraction measurements.In this study, the Dunning technique was extendedto particle sizes >256 mm using remote sensing.
A Malvern Mastersizer 2000 (Malvern Instru-ments Limited, Malvern, UK) was used to deter-mine the particle-size distributions (<2 mm) of65 matrix samples collected from the BRG-westdebris sheet and 18 samples from the ShermanGlacier debris sheet. Samples were non-cohesiveand thus were not pre-treated with a dispersantprior to analysis. Dunning (2004) found nodifferences in analytical results for rock ava-lanche samples pre-treated in a Calgon solutionfrom those dispersed in water alone.
Subsamples (100 to 200 g) of sediment werewet sieved on a 0Æ063 mm screen to remove siltand clay. The remaining sediment was oven-dried(24 h at 105�C) and then dry sieved for 20 minthrough a nest of full-phi screens from 0Æ063 to4 mm, with additional 12Æ5 mm and 19 mmscreens. Sediment on each screen was weighedto 0Æ1 g. No fine sediment was observed adheringto granules and pebbles following dry sieving.Sediment lost during sieving was <1% andtherefore was ignored (Blott & Pye, 2001).
Volumetric data provided by the Mastersizer2000 were integrated with weight data obtainedby sieving using the technique outlined in the‘Results Emulation’ module of the Mastersizersoftware. Matrix data were processed using theGradistat grain-size distribution and statisticspackage in Excel� (Blott & Pye, 2001). Theprogram calculates mean, standard deviation,sorting, skewness and kurtosis using the method
of moments (arithmetic and geometric values inlm, logarithmic values in /) and the Folk & Ward(1957) graphical method (both lm and /).
Fabric analysis
Clast fabric analysis has been used in manyglacial geology studies (Giardino & Vitek, 1985;Bennett et al., 1999; Benn & Ringrose, 2001) andsome landslide studies (Lundqvist, 1949) to infermechanisms of transport and deposition. Datacollection and analysis, however, are laborious:data typically must be extrapolated from a smallnumber of sites to large areas. Furthermore, fabricstudies of rock avalanche deposits are uncommonbecause of the difficulty of obtaining representa-tive measurements of large clasts (Marangunic &Bull, 1968; Gates, 1987; Blair, 1999).
Using a Brunton geological compass, the trendand plunge of 50 elongate clasts (a:b ‡ 1Æ5:1,a ‡ 10 cm) were measured in landslide debris ateach of 13 sites on BRG-west and 11 sites onSherman Glacier. Trends were recorded to thenearest 5� due to the difficulty of more preciselymeasuring the a axis of irregularly shaped, elon-gate clasts.
Bull & Marangunic (1968) made fabric mea-surements at Sherman Glacier two years after the1964 rock avalanche. These authors report16 fabric sets, with 63 to 107 clasts per set; mostsets have more than 100 clasts, with a totalof 1596 measurements. The original tabular dataof Bull & Marangunic no longer exist but thepresent authors extracted measurements fromstereonets prepared by Bull & Marangunic(1968). It was assumed that points in the stereo-nets lay at the centre of a 10� grid cell, except incases where they touched a grid line, in whichcase the trend or plunge was assigned the valuesof that line. The orientation tensor method ofMark (1973) and Woodcock (1977) was used tocalculate eigenvectors, such that the normalizedeigenvectors S1 + S2 + S3 = 1.
To document spatial variations in block size andorientation, and thus gain insight into clast trans-port processes, maps of blocks were created inthe landslide debris on Black Rapids Glacier usinga digital photo-sieving method, modified fromIbbeken & Schleyer (1986). Photo-sieving is amethod of grain-size analysis of coarse sediment,performed by manually tracing the outline of eachclast on photographs. Ibbeken & Schleyer (1986)claim that the method is as accurate as traditionalsieving methods, provided that image resolutionis sufficiently high, although these authors did
4 D. H. Shugar and J. J. Clague
� 2011 The Authors. Journal compilation � 2011 International Association of Sedimentologists, Sedimentology

not offer quantitative data to support this asser-tion. In the present study, blocks on three land-slides were photo-sieved using large-scaleorthophotographs and commercial GIS software.
Vertical aerial photographs (scale 1 : 20 000) ofBlack Rapids Glacier were taken on 7 September2004. A 10 m digital elevation model of the threedebris sheets and their environs was created onan Intergraph softcopy workstation using stan-dard digital photogrammetric techniques (Cox &March, 2004; Schiefer & Gilbert, 2007) to removedistortions generated by uneven surface topogra-phy, lens imperfections, and yaw, pitch and rollof the aircraft. A colour-corrected orthophoto-graph mosaic with 0Æ25 m pixels was then con-structed. The Black Rapids Glacier images weretaken less than two years after the landslides andthus probably record the debris sheet prior tosignificant glacial modification.
Individual blocks ‡1 m2 in ArcGIS were man-ually digitized (Fig. 2). The minimum area of abounding rectangle for each identified block wasthen computed using the Patterson (2008)Bounding Containers toolbox for ArcGIS. Thetoolbox computes the smallest rectangle possiblearound a polygon, and calculates its length(a-axis), width (b-axis), azimuth and the coordi-nates of its centre. The results were analysedusing two tools – Hot Spot spatial clustering andneighbourhood statistics. For a set of data points,the local Getis Ord Gi* (Hot Spot) statisticidentifies areas with fewer or more points thanwould be expected by random chance based onthe distribution of the entire population. Gi* iscalculated by summing the number of neigh-bours and dividing that value by the number ofall features in the study area (Mitchell, 1999).The result is a map of Gi* z-scores (standarddeviation) for each input point. A high Gi* valueindicates a cluster or concentration of featureswith high attribute values; in this case, blocklength. Conversely, a group of features with lowGi* values indicates a cold spot. This statistic,however, retains no information about the rela-tive sizes of clasts.
To gain additional insight into the spatialdistribution of blocks, the median and maximum(a-axis) block sizes within squares measuring25 m · 25 m were calculated using the spatialstatistics toolbox in ArcGIS. This tool calculatesan output value for each non-overlapping neigh-bourhood based on the values identified in each625 m2 neighbourhood square. The result is aseries of raster maps of median (d50) and maxi-mum grain size for the entire debris sheet.
More than 194 000 blocks were digitized on thethree debris sheets on Black Rapids Glacier(Table 2). Long axis clusters were identified usingthe Hot Spot tool; median (d50) and maximumblock lengths within neighbourhoods weremapped using the spatial statistics describedabove. Block statistics within a circular neigh-bourhood with a radius of 50 m were thenextracted along the approximate flow path ofeach debris sheet. In this way, median block
Fig. 2. Example of digitized blocks on a landslide. (A)The orthophotograph used for digitizing. (B) Manuallydigitized polygons. (C) Minimum bounding rectanglesaround each block.
Rock avalanches on glaciers 5
� 2011 The Authors. Journal compilation � 2011 International Association of Sedimentologists, Sedimentology

length along the flow path could be calculatedand compared with travel distance.
To analyse and interpret the block orientations,flowbands were digitized (for example, Fig. 3)within the debris sheets visible on the ortho-photographs and azimuth values were interpo-lated over the landslide deposit. Each 10 m longflowband line segment was converted to a unitvector, split into its scalar components andinterpolated separately. The interpolations werethen combined by calculating the inverse tangentof each pixel. The resulting map contains a flowdirection for each pixel on the debris surface. Theangular deviation of the a-axis of each rod-shaped(a:b ‡ 1Æ5) block from the landslide flow directionwas then calculated and a map of deviations wasproduced for each rod-shaped block on the debrissheet. This analysis assumes that the a:b planes ofblocks are horizontal, or nearly so. Observationsin the field indicate that this assumption is valid(see Field fabric characteristics section).
The present analysis of fabric data dependscritically on the accuracy of the flow lines drawnin the GIS. Fortunately, the conspicuous flow-bands on the debris sheets of Black RapidsGlacier are reliable flow indicators. The threelandslides on Black Rapids Glacier moved down-glacier slightly as they crossed the medialmoraine; this change in direction is faithfullyrecorded by the flowbands (Fig. 3). What appearto be crossing flow features are visible in theinterior of the BRG-middle debris sheet. Thesefeatures may indicate secondary flow (Kelfounet al., 2008), but could also reflect tensile frac-tures in the underlying ice due to glacier flow.Although the flowbands are conspicuous in theorthoimagery, caution is required when interpret-ing the results.
RESULTS
First, the general morphology of the landslidedebris sheets at the two study sites is described.
Then, the particle-size distributions of the matrixof the westernmost debris sheet on BRG-westand the debris sheet on Sherman Glacier arepresented. Finally, field fabric measurementsand fabric data derived from remote sensingobservations at Black Rapids Glacier are re-ported.
General surface morphology
Black Rapids Glacier landslidesThe three Black Rapids Glacier landslides differin their morphologies and volumes, although alldisplay similar runout features. All three land-slides detached from steep north-facing rockslopes on the south side of the valley occupiedby Black Rapids Glacier. The landslides flowedacross the glacier, overtopping a medial moraineup to ca 25 m high, and spread out over a totalarea of 11 km2 (Table 1). These landslides cameto rest after reaching the north side of the glacier.The debris sheets are uniformly thin; the presentfieldwork indicates the average thickness of thedebris of the westernmost landslide is 2 to 3 m,yielding an estimated deposit volume of 22 to33 · 106 m3.
The smallest and westernmost of the threelandslides (BRG-west) flowed over the medialmoraine near the centre of the glacier and cameto rest on the debris-covered northern margin ofthe glacier, 3Æ4 km from the source. It has aFahrboschung, F (H/L expressed as an angle) of12Æ1� (Table 1). The medial moraine altered thepath of the debris at the east and west margins ofthe landslide. The debris sheet contains numer-ous longitudinal flowbands (sensu Dufresne &Davies, 2009) and transverse ridges, concentratedon the proximal side of the medial moraine. Thelongitudinal flowbands are 30 to 100 m wide andare defined by alternating stripes of fine debrisand coarse blocks. Finer stripes are less commonand narrower than bands of coarse blocks.No significant differences in relief were observedbetween the fine and coarse stripes, and nolongitudinal grooves are present, as at ShermanGlacier (McSaveney, 1975). Boundaries betweendebris stripes typically are sharp. There is alsoa distal rim of very large blocks at the north edgeof the debris sheet, which is clast-supported andforms a thicker deposit than elsewhere on thedebris sheet. Large ‘jigsaw’ brecciated blocks andblocks and cones of disintegrated rock are presentover large areas of the BRG-west debris sheet(Fig. 3). The latter have cores of competentunweathered rock that are abruptly bordered by
Table 2. Properties of digitized blocks on the threerock avalanche debris sheets on Black Rapids Glacier.
Landslide
Totalnumber
of digitizedblocks a:b >1Æ5
d50 (m)of total
Longest
block(m)
BRG-west 25 712 16 951 2Æ5 26Æ1BRG-middle 58 280 32 021 3Æ1 37Æ3BRG-east 110 244 49 620 2Æ1 22Æ7
6 D. H. Shugar and J. J. Clague
� 2011 The Authors. Journal compilation � 2011 International Association of Sedimentologists, Sedimentology

loose sandy grus. Two hundred and fifty jigsawblocks were identified; most are present in thecentral part of the debris sheet. Seventy-fivegrussified blocks were observed within a smallregion in the centre of the debris sheet on theproximal side of the medial moraine.
The other two Black Rapids landslides (BRG-middle and BRG-east) also have coarse blockydistal rims and longitudinal flowbands withstrong textural and colour differences; their Fahr-boschungs are, respectively, 8Æ1� and 13Æ4�(Table 1). BRG-middle and BRG-east are larger
A
B C
Fig. 3. Photographs of rock avalanche debris on Black Rapids Glacier. (A) Aerial photograph of the north-west cornerof ‘BRG-middle’, showing longitudinal flowbands (solid arrows) turning to the east near the lateral moraine on thenorth side of the glacier. The darker, finer stripe bounded by the middle and lower sets of arrows is discussed inthe Remotely sensed fabric section. Note the apparent criss-crossing flow features and the downglacier deflectionin flow where the debris surmounted the medial moraine (see text for discussion). (B) Grussified block on BRG-west.The top half of the block is loose sand that retains the overall shape of the original block; the lower half is competentrock. Knife provides scale. (C) Large jigsaw brecciated block on BRG-west.
Rock avalanches on glaciers 7
� 2011 The Authors. Journal compilation � 2011 International Association of Sedimentologists, Sedimentology

and exhibit more complex flow behaviour thanBRG-west. Flowbands on BRG-middle show thatthe rock avalanche flowed north across BlackRapids Glacier, then turned abruptly to the easton reaching the north lateral moraine and floweddown the glacier (Fig. 3); the total travel distanceis 5Æ6 km. The medial moraine at BRG-middle isnear the south margin of the glacier and forms amore imposing topographic barrier than at BRG-west. Flowbands on BRG-east indicate that someof the debris of that landslide travelled north andthen, as at BRG-middle, swung to the east.However, much of the debris took a more directpath, travelling directly 4Æ1 km to the north-east.BRG-east overtopped a looped medial morainenear the centre of the glacier. Some BRG-middledebris overtopped the eastern margin of the BRG-west debris sheet, suggesting that the formerlandslide occurred just before the latter andflowed unconfined across the glacier. The BRG-middle debris sheet was partially confined whereit came into contact with BRG-west on the northside of the medial moraine. BRG-east flowed withno confinement, either by debris or moraines.
The landslide debris on Black Rapids Glacier isan effective insulator, reducing melt during sum-mer. Between 2002 and 2007, the debris sheets onBlack Rapids Glacier have shut off or substan-tially reduced ablation, resulting in debris-covered pedestals ca 15 m above the surroundingbare ice surface.
Sherman Glacier landslideWhen it was deposited, the tongue-shaped debrissheet of the Sherman Glacier landslide resembledthat of BRG-west. The debris sheet covered8Æ3 km2 of the glacier to an average depth of1Æ7 m (McSaveney, 1978). The rock avalanchetravelled 6 km along a front up to 3Æ7 km wide.It had a Fahrboschung of 10Æ2� (Table 1). Sub-parallel grooves and flowbands delineated thetravel direction of the landslide and showed thatthe debris extended as it flowed down-glacier.The original debris margin was digitate. Fissurestransverse to the direction of flow were commonin the distal part of the debris sheet, and trans-verse ridges were concentrated at its north-eastcorner. Shreve (1968) describes a raised distal rimat the edge of the debris sheet, but this observa-tion is questioned by McSaveney (1975). Shreve(1966) noted the presence of jigsaw blocks on thedebris sheet, but few were observed duringfieldwork in 2008.
In the nearly five decades since the landslide,the debris sheet has been transported south-
west by Sherman Glacier; some of the debris isnow at the glacier terminus. Some blocks havetumbled down the steep terminal face of theglacier and are accumulating as a moraine. Thedistal arcuate lobes that characterized the freshdebris sheet have been modified extensively byglacier flow. The debris sheet protects underly-ing ice from ablation, and the terminus wasadvancing during a visit by the present authorsin 2008. The distal part of the debris sheet isvegetated.
Matrix particle-size distribution
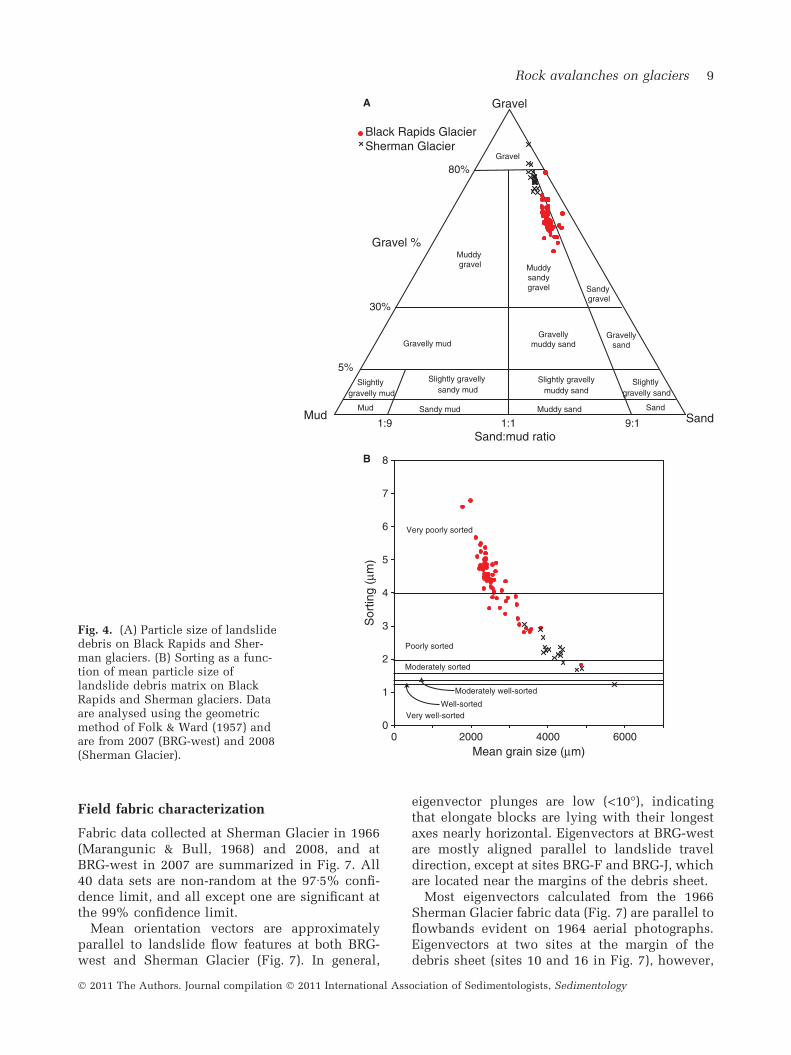
Black Rapids GlacierThe matrix of the BRG-west debris sheet ismuddy sandy gravel and minor sandy gravel;with one exception (sample 003), samples arevery poorly sorted to poorly sorted (Fig. 4).Sorting, however, improves as mean particle sizeincreases.
Pits were excavated at three sites through thedebris sheet to the glacier surface (up to 1Æ7 mdeep), and matrix samples were collected verti-cally through the debris. No systematic trend inmatrix particle size is evident with depth in thedebris sheet (Fig. 5) or with distance from thesource area at BRG-west (Fig. 6). The sedimentcoarsens upward in pit DB3, but there is nosystematic trend in matrix particle size in theother two pits (DB2 and ‘Temp Pit’; Fig. 5).
The particle-size distributions of samplesBRG-C, BRG-D and BRG-I, from the proximal partof the debris sheet, are within the envelopedelineated by BRG-F and BRG-K, the most distalsamples. The matrix of the sample from themedial moraine at site Moraine 1 (Fig. 6) is muchfiner than that of any of the landslide debrissamples. A sample at a different location on thesame moraine (Moraine 2; Fig. 6), however, has amean particle size similar to that of some of thelandslide debris samples, although it is bettersorted.
Sherman GlacierThe matrix of the Sherman Glacier landslidedebris is poorly to moderately sorted, muddysandy gravel and gravel (Fig. 4). Debris pits wereexcavated at two sites on the debris sheet (Fig. 5).Sediment in pit 1 is inversely graded, whereasno systematic vertical trend in particle size isevident in pit 2. Distal samples (Sherman-A,Sherman-B and Sherman-G) are typically finerthan proximal samples (Sherman-E, Sherman-Iand Sherman-J; Fig. 6).
8 D. H. Shugar and J. J. Clague
� 2011 The Authors. Journal compilation � 2011 International Association of Sedimentologists, Sedimentology
Field fabric characterization
Fabric data collected at Sherman Glacier in 1966(Marangunic & Bull, 1968) and 2008, and atBRG-west in 2007 are summarized in Fig. 7. All40 data sets are non-random at the 97Æ5% confi-dence limit, and all except one are significant atthe 99% confidence limit.
Mean orientation vectors are approximatelyparallel to landslide flow features at both BRG-west and Sherman Glacier (Fig. 7). In general,
eigenvector plunges are low (<10�), indicatingthat elongate blocks are lying with their longestaxes nearly horizontal. Eigenvectors at BRG-westare mostly aligned parallel to landslide traveldirection, except at sites BRG-F and BRG-J, whichare located near the margins of the debris sheet.
Most eigenvectors calculated from the 1966Sherman Glacier fabric data (Fig. 7) are parallel toflowbands evident on 1964 aerial photographs.Eigenvectors at two sites at the margin of thedebris sheet (sites 10 and 16 in Fig. 7), however,
SandMud
GravelA
B
80%
30%
5%
1:11:9 9:1Sand:mud ratio
Gravel %
Gravel
Muddy gravel Muddy
sandy gravel
Gravelly mud
Slightly gravelly mud
Slightly gravelly sandy mud
Slightly gravellymuddy sand
Mud Sandy mud Muddy sand
Black Rapids GlacierSherman Glacier
Sandy gravel
Gravellysand
Slightly gravelly sand
Sand
Gravelly muddy sand
0
1
2
3
4
5
6
7
8
0 2000 4000 6000Mean grain size (µm)
Sor
ting
(µm
)
Very poorly sorted
Poorly sorted
Moderately sorted
Moderately well-sorted
Well-sortedVery well-sorted
Fig. 4. (A) Particle size of landslidedebris on Black Rapids and Sher-man glaciers. (B) Sorting as a func-tion of mean particle size oflandslide debris matrix on BlackRapids and Sherman glaciers. Dataare analysed using the geometricmethod of Folk & Ward (1957) andare from 2007 (BRG-west) and 2008(Sherman Glacier).
Rock avalanches on glaciers 9
� 2011 The Authors. Journal compilation � 2011 International Association of Sedimentologists, Sedimentology

90 cm70 cm50 cm30 cm10 cm
70 cm50 cm30 cm10 cm
150 cm130 cm110 cm90 cm70 cm50 cm30 cm15 cm
A BRG DB2 B BRG DB3
C BRG Temp Pit
10–1 100 101 102 103 104 1050
10
20
30
40
50
60
70
80
90
100
Grain size (µm)
Per
cent
fine
r
165 cm120 cm75 cm30 cm
E Sherman Glacier Pit 2
250 cm150 cm50 cm
D Sherman Glacier Pit 1
Fig. 5. Combined sieve-laser diffraction measurement grain-size curves for fine material collected from three verticalprofiles within the BRG-west debris sheet (A), (B) and (C), and from two profiles within the Sherman Glacier debrissheet (D) and (E). Distances are centimetres above the ice-rock interface.
10 D. H. Shugar and J. J. Clague
� 2011 The Authors. Journal compilation � 2011 International Association of Sedimentologists, Sedimentology

are oblique to flowbands. Since 1964, flowbandshave become distorted by glacier flow, which isoblique to the original travel direction of thelandslide. The eigenvectors calculated from datacollected in 2008 (Fig. 7) display a chevron-likepattern, pointing down-glacier but approximatelyparallel to flowbands.
Remotely sensed fabric
The Hot Spot cluster analysis reveals patterns ofdifferent block sizes on the debris sheets of thethree landslides at Black Rapids Glacier. Theblock size patterns share some characteristics,but are not identical (Fig. 8). All three debrissheets have clusters of large blocks in parts oftheir distal rims, but large blocks are notrestricted to those regions and they are not, inall cases, most abundant there. The distal rimwith the most conspicuous cluster of largeblocks is that of BRG-east. Two clusters of largeblocks in the distal rim of BRG-west are small inarea relative to a much larger cluster of largeblocks in the proximal half of that debris sheet.This larger cluster is almost entirely on theproximal side of the medial moraine. A smallcluster of large blocks is present in the extremesouth-west corner of the BRG-west debris sheet.
Two clusters of large blocks are present in thenorth-west corner of the BRG-middle debris
sheet; they could be interpreted as one very largecluster, bisected by a narrow stripe of finer blocks.Most of these blocks are on the distal side of themedial moraine, which is closer to the base ofthe failed slope than at BRG-west or BRG-east.Several small clusters of large blocks occur on theeast and north edges of the debris sheet, that is atits down-glacier margin. Clusters of large blocksare common in the distal rim of BRG-east, as wellas the proximal region directly south of themedial moraine.
No differences in block size are evident withinand between clusters identified with the Gi*statistic. For insight into intra-cluster and inter-cluster variation, maximum and median (d50)block sizes within neighbourhoods were exam-ined. The map of neighbourhood maximum blocksize (Fig. 8) provides additional information onthe distribution of blocks on Black RapidsGlacier. Although the largest block (26 m) onBRG-west is near the middle of the debris sheet,individual blocks 8 to 16 m long are common inthe distal rim. Large blocks (typically 4 to 11 m)are also common in the south-west corner of thedebris sheet, but they were deposited by a smallrockslide that is separate from BRG-west. Theremainder of BRG-west is characterized by blockswith maximum sizes of 4 to 5 m.
Although neighbourhoods with large blocks aredistributed across much of BRG-middle, the
0
10
20
30
40
50
60
70
80
90
100
Per
cent
fine
r
BRG-CBRG-DBRG-IBRG-EBRG-HBRG-FBRG-GBRG-JBRG-K
Moraine 1Moraine 2
100 101 102 103 104 105
Sherman-ASherman-FSherman-BSherman-GSherman-CSherman-HSherman-DSherman-ISherman-ESherman-JSherman outwash
B Sherman Glacier A Black Rapids Glacier
10–1 100 101 102 103 104
Grain size (µm)
Distal
Proximal
Proximal
Distal
Fig. 6. Combined sieve-laser diffraction measurement grain-size curves for fine material on (A) the surface of theBRG-west landslide and (B) the surface of the Sherman Glacier landslide. Sampling locations are shown in Fig. 7.
Rock avalanches on glaciers 11
� 2011 The Authors. Journal compilation � 2011 International Association of Sedimentologists, Sedimentology
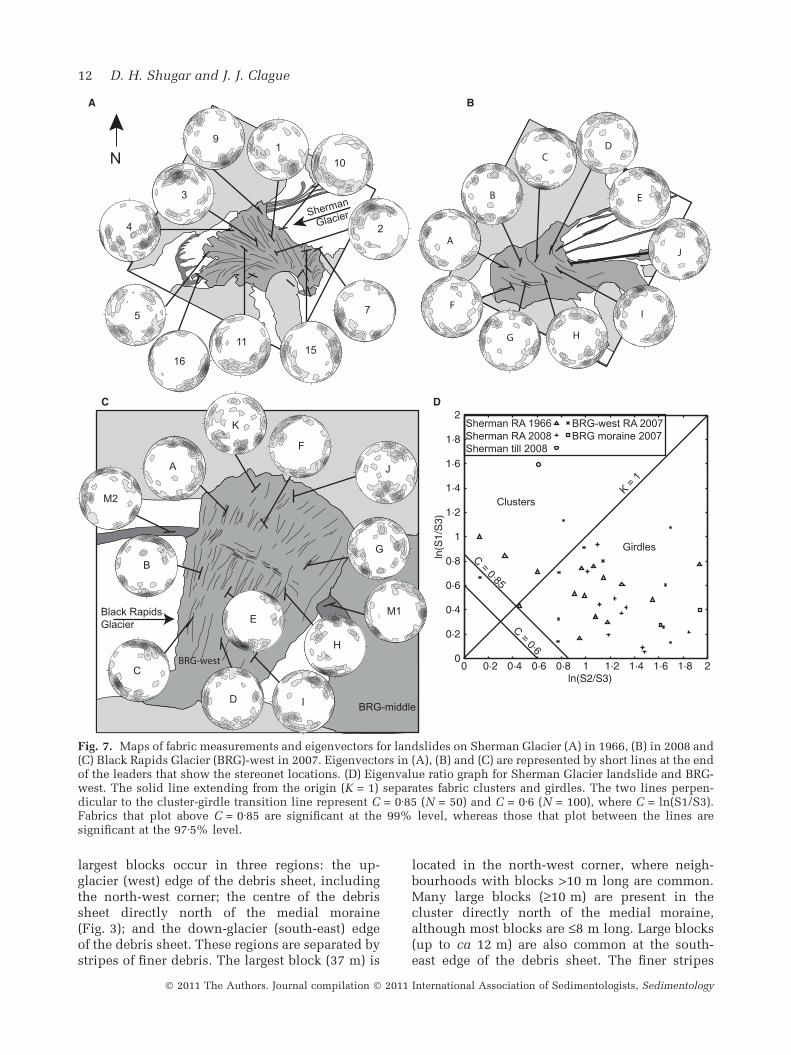
largest blocks occur in three regions: the up-glacier (west) edge of the debris sheet, includingthe north-west corner; the centre of the debrissheet directly north of the medial moraine(Fig. 3); and the down-glacier (south-east) edgeof the debris sheet. These regions are separated bystripes of finer debris. The largest block (37 m) is
located in the north-west corner, where neigh-bourhoods with blocks >10 m long are common.Many large blocks (‡10 m) are present in thecluster directly north of the medial moraine,although most blocks are £8 m long. Large blocks(up to ca 12 m) are also common at the south-east edge of the debris sheet. The finer stripes
0 0·2 0·4 0·6 0·8 1 1·2 1·4 1·6 1·8 20
0·2
0·4
0·6
0·8
1
1·2
1·4
1·6
1·8
2
ln(S2/S3)
ln(S
1/S
3)Sherman RA 1966 BRG-west RA 2007Sherman RA 2008 BRG moraine 2007Sherman till 2008
C D
K = 1
Clusters
Girdles
C = 0·85
C = 0·6
A B
5
A
B
CD
E
F
G H
J
K
F
J
G
ID
C
1
7
2
10
11
16
9
15
4
3
E
A
B
M2
M1
Sherman
Glacier
N
BRG-middle
BRG-west
Black Rapids Glacier
I
H
Fig. 7. Maps of fabric measurements and eigenvectors for landslides on Sherman Glacier (A) in 1966, (B) in 2008 and(C) Black Rapids Glacier (BRG)-west in 2007. Eigenvectors in (A), (B) and (C) are represented by short lines at the endof the leaders that show the stereonet locations. (D) Eigenvalue ratio graph for Sherman Glacier landslide and BRG-west. The solid line extending from the origin (K = 1) separates fabric clusters and girdles. The two lines perpen-dicular to the cluster-girdle transition line represent C = 0Æ85 (N = 50) and C = 0Æ6 (N = 100), where C = ln(S1/S3).Fabrics that plot above C = 0Æ85 are significant at the 99% level, whereas those that plot between the lines aresignificant at the 97Æ5% level.
12 D. H. Shugar and J. J. Clague
� 2011 The Authors. Journal compilation � 2011 International Association of Sedimentologists, Sedimentology

Fig. 8. Maps of (A) block size (Hot Spot) clusters, (B) maximum block length and (C) deviation from the general flowdirection for the Black Rapids Glacier landslides; the maps overlie an orthophotograph mosaic. The source scars aredelineated in (A). Interpreted flowbands are shown in (C).
Rock avalanches on glaciers 13
� 2011 The Authors. Journal compilation � 2011 International Association of Sedimentologists, Sedimentology

separating areas of large blocks include blocksthat are typically £4 m.
The distal reaches of BRG-east are dominatedby neighbourhoods with maximum block sizesof 4 to 6 m, although there are some areas withblocks up to ca 10 m. The proximal part of thedebris sheet is covered by blocks <4 m long.Stripes of these finer blocks extend north-eastinto the distal reaches of BRG-east. The largest
block on BRG-east is 23 m long and is locatedwithin a train of very large blocks (>12 m long)in the distal half of the debris sheet. Most ofthe largest blocks are located within this trainand in the distal rim, as at the two otherlandslides.
The d50 of 25 · 25 m neighbourhoods withinthe most distal clusters at BRG-west are typicallyca 3 m; isolated neighbourhoods have d50 up to
Fig. 9. Relation between median block length and transport distance. (A) Neighbourhood d50 of blocks >1 m2;dashed lines show locations of transects shown in (B). Each data point in (B) is the median block size within a 30 mdiameter circle. Median block size was calculated only for circles containing at least three blocks.
14 D. H. Shugar and J. J. Clague
� 2011 The Authors. Journal compilation � 2011 International Association of Sedimentologists, Sedimentology
5 m (Fig. 9). On the proximal side of the medialmoraine on BRG-west, however, neighbourhoodd50 values are typically 3 to 6 m, with isolatedvalues up to ca 9 m. Neighbourhoods over theremainder of BRG-west typically have d50 values<3 m.
Groups of neighbourhoods with large blocks(d50 ca 3 to 6 m) occur at the north-west corner ofBRG-middle. Neighbourhoods with the largestmedian values (5 to 10 m), however, are locatedin a cluster directly north of the medial moraine.These two regions of larger blocks are bisected bya finer stripe, with typical d50 values of 2 to 3 m.Elsewhere at BRG-middle, most d50 values are£3 m.
Most neighbourhoods on BRG-east have med-ian block sizes of £2 m. A few small clustersof larger blocks (ca 3 m) occur at the distalmargin, with isolated neighbourhoods of 5 to8 m in this area. Neighbourhoods with a medianblock size of 3 m are dominant in the proximalpart of the debris sheet, with isolated neighbour-hoods of 5 m.
Remotely sensed granulometric analysis ofblocks on Black Rapids Glacier (Fig. 9) revealscomplex relationships between block size andtravel distance. Of the three debris sheets, onlyBRG-west shows a statistically significant (signif-icance level a = 0Æ05) relationship between d50
and travel distance. The coefficient of determina-tion, however, is low for all debris sheets (BRG-west R2 = 0Æ09; BRG-middle R2 = 0Æ002; BRG-eastR2 = 0Æ04). Median block size along axial profilesof BRG-west and BRG-east is large near the source(up to 5Æ1 m on BRG-west and 6Æ4 m on BRG-east)and rapidly diminishes away from the source.At BRG-west, block length ranges generally from2 to 3 m along the transect but coarsens slightly atthe distal end. Median block size along the axialprofile of BRG-east is typically about 2 m,although it reaches 7Æ4 m about 80% of the wayalong the transect. Block size along the BRG-middle axial profile is generally larger than ateither BRG-west or BRG-east, ranging from 2 to4Æ5 m, with a maximum of 7Æ1 m about 37% of theway along the transect. The range in medianblock size is greater at BRG-middle than at eitherof the other two landslides.
Elongate (a:b ‡ 1Æ5) rod-shaped blocks are gen-erally aligned parallel to the direction of flow ofthe landslide (Fig. 8C). Small clusters of land-slide-perpendicular blocks are distributed acrossthe debris sheets, most commonly at the edges.A small cluster of landslide-perpendicular blocksoccurs at the north-west corner of the distal rim of
BRG-west. Several clusters of landslide-perpen-dicular blocks occur at the eastern periphery ofBRG-east, and there is one distinct cluster at thewestern periphery of this debris sheet.
DISCUSSION
Debris sheet shape, flow features and landslidemobility
Longitudinal flowbands are present on the debrissheets of the Black Rapids and Sherman glacierlandslides, but they are not a characteristic of allrock avalanches. The debris sheet of the 1903Frank Slide in southern Alberta, for example,does not have flowbands. Dufresne & Davies(2009) differentiate between flowbands formedby rock avalanches that spread out onto glaciersand longitudinal ridges on the surfaces of othertypes of landslides. The latter rise up to tens ofmetres above the surrounding debris surface andgenerally are restricted to the proximal andmedial parts of the debris sheet. In contrast,flowbands are not ridges, commonly extend thefull length of the flow and may be separated fromadjacent flowbands by grooves or furrows. Shreve(1968) noted that longitudinal grooves on theSherman Glacier debris sheet separated bands ofdifferent lithologies. Flowbands at Black RapidsGlacier also are characterized by differences inlithology, clast size and colour (Figs 3 and 8). Thestripes of finer blocks on the debris sheets ofBlack Rapids Glacier that were identified by theneighbourhood analysis (see Remotely sensedfabric section) are flowbands.
Dufresne & Davies (2009) argue that longitu-dinal flowbands are a fundamental characteristicof granular flows on glaciers. Water derived fromthe melt of ice and snow mixes with fragmentingrock, fluidizing it and reducing its frictionalresistance to flow. Fluidization stretches thedebris sheet, producing longitudinal bands ofdebris instead of hummocks or ridges. Theabsence of flowbands at Frank Slide and othernon-glacial rock avalanches may be due to thedebris having been dry when deposited.
Transverse compressional ridges are commonon most rock avalanche debris sheets, and arepresent at Black Rapids and Sherman glaciers.Transverse ridges are most common on the prox-imal side of the medial moraine at Black RapidsGlacier, whereas they are located at the north-eastcorner of the Sherman Glacier debris sheet.McSaveney (1975) argues that compressional
Rock avalanches on glaciers 15
� 2011 The Authors. Journal compilation � 2011 International Association of Sedimentologists, Sedimentology
ridges at Sherman Glacier are folds resulting frombuckling of the debris sheet as it came to rest.This theory is supported by physical modellingby Dufresne & Davies (2009), who show thatsudden deceleration of the debris, due for exam-ple to an encounter with a topographic obstacle,promotes formation of compressional ridges orraised flow fronts. The 25 m high medial moraineon Black Rapids Glacier was a barrier to flow andinduced compression in the debris sheet. Schulzet al. (2008) describe the Black Rapids Glacierlandslide deposits as being thicker on the prox-imal side (ca 3 m) than the distal side (ca 1 to1Æ5 m) of the moraines, consistent with localcompression of the moving debris.
All the rock avalanches studied here plotbelow the curve relating volume (V) and theFahrboschung (Scheidegger, 1973), suggestingthat they are anomalously mobile or that, asStrom (2006) suggests, the Fahrboschung is notthe best measure of mobility. The angles de-scribed here are also at the low end of thespectrum reported by Evans & Clague (1999) forrock avalanches on glaciers in the Coast and St.Elias Mountains of British Columbia. Strom(2006) suggests that, for unconfined rock ava-lanches, a normalized debris apron area or thedimensionless spreading parameter Wmax/Winitial
– the maximum width of the debris aprondivided by the scarp width – are better metricsof mobility, because friction acts over the entirebasal surface and, thus, landslides that moveover unconfined surfaces and form wide apronsare more mobile than those that move mainly inone direction. BRG-west has the smallest spread-ing index of the four landslides studied here (4Æ8versus 5Æ4 to 8Æ6 for the other rock avalanches;Table 1), but values for glacial rock avalanchesare generally larger than those for non-glacialrock avalanches, such as the Frank Slide(spreading index of 3Æ1, cf. Nicoletti & Sorriso-Valvo, 1991). Snow and glacier ice enhancemobility of these rock avalanches, causing themto spread more than they would if they had notoccurred on glaciers and, consequently, leavemuch thinner debris sheets, especially in theabsence of confinement.
Several authors stress the role played by low-roughness substrates on the mobility and traveldistances of landslides that run-out over glaciers.Evans & Clague (1988, 1999), for example, arguethat the mobility of rock avalanches emplacedonto glaciers is enhanced by the low friction atthe debris–glacier interface. These authors sug-gest that friction may be further reduced by water
films generated by frictional heating of ice andsnow and the development of high pore-waterpressures at the base of the debris.
Physical modelling by Friedmann et al. (2006),however, suggests that the properties of granularflows do not depend on the shape or roughness ofthe substrate. These authors conducted laboratoryexperiments on a variety of substrates, rangingfrom smooth Plexiglass to corrugated cardboardwith furrows about 10 particle diameters deep,and found that deposit morphology did notchange. Friedman et al. (2006) suggest that therange of patterns observed in natural depositsmay be unrelated to substrate roughness or thatmacroscopic features, such as raised rims andlongitudinal ridges, can change from one mor-phological form to another with little perturba-tion in movement of the debris. Theseexperiments, however, do not explicitly mimicglacier substrates – Plexiglass has a higher coef-ficient of friction than snow and ice and, ofcourse, there is no frictional melting of Plexiglassor cardboard. McSaveney (1975) estimates thatfrictional energy may have melted 70 kg m)2 ofsnow beneath the Sherman Glacier rock ava-lanche.
Spatial patterns of block size
Many of the largest blocks of the Black RapidsGlacier landslides, including some up to tens ofmetres in diameter, are concentrated along theperipheries and at the distal edges of the debrissheets (Fig. 8). A large Hot Spot cluster with highd50 values occurs in the proximal half of the BRG-west debris sheet, south of the medial moraine(Figs 8 and 9). Caution is required, however,when interpreting the map of neighbourhood d50
values, because some areas with high values havelow densities of blocks per unit area. For exam-ple, the large area of high d50 values in theproximal part of the BRG-west debris sheet has adensity of 3000 to 5000 blocks per km2, whereasthe distal reaches are characterized by densitiesup to ca 32 000 blocks per km2. The proximal25 · 25 m neighbourhoods may contain only afew blocks that skew the median size. Theapparent dichotomy of moderate to low d50 andlarge maximum block size at the distal rim of theBRG-west debris sheet reflects poor sorting in thatarea – very large blocks are scattered among pilesof smaller ones. Sorting in the proximal part ofthe debris sheet is much better, with many blocksof similar size and few very large or very smallblocks.
16 D. H. Shugar and J. J. Clague
� 2011 The Authors. Journal compilation � 2011 International Association of Sedimentologists, Sedimentology

The coarse distal and lateral rims of the BlackRapids Glacier debris sheets are similar to thosedeposited on glaciers by rock avalanches else-where (Rapp, 1959; Shreve, 1959, 1968; Porter &Orombelli, 1980; Blair, 1999; Hewitt, 1999, 2009;Delaney & Evans, 2008). It is notable, however,that raised margins are also associated withMartian landslides, although they occur moretypically at the lateral margins than at the termi-nus (Lucchitta, 1979). Most published descrip-tions of raised rims do not reveal whether theblocks composing the rims are larger than those inthe interior of the debris sheet (Shreve, 1959;Eisbacher, 1979; Stock, 2008) or, alternatively,whether more of them are piled up above thesurrounding debris surface. Marangunic & Bull(1968), however, suggest that distal rims at Sher-man Glacier were produced by bulldozing ofdebris over dirty snow. The coarse blocky rims atBlack Rapids Glacier probably were formed bybulldozing and piling up of very large blocks. Thedistal rim at BRG-west comprises clast-supportedblocks with little interstitial material. In manyplaces, the rim is more than 3 m thick. The rimscontrast with most of the debris sheet, which isfiner and thinner and consists of matrix-sup-ported diamicton capped by a coarser blockycarapace. The dearth of matrix in the rim at BRG-west suggests that the leading edge of the debrisstream was less fragmented than the trailing bodyof debris. In this scenario, the coarse distal rimsare a product of less intense fracturing, perhapsdue to less intense crushing during transport.
Hewitt (2002) pointed out that rock units in thelowest part of the detachment zone form thedistal deposits of rock avalanches. Initial frag-mentation of a coherent rock mass occurs duringthe early stages of transport as the rock movesdown the mountainside towards the foot of theslope (Davies et al., 1999); thus, rock units lowerin the detachment zone will fragment less thanhigher ones. The occurrence of huge clasts on theupper surface of rock avalanche deposits at BlackRapids Glacier and elsewhere (Dunning, 2006;Strom, 2006) suggests that fragmentation occursmainly within, rather than at the surface of, thedebris sheet. Fragmentation involves grindingand crushing, and the stresses needed to fracturerocks are greatest within the body of a rockavalanche; surface clasts are rafted, rather thansheared and disaggregated (Davies et al., 1999).Eisbacher (1979) suggests that debris travelling atthe front of a rock avalanche is subject to dilationand thinning, an environment not conducive tofragmentation. McSaveney (1978) argues that the
Sherman Glacier debris behaved as a Binghamplastic, with minimal grain crushing at theperiphery. It is likely that a similar processoperated with the landslides on Black RapidsGlacier.
The lack of significant trends in median blocksize with distance along the axial profiles of theBlack Rapids Glacier debris sheets (Fig. 9) sug-gests that either block size on the surface of rockavalanches does not change with distance, assuggested by Marangunic & Bull (1968), or thataxial profiles are not the best descriptor of blocksize variability. McSaveney (1975) argues thatirregular topography along the flow path of theSherman Glacier rock avalanche contributedmore to fragmentation of the debris than distancetravelled. Based on the complex spatial patternsshown in Figs 8 and 9, the present authorssuggest that a one-dimensional transect is notappropriate for describing block size trends in arock avalanche debris sheet. Instead, much valu-able information can be gained by using a com-bined field-GIS method, such as that describedhere.
Spatial patterns of block orientation
Mean orientation vectors of elongate blocks atSherman Glacier (1966 data, Fig. 7) and BlackRapids Glacier (Figs 7 and 8) indicate that clastswere aligned parallel to flow. Although flow-induced realignment is the most likely scenario, itis possible that this fabric represents the initialalignment of blocks. Flow-parallel fabrics canresult from shear between adjacent semi-coherentbands of debris. Most of the elongate blocks thatare perpendicular to flow are in the distal parts ofthe debris sheets or on the proximal side of themedial moraine at Black Rapids Glacier, suggest-ing that clasts realign as the landslide slows andcomes to rest or as the debris travels overobstacles. Alternatively, this pattern may resultfrom less intense crushing at the leading edgethan in the middle of the debris sheet. Blair(1999) describes a similar reorientation of clastsin the North Long John rock avalanche in Cali-fornia.
McSaveney (1978) ascribes the rarer transversefabric in the Sherman Glacier debris sheet to therolling of clasts rather than longitudinal stretch-ing of the debris. On the rock avalanche depositsat Black Rapids Glacier, the transverse fabrics aremostly observed at the margins of the debrissheets. A possible explanation is that thesemarginal blocks rotated shortly after coming to
Rock avalanches on glaciers 17
� 2011 The Authors. Journal compilation � 2011 International Association of Sedimentologists, Sedimentology

rest as other blocks collided with them. Heim(1882; quoted in Eisbacher, 1979) suggests thatthe trailing part of a rock avalanche will notovertake the front of the flow, but it will impactthe front and push it forward. Strom (1996) arguesfor a similar mechanism, but concludes that, ifthe trailing part of the debris has sufficient kineticenergy, it can outrun the leading edge. Modellingby Davies et al. (1999), however, suggests that theopposite occurs – longitudinal dispersive forcesreduce the debris thickness, causing the trailingdebris to decelerate and the leading debris toaccelerate.
Post-depositional modification of rockavalanche matrix
The matrix of the landslide debris on ShermanGlacier is coarser and better sorted than that ofBRG-west. Samples plot closer to the gravel endof the spectrum of rock avalanche matrices (com-pare Fig. 4 with fig. 4 of Dunning & Armitage,2005). These differences could reflect differentsource lithologies, different environments, orlengthy post-depositional modification of thedebris on Sherman Glacier. The different litho-logies at the two sites (granitoid rocks at BlackRapids Glacier, sandstone and argillite at Sher-man Glacier) may influence the degree of frag-mentation of blocks during transport. Differencesin fall height and runout distance may also affectthe degree of crushing, thereby producing differ-ent initial particle-size distributions. Finally,much of the original fine matrix in the ShermanGlacier debris may have been removed by weath-ering since 1964.
A laboratory test was performed to evaluate theeffect of the different lithologies on the particle-size distributions of the rock avalanche debris.Nine samples of BRG-west and Sherman Glacierdebris were crushed using a jaw crusher, diskmill and pulverizer (10 sec per sample), and theparticle-size distributions of the crushed (<1 mm)matrix were measured. All crushed samples aresilty sand, but the samples from Sherman Glacierare slightly coarser than those from BRG-west(Fig. 10), suggesting that lithological differencescontribute at least partially to the differences inthe particle-size distributions. Eyles & Rogerson(1978), however, report that particle-size distri-butions of debris on medial moraines of BerendonGlacier in northern British Columbia are inde-pendent of bedrock source. Hewitt (2009)describes relatively little change to the generalmorphology of rock avalanche debris sheets on
Bualtar Glacier, Pakistan, after 20 years of supra-glacial transport. The debris, however, had beensubstantially reworked over this time. The matrixhas been weathered due to deflation by strongkatabatic winds.
The Sherman Glacier landslide has a largervertical travel distance than BRG-west (1Æ08 kmversus 0Æ73 km), as well as a longer horizontaltravel distance (6Æ0 km versus 3Æ4 km). Becausefragmentation occurs continuously during trans-port (Davies et al., 1999), the matrix of rockavalanche debris should fine with distance oftravel (Fig. 6). Therefore, it seems unlikely thatthe greater fall height and longer travel distanceof the Sherman Glacier landslide contributed tothe observed difference in texture between itsdebris and that of BRG-west.
Particle-size data were compiled for seven rockavalanche deposits (four in the 20th Century andthree that are prehistoric) to elucidate factorsresponsible for the observed differences betweenthe Sherman and Black Rapids debris (Fig. 10).McSaveney & Davies (2007) describe rock ava-lanche grains in sub-micron sizes down to theresolution of their electron microscope (ca0Æ077 lm). The smallest mean diameter measuredin the current study is about 0Æ5 lm, although it ispossible that grains too small for the laser particlesize analyser were present. All but two of the rockavalanche deposits studied here have gravellymatrices that are coarser than almost all of theSherman and Black Rapids samples. The twomost recent events – the 1980 Mount St. Helensand 1991 Mount Cook landslides – have the finestmatrices (muddy sandy gravel) of the eight forwhich data is available, raising the possibilitythat at least some of the silt and clay in rockavalanche debris may be removed by weatheringand erosion on a decadal time scale. McSaveney(1975) points out that much of the finer sizematerial that may have been on the surface of theSherman Glacier rock avalanche was removed byrain and melting snow.
No systematic vertical textural variations wereobserved in the subsurface debris on BRG-westor Sherman Glacier, and no spatial variationswere observed on BRG-west. The matrix of theSherman Glacier landslide debris, however, fineswith increasing distance from the source.Although inverse grading of rock avalanchedeposits is described here and elsewhere, itrelates only to the capping coarse carapace ofblocks above the otherwise massive main bodyof the debris sheet. Dunning (2006) drew asimilar conclusion – no normal or inverse
18 D. H. Shugar and J. J. Clague
� 2011 The Authors. Journal compilation � 2011 International Association of Sedimentologists, Sedimentology

grading was apparent in the landslide depositsstudied at that time.
Post-deposition modification to large blocks
Marangunic & Bull (1968) measured block fabricat Sherman Glacier in 1966, two years after thelandslide. Over this two-year period, the surfaceof the debris sheet was not modified significantlyby differential ablation or glacier motion. Thedata in Fig. 7 (Marangunic & Bull, 1968) thuscome close to characterizing the unmodifiedlandslide debris and can be compared to themeasurements made by the present authors in2007, more than 40 years later.
The 1966 measurements show that elongateclasts in the interior of the debris sheet are
preferentially oriented parallel to the flow direc-tion of the landslide. This pattern suggests thatblocks rotate during flow due to shear within themoving debris mass. Streams of clasts may havemoved past each other at different velocities,dragging the larger clasts into parallelism with theoverall flow direction. Fabric data collected in1966 from the periphery of the Sherman Glacierdebris sheet are somewhat weaker and morevariable – some sets have dominant trends paral-lel to flowlines and a few are normal to flow. Thispattern may reflect mixing near the free boundaryat the front of the debris sheet; clasts there are lessconstrained by their neighbours and may notreadily orient parallel to flow. Further, if theleading edge of the debris sheet stalls, trailingdebris is compressed behind it, causing frontal
SandMud
Gravel
80%
30%
5%
1:11:9 9:1Sand:mud ratio
Gravel %
Gravel
Muddy gravel
Muddy sandy gravel
Gravelly mud
Slightly gravelly
mud
Slightly gravelly mud
Slightly gravellymuddy sand
Mud Sandy mud Muddy sand
Slightly gravelly
sandSand
MSHMt Cook
SiltClay
Sand
90%
50%
10%
1:2 2:1Silt:clay ratio
Sand %Clayey
sand Muddy sand
Sandy clay Sandy siltSandy mud
Clay Mud Silt
Silty sand
0
1
2
3
4
5
6
0 200 400 600
Sor
ting
(µm
)
Mean grain size (µm)
Black Rapids GlacierSherman Glacier
A B
C
Very poorly sorted
Poorly sorted
Moderately sorted
Moderately well-sortedWell-sorted
Very well-sorted
Frank SlideFalling Mountain (3 samples)
Gravelly muddy sand
Sand
Gravelly sand
Sandygravel
Fig. 10. (A) Particle size of crusheddebris from Black Rapids and Sher-man glaciers. (B) Sorting as a func-tion of mean grain size for crushedmaterial from Black Rapids andSherman glacier debris; sorting cal-culated using the geometric Folk &Ward (1957) method. (C) Particlesize of matrix of other large rockavalanches, including FallingMountain (1929), Acheron (ca1100 yr bp), Coleridge (ca 700 yr bp),Round Top (ca 1070 yr bp), FrankSlide (1903), Mount Cook (1991)and Mount St. Helens (1980). Datafor (C) provided by M. McSaveney,GNS Science, New Zealand. Somesites have more than one data point.
Rock avalanches on glaciers 19
� 2011 The Authors. Journal compilation � 2011 International Association of Sedimentologists, Sedimentology
elongate clasts to reorient perpendicular to flow.After deposition, blocks at the perimeter of thelandslide may topple or slide due to differentialmelt of the adjacent bare ice.
Four decades of supraglacial transport havemodified the fabric of the Sherman Glacier debrissheet. The mean orientation vectors in 2008(Fig. 7) were still approximately parallel to flow-lines, but have been substantially deformed byglacier flow. Downglacier transport of the debrissheet has been greatest at the centre of the glacierand least at the margins.
Modification of the fabric of a rock avalanchedebris sheet by glacier flow is not surprising,because the blocks form a continuous thin inter-locking sheet. Blocks along the centreline of theglacier move faster than those nearer the margins.These differential movements tend to reorientelongate blocks such that their long axes pointdownglacier (Fig. 7). In cases where the flowdirection of the landslide is parallel to the flowdirection of the glacier, such as on the eastern halfof BRG-middle, it is unclear whether post-depo-sition glacier flow will rework the debris enoughto destroy or reorient block fabrics.
CONCLUSIONS
This study describes the geomorphology andsedimentology of four rock avalanche debrissheets, three emplaced during an earthquake in2002 and one nearly 50 years old, in order tocharacterize the deposits and determine whetherglacier motion and weathering significantly affectthe debris. The four debris sheets share manycharacteristics, including a mono-lithologicalmega-breccia texture, lobate form, and lack ofvertical gradation except for a coarse surficialcarapace. Elongate clasts in the debris sheets arepreferentially aligned parallel to the landslideflow direction, and distal coarse rims are foundon parts of the three rock avalanche debris sheetson Black Rapids Glacier. Longitudinal flowbandsoccur on all four debris sheets.
Since the Sherman Glacier landslide in 1964,glacier flow has reoriented clasts so that they noware nearly parallel to the direction of glacier flow.The finer fraction of the surface debris has beenwashed away, leaving a coarser, better sortedsurface deposit.
An important contribution of this study is thefinding that one-dimensional transects do notalways portray a complete or appropriate pictureof the geomorphology of a landslide deposit.
Recent advancements in GIS now allow extre-mely detailed mapping of two-dimensional andthree-dimensional surfaces with relative ease.Future efforts in landslide mapping should makeuse of this powerful tool.
ACKNOWLEDGEMENTS
This work was funded through an NSERC Dis-covery Grant to Clague and an NSERC-PGS-D3doctoral scholarship, a Geological Society ofAmerica Bruce ‘Biff’ Reed research grant, North-ern Scientific Training Program grants and anArctic Institute of North America Grant-in-Aid toShugar. Generous in-kind support was providedby Marmot Mountain Canada, Petzl-CharletMoser and Sportiva. We thank Steve Sparks(Aero-Metric Alaska, Fairbanks, Alaska) forproviding aerial photographs of Black RapidsGlacier. Mark Hird-Rutter (British Columbia Insti-tute of Technology, Burnaby, British Columbia)helped greatly in producing the digital elevationmodel of Black Rapids Glacier. Jon Pasher (Envi-ronment Canada, Ottawa, Ontario) and DanPatterson (Carleton University, Ottawa, Ontario)provided invaluable assistance with digitalphoto-sieving. Cedomir Marangunic (Geoestu-dios, Santiago, Chile) provided his fabric datafrom Sherman Glacier, and Mauri McSaveney(GNS Science, Lower Hutt, New Zealand) pro-vided particle-size data for other landslides.McSaveney also assisted in the field at ShermanGlacier and contributed to the formulation ofsome of the ideas contained in this article. DennyCapps (Simon Fraser University, Burnaby, BritishColumbia) and Bernhard Rabus (MacDonaldDettwiler and Associates, Richmond, BritishColumbia) helped collect data at Black RapidsGlacier. We also thank Erin Pettit (CRREL, FortWainright, Alaska) and the US Army (Fort Wain-right, Alaska) for logistical support at BlackRapids Glacier. We thank Wilfried Haeberli andtwo anonymous reviewers for their comments onan earlier draft of the paper.
REFERENCES
Benn, D.I. and Ringrose, T.J. (2001) Random variation of fabric
eigenvalues: implications for the use of a-axis fabric data to
differentiate till facies. Earth Surf. Proc. Land., 26, 295–306.
Bennett, M.R., Waller, R.I., Glasser, N.F., Hambrey, M.J. and
Huddart, D. (1999) Glacigenic clast fabrics: genetic finger-
print or wishful thinking? J. Quatern. Sci., 14, 125–135.
20 D. H. Shugar and J. J. Clague
� 2011 The Authors. Journal compilation � 2011 International Association of Sedimentologists, Sedimentology

Blair, T.C. (1999) Form, facies, and depositional history of the
North Long John rock avalanche, Owens Valley, California.
Can. J. Earth Sci., 36, 855–870.
Blott, S.J. and Pye, K. (2001) GRADISTAT: a grain size distri-
bution and statistics package for the analysis of unconsoli-
dated sediments. Earth Surf. Proc. Land., 26, 1237–1248.
Bull, C. and Marangunic, C. (1967) The earthquake-induced
slide on the Sherman Glacier, south-central Alaska, and its
glaciological effects. In: Physics of Snow and Ice; Interna-
tional Conference on Low Temperature Science, Vol. 1,
pp. 395–408. Sapporo, Japan.
Bull, C. and Marangunic, C. (1968) Glaciological effects of
debris slide on Sherman Glacier. In: The Great Alaska
Earthquake of 1964 – Hydrology, Pt. A, pp. 309–317.
National Academy of Sciences, Washington, DC.
Couture, R. (1998) Contributions aux aspects physiques et
mechaniques des ecroulements rocheux. PhD Thesis, Uni-
versite Laval, Laval, QC, 573 pp.
Cox, L.H. and March, R.S. (2004) Comparison of geodetic and
glaciological mass-balance techniques, Gulkana Glacier,
Alaska, USA. J. Glaciol., 50, 363–370.
Crosta, G.B., Frattini, P. and Fusi, N. (2007) Fragmentation in
the Val Pola rock avalanche, Italian Alps. J. Geophys. Res.,
Earth Surf., 112, F01006. doi: 10.1029/2005JF000455.
Cruden, D.M. and Hungr, O. (1986) The debris of the Frank
Slide and theories of rockslide-avalanche mobility. Can. J.Earth Sci., 23, 425–432.
Davies, T.R. and McSaveney, M.J. (2002) Dynamic simulation
of the motion of fragmenting rock avalanches. Can. Geotech.
J., 39, 789–798.
Davies, T.R., McSaveney, M.J. and Hodgson, K.A. (1999)
A fragmentation-spreading model for long-runout rock
avalanches. Can. Geotech. J., 36, 1096–1110.
Delaney, K.B. and Evans, S.G. (2008) Application of digital
cartographic techniques in the characterization and analysis
of catastrophic landslides; the case of the 1997 Mount
Munday rock avalanche, British Columbia. In: 4th CanadianConference on Geohazards: From Cause to Manage (Eds
J. Locat, D. Perret, D. Turmel, D. Demers and S. Leroueil),
pp. 141–146. University Laval, Quebec City, QC.
Dufresne, A. and Davies, T.R. (2009) Longitudinal ridges in
mass movement deposits. Geomorphology, 105, 171–181.
Dunning, S.A. (2004) Rock avalanches in high mountains. PhD
Thesis, University of Luton, Luton, 309 pp.
Dunning, S.A. (2006) The grain-size distribution of rock-
avalanche deposits in valley confined settings. Italian J.
Eng. Geol. and Env., 1, 117–121.
Dunning, S.A. and Armitage, P.J. (2005) The grain-size dis-
tribution of rock-avalanche deposits: implications for natu-
ral dam stability. In: Natural and Artificial Rockslide Dams;
NATO Science Series: IV, Earth and Environmental
Sciences (Eds K. Abdrakhmatov, S.G. Evans, R. Hermanns,
G. Scarascia-Mugnozza and A.L. Strom), Vol. 133. Springer,
Dordrecht.
Dunning, S.A., Petley, D.N., Rosser, N.J. and Strom, A.L.(2005) The morphology and sedimentology of valley
confined rock-avalanche deposits and their effect on po-
tential dam hazard. In: Landslide Risk Management: Pro-
ceedings of the International Conference on LandslideRisk Management, Vancouver (Eds O. Hungr, R. Fell, R.
Couture and E. Eberhardt), pp. 691–701. Taylor & Francis
Group, London.
Eisbacher, G.H. (1979) Cliff collapse and rock avalanches
(sturzstroms) in the Mackenzie Mountains, northwestern
Canada. Can. Geotech. J., 16, 309–344.
Evans, S.G. and Clague, J.J. (1988) Catastrophic rock ava-
lanches in glacial environments. In: Proceedings of the 5th
International Symposium on Landslides (Ed. C. Bonnard),
Vol. 2, pp. 1153–1158. Lausanne, Switzerland.
Evans, S.G. and Clague, J.J. (1999) Rock avalanches on glaciers
in the Coast and St. Elias Mountains, British Columbia. In:
Slope Stability and Landslides, Proceedings of the 13th
Annual Vancouver Geotechnical Conference, Vancouver,
BC.
Evans, S.G., Hungr, O. and Clague, J.J. (2001) Dynamics of the
1984 rock avalanche and associated distal debris flow on
Mount Cayley, British Columbia, Canada; implications for
landslide hazard assessment on dissected volcanoes. Eng.
Geol., 61, 29–51.
Evans, S.G., Tutubalina, O.V., Drobyshev, V.N., Chernomo-rets, S.S., McDougall, S., Petrakov, D.A. and Hungr, O.(2009) Catastrophic detachment and high-velocity long-
runout flow of Kolka Glacier, Caucasus Mountains, Russia
in 2002. Geomorphology, 105, 314–321.
Eyles, N. and Rogerson, R.J. (1978) Sedimentology of medial
moraines on Berendon Glacier, British Columbia, Canada –
implications for debris transport in a glacierized basin.
Geol. Soc. Am. Bull., 89, 1688–1693.
Fatland, D.R., Lingle, C.S. and Truffer, M. (2003) A surface
motion survey of Black Rapids Glacier, Alaska, USA. Ann.
Glaciol., 36, 29–36.
Folk, R.L. and Ward, W.C. (1957) Brazos River bar (Texas): a
study in the significance of grain size parameters. J. Sed.
Petrol., 27, 3–26.
Friedmann, S.J., Taberlet, N. and Losert, W. (2006) Rock-
avalanche dynamics: insights from granular physics exper-
iments. Int. J. Earth Sci., 95, 911–919.
Gates, W.C.B. (1987) The fabric of rockslide avalanche
deposits. Bull. Assoc. Eng. Geol., 24, 389–402.
Geertsema, M., Clague, J.J., Schwab, J.W. and Evans, S.G.(2006) An overview of recent large catastrophic landslides
in northern British Columbia, Canada. Eng. Geol., 83, 120–
143.
Giardino, J.R. and Vitek, J.D. (1985) A statistical interpreta-
tion of the fabric of a rock glacier. Arctic Alpine Res., 17,165–177.
Harp, E.L., Jibson, R.W., Kayen, R.E., Keefer, D.K., Sherrod,B.L., Carver, G.A., Collins, B.D., Moss, R.E.S. and Sitar, N.(2003) Landslides and liquefaction triggered by the M 7Æ9Denali Fault earthquake of 3 November 2002. GSA Today,
August, 4–10.
Heim, A. (1882) Der Bergsturz von Elm. Z. Deut. Ges. Geowiss.,
34, 74–115.
Hewitt, K. (1988) Catastrophic landslide deposits in the
Karakoram Himalaya. Science, 242, 64–67.
Hewitt, K. (1999) Quaternary moraines vs catastrophic rock
avalanches in the Karakoram Himalaya, northern Pakistan.
Quatern. Res., 51, 220–237.
Hewitt, K. (2002) Styles of rock-avalanche depositional com-
plexes conditioned by very rugged terrain, Karakoram
Himalaya, Pakistan. Rev. Eng. Geol., 15, 345–377.
Hewitt, K. (2009) Rock avalanches that travel onto glaciers and
related developments, Karakoram Himalaya, Inner Asia.
Geomorphology, 103, 66–79.
Hewitt, K., Clague, J.J. and Orwin, J.F. (2008) Legacies of
catastrophic rock slope failures in mountain landscapes.
Earth Sci. Rev., 87, 1–38.
Hungr, O. (1995) A model for the runout analysis of rapid flow
slides, debris flows, and avalanches. Can. Geotech. J., 32,610–623.
Rock avalanches on glaciers 21
� 2011 The Authors. Journal compilation � 2011 International Association of Sedimentologists, Sedimentology

Ibbeken, H. and Schleyer, R. (1986) Photo-sieving – a method
for grain-size analysis of coarse-grained, unconsolidated
bedding surfaces. Earth Surf. Proc. Land., 11, 59–77.
Jibson, R.W., Harp, E.L., Schulz, W. and Keefer, D.K. (2004)
Landslides triggered by the 2002 Denali fault, Alaska,
earthquake and the inferred nature of the strong shaking.
Earthquake Spectra, 20, 669–691.
Jibson, R.W., Harp, E.L., Schulz, W. and Keefer, D.K. (2006)
Large rock avalanches triggered by the M 7Æ9 Denali Fault,
Alaska, earthquake of 3 November 2002. Eng. Geol., 83,144–160.
Keefer, D.K. (2002) Investigating landslides caused by earth-
quakes – a historical review. Surv. Geophys., 23, 473–510.
Kelfoun, K., Druitt, T., van Wyk de Vries, B. and Guilbaud,M.N. (2008) Topographic reflection of the Socompa debris
avalanche, Chile. Bull Volcanol., 10, 1169–1187.
Larsen, S.H., Davies, T.R.H. and McSaveney, M.J. (2005)
A possible coseismic landslide origin of late Holocene
moraines of the Southern Alps, New Zealand. NZ J. Geol.Geophys., 48, 311–314.
Locat, P., Couture, R., Leroueil, S., Locat, J. and Jaboyedoff,M. (2006) Fragmentation energy in rock avalanches. Can.Geotech. J., 43, 830–851.
Lucchitta, B.K. (1979) Landslides in Valles Marineris, Mars.
J. Geophys. Res., 84, 8097–8113.
Lundqvist, G. (1949) The orientation of the block material in
certain species of flow earth. Points of view on method.
Geogr. Ann., 31, 335–347.
Marangunic, C. and Bull, C. (1968) The landslide on the
Sherman Glacier. In: The Great Alaska Earthquake of 1964 –Hydrology, Pt. A, pp. 383–394. National Academy of Sci-
ences, Washington, DC.
Mark, D.M. (1973) Analysis of axial orientation data, includ-
ing till fabrics. Geol. Soc. Am. Bull., 84, 1369–1373.
McDougall, S. and Hungr, O. (2005) Dynamic modelling of
entrainment in rapid landslides. Can. Geotech. J., 42, 1437–
1448.
McSaveney, M.J. (1975) The Sherman Glacier rock avalanche
of 1964: its emplacement and subsequent effects on the
glacier beneath it. PhD Thesis, Ohio State University,
Columbus, OH, 403 pp.
McSaveney, M.J. (1978) Sherman Glacier rock avalanche,
Alaska, U.S.A. In: Rockslides and Avalanches, 1 Natural
Phenomena (Ed. B. Voight), pp. 197–258. Elsevier,
Amsterdam.
McSaveney, M.J. and Davies, T.R. (2007) Rockslides and their
motion. In: Progress in Landslide Science (Eds K. Sassa,
H. Fukuoka, F. Wang and G. Wang), pp. 113–133. Springer-
Verlag, Berlin.
McSaveney, M.J. and Davies, T.R. (2009) Surface energy is not
one of the energy losses in rock comminution. Eng. Geol.,
109, 109–113.
Mitchell, A. (1999) The ESRI Guide to GIS Analysis Volume 2:
Spatial Measurements & Statistics. ESRI Press, Redlands,
CA, 238 pp.
Neuendorf, K.E., Mehl, J.P. Jr. and Jackson, J.A. (2005) Glos-sary of Geology, 5th Ed., American Geological Institute,
Alexandria, VA, 800 pp.
Nicoletti, P.G. and Sorriso-Valvo, M. (1991) Geomorphic
controls of the shape and mobility of rock avalanches. Geol.
Soc. Am. Bull., 103, 1365–1373.
Patterson, D.E. (2008) Bounding Containers ArcGIS Toolbox.
Available at: http://resources.arcgis.com/ Accessed 1 Octo-
ber 2008. Available at: http://resources.arcgis.com/.
Porter, S.C. and Orombelli, G. (1980) Catastrophic rockfall of
September 12, 1717 on the Italian flank of the Mont Blanc
massif. Z. Geomorphol., 24, 200–218.
Post, A. (1968) Effects on glaciers. In: The Great AlaskaEarthquake of 1964 – Hydrology, Pt. A, pp. 266–308. Na-
tional Academy of Sciences, Washington, DC.
Rapp, A. (1959) Avalanche boulder tongues in Lappland.
Geogr. Ann., 41, 34–48.
Scheidegger, A.E. (1973) On the prediction of the reach and
velocity of catastrophic landslides. Rock Mech., 5, 231–236.
Schiefer, E. and Gilbert, R. (2007) Reconstructing morpho-
metric change in a proglacial landscape using historical
aerial photography and automated DEM generation. Geo-
morphology, 88, 167–178.
Schulz, W.H., Harp, E.L. and Jibson, R.W. (2008) Character-
istics of large rock avalanches triggered by the November 3,
2002 Denali Fault earthquake, Alaska, USA. In: 10th Inter-
national Symposium on Landslides (Ed. G. Deng), pp. 6.
Xi’an, China.
Shreve, R.L. (1959) Geology and mechanics of the Blackhawk
landslide, Lucerne Valley, California. PhD Thesis, Califor-
nia Institute of Technology, Pasadena, CA, 79 pp.
Shreve, R.L. (1966) Sherman landslide, Alaska. Science, 154,1639–1643.
Shreve, R.L. (1968) Sherman landslide. In: The Great Alaska
Earthquake of 1964 – Hydrology, Pt. A, pp. 395–401.
National Academy of Sciences, Washington, DC.
Shulmeister, J., Davies, T.R., Evans, D.J.A., Hyatt, O.M. and
Tovar, D.S. (2009) Catastrophic landslides, glacier behav-
iour and moraine formation – a view from an active plate
margin. Quatern. Sci. Rev., 28, 1085–1096.
Stock, G.M. (2008) Cataclysmic rock avalanche from El
Capitan, Yosemite Valley, circa 3.6 ka. In: AmericanGeophysical Union, Fall Meeting 2008, H53G-07, San
Francisco, CA.
Strom, A.L. (1996) Some morphological types of long-runout
rockslides: effect of the relief on their mechanism and
on the rockslide deposits distribution. In: Proceedings of
the 7th International Symposium on Landslides (Ed.
K. Senneset), pp. 1977–1982. Balkema, Rotterdam.
Strom, A.L. (2006) Morphology and internal structure of
rockslides and rock avalanches; grounds and constraints for
their modelling. In: Landslides from Massive Rock Slope
Failure; NATO Science Series: IV, Earth and Environmental
Sciences (Eds S.G. Evans, G. Scarascia-Mugnozza, A.L.
Strom and R.L. Hermanns), Vol. 49, pp. 305–326. Springer,
Dordrecht.
Tovar, D.S., Shulmeister, J. and Davies, T.R. (2008) Evidence
for a landslide origin of New Zealand’s Waiho Loop
moraine. Nature Geosci., 1, 524–526.
Tuthill, S.J., Field, W.O. and Clayton, L. (1968) Postearth-
quake studies at Sherman and Sheridan Glaciers. In: TheGreat Alaska Earthquake of 1964 – Hydrology, Pt. A, pp.
318–328. National Academy of Sciences, Washington, DC.
Woodcock, N.H. (1977) Specification of fabric shapes using
an eigenvalue method. Geol. Soc. Am. Bull., 88, 1231–
1236.
Manuscript received 27 September 2010; revisionaccepted 4 February 2011
22 D. H. Shugar and J. J. Clague
� 2011 The Authors. Journal compilation � 2011 International Association of Sedimentologists, Sedimentology