Embed Size (px)
Citation preview
Brite-Euram Project No.: BE95-1426Contract No.: BRPR-CT95-0024Task No.: 2Sub-Task No.: 2.1Date: 30.8.96Contributing Organisations: British Steel
STRUCTURAL INTEGRITY ASSESSMENT PROCEDURES
FOR EUROPEAN INDUSTRY
SINTAP
SUB-TASK 2.1 REPORT: THE SIGNIFICANCE OF THE
YIELD STRESS/TENSILE STRESS RATIO
TO STRUCTURAL INTEGRITY
Reported By: British Steel plc
Authors: A.C. Bannister and S.J. Trail

BRITE-EURAM SINTAP S454-1 BRPR-CT95-0024Contribution to BE95-1426 Task 2 Sub-Task 2.1 30/8/96 CONFIDENTIAL
INITIAL CIRCULATION
EXTERNAL CIRCULATION
VTT
Dr K. Wallin
Nuclear Electric Limited
Dr R. Ainsworth (3 copies)
GKSS
Dr M. Koçak
IDS
Dr P. Achon
University of Cantabria
Prof. F. G-Solana
BS SECTIONS, PLATES & COMMERCIAL STEELS
Scunthorpe Works
Dr T.J. PikeDr M.C. Pope
Commercial Office - Plates
Mr W. Ramsay
BS TUBES & PIPES
Hartlepool Works
Mr P. Tait
BS TECHNOLOGY CENTRES
Swinden Technology Centre
Mr A.C. Bannister (8 Copies)Mr P.H. BatesonMiss N. CardinalDr P.L. HarrisonMr C. LindleyMr I.W. MartinMr J. OrrDr D.J. PriceMr A.T. SheridanMr S. TrailMr S.E. Webster
The contents of this report are the exclusive property of British Steel plc and are confidential. The contents must not be disclosed to any other party without British Steel's previous written consent which(if given) is in any event conditional upon that party indemnifying British Steel against all costs, expenses and damages claims which might arise pursuant to such disclosure.
Care has been taken to ensure that the contents of this report are accurate, but British Steel and its subsidiary companies do not accept responsibility for errors or for information which is found to bemisleading. Suggestions for or descriptions of the end use or application of products or methods of working are for information only and British Steel and subsidiaries accept no liability in respectthereof. Before using products supplied or manufactured by British Steel or its subsidiary companies the customer should satisfy himself of their suitability. If further assistance is required, British Steelwithin the operational limits of its research facilities may often be able to help.
COPYRIGHT AND DESIGN RIGHT - © - BRITISH STEEL, 1996
BRITE-EURAM SINTAP S454-1 BRPR-CT95-0024Contribution to BE95-1426 Task 2 Sub-Task 2.1 30/8/96 CONFIDENTIAL
1
SUMMARY
THE SIGNIFICANCE OF THE YIELD STRESS/TENSILE STRESS RATIO TO STRUCTURAL INTEGRITY
British Steel plc
The trend towards the optimisation of the useful weight of structures has led to the use of increased strengthmaterials. In this context high strength steels (YS >450 MPa) have a significant potential contribution which stillremains largely unrealised. This is predominantly due to design code limitations, the upper allowable limit of yieldstress/ultimate stress ratio being particularly severe. This report presents a review of current literature on the origins,causes and structural significance of high Y/T ratios in steels.
Treatment of Y/T in design codes, the origin of the limits and current thinking on acceptable limits are first reviewed.The reasons for higher Y/T ratios in steels and the relationships between Y/T and other parameters, principally thestrain hardening exponent, are then assessed. The structural significance of Y/T is then reviewed with reference tothe influence of cracks and the behaviour of high Y/T steels in buildings, bridges, pressure vessels, tubular structuresand pipelines. The treatment of the Y/T ratio in assessment codes is then addressed with particular reference to R6,BSPD6493 and the engineering treatment model. As final steps, conclusions and recommendations for further workare made.
The report provides a status review on this subject and forms the basis for the direction of further work within theSINTAP project.
BRITE-EURAM SINTAP S454-1 BRPR-CT95-0024Contribution to BE95-1426 Task 2 Sub-Task 2.1 30/8/96 CONFIDENTIAL
2
CONTENTS
Page
1. INTRODUCTION 3
1.1 Background 31.2 Purpose of Review 3
2. TREATMENT OF YIELD/TENSILE RATIO IN DESIGN CODES 4
3. TENSILE PARAMETERS OF MODERN STRUCTURAL STEELS 4
3.1 General Aspects of Steel Processing 43.2 Relationships Between Y/T and Other Parameters 53.3 Influence of Microstructure on Y/T 8
4. STRUCTURAL SIGNIFICANCE OF YIELD/TENSILE RATIO 8
4.1 Influence of Cracks 84.2 Buildings and Bridges 94.3 Pressure Vessels 104.4 Tubular Joints 114.5 Pipelines 11
5. TREATMENT OF YIELD/TENSILE RATIO IN ASSESSMENT CODES 12
5.1 Failure Assessment Diagram (FAD) Approaches 125.2 The Engineering Treatment Model 145.3 Influence of Y/T on Crack Driving Force Predictions 15
6. CONCLUSIONS 15
7. FUTURE WORK 17
REFERENCES 17
TABLES 20
FIGURES F1
BRITE-EURAM SINTAP S454-1 BRPR-CT95-0024Contribution to BE95-1426 Task 2 Sub-Task 2.1 30/8/96 CONFIDENTIAL
3
THE SIGNIFICANCE OF THE YIELD STRESS/TENSILE STRESS RATIO TO STRUCTURAL INTEGRITY
British Steel plc
1. INTRODUCTION
1.1 Background
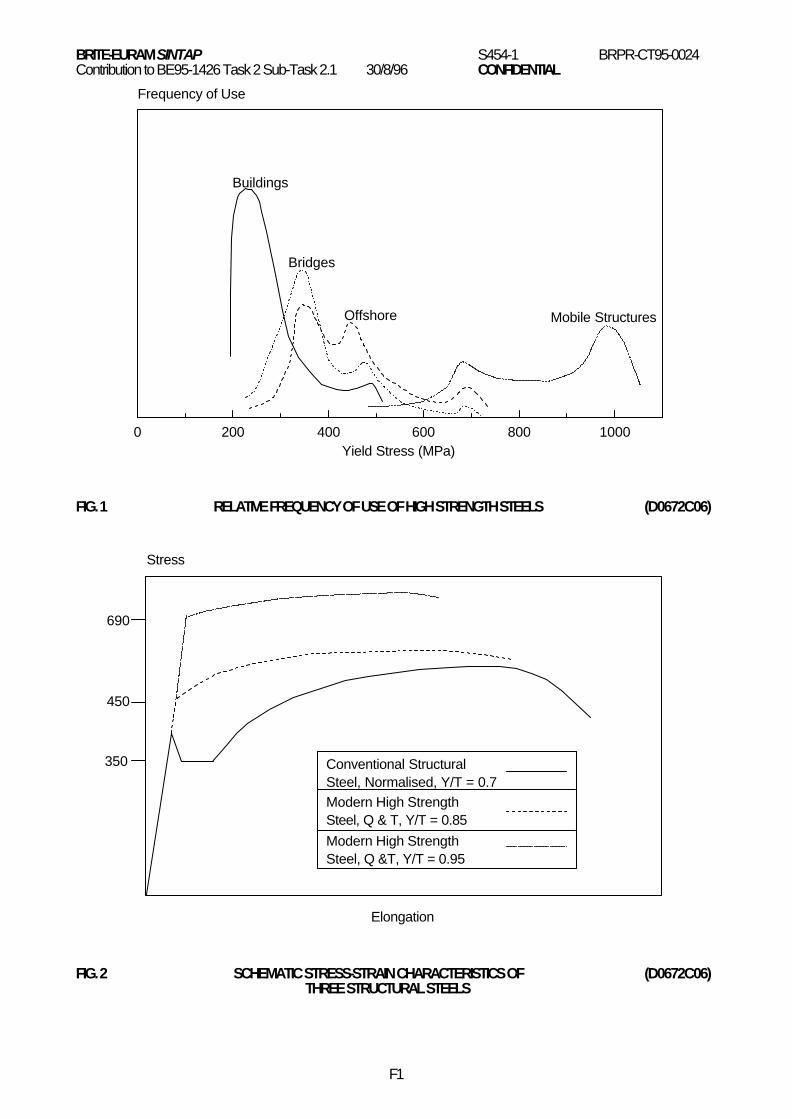
One of the principal objectives of many modern steel structures is the optimisation of useful weight by increasing thestrength of the material, thereby improving the economical efficiency of the design. In addition, some types ofstructures can only be realised through lightweight design either due to the limitations in methods of installation, orthe necessity for mobility. Despite the fact that many designers are now beginning to appreciate the advantages inusing high strength steels (HSS), the full exploitation of the potential for such steels remains largely unrealised. Inthe current context, the term 'high strength steel' is used for steels of yield stress 450 MPa and above. A qualitativeindication of the use of such steels(1) is shown in Fig. 1. The percentage of such HSS in use in offshore fixed steelstructures has increased from 8% in 1985 to 40% in 1995(2).
One of the principal obstacles to the increased use of HSS are the severe restrictions placed on them in designcodes. Of these, the yield stress/ultimate tensile stress (Y/T) ratio limits are particularly restrictive and severely limitthe advantages to be gained by using HSS. One of the principal driving forces leading to the introduction of suchlimits is the lack of clearly defined guidance on the influence of the Y/T ratio. Hence, quantification of the effect of Y/Tratio on structural behaviour is currently lacking leading to subsequent reduced user confidence in higher strengthsteels. One of the reasons for current limitations is the often wrongly perceived significance of Y/T ratio. A low Y/Tratio (typically <0.7) has been traditionally regarded as providing a safety margin against failure by plastic collapse orfracture in the post-yield area.
Improvements in production process and new developments in alloy compositions have led to a new generation ofhigh performance HSS produced by the TMCR, AC or Q&T route. Such steels, with yield strengths up to 1000 N/mm2
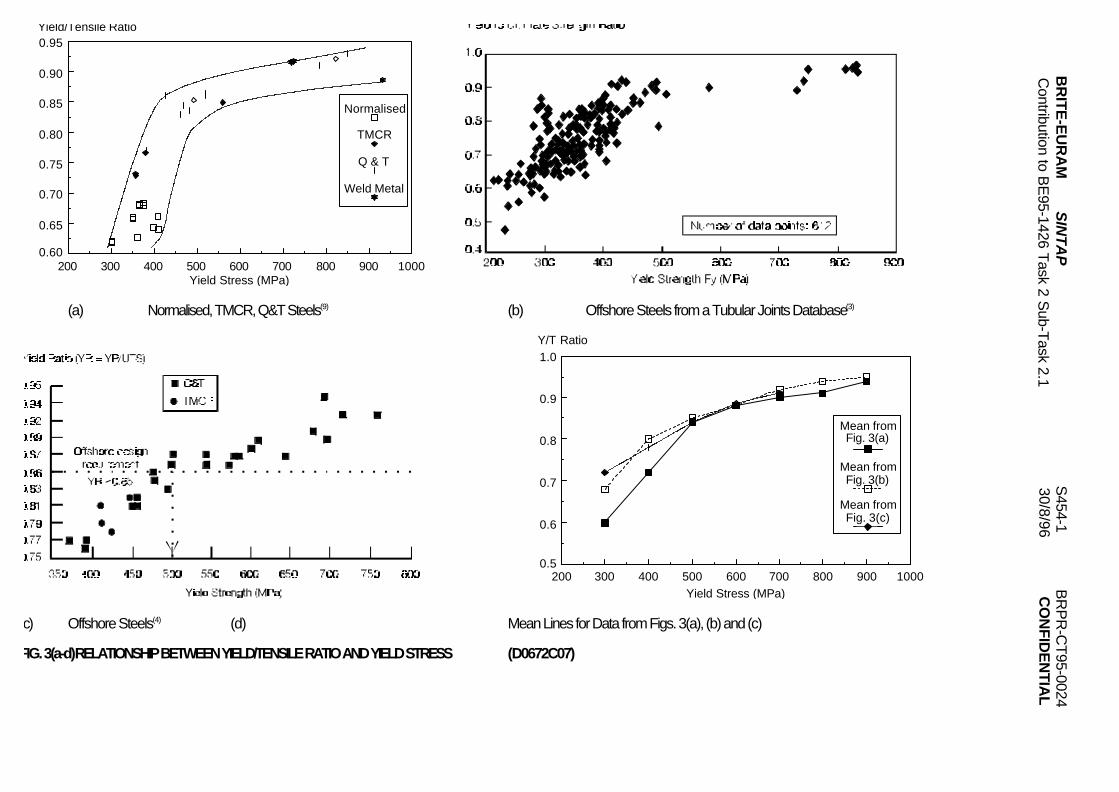
have Y/T ratios in the range 0.8 to 0.95, compared to 0.5 to 0.7 for conventional normalised steels. Schematic stress-strain curves of a number of different steels are shown in Fig. 2. The reason for this is that modern compositions andprocessing routes have had less effect on the ultimate tensile strength than on impeding the movement ofdislocations which in turn governs the yield stress. Consequently, the Y/T ratio is higher for modern steels. Thetypical relationships between yield strength and Y/T ratio are shown in Fig. 3 from different sources(3,4). Since a lowY/T ratio has formerly been considered as providing a high capacity for strain hardening, and a safe margin againstfracture, concern has been expressed over the capacity of modern high strength grades to give reliable behaviour inservice. A clear assessment of the role of Y/T ratio on the accuracy of the outcome of defect assessment proceduresis therefore required in order to revive the current interest of the construction industry in HSS. A number of studies areeither planned or underway which aim to clarify the situation of Y/T ratio in steel design codes. However, these do notaddress the treatment of Y/T ratio effects in defect assessment procedures.
1.2 Purpose of Review
The purpose of this review is to establish the current state of knowledge on the effects that the Y/T ratio has on themechanical/fracture behaviour of steels, from the published literature. The process routes and behaviour of HSS areassessed and the relationships that exist between tensile parameters highlighted. The treatment of Y/T ratio inassessment codes is also reviewed and the limitations outlined. Finally, areas where knowledge is lacking areidentified and suggestions for further work made; these will then be included in Task 2 of the SINTAP Project.
2. TREATMENT OF YIELD/TENSILE RATIO IN DESIGN CODES
In conventional structural design the working stress is usually taken as a proportion of the yield stress; typical valuesare 60% YS in normal loading and up to 80% in severe loading(4). The Y/T ratio is largely irrelevant for such elasticcases. More recently, structures have been designed using plastic design concepts whereby the ability of thestructure to yield and redistribute load without catastrophic failure is required. In such cases the post-yield behaviourof the steel assumes an increasing importance.
In engineering terms the parameter selected to idealise the ability to withstand plastic loading is the Y/T ratio. Thisparameter provides a basic measure of the capacity for strain hardening of the material, it is not the Y/T ratio per sewhich is the governing factor but it is readily measurable from information contained in a steel test certificate and can
BRITE-EURAM SINTAP S454-1 BRPR-CT95-0024Contribution to BE95-1426 Task 2 Sub-Task 2.1 30/8/96 CONFIDENTIAL
4
be related to the strain hardening exponent (n), the exact relationship between Y/T, n and other tensile parameters isdiscussed later, suffice to say at this stage that n decreases as Y/T increases. To this end various restrictions wereintroduced to ensure adequate plastic deformation capacity. These include upper limits to Y/T, design stressexpressed as a limit of UTS, a given % of uniform elongation and a given length of yield plateau.
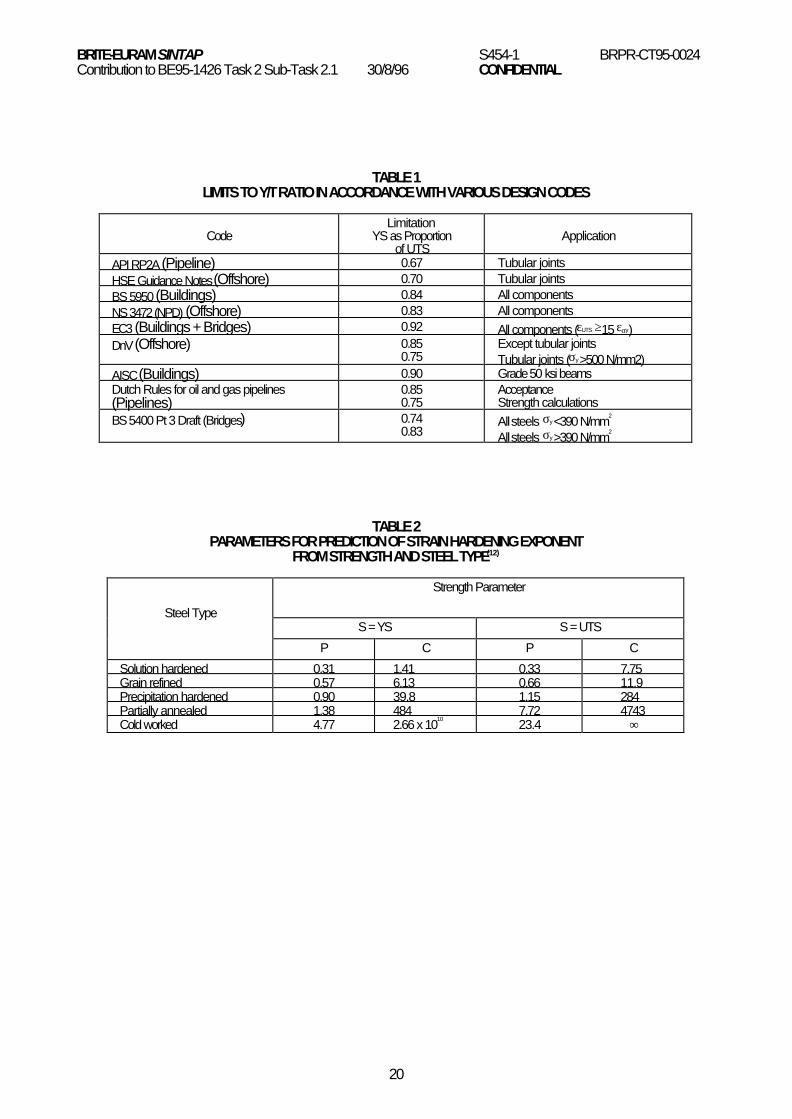
The first limit on Y/T was introduced in the 1960s(5) for tubular joints. The requirement was that Y/T must be less than0.67. Although this empirical requirement is now known to be too severe and the original dataset incomplete(4), it hasremained the limiting value in one design code. Other codes have limiting Y/T ratios up to 0.90 as shown in Table 1.It has been recommended that all codes with maximum allowed Y/T ratios of 0.67 or 0.70 should be raised to at least0.8(6). In addition, in the design code for tubular joints, the maximum assumed capacity is taken as 0.67 UTS whenY/T >0.67. In such a case a 50% increase in strength only gives an allowed increase in design capacity of 10%.
Clearly such limits are unnecessarily restrictive for many modern steels which although having high Y/T ratios canalso exhibit high toughness and extensive elongation before fracture. Although the Y/T ratio is an indication it shouldnot be used in isolation. Clearly the definition of a steel's performance solely in terms of Y/T without reference tostrain hardening exponent (n) is an over simplification. In Fig. 3, a TMCR steel (YS ≈400 N/mm2) a Q+T steel (YS≈500 N/mm2) and a Q+T steel (YS ≈800 N/mm2) have similar Y/T ratios but widely differing strain hardeningexponents. To treat all three steels in a similar way, as would be the case using Y/T as the parameter, would beoversimplistic. It is necessary to consider Y/T, strain hardening and elongation parameters to gain a fullunderstanding of these steels and to treat them correctly in design codes and structural integrity assessment codes.
3. TENSILE PARAMETERS OF MODERN STRUCTURAL STEELS
3.1 General Aspects of Steel Processing
For many modern structures a reduction in dead weight is required. The steel industry has taken account of thisdesire for lightweight design by developing high strength weldable structural steels with minimum yield strengths upto 1000 N/mm2.
To achieve minimum yield strengths up to 460 N/mm2, use is made of alloyed and unalloyed low carbon steels. Bycontrolling the temperature and deformation time, normalising rolled steel can be produced. The material conditionachieved is equivalent to that following a normalising annealing and it is also possible to keep within the desiredmechanical property values after subsequent normalising. If the final rolling takes place in a temperature range inwhich the austenite no longer recrystallises then it is termed thermomechanical controlled rolling (TMCR). In thiscase material properties are produced which cannot be achieved by heat treatment alone. TMCR attains a goodcombination of strength and toughness properties and thin plates with higher minimum yield strengths up toapproximately 700 N/mm2 can be produced by TMCR alloyed steels.
The effects of TMCR and normalising rolling can be intensified by means of follow-on accelerated controlled cooling.Depending upon the cooling rate and cooling stop temperature, the term used is accelerated controlled cooling ordirect quenching, after which tempering can also be performed if necessary. These steels meet the highest propertyrequirements, with minimum yield strengths up to 960 N/mm2 possible, even when greater plate thicknesses areinvolved. Accelerated controlled cooling increases the yield strength without significantly impairing the toughnessand this effect can be exploited in order to reduce the alloy content, i.e. with a lower carbon equivalent. Theweldability, especially of thick plates, is consequently improved. For higher strengths still use is made of quenchingand tempering. Tempering conditions can be adjusted to meet the required balance of strength and toughness.Yield strengths in excess of 1000 N/mm2 can be achieved.
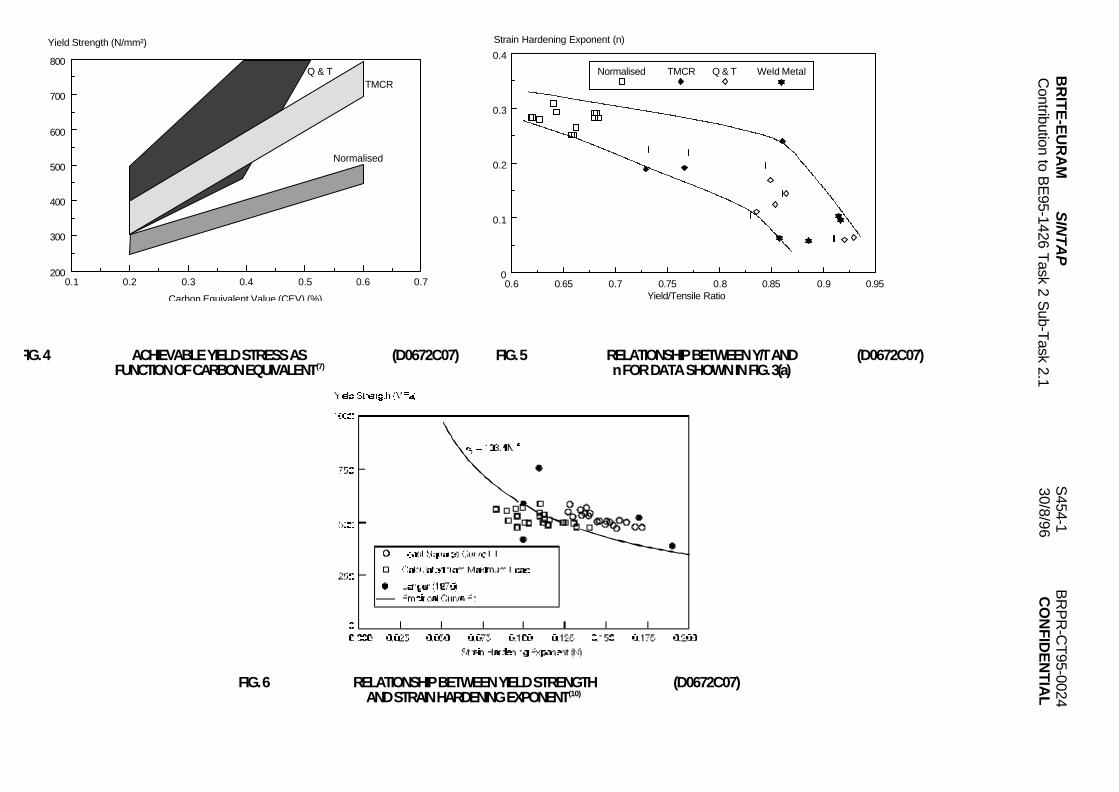
Figure 4 depicts the relationship between the carbon equivalent and yield strength of plates produced by the differentmethods(7). Accelerated controlled cooling permits a carbon equivalent reduction of 0.05% compared with TMCR andat least 0.1% compared with normalising for the same strength level.
The combination of strength and toughness in modern processed steels is primarily achieved by promoting a finegrain size. In non-Q+T steels this is achieved by a fine ferrite-pearlite microstructure with, in the case of the TMCRsteels, a network of dislocations, while in Q+T steels it is provided by the quenched and tempered bainitic matrix withadditions of alloying elements to improve hardenability. The strain hardening exponent, n, which is typically inverselyproportional to Y/T ratio, decreases with increasing levels of substitutional solutes, with decreasing grain size andwith increasing volume fractions of second phase.
3.2 Relationships Between Y/T and Other Parameters
BRITE-EURAM SINTAP S454-1 BRPR-CT95-0024Contribution to BE95-1426 Task 2 Sub-Task 2.1 30/8/96 CONFIDENTIAL
5
3.2.1 Choice of Parameter
Because the shape of the stress-strain curve varies for different steels, Fig. 2, several related effects may be impliedfrom the Y/T ratio. Such properties include:
• Yield/tensile difference• Strain hardening exponent• The length of the yield plateau (if one exists)• Local elongation (elongation in the necking region)• Uniform elongation (total elongation less local elongation)• Elongation at UTS
The reported mechanical properties for plate material are usually limited to the yield point, the ultimate tensilestrength, the percentage elongation and reduction in area. This information alone provides little indication of theobtainable deformation capacity of the material in the presence of a defect. However, a careful analysis of the shapeof the stress-strain curve in its plastic deformation stage may give a better estimation of such behaviour. Generally, itis found that for increasing yield strengths, both the yield point elongation and the strain hardening rate decrease. ForHSS, the rate of strain hardening, n, is not constant over the full range of uniform plastic strain, its value is initiallylarge but diminishes rapidly after a small amount of plastic straining. In these cases, two different values of n shouldbe assigned. However, the determination of the strain hardening rate involves a relatively elaborate testing procedureand it may be more convenient to approximate its value using the all inclusive Y/T ratio(8).
In addition, it is not only the shape of the stress-strain curve beyond yield which is important but also the presence orotherwise of a Lüders Plateau (yield point elongation). Yield point elongation is desirable in facilitating early relief ofconstraint at the crack tip and thus on the crack tip opening(8). Alternatively, unless the material is truly brittle, strainhardening at the crack tip may cause remote yielding after the yield stress is reached in the cracked section. A lowstrain hardening rate (or a high Y/T ratio) will make it difficult to transfer part of the applied load or plastic deformationto the remote plate sections.
3.2.2 Estimates of Strain Hardening Exponent
Since the Y/T ratio is easily determined but the strain hardening rate (n) is the actual parameter determiningperformance, a relationship between such parameters is useful. A relationship between Y/T and n is shown in Fig. 5for a number of normalised, TMCR and quenched and tempered structural steel plates(9).
Barsom and Rolfe have derived an estimation scheme for determining the strain hardening exponent from yieldstress, described in Ref. 10. The n value is determined by assuming a continuous true stress-strain curve and takingtrue strain at maximum load to be equal to n. The correlation is given below.
n = ( 103.4σy
)43
(MPa) ... (1)
where the stress-strain equation is given by:
εεo = σ
σy + α( σσy
)1n ε > ε o (α + 1) ... (2)
α= nεoe
σyσu
1n
... (3)
Denys et al(10) have plotted data for X60 linepipe material together with other data, shown in comparison with theBarsom and Rolfe correlation in Fig. 6. It is claimed that the correlation will underestimate the length of the LüdersPlateau. The true strain at UTS under uniaxial tension is equal to n(11), a feature which facilitates the estimation of n.Figure 7 shows true and engineering strain at UTS v n and shows a reasonable correlation independent of whethertrue or engineering strain is used.
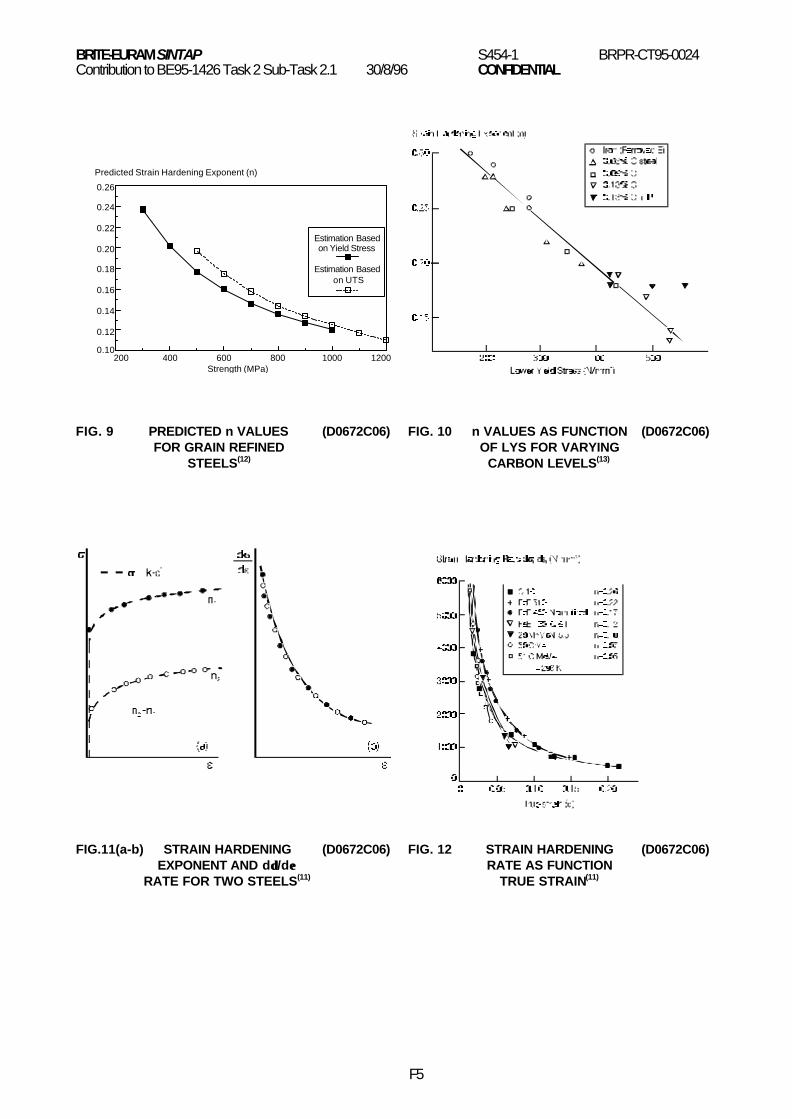
The relationships between n and YS and n and UTS have been investigated for a number of strengtheningmechanisms(12), Figs. 8(a-b). The relationship is given by:
BRITE-EURAM SINTAP S454-1 BRPR-CT95-0024Contribution to BE95-1426 Task 2 Sub-Task 2.1 30/8/96 CONFIDENTIAL
6
n SP = C ... (4)
where S is yield stress or UTS and P and C are constants depending on strengthening mechanism and strengthparameter as shown in Table 2. For grain refined and solid solution strengthened steels the derived relationshipbetween n and YS is as shown in Fig. 9. The constants in Table 2 show that for a given strength level solid solutionstrengthening gives the most ductile steels followed by grain refining, precipitation strengthening, partial annealingand cold working. The correlation coefficients are higher for YS than for UTS in all cases.
In deriving relationships between Y/T and n it is noted in Ref. 13 that for a given steel composition Y/T is a function ofn but YS and n are independent of carbon content up to ~0.15% whereas UTS is strongly influenced by carbon. Theconsequence is that Y/T and n have different relationships for different carbon levels and strengthening mechanismas noted in Ref. 13. A good relationship was obtained between n and LYS for steels with carbon content up to 0.13%,Fig. 10(13).
Some suggest that the choice of n as parameter for determining strain hardening is inappropriate(11). For twomaterials with dσ/dε the same but with different yield strengths the calculated value of n will be higher for the loweryield stress material, Fig. 11. The ratio dσ/dε , plotted as a function of the strain, Fig. 12, shows a family of curveswhich lie on a very similar line despite the fact that n varies from 0.05 to 0.26. The exponent n actually corresponds tothe true strain at UTS, εu. Since increasing strength gives lower εu values it follows that n will also decrease.
A parameter also often used is N where:
N = 1n ... (5)
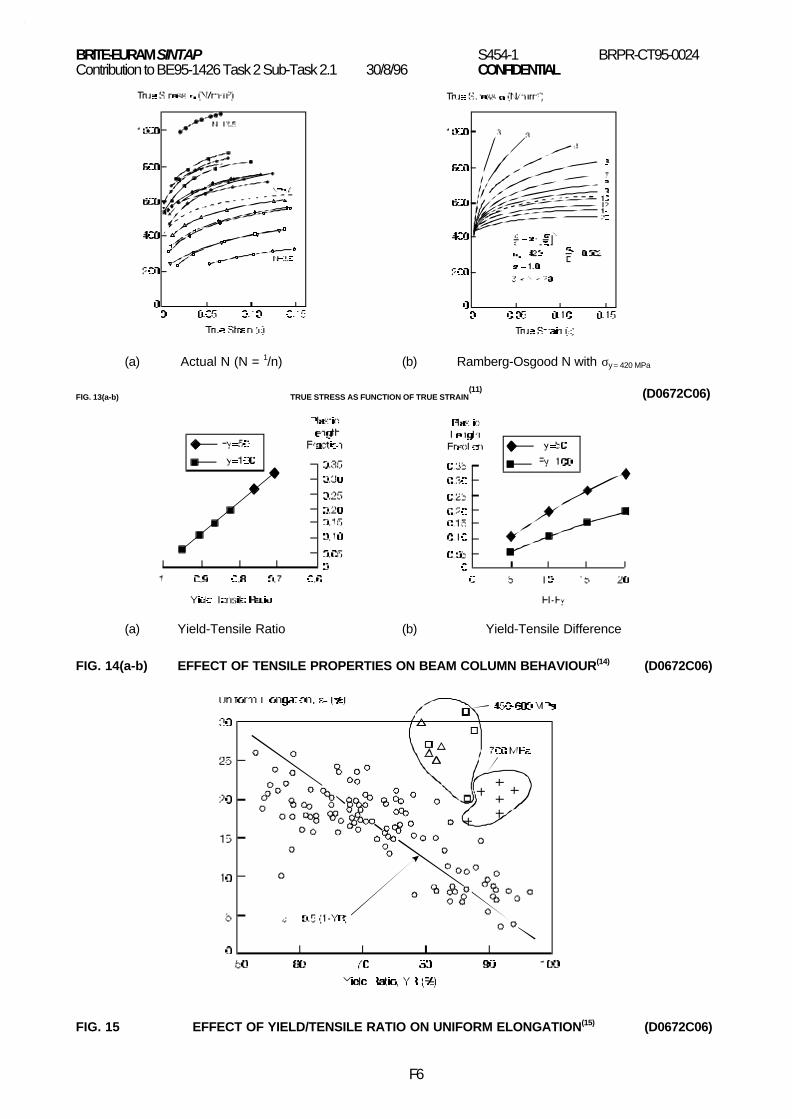
N is used particularly in fracture mechanics, in the small scale yielding regime the contour and size of the plastic zonecan be determined as a function of N while in large scale yielding the relationship between J-integral and CTODdepends not only on geometry but also on N. However, N depends on the shape of the stress-strain curve and theyield stress. Figure 13(a) shows σ-ε curves for a number of steels with N between 3.6 and 13.5 according to theRamberg-Osgood law. The parameter dσ/dε is nearly the same for all these steels. However, varying N but withconstant yield stress produces a very different set of curves, Fig. 13(b). Hence, in Fig. 13(a) the difference in N is duelargely to the difference in yield stress of the steels whereas in Fig. 13(b) the difference in the N values is due solely tothe shape of the curves beyond yield. The two factors must be separated if the real material post-yield behaviour is tobe quantified.
3.2.3 Relationship Between Y/T and Other Parameters
Some have questioned whether structural behaviour can be better viewed in terms of yield/tensile difference ratherthan Y/T(14). As well as Y/T, the elongation capacity of steel is an important factor. This generally decreases as tensilestrength increases although such generalisations do not take account of the fact that modern steels with mixedmicrostructures can give higher elongation values for a given tensile strength. The rotation capacity of beam-columnconnections, expressed as the plastic length fraction, was determined for a number of joints made in steels of varyingtensile properties. The results are shown in Fig. 14, demonstrating that while Y/T difference can be used, Y/T is amore fundamental and continuous variable.
Separation of the total elongation in the tensile test into local elongation (in the region that necks) and uniformelongation (in the remainder of the specimen) has also been used to investigate sensitivity to Y/T of 1970's steels(15).The data are shown in Fig. 15 together with more recent data for modern steels in the YS range 450-700 MPa. Clearlythe 1970's data show that older steels
BRITE-EURAM SINTAP S454-1 BRPR-CT95-0024Contribution to BE95-1426 Task 2 Sub-Task 2.1 30/8/96 CONFIDENTIAL
7
had a lower elongation for a given Y/T value and that modern steels cannot be described by this data set.
3.3 Influence of Microstructure on Y/T
The behaviour of modern steels is different to their older counterparts due to the processing and alloyingdevelopments which have led to microstructural changes. Such features include:
• Overall cleaner chemistry (reduced CEV)• Finer grain size• Reduced proportion of second phase
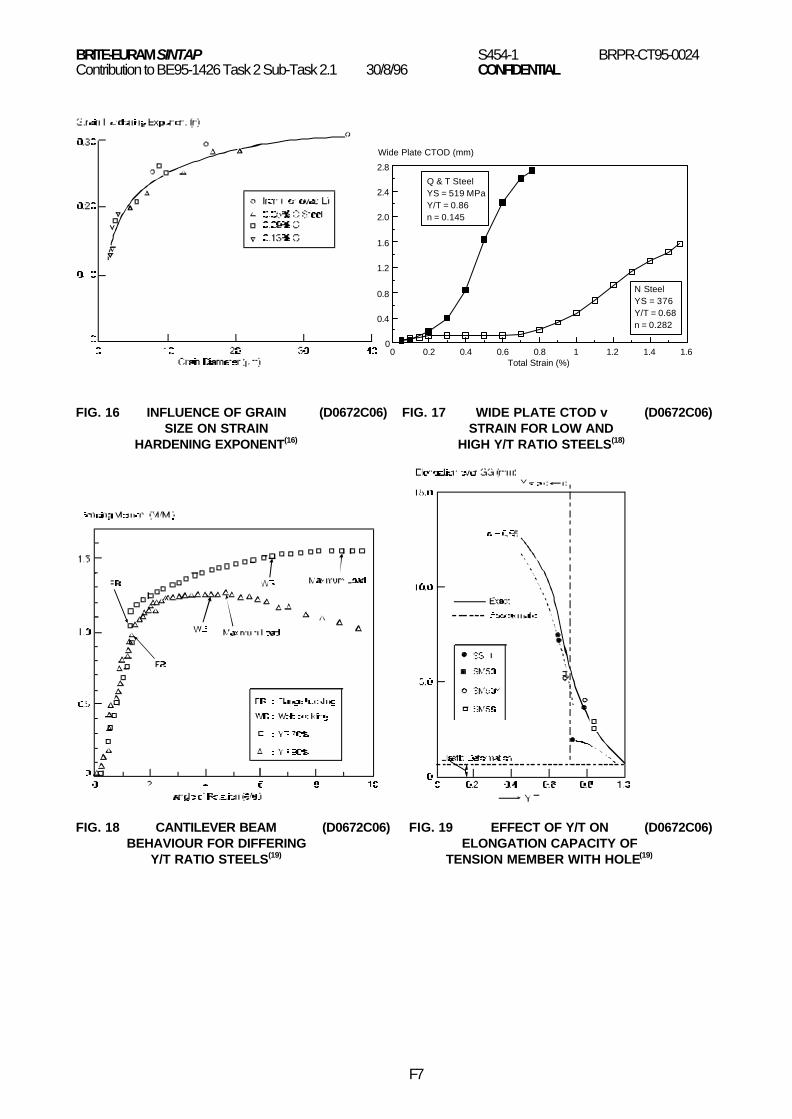
For steels showing only one line of single gradient in the log σ-log ε plot, the value of n has been found to beempirically related to grain size(16), Fig. 16, and independent of carbon content.
n = 5
10+ d− 12 (d in mm) ... (6)
There is a rapid reduction in n for d less than 10 µm. The strength coefficient in the expression
σ = Kε n ... (7)
is strongly influenced by carbon content and grain size, but insufficient data exist for the grain size correlation.However, the general relationship linking K to grain size has been expressed as
K = A + Bd− 12 ... (8)
where A and B are constants for a particular steel. K is linearly dependent on carbon content, the ratio Y/T increasesas grain size decreases since grain size has a much larger influence on the yield stress than the UTS.
4. STRUCTURAL SIGNIFICANCE OF YIELD/TENSILE RATIO
4.1 Influence of Cracks
The influence of the strain hardening exponent (n) on fracture propagation depends on the fracture mode. Generally,the energy required for ductile fracture increases with increasing n(17). At temperatures where the material is relativelyductile and the development of a critical strain is required for fracture, high strain hardening increases the energyrequired to produce failure. In the transition regime and below, however, a critical stress law is valid and a low rate ofwork hardening may enhance the resistance to crack propagation(13).
The Y/T ratio and n values also affect the spread of yielding in tension loaded plates(8). The presence of cracksmodifies the shape of the stress-strain curve such that interactions between applied stress, crack depth and n dictatethe plate behaviour. For deep cracks the strain hardening may not be sufficient to enable gross section yielding,leading to confinement of yielding to the cracked section and in the presence of a macroscopic crack, the shape of thestress-strain curve will be modified. During plastic deformation a reduction in both the yield point elongation and thestrain hardening rate will occur, while for long cracks the yield point elongation can be completely suppressed. Thestress-strain response will gradually change with increasing crack size.
For a material with little or no distinct yield point elongation and which strain hardness only, the spread of yield occursessentially as symmetrical zones in a direction of about 45° to the tensile axis on either side of the crack axis. Thedirection of these yielding bands is dependent on the material's strain hardening response and the length of thecrack. For a material of high initial strain hardening (or with a low Y/T ratio) the orientation of the yielded zones willeffectively approach the direction of 45° to the tensile axis, whereas a low strain hardening rate (or a high Y/T ratio) willproduce plastic zones which have an orientation closer to the crack axis.
Relationships between crack opening and strain in cracked plates for a material with high work hardening and a yieldplateau and a material with low work hardening and no yield plateau are shown in Fig. 17(18). Experimental workconfirms the trend, demonstrating that higher crack opening at a given strain will result from a material of low workhardening rate.
BRITE-EURAM SINTAP S454-1 BRPR-CT95-0024Contribution to BE95-1426 Task 2 Sub-Task 2.1 30/8/96 CONFIDENTIAL
8
4.2 Buildings and Bridges
4.2.1 General Trend
The use of higher strength steels in buildings and bridges is only advantageous when the design is not deflection-limited (since the stiffness and hence deflection of steel is relatively independent of yield strength). The main driver isthe move towards taller buildings and longer span bridges. Y/T is important in such structures when:
(i) Plastic design is used(ii) The ability to yield when the ultimate limit state is approached(iii) The structure must be earthquake resistant
Most of the recent work addressing the structural significance of Y/T ratio in bridges and buildings has been in Japanlargely due to the necessity to withstand severe earthquakes. Such conditions require typically connection rotationcapacities of seven times that required at yield moment, while general plastic design for bridges and buildings in theUSA requires a capacity of three.
4.2.2 Bending Members
Studies on bending members(19) indicate that the rotation capacity tends to decrease with increasing yield/tensileratio, and that it can affect the final failure mode. However, all applications do not require the same level of rotationcapacity, and it is not necessary to maximise the rotation capacity for each one. If required levels are established,analytical and experimental studies can determine the maximum yield/tensile ratio that would provide that capacity.Also the mode of failure can be controlled. For example, flange width-to-thickness ratios and web depth-to-thicknessratios can be selected that will allow a member to reach its required strength and rotation level, but that will ensureplastic local buckling before reaching the strain required for tension flange rupture.
4.2.3 Compression Members
Available data on columns(20) suggests that, provided the stress-strain curve is not overly rounded, the strength ofcolumns with yield/tensile ratios up to about 0.95 can be reasonably predicted with the present relationships that areused for other steels. The same conclusion holds for local buckling strength for stresses up to the yield point.However, if a short compression member of given proportions is compressed beyond the yield point level, themaximum average stress that can be reached in proportion to its yield strength, tends to increase with decreasingyield/tensile ratios of the steel. However, if such post-yield behaviour is needed, it can be realised by decreasingwidth-to-thickness ratios of flange and web elements.
4.2.4 Tension Members
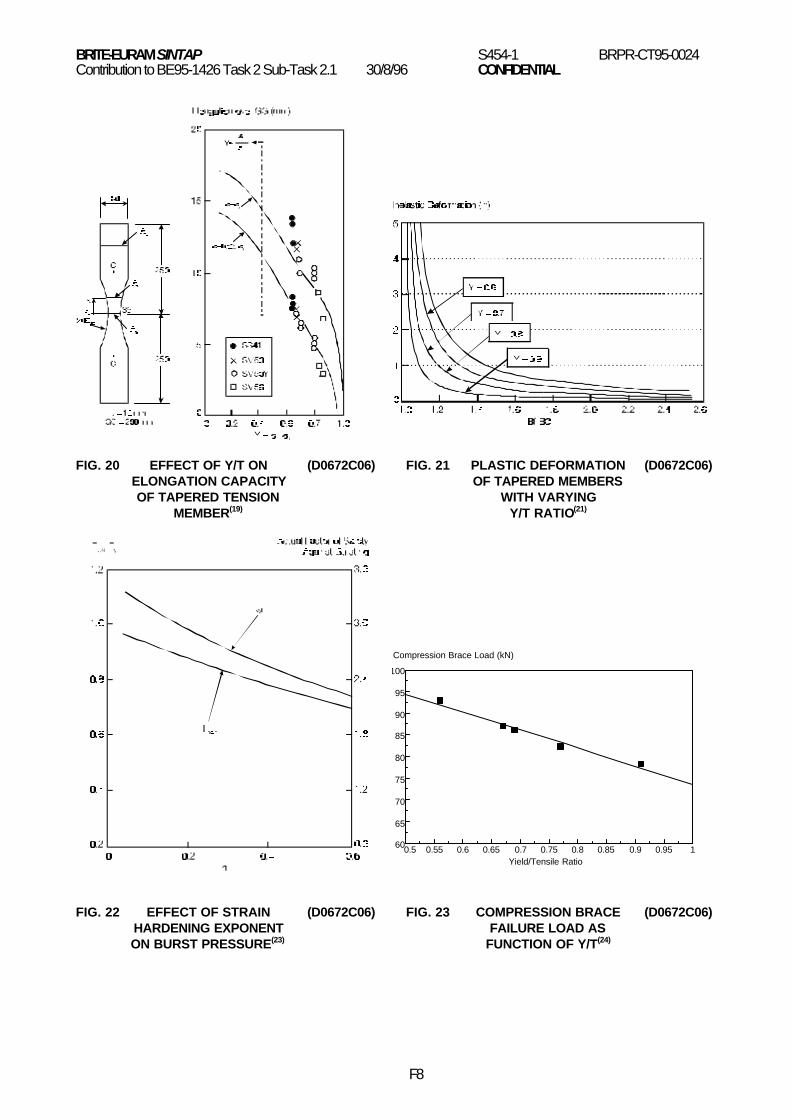
For bolted tension members, if it is required that gross section yielding controls failure rather than net section rupture,greater yield/tensile ratios require greater ratios of net-to-gross section area. However, most specifications do notrequire that gross section yielding control the design. For bolted members of the same geometry and bolt pattern theY/T ratio determines if yielding in the gross area occurs before fracture of the net area(21). In addition, the bolt holescause stress concentrations leading to early yielding. High Y/T ratio steels usually reach yield load when uniformlystressed but may fail to do so in the presence of a hole. Figure 19 shows the effect of Y/T on achievable elongation ina 500 mm long, 80 mm tension member with a 22 mm diameter hole, clearly showing a reduced elongation forincreasing Y/T ratio(19). Results for tapered members(19), Fig. 20, show a rapidly reducing elongation capacity for Y/T≥0.85, although increasing ratio of net width:gross width for a tapered member gives reduced plastic capacityregardless of Y/T ratio(21), Fig. 21.
4.2.5 Industry Experience
The required deformation capability depends on the application. Cold formed structural members fabricated fromsteels with yield/tensile ratios up to 0.93 have been used successfully for many years. Indeed, members withyield/tensile ratios up to 1.00 have performed adequately in tests and have been used for a limited range ofapplications(22).
The high strength structural steel, A514, has performed well in bridge and building applications, even though theyield/tensile ratio based on measured properties range up to 0.93 or 0.95. Thus, provided a reasonable level of total
BRITE-EURAM SINTAP S454-1 BRPR-CT95-0024Contribution to BE95-1426 Task 2 Sub-Task 2.1 30/8/96 CONFIDENTIAL
9
ductility is maintained, steels with yield/tensile ratios up to about that level can be effectively used in most designapplications(22).
For more demanding applications such as seismic design, lower yield/tensile ratios would be desirable. Japanesesteels developed for seismic applications have a minimum yield/tensile ratio of 0.80 for yield strengths from 50 to65 ksi, and 0.85 for a 100 ksi yield strength steel. However, studies have not specifically shown that such ratios arethe highest values that might be acceptable for the application.
4.3 Pressure Vessels
The effects of strain hardening and yield/tensile ratio on the burst strength of pressure vessels has been studied(23).This was aimed at more effective utilisation of the yield strength of high strength steels. Based on plastic instabilitythe following equation was derived for cylindrical vessels.
PB = σu F ln W ... (9)
where PB = burst pressureσu = UTSF = correction factorW = OD/ID
F is given by
BRITE-EURAM SINTAP S454-1 BRPR-CT95-0024Contribution to BE95-1426 Task 2 Sub-Task 2.1 30/8/96 CONFIDENTIAL
10
F = ( 0.25n+0.227 )( e
n )n... (10)
where n = strain hardening exponent and e is the log base (n = εUTS as shown previously).
Figure 22 shows the factor F for cylindrical and spherical vessels as a function of n. The burst pressure decreasesas εUTS, and therefore n, increase. Higher strength steels therefore tend to burst at a higher proportion of their tensilestrength than lower strength steels. The trend has also been experimentally confirmed. One feature also pointed outis that plastic strain concentration at sharp geometries is higher in a low work hardening steel than a high workhardening one. More attention must therefore be paid to geometrical effects in higher strength steels.
4.4 Tubular Joints
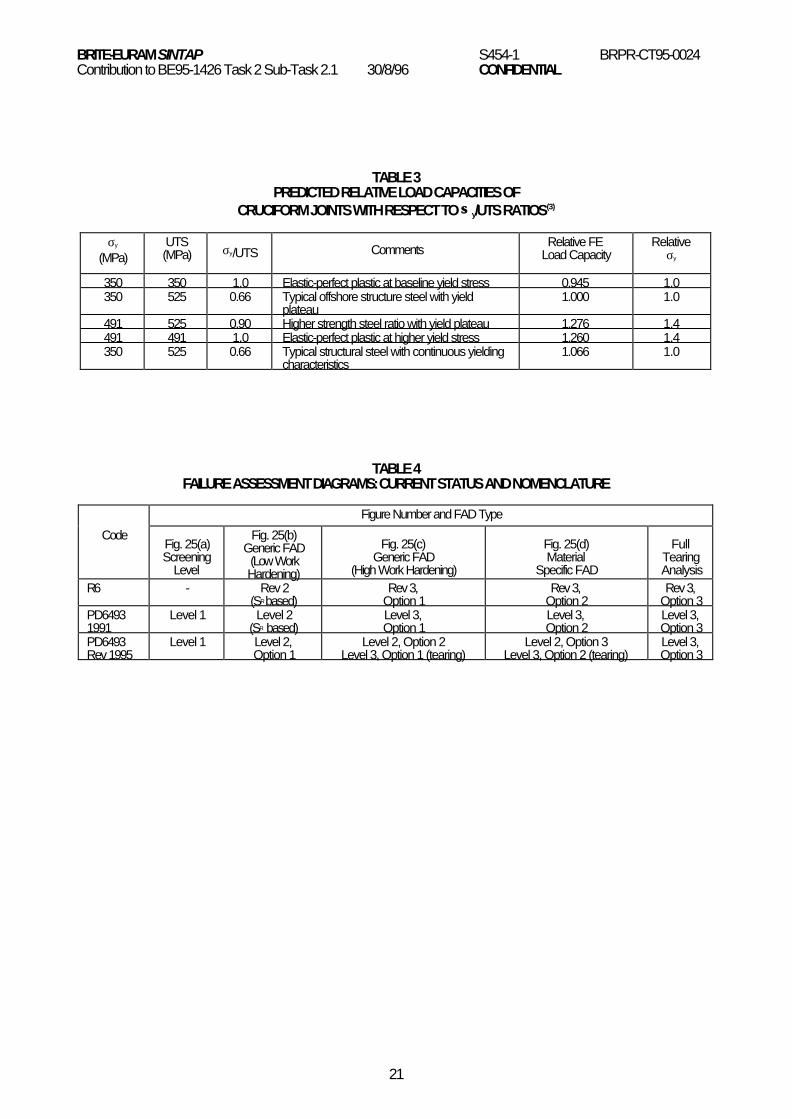
Multiplanar tubular joints are frequently used in tubular structures such as offshore jackets, towers and long spanroofs. The effect of Y/T ratio on the static strength of tubular joints is complicated by geometrical factors such asplane of bending, joint type (K, cruciform etc.) and ratio of chord to brace inner and outer diameters. For K-jointsloaded by the chord, increasing Y/T from 0.55 to 0.91 gave a 20% reduction in load capacity(24) (normalised for yieldstress differences), Fig. 23. Finite element studies of capacities of X-joints with five assumed material stress-strainlaws(3), has demonstrated a number of features as shown in Table 3. In particular, for a constant yield stress of350 MPa, decreasing the Y/T ratio from 1.0 to 0.66 enhanced the ultimate joint capacity by only 6%. A similar analysiswith 450 MPa yield stress shows only a 1% capacity enhancement. The joint capacity was also found not to increaselinearly with yield stress since geometrical factors contribute to the overall behaviour. However, where a yield plateauprecedes strain hardening, the capacity is 7% less than that associated with continuous yielding. Both yield stressand Y/T need to be considered in assessing theoretical capacities of tubular joints. However, tentative guidance issuggested in Ref. 3 that a restriction to Y/T ≤0.85 would still be safe based on FE and experimental work. A value of0.8 is quoted elsewhere(6).
4.5 Pipelines
Welded pipelines are one of the few structures which are subjected to plastic strains during their installation, forexample laying of sub-sea pipelines (design strain ≈0.8%) or soil movement in onshore pipelines (design strain≈0.5%). The post-yield fracture behaviour of the steel is therefore particularly important in linepipe steels.
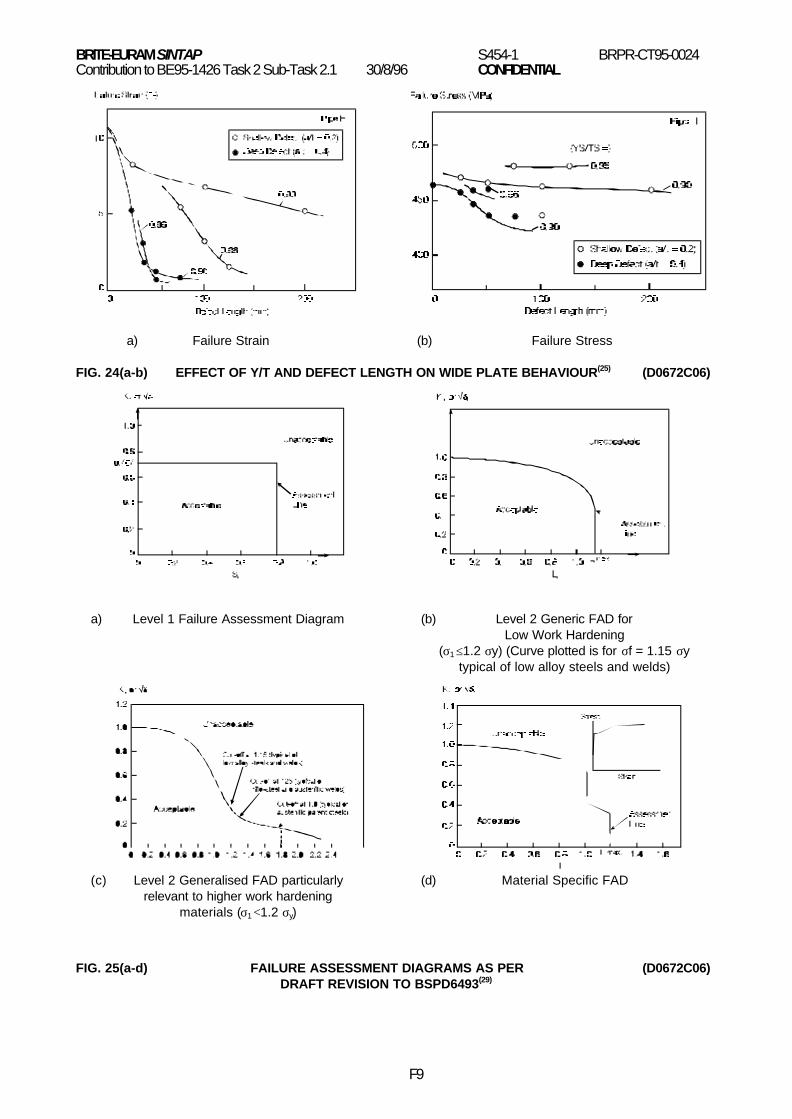
Deformation capacity of linepipe without defects shows a steadily decreasing circumferential failure strain as Y/Tincreases(25), although even at Y/T = 0.95 the minimum failure strain is still ~2%. In the presence of defects, pressurebearing capacity reduces slightly with Y/T up to 0.91, Fig. 24(a) and (b), although the reduction is not significant.
Generally, work on cracked pipe body specimens has shown the following:
• The effect of increasing defect depth on tolerable defect length is more significant than theincrease in Y/T ratio from 0.80 to 0.90.
• The tolerable defect length for deep defects (above 40% thickness) is relatively little influenced bythe Y/T ratio between 0.85 and 0.95.
• The tolerable defect length for shallow defects (20% thickness) reduces significantly (by 50%) fromY/T = 0.90 to 0.95.
BRITE-EURAM SINTAP S454-1 BRPR-CT95-0024Contribution to BE95-1426 Task 2 Sub-Task 2.1 30/8/96 CONFIDENTIAL
11
Overall, there is therefore little influence of Y/T on defect tolerance in pipelines up to a value of about 0.90.
5. TREATMENT OF YIELD/TENSILE RATIO IN ASSESSMENT CODES
5.1 Failure Assessment Diagram (FAD) Approaches
5.1.1 General
The yield/tensile ratio affects the FAD in a number of ways:
• Shape of FAD• Cut-off level of the FAD• Definition of flow stress of the material
There are four generic FADs in use at present within the framework of R6(26) and BSPD6493(27). These are shown inFig. 25 and are collectively:
• An inherently conservative FAD for use in preliminary screening analyses, Fig. 25(a).
• A generalised FAD, based on either yield stress or flow stress, but not accounting for workhardening, Fig. 25(b).
• A generalised FAD, based on yield stress, and allowing for work hardening, Fig. 25(c).
• A material specific FAD, based on the material's stress-strain response, Fig. 25(d).
Revisions to both R6 and PD6493 have led to the definition of appropriate FADs as detailed in Table 4. The influenceof Y/T ratio on these FADs is discussed in more detail below.
5.1.2 R6 Failure Assessment Diagrams
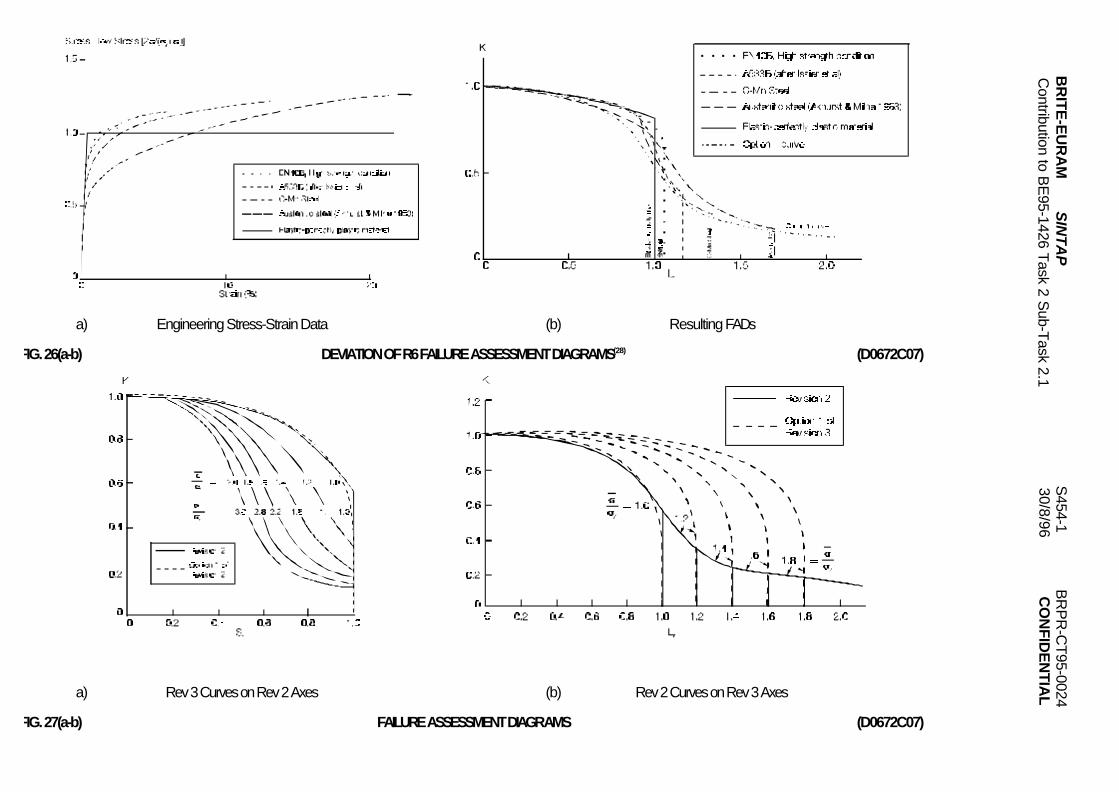
R6 Rev 3 option 1 (generalised) and option 2 (material specific) FADs are shown in Fig. 25(b) and (c) respectively. Acomparison of the two FAD types has been made previously(28) where stress-strain curves of a range of materials,Fig. 26(a), were used to derive option 2 FADs. These option 2 FADs are shown in comparison to the option 1 FAD inFig. 26(b). Care is suggested when using option 1 for materials demonstrating a yield plateau, since for suchmaterials option 2 predicts a sharp drop in the FAD at LR ≈1. It is claimed(28) that this is only a realistic description ofthe tension case. However, pre-cracked specimens in tension do not tend to show yield points and Lüders plateauxirrespective of the presence or otherwise of such features in the stress-strain curve of the conventional tensile test.The practical significance of the yield plateau in real structures therefore needs to be addressed.
The Rev 3 FADs differ from the Rev 2 through the adoption of a plastic collapse parameter based on σy rather than σF,giving respectively LR and SR plastic collapse parameters. The Rev 2 curve is similar to the Rev 3 option 2 curve whenelastic-perfectly plastic behaviour (σf/σy = 1) is demonstrated. Curves corresponding to varying levels of σf/σy can beplotted as Rev 3 curves on Rev 2 axes and vice versa, Fig. 27. When strain hardening capacity is low, assumed to bethe case as σ/σy 1.0V
, there is little difference between the Rev 2 and Rev 3 curves.
BRITE-EURAM SINTAP S454-1 BRPR-CT95-0024Contribution to BE95-1426 Task 2 Sub-Task 2.1 30/8/96 CONFIDENTIAL
12
5.1.3 BSPD6493 Failure Assessment Diagrams
Revisions to BSPD6493 are ongoing and have resulted in reclassification of the FADs as described in Table 4. Thefollowing discussion relates to the draft version of BSPD6493, 1996(29). The principal influence of Y/T ratio is on theselection of FAD at level 2 and the definition of LR cut-off.
For the generalised FADs, material of 'low work hardening', defined as σfσy ≤ 1.2, should be assessed using the level
2 option 1 FAD, Fig.25(b), where:
δr or kr =σyσf Lr
8ο 2 ln sec
π σy
2σfLr
−0.5
... (11)
This is equivalent to the PD6493 1991 level 2 method. Materials with σf >1.2 σy may also be assessed but with σf
limited to 1.2 σy. Rearranging the formula gives the value of Y/T at which the definition of flow stress changes to be0.71. Furthermore, if the material exhibits a yield plateau an LR cut-off of 1.0 is applied meaning that plastic collapseis predicted for stresses above yield. This point needs further considerations since metallurgical factors favouringhigh work hardening rates, deemed advantageous in many respects, also favour the formation of yield plateaux. Inaddition, yield plateaux in real structures may often not occur, or their length is reduced, when a crack is present. Infact, wide plate tests on steels with and without yield plateaux(18) show that those with tend to show a plateau in theCTOD-strain behaviour such that crack opening is shielded due to deformation being concentrated in the plasticstraining of the plate. This is advantageous in minimising the crack opening.
The FAD for high work hardening materials, Fig. 25(c), is recommended for materials where rfry > 1.2, or when Y/T
>0.71. The equation is:
σr or Kr = [1 − 0.14Lr2][0.3 +0.7exp(−0.65Lr
6)] ... (12)
The curve can also be used for low work hardening materials but will provide a lower bound. The Lr cut-off, Lrmax, is
given by
Lrmax = σf
σy ... (13)
The material specific FAD, applicable to all materials, is given by:
δr or Kr = E εrefLr σy
+ Lr3 σy
2Eεref
− 12
... (14)
where Lrmax is as per Equation (13) and ε ref is true strain at a true stress of Lr σy.
The LR cut-offs and the selection of FAD is based on the Y/T ratio indirectly. This is a simplification since previousdata has shown that for Y/T increasing from 0.86 to 0.91 the strain hardening exponent can decrease by a factor of 4.Linking of Y/T with n for different steel classes should clarify such relationships.
The derivation of crack driving force curves using the level 2 option 1 method enables prediction of the relationshipbetween applied stress and resulting crack driving force parameter (K or
BRITE-EURAM SINTAP S454-1 BRPR-CT95-0024Contribution to BE95-1426 Task 2 Sub-Task 2.1 30/8/96 CONFIDENTIAL
13
CTOD). Such predictions can be used to assess structural or wide plate behaviour or to assess the influence ofparameters such as residual stress. Such curves tend to overpredict the crack opening for a given applied stress,which is expected since the method is conservative.
However, a stress-based curve reaches its limit of applicability at stresses ≈σy. This is because the level 2 approachpredicts failure by plastic collapse when SR >1.0 such that the required CTOD to prevent failure tends to infinity. Astrain based approach provides more information on the behaviour of wide plates and structures since these behaveas approximately elastic-perfectly plastic materials with a level stress-strain curve after yield which gives anincreasing CTOD for a constant level of stress. With reference to pipelines, PD6493 has been criticised(10) because itcannot readily estimate straining capacity which is being used increasingly in pipelines and other structures; strain-based plastic collapse solutions would help overcome such limitations.
A further influence of Y/T in PD6493 is at level 3 where the relationship between σΙ and KΙ is dependent on constraintand work hardening. Guidance is given on correction factors for 'low' and 'high' work hardening although thedefinitions of low and high are ambiguous.
5.2 The Engineering Treatment Model
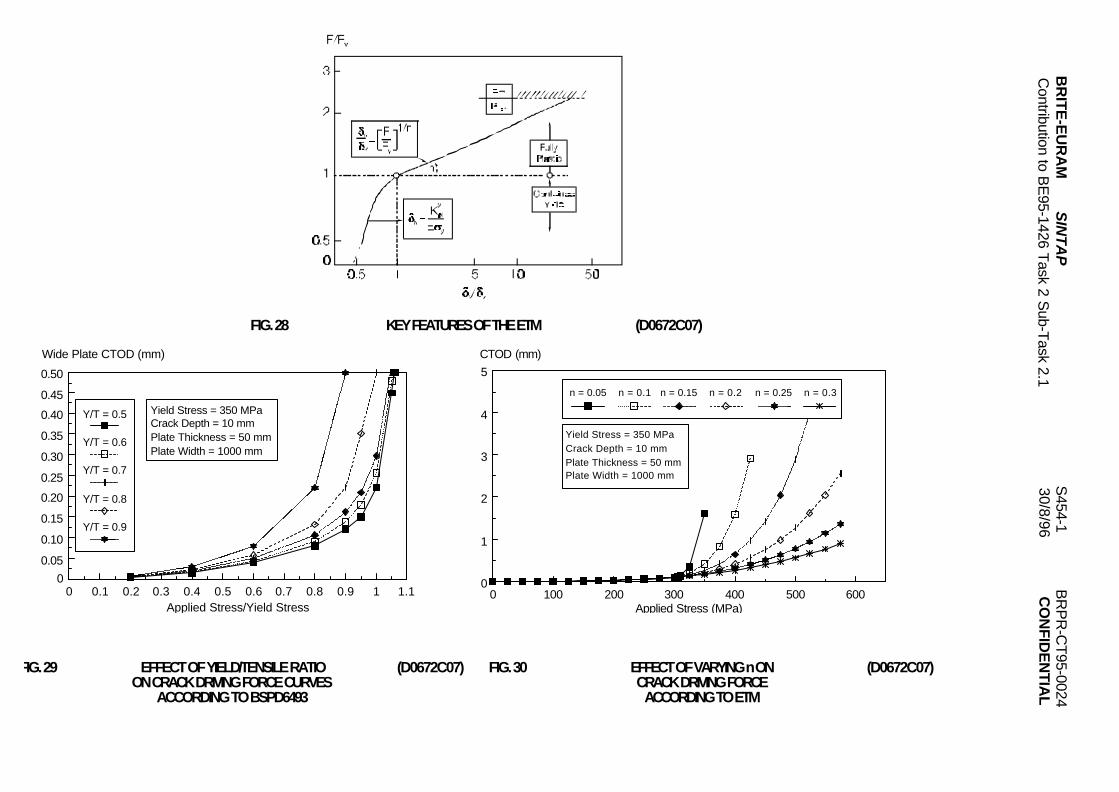
The Engineering Treatment Model (ETM) developed by GKSS(30) can be used for estimating the CTOD, J-integral, loadline displacement and limit load of flawed structures. It is particularly applicable for the determination of crack drivingforce curves. It is divided into two parts, calculations for contained yielding and predictions for the fully plastic state.The first part is applicable between 0.5 ≤F/Fy ≤1 and the second part is applicable between 1 <F/Fy ≤UTS/YS. Fy is theyield load which for tension is taken as the load corresponding to 0.9 σy.
In the contained yielding state the CTOD is calculated by:
δ =Kpl
2
EYS ... (15)
where δ is CTOD (or δ5) and Kpl the stress intensity corrected for plasticity.
For the fully plastic state the ETM formulation is:
σσy = F
F y
1n
= JJ y
1n+1 = ε
εy ... (16)
This formulation is shown in Fig. 28.
Hence, the ratio of instantaneous value to yield value of CTOD, load, J-integral and true strain are related through thestrain hardening exponent, n. The strain hardening exponent in the ETM is determined from a log-log plot of the yieldpoint (0.2% PS) and the ultimate tensile stress. The slope of the straight line through the points (σ0.2%, e0.2%) and(σUTS, eUTS) gives the strain hardening exponent, n. It is noted however(30) that this formulation only gives goodapproximations for power law hardening materials. It is suggested that work is needed to assess the influence ofETM defined n, as opposed to conventional n, on the accuracy of predictions. This is planned within SINTAP.
BRITE-EURAM SINTAP S454-1 BRPR-CT95-0024Contribution to BE95-1426 Task 2 Sub-Task 2.1 30/8/96 CONFIDENTIAL
14
The ETM is similar to the EPRI handbook in that use is made of a reference point (σy, ε y) or (Fy, ε t) up to which elasticsolutions apply and beyond which values are obtained by extrapolation into the fully plastic regime by a magnificationfactor related to the strain-hardening exponent.
5.3 Influence of Y/T on Crack Driving Force Predictions
Both BSPD6493 and the ETM can be used to assess the predicted influence of Y/T on the crack opening response oftensile panels. Figure 29 shows the results of PD6493 level 2 analyses for a constant geometry cracked plate intension in a material of constant UTS but varying yield stress and therefore varying Y/T. The stress axis is normalisedby dividing by yield stress. The effect of Y/T varying in the range 0.5 to 0.8 is less significant than in the range 0.8 to0.9. At a Y/T of 0.8 the predicted crack opening tends to ∞ at a normalised stress of 0.95 whereas for a Y/T of 0.9 thisoccurs at a normalised stress of 0.83.
An analysis for the same geometry made with the ETM is shown in Fig. 30 for a constant yield stress but nETM varyingbetween 0.05 and 0.30. Particularly notable features are the fact that wide plate CTOD is only predicted to increaserapidly once significantly above yield stress and the fact that n varying from 0.2 to 0.3 has little influence on predicteddriving force curves. These factors are to be further investigated within the project and compared with real data forparent plates in the yield strength range 275 to 800 MPa.
6. CONCLUSIONS
The significance of the yield/ultimate tensile strength (Y/T) ratio on the fracture behaviour of steels has beeninvestigated by means of a literature review. The principal areas assessed are the origins of the concern over Y/Tratio, the interrelationships between tensile parameters, the structural significance of the Y/T ratio and its treatment inassessment codes. The main conclusions are as follows:
1. Limits to the Y/T ratio were introduced into design codes based on the behaviour of 'first-generation'high strength steels and the notion that a high Y/T value equates to poor fracture performance.Modern steels give higher elongation values for a given strength level and Y/T ratio and the initialconcern is of low relevance to modern steels.
2. Modern steels produced via controlled rolling or quenching and tempering generally have Y/T in theratio 0.8-0.95 compared to 0.65-0.75 for normalised steels. A high Y/T ratio is generally associatedwith a low work hardening rate, n; the relationship is however neither linear nor consistent.
3. Current design code limits for Y/T vary between 0.67 and 0.90. There is general agreement thatvalues of up to 0.85 are satisfactory in conventional structural applications and values up to 0.95 inspecific cases. However, these limits have not yet found their way into design codes.
4. Of the various parameters applicable to the post-yield regime, the yield tensile ratio, strain hardeningexponent, local elongation (Lüders strain) and strain at UTS are the most relevant parameters forstructural integrity assessments.
5. Numerous estimates of n are available; most rely on the assumption that f(σy, n) = constant. Suchcorrelations are promising, particularly when different constants are used for different strengtheningmechanisms. Furthermore, the strain at UTS appears to give a reasonable estimate of n.
6. The presence of cracks modifies the shape of the stress-strain curve; crack depth and n dictate theextent of this. The yield point may be suppressed and a Lüders band not obtained. The latter effectcan however be observed in the CTOD-strain response where a plateau of CTOD can be achievedbeyond yield in steels showing a Lüders plateau in the conventional tensile test.
7. The significance of Y/T in buildings and bridges is only relevant for cases of earthquake resistance inthe former and plastic design in both structures. Design rotation capacities (maximum rotation/yieldrotation) of connections are typically 3 for general plastic design and 7 for severe earthquake design.The rotation capacity tends to decrease with increasing Y/T ratio although geometry and thicknessalso have a major influence.
8. For tension members gross section yielding rather than net section fracture is the preferred failuremode. Achievable elongation in the presence of holes such as bolt holes is very sensitive to Y/T. For
BRITE-EURAM SINTAP S454-1 BRPR-CT95-0024Contribution to BE95-1426 Task 2 Sub-Task 2.1 30/8/96 CONFIDENTIAL
15
tapered members, strong sensitivity is only noted above Y/T at ~0.85. However, industry experiencesuggests steels with values of Y/T up to 0.95 can be used without problem.
9. In the case of pressure vessels, burst pressure has been found experimentally to increase withdecreasing strain hardening exponent.
10. For tubular joints, decreasing Y/T from 1.0 to 0.66 at constant yield stress has been found to enhancethe ultimate joint capacity by only 6%. Tentative guidance suggests an upper limit of Y/T of 0.85.
11. Work on defect-containing pipelines has demonstrated that the effect of increasing defect depth ontolerable defect length is more significant than increasing Y/T. For deep defects there is little influenceof Y/T once above 0.85. For shallow defects there is significant influence once above Y/T of 0.90.
12. A number of FADs are currently available which incorporate the Y/T effect indirectly through limits onflow stress definition. Others are generated using actual stress-strain data. Both the shape of theFAD and the plastic collapse parameter cut-off depend on the Y/T ratio. Industry experience with thesemethods is wide but the influence of high Y/T steels on the suitability of the FAD parameters needsassessing.
13. The Engineering Treatment Model (ETM) incorporates an estimated strain hardening parameter in itsapproach. The method therefore predicts different behaviour for steels with the same yield strengthbut varying n. The method is of significant interest in its ability to characterise behaviour of steels withvarying Y/T ratios and n values.
14. Crack driving force curves based on BSPD6493 suggest relatively little influence of the effect of Y/T inthe range 0.5-0.8 but a significant influence above this level. Similar curves based on the ETM show asystematic effects of n at all levels.
BRITE-EURAM SINTAP S454-1 BRPR-CT95-0024Contribution to BE95-1426 Task 2 Sub-Task 2.1 30/8/96 CONFIDENTIAL
16
7. FUTURE WORK
Future work on the subject of yield/tensile ratio within the SINTAP project should concentrate on the following aspects:
1. Establish relationships between yield strength, Y/T, strain at UTS, n, composition and steel type toenable more accurate predictions of the relevant post yield tensile parameters.
2. Examine the relationship between conventionally defined n and the ETM-defined n and establish thesignificance of this on predictions.
3. Examine the significance of the yield plateau on behaviour of steels containing cracks.
4. Assess the interrelationship between crack depth and significance of Y/T.
5. Determine the influence of Y/T on the shape and cut-off limits of FADs and assess the accuracy ofpredicted crack driving force curves through comparison with the results from wide plate tests ondifferent steels (parent plate).
6. Assess the potential of a strain-based FAD, methods of deriving such an FAD and how it compareswith actual wide plate data.
7. Assess the abilities of PD6493 levels 2 and 3 and the ETM to predict the crack driving force curves ofparent plate wide plate tests.
8. Link with Task 1 to assess the influence of Y/T in welded joints and the effect on the significance ofmis-match.
REFERENCES
1. 'Pre-normative Research for the Market Development for High Strength Steels', RWTH, Aachen, 1994.
2. A. Stacey, J.V. Sharp and R.N. King: 'High Strength Steels Used in Offshore Installations', 1996 OMAE,Volume III, Materials Engineering, ASME 1996, pp 417-433.
3. 'Static Strength of High Strength Steel Tubular Joints', TNO-BOUW, ECSC Agreement No.7210.MC/602.
4. J. Healy, J. Billingham, C. Billington and H. Bolt: 'Design Implications of High Yield to Ultimate Ratio ofHigh Strength Steels in Offshore Engineering', 1995 OMAE, Volume III, Materials Engineering, ASME1995, pp 271-277.
5. P.W. Marshall: 'A Review of American Criteria for Tubular Structures and Proposed Revisions', IIW Doc.XV-405-77, 1977.
6. B.E. Healy and N. Zettlemoyer: 'In-Phase Bending Strength of Circular Tubular Joints', TubularStructures 1993, Ed. M.G. Coutre and G. Davies, pp 325-344.
7. J. Defourny and R. D'Haeyer: 'Mismatch in High Strength Steel Welds: Highlights of the ECSC F1 andF5 Workshop, Brussels, 7.12.93', ECSC Report No. EUR 16029EN.
8. R.M. Denys: 'A Study of the Effect of Yield Point Elongation and Strain Hardening Rate on the FractureBehaviour of Welded Low Carbon Steels', 1988 OMAE, Volume III, Materials Engineering, ASME 1988,pp 405-413.
9. 'High Strength Steels With Optimised Y/T Ratio', British Steel, Swinden Technology Centre, ECSCAgreement No. 7210.KA/823.
10. J.T. Martin, R.M. Denys, A.A. Lefevre and A.G. Glover: 'Yield Strength Mis-Match Effects on Fitness forPurpose Assessments of Girth Welds', Pipeline Technology, Vol. 1, Ostend, September 1995, pp 635-650.
BRITE-EURAM SINTAP S454-1 BRPR-CT95-0024Contribution to BE95-1426 Task 2 Sub-Task 2.1 30/8/96 CONFIDENTIAL
17
11. W. Hesse and W. Dahl: 'The Strain Hardening of Structural Steels With Different Yield Strengths and itsInfluence on the Materials Properties During Plastic Deformation', Journal unknown.
12. D.T. Gawne and G.M.H. Lewis: 'Strain Hardening of High Strength Steels', Materials Science andTechnology, February 1985, Vol. 1, pp 128-135.
13. E.F. Walker and W.B. Morrison: 'The Influence of Steel Processing and Microstructure on DynamicToughness and Crack Arrest in the Ductile Regime', Paper 16, Fracture Safe Designs for Large Tanks,Newcastle Under Lyme, April 1986, TWI.
14. H. Kuwamura and B. Kato: 'Inelastic Behaviour of High Strength Steel Members With Low Yield Ratio',Pacific Structural Steel Conference, Australian Institute of Steel Construction, pp 429-437.
15. J. Healy and J. Billingham: 'Metallurgical Implications of the High Yield to Ultimate Ratio in HighStrength Steels for Use in Offshore Engineering', 1995 OMAE, Volume III, Materials Engineering, ASME1995, pp 365-370.
16. W.B. Morrison: 'The Effect of Grain Size on the Stress-Strain Relationship in Low-Carbon Steel', ASM,Volume 59, 1966, pp 824-845.
17. E.A. Steigenwald and G.L. Hanna: 'Influence of Work-Hardening Exponent on the Fracture Toughnessof High Strength Materials', Trans. Met. Soc. AIME, Vol. 242, February 1968, pp 320-328.
18. A.C. Bannister and P.L. Harrison: 'A Comparative Study of Wide Plate Behaviour of a Range ofStructural Steels Using the Failure Assessment Diagram', Proceedings 1995 OMAE, Volume III,Materials Engineering, ASME 1995, pp 65-75.
19. B. Kato: 'Role of Strain Hardening of Steel in Structural Performance', ISIJ International, Vol. 30, No. 11,pp 1003-1009.
20. R.J. Dexter et al: 'Compression Stability of High Strength Cellular Double-Hull Ship Structure', 12thOMAE, Glasgow.
21. T.K. Sooi, P.S. Green, R. Sause and J.M. Ricles: 'Stress-Strain Properties of High-Performance Steeland the Implications for Civil Structure Design', Proceedings of the International Symposium on HighPerformance Steels for Structural Applications, 1995, Cleveland, Ohio.
22. R.C. Brockenbrough and Associates Inc.: 'Effect of Yield-Tensile Ratio on Structural Behaviour - HighPerformance Steels for Bridge Construction', March 6th, 1995.
23. C.P. Roger and S.T. Rolfe: 'Effect of Strain-Hardening Exponent and Strain Concentrations on theBursting Behaviour of Pressure Vessels', Pressure Vessels and Piping Conference, Miami Beach,ASME, Paper No. 74-Mat-1.
24. S.R. Wilmshurst and M.M.K. Lee: 'Non-linear FEM Study of Ultimate Strength of Tubular MultiplanarDouble K-Joints', 1993 OMAE, Volume III-B, Materials Engineering, ASEM 1993, pp 577-586.
25. European Pipeline Research Group, Annual Report, 1993.
26. I. Milne, R.A. Ainsworth, A.R. Dowling and A. Stewart: 'Assessment of the Integrity of StructuresContaining Defects', CEGB Report R-H-R6-Rev 3, 1986.
27. British Standard BSPD6493:1991: 'Guidance on Methods for Assessing the Acceptability of Flaws inFusion Welded Structures'.
28. I. Milne, R.A. Ainsworth, A.R. Dowling and A.T. Stewart: 'Background to and Validation of CEGB ReportR/H/R6-Rev 3', January 1987.
29. Draft Revision to BSPD6493, Fracture Assessment, BSI WEE37 Committee, April 1995.
BRITE-EURAM SINTAP S454-1 BRPR-CT95-0024Contribution to BE95-1426 Task 2 Sub-Task 2.1 30/8/96 CONFIDENTIAL
18
30. K.-H. Schwalbe and A. Cornec: 'The Engineering Treatment Model (ETM) and its Practical Application',Fatigue and Fract. Engg. Mater. Struct. Vol. 4, No. 4, pp 405-412, 1991.
EJF
BRITE-EURAM SINTAP S454-1 BRPR-CT95-0024Contribution to BE95-1426 Task 2 Sub-Task 2.1 30/8/96 CONFIDENTIAL
20
TABLE 1LIMITS TO Y/T RATIO IN ACCORDANCE WITH VARIOUS DESIGN CODES
CodeLimitation
YS as Proportionof UTS
Application
API RP2A (Pipeline) 0.67 Tubular jointsHSE Guidance Notes (Offshore) 0.70 Tubular jointsBS 5950 (Buildings) 0.84 All componentsNS 3472 (NPD) (Offshore) 0.83 All componentsEC3 (Buildings + Bridges) 0.92 All components (εUTS ≥15 εσy)DnV (Offshore) 0.85
0.75Except tubular jointsTubular joints (σy >500 N/mm2)
AISC (Buildings) 0.90 Grade 50 ksi beamsDutch Rules for oil and gas pipelines(Pipelines)
0.850.75
AcceptanceStrength calculations
BS 5400 Pt 3 Draft (Bridges) 0.740.83
All steels σy <390 N/mm2
All steels σy >390 N/mm2
TABLE 2PARAMETERS FOR PREDICTION OF STRAIN HARDENING EXPONENT
FROM STRENGTH AND STEEL TYPE(12)
Steel Type
Strength Parameter
S = YS S = UTS
P C P C
Solution hardened 0.31 1.41 0.33 7.75Grain refined 0.57 6.13 0.66 11.9Precipitation hardened 0.90 39.8 1.15 284Partially annealed 1.38 484 7.72 4743Cold worked 4.77 2.66 x 10
1023.4 ∞
BRITE-EURAM SINTAP S454-1 BRPR-CT95-0024Contribution to BE95-1426 Task 2 Sub-Task 2.1 30/8/96 CONFIDENTIAL
21
TABLE 3PREDICTED RELATIVE LOAD CAPACITIES OF
CRUCIFORM JOINTS WITH RESPECT TO σσ y/UTS RATIOS(3)
σy
(MPa)UTS(MPa) σy/UTS Comments
Relative FELoad Capacity
Relativeσy
350 350 1.0 Elastic-perfect plastic at baseline yield stress 0.945 1.0350 525 0.66 Typical offshore structure steel with yield
plateau1.000 1.0
491 525 0.90 Higher strength steel ratio with yield plateau 1.276 1.4491 491 1.0 Elastic-perfect plastic at higher yield stress 1.260 1.4350 525 0.66 Typical structural steel with continuous yielding
characteristics1.066 1.0
TABLE 4FAILURE ASSESSMENT DIAGRAMS: CURRENT STATUS AND NOMENCLATURE
Figure Number and FAD Type
CodeFig. 25(a)Screening
Level
Fig. 25(b)Generic FAD(Low WorkHardening)
Fig. 25(c)Generic FAD
(High Work Hardening)
Fig. 25(d)Material
Specific FAD
FullTearingAnalysis
R6 - Rev 2(SR based)
Rev 3,Option 1
Rev 3,Option 2
Rev 3,Option 3
PD64931991
Level 1 Level 2(SR based)
Level 3,Option 1
Level 3,Option 2
Level 3,Option 3
PD6493Rev 1995
Level 1 Level 2,Option 1
Level 2, Option 2Level 3, Option 1 (tearing)
Level 2, Option 3Level 3, Option 2 (tearing)
Level 3,Option 3
BRITE-EURAM SINTAP S454-1 BRPR-CT95-0024Contribution to BE95-1426 Task 2 Sub-Task 2.1 30/8/96 CONFIDENTIAL
F1
FIG. 1 RELATIVE FREQUENCY OF USE OF HIGH STRENGTH STEELS (D0672C06)
FIG. 2 SCHEMATIC STRESS-STRAIN CHARACTERISTICS OF (D0672C06)THREE STRUCTURAL STEELS
0 200 400 600 800 1000
Yield Stress (MPa)
Frequency of Use
Buildings
Bridges
Offshore Mobile Structures
Elongation
Stress
690
Conventional Structural
Steel, Normalised, Y/T = 0.7
Modern High Strength
Steel, Q & T, Y/T = 0.85
Modern High Strength
Steel, Q &T, Y/T = 0.95
350
450
BR
ITE
-EU
RA
MS
INT
AP
S454-1 B
RP
R-C
T95-0024
Contribution to B
E95-1426 T
ask 2 Sub-T
ask 2.130/8/96
CO
NF
IDE
NT
IAL
200 300 400 500 600 700 800 900 10000.60
0.65
0.70
0.75
0.80
0.85
0.90
0.95
Yield Stress (MPa)
Yield/Tensile Ratio
Normalised
TMCR
Q & T
Weld Metal
(a) Normalised, TMCR, Q&T Steels(9) (b) Offshore Steels from a Tubular Joints Database(3)
200 300 400 500 600 700 800 900 10000.5
0.6
0.7
0.8
0.9
1.0
Yield Stress (MPa)
Y/T Ratio
Mean fromFig. 3(a)
Mean fromFig. 3(b)
Mean fromFig. 3(c)
c) Offshore Steels(4) (d) Mean Lines for Data from Figs. 3(a), (b) and (c)
FIG. 3(a-d)RELATIONSHIP BETWEEN YIELD/TENSILE RATIO AND YIELD STRESS (D0672C07)
BR
ITE
-EU
RA
MS
INT
AP
S454-1 B
RP
R-C
T95-0024
Contribution to B
E95-1426 T
ask 2 Sub-T
ask 2.130/8/96
CO
NF
IDE
NT
IAL
Normalised
TMCR
Q & T
0.1 0.2 0.3 0.4 0.5 0.6 0.7200
300
400
500
600
700
800
Carbon Equivalent Value (CEV) (%)
Yield Strength (N/mm²)
0.6 0.65 0.7 0.75 0.8 0.85 0.9 0.950
0.1
0.2
0.3
0.4
Yield/Tensile Ratio
Strain Hardening Exponent (n)
Normalised TMCR Q & T Weld Metal
FIG. 4 ACHIEVABLE YIELD STRESS AS (D0672C07) FIG. 5 RELATIONSHIP BETWEEN Y/T AND (D0672C07)FUNCTION OF CARBON EQUIVALENT(7) n FOR DATA SHOWN IN FIG. 3(a)
FIG. 6 RELATIONSHIP BETWEEN YIELD STRENGTH (D0672C07)AND STRAIN HARDENING EXPONENT(10)

BRITE-EURAM SINTAP S454-1 BRPR-CT95-0024Contribution to BE95-1426 Task 2 Sub-Task 2.1 30/8/96 CONFIDENTIAL
F4
FIG. 7 STRAIN AT UTS v STRAIN HARDENING EXPONENT, n, (D0672C06)FOR VARIOUS STRUCTURAL STEELS
(a) Yield Strength (b) UTS
FIG. 8(a-b) STRAIN HARDENING EXPONENT AS FUNCTION OF (D0672C06)STEEL TYPE(12)
1:1 Line
0 0.05 0.1 0.15 0.2 0.25 0.3 0.350.05
0.10
0.15
0.20
0.25
0.30
0.35
0.40
n
Strain at UTS
e at UTS at UTSε
BRITE-EURAM SINTAP S454-1 BRPR-CT95-0024Contribution to BE95-1426 Task 2 Sub-Task 2.1 30/8/96 CONFIDENTIAL
F5
FIG. 9 PREDICTED n VALUES (D0672C06) FIG. 10 n VALUES AS FUNCTION (D0672C06)FOR GRAIN REFINED OF LYS FOR VARYING
STEELS(12) CARBON LEVELS(13)
FIG.11(a-b) STRAIN HARDENING (D0672C06) FIG. 12 STRAIN HARDENING (D0672C06)EXPONENT AND dδδ/dεε RATE AS FUNCTION
RATE FOR TWO STEELS(11) TRUE STRAIN(11)
200 400 600 800 1000 12000.10
0.12
0.14
0.16
0.18
0.20
0.22
0.24
0.26
Strength (MPa)
Predicted Strain Hardening Exponent (n)
Estimation Basedon Yield Stress
Estimation Basedon UTS
BRITE-EURAM SINTAP S454-1 BRPR-CT95-0024Contribution to BE95-1426 Task 2 Sub-Task 2.1 30/8/96 CONFIDENTIAL
F6
(a) Actual N (N = 1/n) (b) Ramberg-Osgood N with σy = 420 MPa
FIG. 13(a-b) TRUE STRESS AS FUNCTION OF TRUE STRAIN(11) (D0672C06)
(a) Yield-Tensile Ratio (b) Yield-Tensile Difference
FIG. 14(a-b) EFFECT OF TENSILE PROPERTIES ON BEAM COLUMN BEHAVIOUR(14) (D0672C06)
FIG. 15 EFFECT OF YIELD/TENSILE RATIO ON UNIFORM ELONGATION(15) (D0672C06)
BRITE-EURAM SINTAP S454-1 BRPR-CT95-0024Contribution to BE95-1426 Task 2 Sub-Task 2.1 30/8/96 CONFIDENTIAL
F7
FIG. 16 INFLUENCE OF GRAIN (D0672C06) FIG. 17 WIDE PLATE CTOD v (D0672C06)SIZE ON STRAIN STRAIN FOR LOW AND
HARDENING EXPONENT(16) HIGH Y/T RATIO STEELS(18)
FIG. 18 CANTILEVER BEAM (D0672C06) FIG. 19 EFFECT OF Y/T ON (D0672C06)BEHAVIOUR FOR DIFFERING ELONGATION CAPACITY OF
Y/T RATIO STEELS(19) TENSION MEMBER WITH HOLE(19)
0 0.2 0.4 0.6 0.8 1 1.2 1.4 1.60
0.4
0.8
1.2
1.6
2.0
2.4
2.8
Total Strain (%)
Wide Plate CTOD (mm)
Q & T Steel
YS = 519 MPa
Y/T = 0.86
n = 0.145
N Steel
YS = 376
Y/T = 0.68
n = 0.282
BRITE-EURAM SINTAP S454-1 BRPR-CT95-0024Contribution to BE95-1426 Task 2 Sub-Task 2.1 30/8/96 CONFIDENTIAL
F8
FIG. 20 EFFECT OF Y/T ON (D0672C06) FIG. 21 PLASTIC DEFORMATION (D0672C06)ELONGATION CAPACITY OF TAPERED MEMBERSOF TAPERED TENSION WITH VARYING
MEMBER(19) Y/T RATIO(21)
FIG. 22 EFFECT OF STRAIN (D0672C06) FIG. 23 COMPRESSION BRACE (D0672C06)HARDENING EXPONENT FAILURE LOAD ASON BURST PRESSURE(23) FUNCTION OF Y/T(24)
0.5 0.55 0.6 0.65 0.7 0.75 0.8 0.85 0.9 0.95 160
65
70
75
80
85
90
95
100
Yield/Tensile Ratio
Compression Brace Load (kN)
BRITE-EURAM SINTAP S454-1 BRPR-CT95-0024Contribution to BE95-1426 Task 2 Sub-Task 2.1 30/8/96 CONFIDENTIAL
F9
a) Failure Strain (b) Failure Stress
FIG. 24(a-b) EFFECT OF Y/T AND DEFECT LENGTH ON WIDE PLATE BEHAVIOUR(25) (D0672C06)
a) Level 1 Failure Assessment Diagram (b) Level 2 Generic FAD forLow Work Hardening
(σ1 ≤1.2 σy) (Curve plotted is for σf = 1.15 σytypical of low alloy steels and welds)
(c) Level 2 Generalised FAD particularly (d) Material Specific FADrelevant to higher work hardening
materials (σ1 <1.2 σy)
FIG. 25(a-d) FAILURE ASSESSMENT DIAGRAMS AS PER (D0672C06)DRAFT REVISION TO BSPD6493(29)
BR
ITE
-EU
RA
MS
INT
AP
S454-1 B
RP
R-C
T95-0024
Contribution to B
E95-1426 T
ask 2 Sub-T
ask 2.130/8/96
CO
NF
IDE
NT
IAL
a) Engineering Stress-Strain Data (b) Resulting FADs
FIG. 26(a-b) DEVIATION OF R6 FAILURE ASSESSMENT DIAGRAMS(28) (D0672C07)
a) Rev 3 Curves on Rev 2 Axes (b) Rev 2 Curves on Rev 3 Axes
FIG. 27(a-b) FAILURE ASSESSMENT DIAGRAMS (D0672C07)
BR
ITE
-EU
RA
MS
INT
AP
S454-1 B
RP
R-C
T95-0024
Contribution to B
E95-1426 T
ask 2 Sub-T
ask 2.130/8/96
CO
NF
IDE
NT
IAL
FIG. 28 KEY FEATURES OF THE ETM (D0672C07)
0 0.1 0.2 0.3 0.4 0.5 0.6 0.7 0.8 0.9 1 1.10
0.05
0.10
0.15
0.20
0.25
0.30
0.35
0.40
0.45
0.50
Applied Stress/Yield Stress
Wide Plate CTOD (mm)
Y/T = 0.5
Y/T = 0.6
Y/T = 0.7
Y/T = 0.8
Y/T = 0.9
Yield Stress = 350 MPaCrack Depth = 10 mm
Plate Thickness = 50 mm
Plate Width = 1000 mm
0 100 200 300 400 500 6000
1
2
3
4
5
Applied Stress (MPa)
CTOD (mm)
n = 0.05 n = 0.1 n = 0.15 n = 0.2 n = 0.25 n = 0.3
Yield Stress = 350 MPa
Crack Depth = 10 mm
Plate Thickness = 50 mm
Plate Width = 1000 mm
FIG. 29 EFFECT OF YIELD/TENSILE RATIO (D0672C07) FIG. 30 EFFECT OF VARYING n ON (D0672C07)ON CRACK DRIVING FORCE CURVES CRACK DRIVING FORCE
ACCORDING TO BSPD6493 ACCORDING TO ETM