Embed Size (px)
Citation preview

THE SKILL CONTENT OF RECENT TECHNOLOGICALCHANGE: AN EMPIRICAL EXPLORATION*
DAVID H. AUTOR
FRANK LEVY
RICHARD J. MURNANE
We apply an understanding of what computers do to study how computerizationalters job skill demands. We argue that computer capital (1) substitutes for workersin performing cognitive and manual tasks that can be accomplished by followingexplicit rules; and (2) complements workers in performing nonroutine problem-solving and complex communications tasks. Provided that these tasks are imperfectsubstitutes, our model implies measurable changes in the composition of job tasks,which we explore using representative data on task input for 1960 to 1998. We findthat within industries, occupations, and education groups, computerization is asso-ciated with reduced labor input of routine manual and routine cognitive tasks andincreased labor input of nonroutine cognitive tasks. Translating task shifts intoeducation demand, the model can explain 60 percent of the estimated relative de-mand shift favoring college labor during 1970 to 1998. Task changes within nomi-nally identical occupations account for almost half of this impact.
INTRODUCTION
A wealth of quantitative and case-study evidence documentsa striking correlation between the adoption of computer-basedtechnologies and the increased use of college-educated laborwithin detailed industries, within firms, and across plants withinindustries.1 This robust correlation is frequently interpreted asevidence of skill-biased technical change. Yet, as critics point out,this interpretation merely labels the correlation without explain-
* We thank the Alfred P. Sloan Foundation, the Russell Sage Foundation, andthe MIT-Ford Research Collaboration for financial support and Kokkeong Puah,Detelina Vasileva, and especially Melissa S. Kearny for research assistance. Weare indebted to Daron Acemoglu, Joshua Angrist, Lex Borghans, Nicole Fortin,Edward Glaeser, Lawrence Katz, Kevin Lang, Thomas Lemieux, Sendhil Mullain-athan, Richard Nelson, Kathryn Shaw, Marika Tatsutani, Bas ter Weel, threeanonymous referees, and numerous seminar participants for excellent sugges-tions. We thank Randy Davis of the Massachusetts Institute of Technology Arti-ficial Intelligence Laboratory and Peter Szolovits of the Massachusetts Institute ofTechnology Laboratory for Computer Science for clarifying issues in artificialintelligence, and Michael Handel for providing key data sources and expert adviceon use of the Dictionary of Occupational Titles.
1. Berman, Bound, and Griliches [1994], Autor, Katz, and Krueger [1998],Machin and Van Reenen [1998], Berman, Bound, and Machin [1998, 2000], and Gera,Gu, and Lin [2001] present evidence on industry level demand shifts from the UnitedStates, OECD, Canada, and other developed and developing countries. Levy andMurnane [1996], Doms, Dunne, and Troske [1997], and Bresnahan, Brynjolfsson, andHitt [2002] provide evidence on firm and plant level shifts. Katz and Autor [1999]summarize this literature. Card and DiNardo [2002] offer a critique.
© 2003 by the President and Fellows of Harvard College and the Massachusetts Institute ofTechnology.The Quarterly Journal of Economics, November 2003
1279
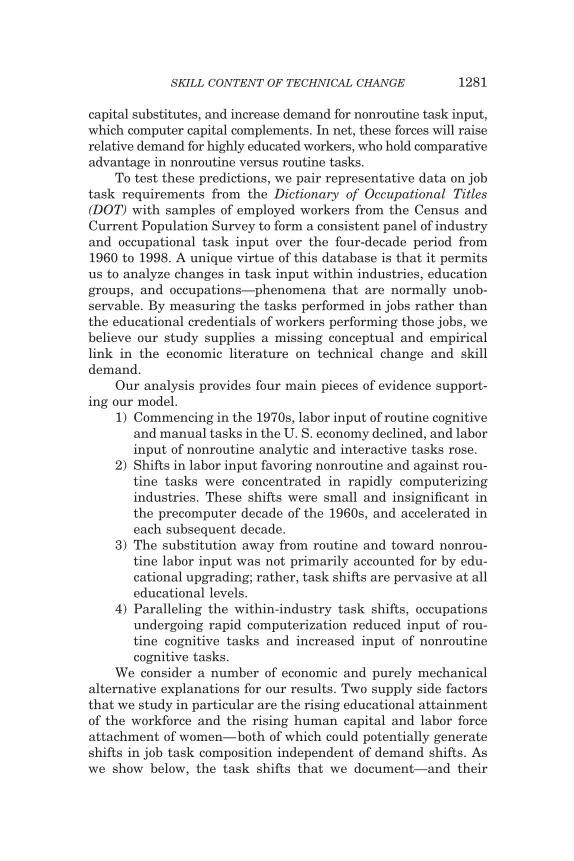
ing its cause. It fails to answer the question of what it is thatcomputers do—or what it is that people do with computers—thatcauses educated workers to be relatively more in demand.
This paper proposes an answer to this question. We formalizeand test a simple theory of how the rapid adoption of computertechnology—spurred by precipitous real price declines—changesthe tasks performed by workers at their jobs and ultimately thedemand for human skills. Our approach builds on an intuitive setof observations offered by organizational theorists, computer sci-entists, and most recently economists about what computers do—that is, the tasks they are best suited to accomplish—and howthese capabilities complement or substitute for human skills inworkplace settings.2 The simple observations that undergird ouranalysis are (1) that computer capital substitutes for workers incarrying out a limited and well-defined set of cognitive and man-ual activities, those that can be accomplished by following explicitrules (what we term “routine tasks”); and (2) that computercapital complements workers in carrying out problem-solving andcomplex communication activities (“nonroutine” tasks). (See Ta-ble I for examples.) Provided that routine and nonroutine tasksare imperfect substitutes, these observations imply measurablechanges in the task composition of jobs, which we test below.
To answer the core questions of our paper, the ideal experi-ment would provide two identical autarkic economies, one facinga dramatic decline in the price of computing power and the othernot. By contrasting these economies, it would be straightforwardto assess how computerization reshapes the task composition ofwork and hence the structure of labor demand. Because thisexperiment is not available, we develop a simple economic modelto predict how demand for workplace tasks responds to an econ-omywide decline in the price of computer capital. The model predictsthat industries and occupations that are initially intensive in laborinput of routine tasks will make relatively larger investments incomputer capital as its price declines. These industries and occupa-tions will reduce labor input of routine tasks, for which computer
2. Simon [1960] provides the first treatment of this question with which we arefamiliar, and his essay introduces many of the ideas explored here. Other early worksinclude Drucker [1954] and Nelson and Winter [1982]. Adler [1986], Orr [1996], andZuboff [1988] discuss what computers and related technology do in the workplace, butdo not consider economic implications. Acemoglu [1998], Goldin and Katz [1998],Bresnahan [1999], Bartel, Ichniowski, and Shaw [2000], Lindbeck and Snower[2000], Lang [2002], and Bresnahan, Brynjolfsson, and Hitt [2002] provide economicanalyses of why technology and human capital are complementary.
1280 QUARTERLY JOURNAL OF ECONOMICS
capital substitutes, and increase demand for nonroutine task input,which computer capital complements. In net, these forces will raiserelative demand for highly educated workers, who hold comparativeadvantage in nonroutine versus routine tasks.
To test these predictions, we pair representative data on jobtask requirements from the Dictionary of Occupational Titles(DOT) with samples of employed workers from the Census andCurrent Population Survey to form a consistent panel of industryand occupational task input over the four-decade period from1960 to 1998. A unique virtue of this database is that it permitsus to analyze changes in task input within industries, educationgroups, and occupations—phenomena that are normally unob-servable. By measuring the tasks performed in jobs rather thanthe educational credentials of workers performing those jobs, webelieve our study supplies a missing conceptual and empiricallink in the economic literature on technical change and skilldemand.
Our analysis provides four main pieces of evidence support-ing our model.
1) Commencing in the 1970s, labor input of routine cognitiveand manual tasks in the U. S. economy declined, and laborinput of nonroutine analytic and interactive tasks rose.
2) Shifts in labor input favoring nonroutine and against rou-tine tasks were concentrated in rapidly computerizingindustries. These shifts were small and insignificant inthe precomputer decade of the 1960s, and accelerated ineach subsequent decade.
3) The substitution away from routine and toward nonrou-tine labor input was not primarily accounted for by edu-cational upgrading; rather, task shifts are pervasive at alleducational levels.
4) Paralleling the within-industry task shifts, occupationsundergoing rapid computerization reduced input of rou-tine cognitive tasks and increased input of nonroutinecognitive tasks.
We consider a number of economic and purely mechanicalalternative explanations for our results. Two supply side factorsthat we study in particular are the rising educational attainmentof the workforce and the rising human capital and labor forceattachment of women—both of which could potentially generateshifts in job task composition independent of demand shifts. Aswe show below, the task shifts that we document—and their
1281SKILL CONTENT OF TECHNICAL CHANGE
associations with the adoption of computer technology—are aspervasive within gender, education, and occupation groups asbetween, indicating that these supply side forces are not theprimary explanation for our results.
We begin by presenting our informal “task model” describinghow computerization affects the tasks that workers and machinesperform. We next formalize this model in a production frameworkto develop empirical implications for task demand at the industryand occupation level. Subsequent sections describe our datasources and test the model’s main implications. Drawing togetherthe empirical strands, we finally assess the extent to whichchanges in the task composition can account for recent demandshifts favoring more educated workers. This exercise shows thatestimated task shifts are economically large, underscoring thepotential of the conceptual model to reconcile key facts.
I. THE TASK MODEL
We begin by conceptualizing work from a “machine’s-eye”view as a series of tasks to be performed, such as moving anobject, performing a calculation, communicating a piece of infor-mation, or resolving a discrepancy. Our model asks: which ofthese tasks can be performed by a computer? A general answer isfound by examining what is arguably the first digital computer,the Jacquard Loom of 1801. Jacquard’s invention was a machinefor weaving fabrics with inlaid patterns specified by a programpunched onto cards and fed into the loom. Some programs werequite sophisticated; one surviving example uses more than 10,000cards to weave a black and white silk portrait of Jacquard him-self.3 Two centuries later, the electronic descendants of Jacquard’sloom share with it two intrinsic traits. First, they rapidly and accu-rately perform repetitive tasks that are deterministically specifiedby stored instructions (programs) that designate unambiguouslywhat actions the machine will perform at each contingency toachieve the desired result. Second, computers are “symbolic proces-sors,” acting upon abstract representations of information such asbinary numbers or, in the loom’s case, punched cards.
Spurred by a more than trillionfold decline in the real price of
3. The Jacquard loom was also the inspiration for Charles Babbage’s analyti-cal engine and Herman Hollerith’s punch card reader, used to process the 1910United States Census.
1282 QUARTERLY JOURNAL OF ECONOMICS
computing power [Nordhaus 2001], engineers have become vastlymore proficient at applying the loom’s basic capabilities—rapidexecution of stored instructions—to a panoply of tasks. How doesthis advance affect the task composition of human work? Theanswer depends both upon how computers substitute for or com-plement workers in carrying out specific tasks, and how thesetasks substitute for one another. We illustrate these cases byconsidering the application of computers to routine and nonrou-tine cognitive and manual tasks.
In our usage, a task is “routine” if it can be accomplished bymachines following explicit programmed rules. Many manualtasks that workers used to perform, such as monitoring the tem-perature of a steel finishing line or moving a windshield into placeon an assembly line, fit this description. Because these tasksrequire methodical repetition of an unwavering procedure, theycan be exhaustively specified with programmed instructions andperformed by machines.
A problem that arises with many commonplace manual andcognitive tasks, however, is that the procedures for accomplishingthem are not well understood. As Polanyi [1966] observed, “Wecan know more than we can tell [p. 4] . . . The skill of a drivercannot be replaced by a thorough schooling in the theory of themotorcar; the knowledge I have of my own body differs altogetherfrom the knowledge of its physiology; and the rules of rhymingand prosody do not tell me what a poem told me, without anyknowledge of its rules [p. 20].” We refer to tasks fitting Polanyi’sdescription as “nonroutine,” that is, tasks for which the rules arenot sufficiently well understood to be specified in computer codeand executed by machines. Navigating a car through city trafficor deciphering the scrawled handwriting on a personal check—minor undertakings for most adults—are not routine tasks by ourdefinition (see Beamish, Levy, and Murnane [1999] and Autor,Levy and Murnane [2002] for examples). The reason is that thesetasks require visual and motor processing capabilities that can-not at present be described in terms of a set of programmablerules [Pinker 1997].4
Our conceptual model suggests that, because of its decliningcost, computer-controlled machinery should have substantially
4. If a manual task is performed in a well-controlled environment, however,it can often be automated despite the seeming need for adaptive visual or manualprocessing. As Simon [1960] observed, environmental control is a substitute forflexibility.
1283SKILL CONTENT OF TECHNICAL CHANGE
substituted for workers in performing routine manual tasks. Thisphenomenon is not novel. Substitution of machinery for repetitivehuman labor has been a thrust of technological change through-out the Industrial Revolution [Hounshell 1985; Mokyr 1990; Gol-din and Katz 1998]. By increasing the feasibility of machinesubstitution for repetitive human tasks, computerization fur-thers—and perhaps accelerates—this long-prevailing trend.
The advent of computerization also marks a qualitative en-largement in the set of tasks that machines can perform. Becausecomputers can perform symbolic processing—storing, retrieving,and acting upon information—they augment or supplant humancognition in a large set of information-processing tasks that his-torically were not amenable to mechanization. Over the last threedecades, computers have substituted for the calculating, coordi-nating, and communicating functions of bookkeepers, cashiers,telephone operators, and other handlers of repetitive informa-tion-processing tasks [Bresnahan 1999].
This substitution marks an important reversal. Previousgenerations of high technology capital sharply increased demandfor human input of routine information-processing tasks, as seenin the rapid rise of the clerking occupation in the nineteenthcentury [Chandler 1977; Goldin and Katz 1995]. Like these tech-nologies, computerization augments demand for clerical and in-formation-processing tasks. But in contrast to its nineteenth cen-tury predecessors, it permits these tasks to be automated.
The capability of computers to substitute for workers in carry-ing out cognitive tasks is limited, however. Tasks demanding flexi-bility, creativity, generalized problem-solving, and complex commu-nications—what we call nonroutine cognitive tasks—do not (yet)lend themselves to computerization [Bresnahan 1999]. At present,the need for explicit programmed instructions appears a bindingconstraint. There are very few computer-based technologies that candraw inferences from models, solve novel problems, or form persua-sive arguments.5 In the words of computer scientist Patrick Winston
5. It is, however, a fallacy to assume that a computer must reproduce all of thefunctions of a human to perform a task traditionally done by workers. For example,Automatic Teller Machines have supplanted many bank teller functions, althoughthey cannot verify signatures or make polite conversation while tallying change.Closely related, computer capital may substitute for the routine components ofpredominantly nonroutine tasks, e.g., on-board computers that direct taxi cabs. Whatis required for our conceptual model is that the routine and nonroutine tasks embod-ied in a job are imperfect substitutes. Consequently, a decline in the price of accom-plishing routine tasks does not eliminate demand for nonroutine tasks.
1284 QUARTERLY JOURNAL OF ECONOMICS
[1999]: “The goal of understanding intelligence, from a computa-tional point of view, remains elusive. Reasoning programs still ex-hibit little or no common sense. Today’s language programs trans-late simple sentences into database queries, but those languageprograms are derailed by idioms, metaphors, convoluted syntax, orungrammatical expressions.”6
The implication of our discussion is that because presentcomputer technology is more substitutable for workers in carry-ing out routine tasks than nonroutine tasks, it is a relativecomplement to workers in carrying out nonroutine tasks. From aproduction function standpoint, outward shifts in the supply ofroutine informational inputs, both in quantity and quality, in-crease the marginal productivity of workers performing nonrou-tine tasks that demand these inputs. For example, comprehen-sive bibliographic searches increase the quality of legal researchand timely market information improves the efficiency of mana-gerial decision-making. More tangibly, because repetitive, pre-dictable tasks are readily automated, computerization of theworkplace raises demand for problem-solving and communica-tions tasks such as responding to discrepancies, improving pro-duction processes, and coordinating and managing the activitiesof others. This changing allocation of tasks was anticipated byDrucker [1954] in the 1950s: “The technological changes nowoccurring will carry [the Industrial Revolution] a big step further.They will not make human labor superfluous. On the contrary,they will require tremendous numbers of highly skilled andhighly trained men—managers to think through and plan, highlytrained technicians and workers to design the new tools, to pro-duce them, to maintain them, to direct them” [p. 22, bracketsadded].
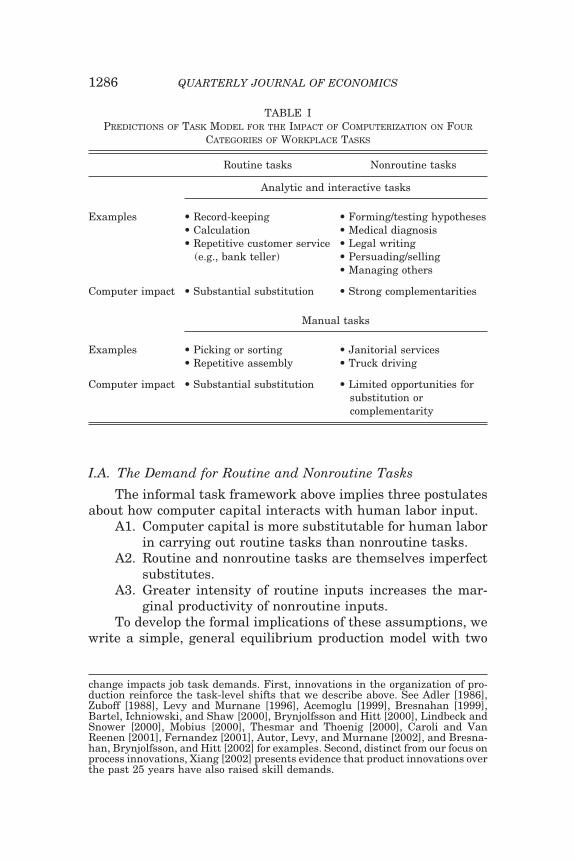
Table I provides examples of tasks in each cell of our two-by-two matrix of workplace tasks (routine versus nonroutine, man-ual versus information processing) and states our hypothesisabout the impact of computerization for each cell. The next sec-tion formalizes these ideas and derives empirical implications.7
6. Software that recognizes patterns (e.g., neural networks) or solves prob-lems based upon inductive reasoning from well-specified models is under devel-opment. But these technologies have had little role in the “computer revolution” ofthe last several decades. As one example, current speech recognition softwarebased on pattern recognition can recognize words and short phrases but can onlyprocess rudimentary conversational speech [Zue and Glass 2000].
7. Our focus on task shifts in the process of production within given jobsoverlooks two other potentially complementary avenues by which technical
1285SKILL CONTENT OF TECHNICAL CHANGE
I.A. The Demand for Routine and Nonroutine Tasks
The informal task framework above implies three postulatesabout how computer capital interacts with human labor input.
A1. Computer capital is more substitutable for human laborin carrying out routine tasks than nonroutine tasks.
A2. Routine and nonroutine tasks are themselves imperfectsubstitutes.
A3. Greater intensity of routine inputs increases the mar-ginal productivity of nonroutine inputs.
To develop the formal implications of these assumptions, wewrite a simple, general equilibrium production model with two
change impacts job task demands. First, innovations in the organization of pro-duction reinforce the task-level shifts that we describe above. See Adler [1986],Zuboff [1988], Levy and Murnane [1996], Acemoglu [1999], Bresnahan [1999],Bartel, Ichniowski, and Shaw [2000], Brynjolfsson and Hitt [2000], Lindbeck andSnower [2000], Mobius [2000], Thesmar and Thoenig [2000], Caroli and VanReenen [2001], Fernandez [2001], Autor, Levy, and Murnane [2002], and Bresna-han, Brynjolfsson, and Hitt [2002] for examples. Second, distinct from our focus onprocess innovations, Xiang [2002] presents evidence that product innovations overthe past 25 years have also raised skill demands.
TABLE IPREDICTIONS OF TASK MODEL FOR THE IMPACT OF COMPUTERIZATION ON FOUR
CATEGORIES OF WORKPLACE TASKS
Routine tasks Nonroutine tasks
Analytic and interactive tasks
Examples • Record-keeping • Forming/testing hypotheses• Calculation • Medical diagnosis• Repetitive customer service
(e.g., bank teller)• Legal writing• Persuading/selling• Managing others
Computer impact • Substantial substitution • Strong complementarities
Manual tasks
Examples • Picking or sorting • Janitorial services• Repetitive assembly • Truck driving
Computer impact • Substantial substitution • Limited opportunities forsubstitution orcomplementarity
1286 QUARTERLY JOURNAL OF ECONOMICS
task inputs, routine and nonroutine, that are used to produceoutput Q, which sells at price one. Because our discussionstresses that computers neither strongly substitute nor stronglycomplement nonroutine manual tasks, we consider this model topertain primarily to routine cognitive and routine manual tasks,and nonroutine analytic and nonroutine interactive tasks.
We assume for tractability an aggregate, constant returns toscale Cobb-Douglas production function of the form,
(1) Q � �LR � C�1��LN� , � � �0,1�,
where LR and LN are routine and nonroutine labor inputs and Cis computer capital, all measured in efficiency units. Computercapital is supplied perfectly elastically at market price � perefficiency unit, where � is falling exogenously with time due totechnical advances. The declining price of computer capital is thecausal force in our model.8
We assume that computer capital and labor are perfect sub-stitutes in carrying out routine tasks. Cobb-Douglas technologyfurther implies that the elasticity of substitution between routineand nonroutine tasks is one, and hence computer capital andnonroutine task inputs are relative complements. While the as-sumption of perfect substitutability between computer capitaland routine task input places assumptions A1 and A2 in boldrelief, the only substantive requirement for our model is thatcomputer capital is more substitutable for routine than nonrou-tine tasks. Observe that routine and nonroutine tasks are q-complements; the marginal productivity of nonroutine tasks riseswith the quantity of routine task input, consistent with assump-tion A3.9
We assume a large number of income-maximizing workers,each of whom inelastically supplies one unit of labor. Workershave heterogeneous productivity endowments in both routine andnonroutine tasks, with Ei � [ri,ni] and 1 � ri, ni � 0 @ i. A givenworker can choose to supply ri efficiency units of routine taskinput, ni efficiency units of nonroutine task input, or any convex
8. Borghans and ter Weel [2002] offer a related model exploring how thedeclining price of computer capital affects the diffusion of computers and thedistribution of wages. A key difference is that the tasks performed by computersand workers are inseparable in the Borghans-ter Weel model. Accordingly, com-puterization alters wage levels but does not directly change the allocation ofhuman labor input across task types. This latter point is the focus of our modeland empirical analysis.
9. Specifically, �2Q/�LN�(LR C) � �(1 � �) LN��1/(LR C)� � 0.
1287SKILL CONTENT OF TECHNICAL CHANGE
combination of the two. Hence, Li � [iri, (1 � i)ni], where 0 �i � 1. These assumptions imply that workers will choose tasksaccording to comparative advantage as in Roy [1951]. We adoptthe Roy framework because it implies that relative task supplywill respond elastically to relative wage levels. If, instead, work-ers were bound to given tasks, the implications of our model fortask productivity would be unchanged, but technical progress,reflected by a decline in �, would not generate re-sorting of work-ers across jobs.
Two main conditions govern market equilibrium in thismodel. First, given the perfect substitutability of routine tasksand computer capital, the wage per efficiency unit of routine taskinput is pinned down by the price of computer capital:10
(2) wR � �.
Second, worker self-selection among occupations—routine versusnonroutine—clears the labor market.
Define the relative efficiency of individual i at nonroutineversus routine tasks as �i � ni/r1. Our assumptions above implythat �i � (0,�). At the labor market equilibrium, the marginalworker with relative efficiency units �* is indifferent betweenperforming routine and nonroutine tasks when
(3) �* � wR/wN.
Individual i supplies routine labor (i � 1) if �i �*, andsupplies nonroutine labor otherwise (i � 0).
To quantify labor supply, write the functions g(�), h(�),which sum population endowments in efficiency units of routineand nonroutine tasks, respectively, at each value of �. Hence,g(�) � ¥iri � I[�i �] and h(�) � ¥ini � I[�i � �], where I[ � ]is the indicator function. We further assume that �i has nonzerosupport at all �i � (0,�), so that that h(�) is continuouslyupward sloping in �, and g(�) is continuously downward sloping.
Assuming that the economy operates on the demand curve,productive efficiency requires
(4) wR ��Q�LR
� �1 � ����� and wN ��Q�LN
� ��1��,
10. We implicitly assume that the shadow price of nonroutine tasks absentcomputer capital exceeds � and hence equation (2) holds with equality. In theprecomputer era it is likely that wR �.
1288 QUARTERLY JOURNAL OF ECONOMICS
where � in this expression is the ratio of routine to nonroutinetask input in production:
(5) � � �C � g��*���h��*�.
These equations provide equilibrium conditions for the mod-el’s five endogenous variables (wR,wN,�,C,�). We use them toanalyze how a decline in the price of computer capital affects taskinput, wages, and labor supply, beginning with the wage paid toroutine task input.
It is immediate from (2) that a decline in the price of com-puter capital reduces wR one-for-one, �(ln wR)/�(ln �) � 1, andhence demand for routine task input rises:
(6)� ln �
� ln �� �
1�
.
From the perspective of producers, the rise in routine taskdemand could be met by either an increase in C or an increase inLR (or both). Only the first of these will occur, however. Becauseroutine and nonroutine tasks are productive complements (spe-cifically q-complements), the relative wage paid to nonroutinetasks rises as � declines:
(7)� ln�wN/wR�
� ln �� �
1�
and� ln �*� ln �
�1�
.
Consequently, marginal workers will reallocate their labor inputfrom routine to nonroutine tasks. Increased demand for routinetasks must be met entirely by an influx of computer capital.
Hence, an exogenous decline in the price of computer capitalraises the marginal productivity of nonroutine tasks, causingworkers to reallocate labor supply from routine to nonroutinetask input. Although routine labor input declines, an inflow ofcomputer capital more than compensates, yielding a net increasein the intensity of routine task input in production.
I.B. Industry Level Implications
Does this model have testable microeconomic implications?Because the causal force in the model is the price of computercapital, in one sense we have only a single macroeconomic timeseries available. However, additional leverage may be gained by
1289SKILL CONTENT OF TECHNICAL CHANGE
considering equation (1) as representing the production functionof a single industry, with distinct industries j producing outputsqj that demand different mixes of routine and nonroutine tasks.We write industry j’s production function as
(8) qj � rj1��jnj
�j, �j � �0,1�,
where �j is the industry-specific factor share of nonroutine tasks,and rj, nj denote the industry’s task inputs. All industries useCobb-Douglas technology, but industries with smaller �j are moreroutine task intensive.
We assume that consumer preferences in this economy maybe represented with a Dixit-Stiglitz [1977] utility function,
(9) U�q1,q2, . . . , qj� � ��j
qj1�v�1/�1�v�,
where 0 v 1. The elasticity of demand for each good is�(1/v), with the market clearing price inversely proportional tothe quantity produced, pj(qj) � qj
�v.Industry profit maximization yields the following first-order
conditions for wages:
(10) � � nj�jrj
��j�1 � �j��1 � v��nj�jrj
1��j��v and
wN � n�j�1r1��j�j�1 � v��nj�jrj
1��j��v.
Rearranging to obtain factor demands gives
(11) nj � wN�1/v��j �1 � v��1/v �wN
��
�1 � �j�
�j���1�� j��1�v��/v
and
rj � ��1/v��1 � �j��1 � v��1/v�wN
��
�1 � �j�
�j� ��j�v�1��/v
.
Using these equations, we obtain the following three proposi-tions, which we test empirically below.
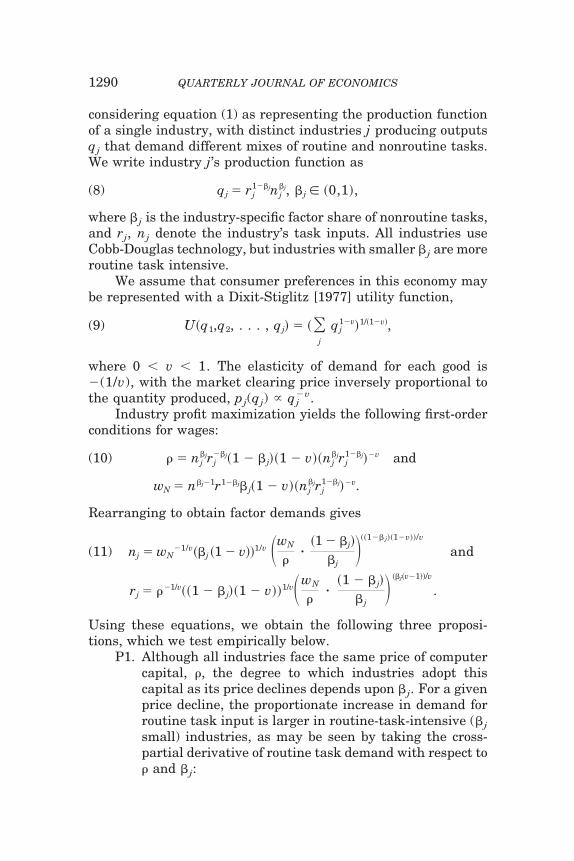
P1. Although all industries face the same price of computercapital, �, the degree to which industries adopt thiscapital as its price declines depends upon �j. For a givenprice decline, the proportionate increase in demand forroutine task input is larger in routine-task-intensive (�jsmall) industries, as may be seen by taking the cross-partial derivative of routine task demand with respect to� and �j:
1290 QUARTERLY JOURNAL OF ECONOMICS
� ln rj
���
�j�1 � v� � 1v�
� 0 and�2 ln rj
����j�
1 � vv�
� 0.
Although we cannot observe �j, a logical proxy for it isthe observed industry level of routine task input in theprecomputerization era. We therefore test whether in-dustries that were historically (i.e., precomputer era)intensive in routine tasks adopted computer capital to agreater extent than industries that were not.
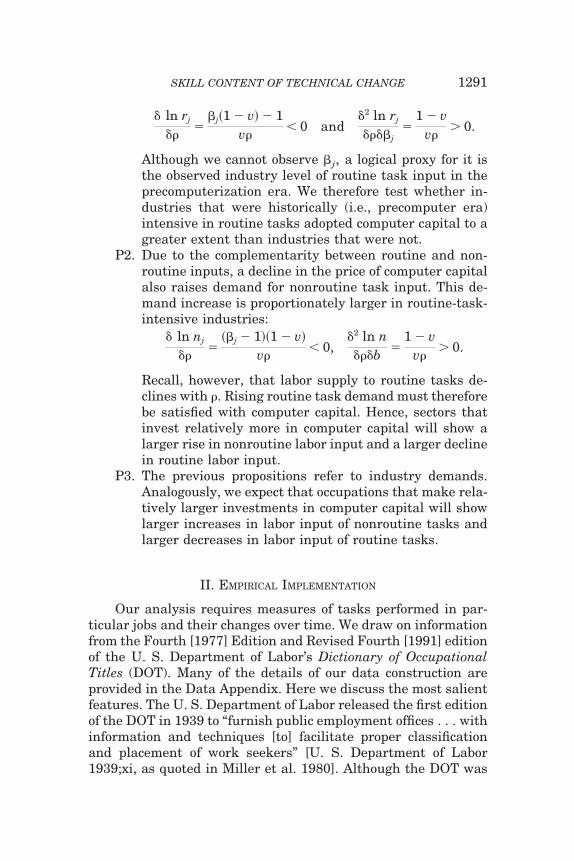
P2. Due to the complementarity between routine and non-routine inputs, a decline in the price of computer capitalalso raises demand for nonroutine task input. This de-mand increase is proportionately larger in routine-task-intensive industries:
� ln nj
���
��j � 1��1 � v�
v�� 0,
�2 ln n���b �
1 � vv�
� 0.
Recall, however, that labor supply to routine tasks de-clines with �. Rising routine task demand must thereforebe satisfied with computer capital. Hence, sectors thatinvest relatively more in computer capital will show alarger rise in nonroutine labor input and a larger declinein routine labor input.
P3. The previous propositions refer to industry demands.Analogously, we expect that occupations that make rela-tively larger investments in computer capital will showlarger increases in labor input of nonroutine tasks andlarger decreases in labor input of routine tasks.
II. EMPIRICAL IMPLEMENTATION
Our analysis requires measures of tasks performed in par-ticular jobs and their changes over time. We draw on informationfrom the Fourth [1977] Edition and Revised Fourth [1991] editionof the U. S. Department of Labor’s Dictionary of OccupationalTitles (DOT). Many of the details of our data construction areprovided in the Data Appendix. Here we discuss the most salientfeatures. The U. S. Department of Labor released the first editionof the DOT in 1939 to “furnish public employment offices . . . withinformation and techniques [to] facilitate proper classificationand placement of work seekers” [U. S. Department of Labor1939;xi, as quoted in Miller et al. 1980]. Although the DOT was
1291SKILL CONTENT OF TECHNICAL CHANGE
updated four times in the ensuing 60 years [1949, 1965, 1977, and1991], its structure was little altered. Based upon first-handobservations of workplaces, Department of Labor examiners—using guidelines supplied by the Handbook for Analyzing Jobs[U. S. Department of Labor 1972]—evaluate more than 12,000highly detailed occupations along 44 objective and subjectivedimensions, including training times, physical demands and re-quired worker aptitudes, temperaments, and interests.11
Our DOT data are based on an aggregation of these detailedoccupations into three-digit Census Occupation Codes (COC), ofwhich there are approximately 450. We append DOT occupationcharacteristics to the Census Integrated Public Micro Samples[IPUMS, Ruggles and Sobeck 1997] one percent extracts for 1960,1970, 1980, and 1990, and to CPS Merged Outgoing RotationGroup (MORG) files for 1980, 1990, and 1998. We use all obser-vations for noninstitutionalized, employed workers, ages 18 to 64.For the industry analysis, these individual worker observationsare aggregated to the level of 140 consistent Census industriesspanning all sectors of the economy in each year of the sample. Allanalyses are performed using full-time equivalent hours (FTEs)of labor supply as weights. The latter is the product of the indi-vidual Census or CPS sampling weight, times hours of work inthe sample reference week and, for Census samples, weeks ofwork in the previous year.
We exploit two sources of variation for measuring changingjob task requirements. The first consists of changes over time inthe occupational distribution of employment, holding constanttask content within occupations at the DOT 1977 level. We referto cross-occupation employment changes as “extensive” marginshifts, which we can measure consistently over the period 1960 to1998. This variation does not, however, account for changes intask content within occupations [Levy and Murnane 1996], whichwe label the “intensive” margin. To measure intensive marginshifts, we analyze changes in task content measures within oc-cupations over the period 1977 to 1991, using occupationsmatched between the Fourth Edition and Revised Fourth Editionof the DOT.
Although the DOT contains the best time-series on job task
11. The Department of Labor’s recent successor to the DOT, O*NET, providespotentially more up-to-date information but is not suitable for time-seriesanalysis.
1292 QUARTERLY JOURNAL OF ECONOMICS
requirements for detailed occupations in the United States, it alsohas well-known limitations [Miller et al. 1980]. These includelimited sampling of occupations (particularly in the service sec-tor), imprecise definitions of measured constructs, and omissionof important job skills. These shortcomings are likely to reducethe precision of our analysis.12
II.A. Selecting Measures of Routine and Nonroutine Tasks
To identify variables that best approximate our task con-structs, we reduced the DOT variables to a relevant subset usingDOT textual definitions, means of DOT measures by occupationfrom 1970, and detailed examples of DOT evaluations from theHandbook for Analyzing Jobs. We selected two variables to mea-sure nonroutine cognitive tasks, one to capture interactive, com-munication, and managerial skills and the other to capture ana-lytic reasoning skills. The first codes the extent to which occupa-tions involve Direction, Control, and Planning of activities (DCP).It takes on consistently high values in occupations requiringmanagerial and interpersonal tasks. The second variable, GED-MATH, measures quantitative reasoning requirements. For rou-tine cognitive tasks, we employ the variable STS, which measuresadaptability to work requiring Set limits, Tolerances, or Stan-dards. As a measure of routine manual activity, we selected thevariable FINGDEX, an abbreviation for Finger Dexterity. Tomeasure nonroutine manual task requirements, we employ thevariable EYEHAND, an abbreviation for Eye-Hand-Foot coordi-nation. Definitions and example tasks from the Handbook forAnalyzing Jobs are provided in Appendix 1.
A limitation of the DOT variables is that they do not have anatural scale and, moreover, cannot confidently be treated ascardinal. To address this limitation, we transformed the DOTmeasures into percentile values corresponding to their rank inthe 1960 distribution of task input. We choose 1960 as the baseperiod for this standardization because it should primarily reflectthe distribution of tasks prior to the computer era. Consequently,all of our outcome measures may be interpreted as levels or
12. Researchers who have used the DOT to analyze changing job skill re-quirements include Rumberger [1981], Spenner [1983, 1990], Howell and Wolff[1991], Wolff [1996, 2002], Handel [2000], and Ingram and Neumann [2000]. Whatis unique to our work is the focus on routine and nonroutine tasks, and the jointanalyses of the effect of computerization on task changes between and withinoccupations.
1293SKILL CONTENT OF TECHNICAL CHANGE

changes in task input relative to the 1960 task distribution,measured in “centiles.”13
II.B. A Predictive Test
As an initial check on our data and conceptual framework, wetest the first proposition of our theoretical model: industries his-torically intensive in routine tasks should have adopted computercapital relatively rapidly as its price fell. To operationalize thistest, we form an index of industry-level routine task intensityduring the precomputer era. Using the 1960 Census data pairedto our selected DOT task measures, we calculate the percentageshare of routine task input in industry j’s total task input as,Routine Task Sharej,1960 � 100 � rj,1960/(rj,1960 nj,1960),where all task measures are standardized with equal mean andvariance. The numerator of this index is the sum of industryroutine cognitive and routine manual task inputs, while the de-nominator is the sum of all five task inputs: routine cognitive andmanual; nonroutine analytic, interactive, and manual. This in-dex, which has mean 40.0 and standard deviation 5.0, shouldroughly correspond to (1 � �j) in our model.
To proxy computer adoption after 1960, we use the CurrentPopulation Survey to calculate industries’ percentile rank of com-puter use in 1997. Although we do not have a measure of industrycomputer use in 1960, this was likely close to zero in all cases.Consequently, the 1997 measure should closely reflect post-1960computer adoption.
We fit the following equation:
(12) Computer adoptionj,1960–1997 �
�24.56�19.18�
� 1.85�0.48�
� Routine Task Sharej,1960
�n � 140, R2 � 0.10�.
The point estimate of 1.85 (standard error 0.48) for the routinetask share variable confirms that an industry’s routine task in-tensity in 1960 is strongly predictive of its subsequent computeradoption. Comparing two industries that in 1960 were 10 per-centage points (2 standard deviations) apart in routine task in-put, the model predicts that by 1997, these industries would be 19percentage points apart in the distribution of computer adop-
13. An earlier version of this paper [Autor, Levy, and Murnane 2001] em-ployed raw DOT scores rather than the percentile measures used here. Resultswere qualitatively identical.
1294 QUARTERLY JOURNAL OF ECONOMICS
tion—approximately 13 percentage points apart in on-the-jobcomputer use.
We have estimated many variations of this basic model toverify its robustness, including specifying the dependent variableas the level or percentile rank of industry computer use in 1984,1997, or the average of both; scaling the routine task sharemeasure in percentiles of the 1960 task distribution; calculatingthe routine task share index using task percentiles rather thantask levels; and replacing the routine task index with its loga-rithm. These many tests provide robust support for the firstproposition of our theoretical model: demand for computer capitalis greatest in industries that were historically routine taskintensive.
III. TRENDS IN JOB TASK INPUT, 1960–1998
Our model implies that the rapidly declining price of com-puter capital should have reduced aggregate demand for laborinput of routine tasks and increased demand for labor input ofnonroutine cognitive tasks. This section analyzes the evidence forsuch shifts.
III.A. Aggregate Trends
Figure I illustrates the extent to which changes in the occu-pational distribution over the period 1960 to 1998 resulted inchanges in the tasks performed by the U. S. labor force. Thisfigure is constructed by pairing the selected DOT 1977 taskmeasures with Census and CPS employment data for each de-cade. By construction, each task variable has a mean of 50 cen-tiles in 1960. Subsequent points depict the employment-weightedmean of each assigned percentile over each decade.14
As is evident in the figure, the share of the labor forceemployed in occupations that made intensive use of nonroutineanalytic and nonroutine interactive tasks increased substantiallyduring the last four decades. Although both of these measures ofnonroutine tasks increased in the 1960s—that is, during the
14. We do not impose an adding-up constraint across task measures—whereby total task allocation must sum to one within jobs or time periods—sincethis structure is not intrinsic to the DOT. It is therefore possible for the econ-omywide average of total task input to either rise or fall. This over-time variationis modest in practice. The mean of all five task measures, equal to 50 by construc-tion in 1960, rose slightly to 52.5 in 1980, and fell to 51.2 in 1998.
1295SKILL CONTENT OF TECHNICAL CHANGE
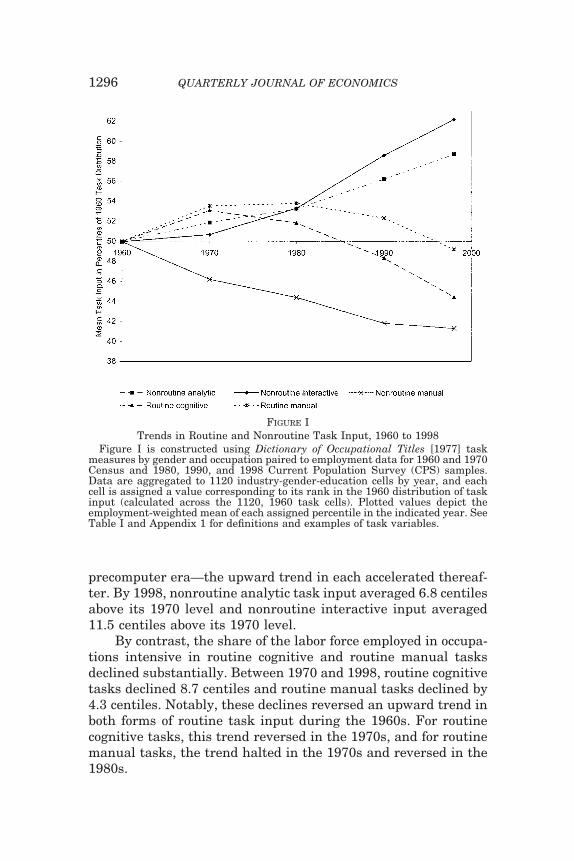
precomputer era—the upward trend in each accelerated thereaf-ter. By 1998, nonroutine analytic task input averaged 6.8 centilesabove its 1970 level and nonroutine interactive input averaged11.5 centiles above its 1970 level.
By contrast, the share of the labor force employed in occupa-tions intensive in routine cognitive and routine manual tasksdeclined substantially. Between 1970 and 1998, routine cognitivetasks declined 8.7 centiles and routine manual tasks declined by4.3 centiles. Notably, these declines reversed an upward trend inboth forms of routine task input during the 1960s. For routinecognitive tasks, this trend reversed in the 1970s, and for routinemanual tasks, the trend halted in the 1970s and reversed in the1980s.
FIGURE ITrends in Routine and Nonroutine Task Input, 1960 to 1998
Figure I is constructed using Dictionary of Occupational Titles [1977] taskmeasures by gender and occupation paired to employment data for 1960 and 1970Census and 1980, 1990, and 1998 Current Population Survey (CPS) samples.Data are aggregated to 1120 industry-gender-education cells by year, and eachcell is assigned a value corresponding to its rank in the 1960 distribution of taskinput (calculated across the 1120, 1960 task cells). Plotted values depict theemployment-weighted mean of each assigned percentile in the indicated year. SeeTable I and Appendix 1 for definitions and examples of task variables.
1296 QUARTERLY JOURNAL OF ECONOMICS
Finally, the share of the labor force employed in occupationsintensive in nonroutine manual tasks showed a secular declineacross all decades. This decline was most rapid in the 1960s, andslowed considerably in subsequent decades.
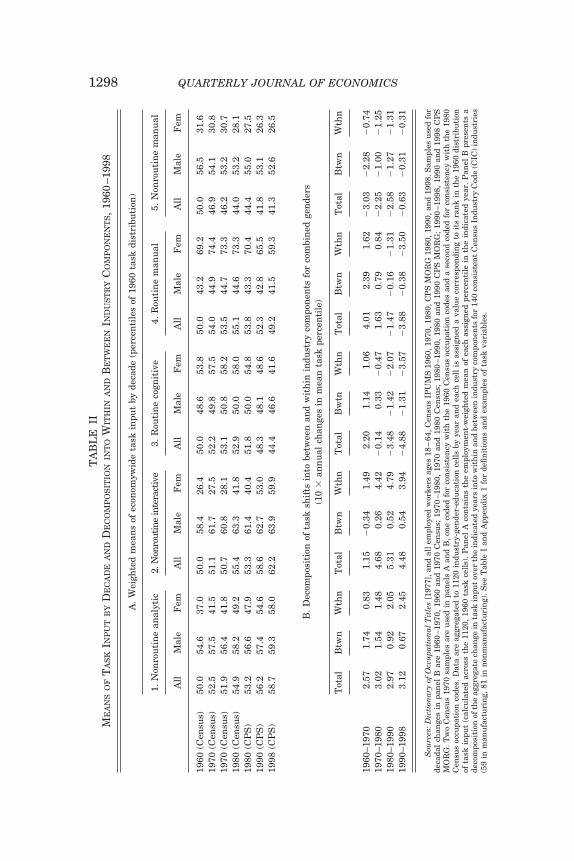
Panel A of Table II provides the corresponding means of taskinput by decade, both in aggregate and by gender. For both malesand females, there are pronounced shifts against routine cogni-tive, routine manual, and nonroutine manual task inputs, andpronounced shifts favoring nonroutine analytic and interactiveinputs. These shifts, however, are numerically larger for females.Given the rapid entry of women into the labor force in recentdecades, it appears plausible that demand shifts for workplacetasks would impact the stock of job tasks more rapidly for femalesthan males [Goldin 1990; Weinberg 2000; Blau, Ferber, and Wink-ler 2002, Chapter 4]. To assess the importance of these genderdifferences, we estimated all of our main results separately formales and females. Because we found quite similar results forboth genders, we focus below on the pooled gender samples.
To complete the picture provided by the decadal means,Figure II depicts smoothed changes in the density of the tworoutine and two nonroutine cognitive task measures between1960 and subsequent decades. Three series are plotted for eachtask measure. Two depict extensive margin task shifts at approxi-mately twenty-year intervals. These are measured using the 1977DOT task measures paired to the 1960, 1980, and 1998 employ-ment data. The third series adds intensive margin task shifts bypairing the 1991 DOT task measures with the 1998 employmentdata. By construction, task input is uniformly distributed acrossall percentiles in 1960. Hence, the height of each line in the figurerepresents the difference in the share of overall employment in1980 or 1998 at each centile of 1960 task input.15 To conservespace, we do not provide a plot of the nonroutine manual mea-sure, since it is not the subject of subsequent analysis.
As shown in panels A and B of the figure, the distribution ofnonroutine analytic and nonroutine interactive task input shiftedmarkedly rightward after 1960. In particular, there was substan-tial growth in the share of employment requiring nonroutine taskinput above the 1960 median and a corresponding decline below
15. We apply an Epanechnikov kernel with bandwidth h � 0.90�n�1/5,where n is the number of observations and � is the standard deviation. For oursamples, this yields bandwidths between 5 and 7 centiles.
1297SKILL CONTENT OF TECHNICAL CHANGE
TA
BL
EII
ME
AN
SO
FT
AS
KIN
PU
TB
YD
EC
AD
EA
ND
DE
CO
MP
OS
ITIO
NIN
TO
WIT
HIN
AN
DB
ET
WE
EN
IND
US
TR
YC
OM
PO
NE
NT
S,
1960
–199
8
A.
Wei
ghte
dm
ean
sof
econ
omyw
ide
task
inpu
tby
deca
de(p
erce
nti
les
of19
60ta
skdi
stri
buti
on)
1.N
onro
uti
ne
anal
ytic
2.N
onro
utin
ein
tera
ctiv
e3.
Rou
tin
eco
gnit
ive
4.R
outi
ne
man
ual
5.N
onro
uti
ne
man
ual
All
Mal
eF
emA
llM
ale
Fem
All
Mal
eF
emA
llM
ale
Fem
All
Mal
eF
em
1960
(Cen
sus)
50.0
54.6
37.0
50.0
58.4
26.4
50.0
48.6
53.8
50.0
43.2
69.2
50.0
56.5
31.6
1970
(Cen
sus)
52.5
57.5
41.5
51.1
61.7
27.5
52.2
49.8
57.5
54.0
44.9
74.4
46.9
54.1
30.8
1970
(Cen
sus)
51.9
56.4
41.8
50.7
60.8
28.1
53.1
50.8
58.2
53.5
44.7
73.3
46.2
53.2
30.7
1980
(Cen
sus)
54.9
58.2
49.2
55.4
63.3
41.8
52.9
50.0
58.0
55.1
44.6
73.3
44.0
53.2
28.1
1980
(CP
S)
53.2
56.6
47.9
53.3
61.4
40.4
51.8
50.0
54.8
53.8
43.3
70.4
44.4
55.0
27.5
1990
(CP
S)
56.2
57.4
54.6
58.6
62.7
53.0
48.3
48.1
48.6
52.3
42.8
65.5
41.8
53.1
26.3
1998
(CP
S)
58.7
59.3
58.0
62.2
63.9
59.9
44.4
46.6
41.6
49.2
41.5
59.3
41.3
52.6
26.5
B.
Dec
ompo
siti
onof
task
shif
tsin
tobe
twee
nan
dw
ith
inin
dust
ryco
mpo
nen
tsfo
rco
mbi
ned
gen
ders
(10
�an
nu
alch
ange
sin
mea
nta
skpe
rcen
tile
)
Tot
alB
twn
Wth
nT
otal
Btw
nW
thn
Tot
alB
wtn
Wth
nT
otal
Btw
nW
thn
Tot
alB
twn
Wth
n
1960
–197
02.
571.
740.
831.
15�
0.34
1.49
2.20
1.14
1.06
4.01
2.39
1.62
�3.
03�
2.28
�0.
7419
70–1
980
3.02
1.54
1.48
4.68
0.26
4.42
�0.
140.
33�
0.47
1.63
0.79
0.84
�2.
25�
1.00
�1.
2519
80–1
990
2.97
0.92
2.05
5.31
0.52
4.79
�3.
48�
1.42
�2.
07�
1.47
�0.
16�
1.31
�2.
58�
1.27
�1.
3119
90–1
998
3.12
0.67
2.45
4.48
0.54
3.94
�4.
88�
1.31
�3.
57�
3.88
�0.
38�
3.50
�0.
63�
0.31
�0.
31
Sou
rces
:Dic
tion
ary
ofO
ccu
pati
onal
Tit
les
[197
7],a
nd
alle
mpl
oyed
wor
kers
ages
18–
64,C
ensu
sIP
UM
S19
60,1
970,
1980
,CP
SM
OR
G19
80,1
990,
and
1998
.Sam
ples
use
dfo
rde
cada
lch
ange
sin
pan
elB
are
1960
–197
0,19
60an
d19
70C
ensu
s;19
70–1
980,
1970
and
1980
Cen
sus;
1980
–199
0,19
80an
d19
90C
PS
MO
RG
;19
90–1
998,
1990
and
1998
CP
SM
OR
G.T
wo
Cen
sus
1970
sam
ples
are
use
din
pan
els
Aan
dB
,on
eco
ded
for
con
sist
ency
wit
hth
e19
60C
ensu
soc
cupa
tion
code
san
da
seco
nd
code
dfo
rco
nsi
sten
cyw
ith
the
1980
Cen
sus
occu
pati
onco
des.
Dat
aar
eag
greg
ated
to11
20in
dust
ry-g
ende
r-ed
uca
tion
cell
sby
year
and
each
cell
isas
sign
eda
valu
eco
rres
pon
din
gto
its
ran
kin
the
1960
dist
ribu
tion
ofta
skin
put
(cal
cula
ted
acro
ssth
e11
20,
1960
task
cell
s).
Pan
elA
con
tain
sth
eem
ploy
men
t-w
eigh
ted
mea
nof
each
assi
gned
perc
enti
lein
the
indi
cate
dye
ar.
Pan
elB
pres
ents
ade
com
posi
tion
ofth
eag
greg
ate
chan
gein
task
inpu
tov
erth
ein
dica
ted
year
sin
tow
ith
inan
dbe
twee
nin
dust
ryco
mpo
nen
tsfo
r14
0co
nsi
sten
tC
ensu
sIn
dust
ryC
ode
(CIC
)in
dust
ries
(59
inm
anu
fact
uri
ng,
81in
non
man
ufa
ctu
rin
g).
See
Tab
leI
and
App
endi
x1
for
defi
nit
ion
san
dex
ampl
esof
task
vari
able
s.
1298 QUARTERLY JOURNAL OF ECONOMICS
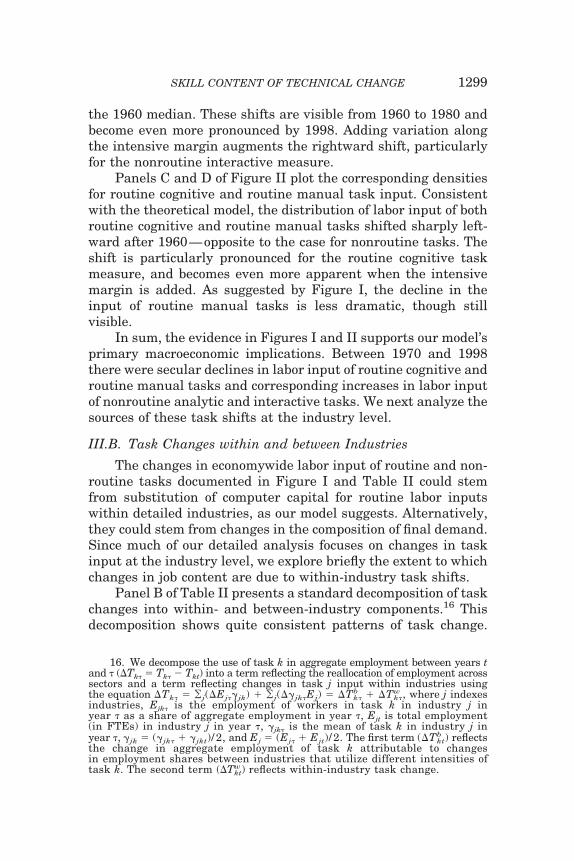
the 1960 median. These shifts are visible from 1960 to 1980 andbecome even more pronounced by 1998. Adding variation alongthe intensive margin augments the rightward shift, particularlyfor the nonroutine interactive measure.
Panels C and D of Figure II plot the corresponding densitiesfor routine cognitive and routine manual task input. Consistentwith the theoretical model, the distribution of labor input of bothroutine cognitive and routine manual tasks shifted sharply left-ward after 1960—opposite to the case for nonroutine tasks. Theshift is particularly pronounced for the routine cognitive taskmeasure, and becomes even more apparent when the intensivemargin is added. As suggested by Figure I, the decline in theinput of routine manual tasks is less dramatic, though stillvisible.
In sum, the evidence in Figures I and II supports our model’sprimary macroeconomic implications. Between 1970 and 1998there were secular declines in labor input of routine cognitive androutine manual tasks and corresponding increases in labor inputof nonroutine analytic and interactive tasks. We next analyze thesources of these task shifts at the industry level.
III.B. Task Changes within and between Industries
The changes in economywide labor input of routine and non-routine tasks documented in Figure I and Table II could stemfrom substitution of computer capital for routine labor inputswithin detailed industries, as our model suggests. Alternatively,they could stem from changes in the composition of final demand.Since much of our detailed analysis focuses on changes in taskinput at the industry level, we explore briefly the extent to whichchanges in job content are due to within-industry task shifts.
Panel B of Table II presents a standard decomposition of taskchanges into within- and between-industry components.16 Thisdecomposition shows quite consistent patterns of task change.
16. We decompose the use of task k in aggregate employment between years tand � (�Tk� � Tk� � Tkt) into a term reflecting the reallocation of employment acrosssectors and a term reflecting changes in task j input within industries usingthe equation �Tk� � ¥j(�Ej��jk) ¥j(��jk�Ej) � �Tk�
b �Tk�w , where j indexes
industries, Ejk� is the employment of workers in task k in industry j inyear � as a share of aggregate employment in year �, Ejt is total employment(in FTEs) in industry j in year �, �jk� is the mean of task k in industry j inyear �, �jk � (�jk� �jkt)/ 2, and Ej � (Ej� Ejt)/ 2. The first term (�Tkt
b ) reflectsthe change in aggregate employment of task k attributable to changesin employment shares between industries that utilize different intensities oftask k. The second term (�Tkt
w) reflects within-industry task change.
1299SKILL CONTENT OF TECHNICAL CHANGE

FIGURE IISmoothed Differences between the Density of Nonroutine Task Input
in 1960 and Subsequent YearsFigure II is constructed using Dictionary of Occupational Titles (DOT) task
measures by gender and occupation paired to employment data from 1960, 1980,and 1998 Census and Current Population Survey samples. Plots depict the changein the share of employment between 1960 and the indicated year at each 1960percentile of task input. All series use DOT 1977 data paired to employment datafor the indicated year except for series marked “1991 task measures,” which usetask data from 1991 DOT. See Table I and Appendix 1 for definitions andexamples of task variables.
1300 QUARTERLY JOURNAL OF ECONOMICS

Both the nonroutine analytic and nonroutine interactive taskmeasures show strong within-industry growth in each decadefollowing the 1960s. Moreover, the rate of within-industry growthof each input increases in each subsequent decade. Although, asnoted above, nonroutine analytic input also increased during the1960s, Table II shows that this was primarily a cross-industry
FIGURE II (CONTINUED)
1301SKILL CONTENT OF TECHNICAL CHANGE
phenomenon—i.e., due to sectoral shifts. After the 1960s, bycontrast, the growth in nonroutine task input was dominated bywithin-industry task shifts.
Trends in both routine cognitive and routine manual tasksshow a similarly striking pattern. Both types of routine taskinput increased during the 1960s, due to a combination of be-tween- and within-industry shifts. In the decades following, how-ever, input of both routine cognitive and routine manual taskssharply declined, and the bulk of these declines was due to with-in-industry shifts. Moreover, the rate of within-industry declineincreased in each subsequent decade.
As distinct from the other four task measures, we observesteady within- and between-industry shifts against nonroutinemanual tasks for the entire four decades of our sample. Since ourconceptual framework indicates that nonroutine manual tasksare largely orthogonal to computerization, we view this pattern asneither supportive nor at odds with our model.
In summary, the trends against routine cognitive and man-ual tasks and favoring nonroutine cognitive tasks that we seek toanalyze are dominated by within-industry shifts, particularlyfrom the 1970s forward. We next analyze whether computeriza-tion can explain these task shifts.17 Because our model makes noprediction for how computerizing industries will adjust demandfor nonroutine manual tasks, we do not include this variable inour industry-level analysis below (see Autor, Levy, and Murnane[2001] for detailed analysis).
IV. COMPUTERIZATION AND TASK CHANGE:INDUSTRY LEVEL RELATIONSHIPS
As industries adopt computer technology, our model predictsthat they will simultaneously reduce labor input of routine cog-nitive and manual tasks and increase labor input of nonroutinecognitive tasks. We test these hypotheses below.
17. Our model also implies that the expenditure shares of routine-task-intensive industries should have increased as � declined. By contrast, the predic-tion for the employment share of routine-task-intensive industries is ambiguoussince these industries should have differentially substituted computer capital forlabor input. Because our data measure employment, not expenditures, we areunable to test the implication for expenditure shares. Closely related, computer-intensive industries should have experienced relatively larger gains in laborproductivity as � declined. Stiroh [2002] presents evidence that this occurred inthe 1990s.
1302 QUARTERLY JOURNAL OF ECONOMICS
IV.A. Industry Computerization and Task Trendsover Four Decades
We begin by estimating a model for the within-industry re-lationship between computer adoption and task change over fourdecades. Specifically, we fit the equation
(13) �Tjk� � � � ��Cj � εjk�,
where �Tjk� � Tjk� � Tjkt is the change in industry j’s input oftask k between years t and � and �Cj is the annual change in thepercentage of industry workers using a computer at their jobsbetween 1984 and 1997 (estimated from the October CurrentPopulation Survey supplements). While our model predicts thatcomputer adoption should be highly correlated with industry taskchange during the computer era, we would not anticipate a simi-lar relationship for the precomputer era of the 1960s. Accord-ingly, we estimate equation (13) separately for each of the fourdecades in our sample. This allows us to confirm that the rela-tionship between computerization and industry task change inthe 1970s–1990s does not reflect trends that predate the com-puter era.18
Estimates of equation (13) for each of the four task measuresare given in Table III. The first two panels show that during the1970s, 1980s, and 1990s, rapidly computerizing industries raisedtheir input of nonroutine analytic and interactive tasks signifi-cantly more than others. For example, the point estimate of 12.04(standard error of 4.74) in column 1 of panel A indicates thatbetween 1990 and 1998, a 10 percentage point increase in com-puter use was associated with a 1.2 centile annualized increase inlabor input of nonroutine analytic tasks. To evaluate the magni-tude of this relationship, note that the mean annualized industrylevel rise in nonroutine analytic task input during 1990–1998,tabulated immediately below the regression estimate, was 2.5percentiles. By comparison, the intercept of the bivariate regres-sion for this period is 0.1. Hence, almost the entirety of theobserved within-industry change in nonroutine analytic input is“explained” by the computerization measure. Similar compari-sons confirm that the relationship between industry computer-ization and rising input of nonroutine interactive and analytic
18. As noted by Autor, Katz, and Krueger [1998] and Bresnahan [1999], theera of rapid computer investment began in the 1970s. Desktop computing becamewidespread in the 1980s and 1990s.
1303SKILL CONTENT OF TECHNICAL CHANGE
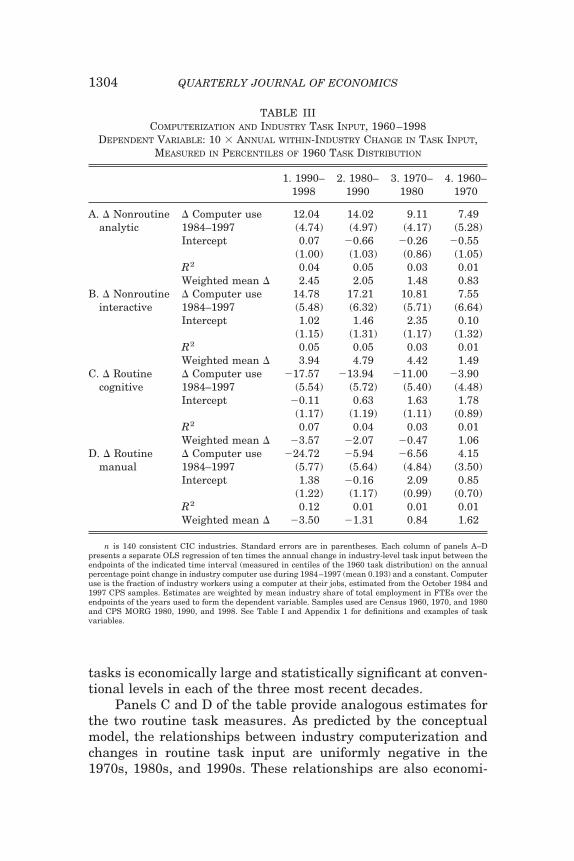
tasks is economically large and statistically significant at conven-tional levels in each of the three most recent decades.
Panels C and D of the table provide analogous estimates forthe two routine task measures. As predicted by the conceptualmodel, the relationships between industry computerization andchanges in routine task input are uniformly negative in the1970s, 1980s, and 1990s. These relationships are also economi-
TABLE IIICOMPUTERIZATION AND INDUSTRY TASK INPUT, 1960–1998
DEPENDENT VARIABLE: 10 � ANNUAL WITHIN-INDUSTRY CHANGE IN TASK INPUT,MEASURED IN PERCENTILES OF 1960 TASK DISTRIBUTION
1. 1990–1998
2. 1980–1990
3. 1970–1980
4. 1960–1970
A. � Nonroutineanalytic
� Computer use 12.04 14.02 9.11 7.491984–1997 (4.74) (4.97) (4.17) (5.28)Intercept 0.07 �0.66 �0.26 �0.55
(1.00) (1.03) (0.86) (1.05)R2 0.04 0.05 0.03 0.01Weighted mean � 2.45 2.05 1.48 0.83
B. � Nonroutineinteractive
� Computer use 14.78 17.21 10.81 7.551984–1997 (5.48) (6.32) (5.71) (6.64)Intercept 1.02 1.46 2.35 0.10
(1.15) (1.31) (1.17) (1.32)R2 0.05 0.05 0.03 0.01Weighted mean � 3.94 4.79 4.42 1.49
C. � Routinecognitive
� Computer use �17.57 �13.94 �11.00 �3.901984–1997 (5.54) (5.72) (5.40) (4.48)Intercept �0.11 0.63 1.63 1.78
(1.17) (1.19) (1.11) (0.89)R2 0.07 0.04 0.03 0.01Weighted mean � �3.57 �2.07 �0.47 1.06
D. � Routinemanual
� Computer use �24.72 �5.94 �6.56 4.151984–1997 (5.77) (5.64) (4.84) (3.50)Intercept 1.38 �0.16 2.09 0.85
(1.22) (1.17) (0.99) (0.70)R2 0.12 0.01 0.01 0.01Weighted mean � �3.50 �1.31 0.84 1.62
n is 140 consistent CIC industries. Standard errors are in parentheses. Each column of panels A–Dpresents a separate OLS regression of ten times the annual change in industry-level task input between theendpoints of the indicated time interval (measured in centiles of the 1960 task distribution) on the annualpercentage point change in industry computer use during 1984–1997 (mean 0.193) and a constant. Computeruse is the fraction of industry workers using a computer at their jobs, estimated from the October 1984 and1997 CPS samples. Estimates are weighted by mean industry share of total employment in FTEs over theendpoints of the years used to form the dependent variable. Samples used are Census 1960, 1970, and 1980and CPS MORG 1980, 1990, and 1998. See Table I and Appendix 1 for definitions and examples of taskvariables.
1304 QUARTERLY JOURNAL OF ECONOMICS

cally large and in most cases statistically significant. For exam-ple, the computerization measure explains the entirety of thewithin-industry decline in routine task input during the 1990s,and more than explains this decline in the 1980s and 1970s.
A notable pattern for all four task measures is that therelationship between computerization and industry task changetends to become larger in absolute magnitude with each passingdecade. This suggests a secularly rising relationship betweencomputerization and task change. The final column of Table IIItests for this rise by estimating equation (13) for the 1960s, adecade during which computerization is unlikely to have stronglyinfluenced task demands. Reassuringly, there are no significantrelationships between computerization and task change in thisdecade. And in one case, the coefficient is of the opposite sign asin later decades. Hence, these estimates suggest that the rela-tionship between industry task shifts and computer adoptioneither commenced or substantially accelerated during the com-puter era, and not before.19
IV.B. Using Composite DOT Variables
Though we view the selected task measures as the mostappropriate available from the DOT, we are sensitive to theconcern that the choice of variables could be viewed as arbitrary.One way to test their appropriateness is to use alternative com-posite variables. We used principal components analyses (PCA) topool variation from each selected DOT task measure with severalother plausible alternatives and estimated equation (13) usingthese composites.20 The details of our compositing exercise areprovided in the Data Appendix, and the results of the compositeestimation are found in Appendix 2. A limitation of this exerciseis that the variables used in the composites do not in our view
19. We also estimated the models in Table III separately by gender and formanufacturing and nonmanufacturing sectors. The pattern of results is similar inall cases. For both genders, computer investment is a significant predictor ofreductions in routine labor input of cognitive and manual tasks and increases innonroutine analytic input. For females the relationship between computerizationand nonroutine interactive tasks is positive but insignificant. The magnitude ofthe relationship between computerization and nonroutine tasks is somewhatlarger in manufacturing than nonmanufacturing, and the reverse is true forroutine tasks. Further details are available from the authors.
20. The PCA extracts eigenvectors that maximize common variation amongselected measures, each of which is standardized with mean zero and varianceone, subject to the constraint that the sum of squared weights in the eigenvectorequals one. It can be shown that if measurement error in the selected variables isclassical (i.e., white noise), the PCA extracts maximal nonerror variation.
1305SKILL CONTENT OF TECHNICAL CHANGE
correspond as closely to the intended construct as our primarymeasures.
As visible in the table, the qualitative trends in the compositerelationships are comparable to those using our preferred mea-sures in Table III. In particular, industry computerization isassociated with sharp declines in routine cognitive and manuallabor inputs and growth in nonroutine analytic and interactivelabor inputs. Moreover, these relationships typically becomestronger in successive decades. Contrary to expectations, how-ever, the composite measure for routine cognitive input is onlysignificant in the most recent decade and the composite measurefor nonroutine interactive input is statistically significant in the1960s. Thus, while our results are generally robust to variablechoice, this exercise underscores that variable choice does matter.A data source specifically designed to measure changes in work-place input of routine and nonroutine cognitive tasks over a longtime horizon would clearly provide a more complete test of themodel. Given the absence of such a data source for the UnitedStates, we view the evidence provided by the DOT as uniquelyinformative.21
IV.C. Employing Contemporaneous Measures of Computerand Capital Investment
A limitation of the CPS computer measure used so far is thatit is only available for the 1980s and 1990s. To provide morecomprehensive measures of computer and capital investmentavailable for the entire 1959–1998 period, we draw on the Na-tional Income and Product Accounts (NIPA), which provides de-tailed data on capital stocks across 42 major industries excludinggovernment [U. S. Department of Commerce 2002a, 2002b]. As ameasure of industry computerization, we calculated the log of realinvestment in computer hardware, software and peripherals perfull-time equivalent employee (FTE) over the course of each de-cade. To distinguish the relationship between task change andcomputerization from overall capital-skill complementarity[Griliches 1969], we construct two variables to control for capital
21. Spitz [2003] studies the predictions of our task model using German datafrom 1979–1999, which contains far more detailed and precise information onworkplace tasks than is available from the DOT. Consistent with the predictionsof the model, Spitz reports that computer capital substitutes for repetitive manualand repetitive cognitive skills and complements analytical and interactive skills.See also Bartel, Ichniowski, and Shaw [2000] and Ichniowski and Shaw [2003] forquantitative and case study evidence.
1306 QUARTERLY JOURNAL OF ECONOMICS
deepening: the log of capital investment flow per worker and thelog capital to labor ratio.
Using these data, we fit stacked first-difference industry taskshift models of the form,
(14) �Tjk� � � � �70–80 � �80–90 � �90–98 � �CIj� � �KIj� � εjk�,
where CIj� is industry j’s real log investment in computer capitalper FTE over the contemporaneous decade in industry, KIj� is theanalogous measure for real capital investment, the �’s are timedummies equal to one in each of the decades post-1960 corre-sponding to their subscripts, and � is a common intercept. In thisequation, the �’s measure the trend change in industry task inputin the 1970s, 1980s, and 1990s relative to the base period of the1960s.
Estimates of equation (14) are found in Table IV. Two sets ofHuber-White standard errors are tabulated for each model. Thosein parentheses account for the fact that the NIPA capital mea-sures are observed at a more aggregate level than the dependentvariables measured from the CPS and Census (42 sectors versus123 sectors for this exercise). The standard errors in bracketsadditionally account for potential serial correlation in industrytask changes over succeeding decades (cf. Bertrand, Duflo, andMullainathan [2004]).
As is visible in the table, the NIPA measure of computerinvestment consistently predicts relative declines in industry in-put of both routine cognitive and manual tasks and growth ininput of nonroutine analytic and interactive tasks. How large arethese relationships? We can gauge the model’s explanatory powerby comparing the magnitude of the estimated �’s conditional oncomputer investment with the unconditional within-industrytrends in task input observed for each decade. To facilitate thiscomparison, the bottom panel of Table IV tabulates the uncondi-tional decadal trends. As with the Table III estimates, we findthat industries making relatively greater investments in com-puter capital are responsible for the bulk of the observed substi-tution away from routine cognitive and manual tasks and towardnonroutine analytic and interactive tasks. Holding computer in-vestment constant, we can explain more than 100 percent of theoverall trend increase in nonroutine cognitive/analytic task input,a substantial part of the trend increase in nonroutine cognitive/interactive input, and substantial parts of the trend decreases inroutine cognitive and routine manual inputs.
1307SKILL CONTENT OF TECHNICAL CHANGE
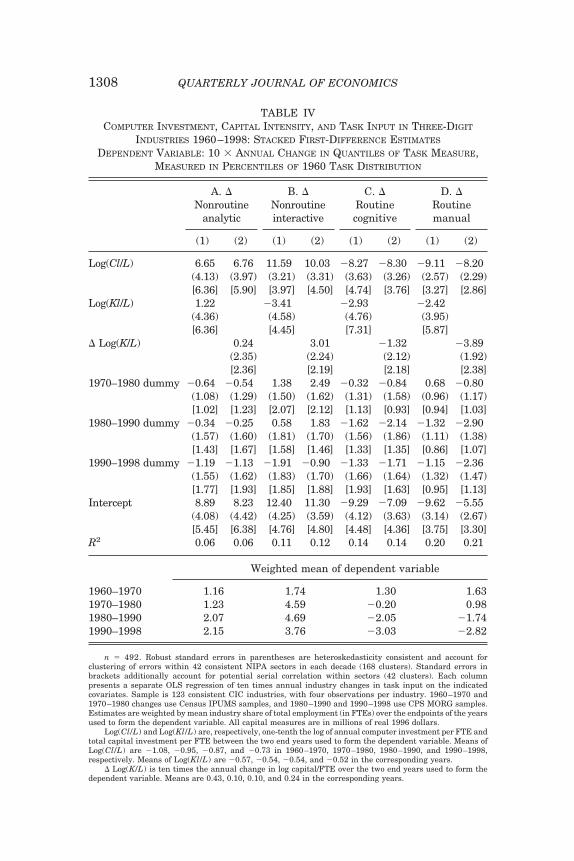
TABLE IVCOMPUTER INVESTMENT, CAPITAL INTENSITY, AND TASK INPUT IN THREE-DIGIT
INDUSTRIES 1960–1998: STACKED FIRST-DIFFERENCE ESTIMATES
DEPENDENT VARIABLE: 10 � ANNUAL CHANGE IN QUANTILES OF TASK MEASURE,MEASURED IN PERCENTILES OF 1960 TASK DISTRIBUTION
A. �Nonroutine
analytic
B. �Nonroutineinteractive
C. �Routinecognitive
D. �Routinemanual
(1) (2) (1) (2) (1) (2) (1) (2)
Log(Cl/L) 6.65 6.76 11.59 10.03 �8.27 �8.30 �9.11 �8.20(4.13) (3.97) (3.21) (3.31) (3.63) (3.26) (2.57) (2.29)[6.36] [5.90] [3.97] [4.50] [4.74] [3.76] [3.27] [2.86]
Log(Kl/L) 1.22 �3.41 �2.93 �2.42(4.36) (4.58) (4.76) (3.95)[6.36] [4.45] [7.31] [5.87]
� Log(K/L) 0.24 3.01 �1.32 �3.89(2.35) (2.24) (2.12) (1.92)[2.36] [2.19] [2.18] [2.38]
1970–1980 dummy �0.64 �0.54 1.38 2.49 �0.32 �0.84 0.68 �0.80(1.08) (1.29) (1.50) (1.62) (1.31) (1.58) (0.96) (1.17)[1.02] [1.23] [2.07] [2.12] [1.13] [0.93] [0.94] [1.03]
1980–1990 dummy �0.34 �0.25 0.58 1.83 �1.62 �2.14 �1.32 �2.90(1.57) (1.60) (1.81) (1.70) (1.56) (1.86) (1.11) (1.38)[1.43] [1.67] [1.58] [1.46] [1.33] [1.35] [0.86] [1.07]
1990–1998 dummy �1.19 �1.13 �1.91 �0.90 �1.33 �1.71 �1.15 �2.36(1.55) (1.62) (1.83) (1.70) (1.66) (1.64) (1.32) (1.47)[1.77] [1.93] [1.85] [1.88] [1.93] [1.63] [0.95] [1.13]
Intercept 8.89 8.23 12.40 11.30 �9.29 �7.09 �9.62 �5.55(4.08) (4.42) (4.25) (3.59) (4.12) (3.63) (3.14) (2.67)[5.45] [6.38] [4.76] [4.80] [4.48] [4.36] [3.75] [3.30]
R2 0.06 0.06 0.11 0.12 0.14 0.14 0.20 0.21
Weighted mean of dependent variable
1960–1970 1.16 1.74 1.30 1.631970–1980 1.23 4.59 �0.20 0.981980–1990 2.07 4.69 �2.05 �1.741990–1998 2.15 3.76 �3.03 �2.82
n � 492. Robust standard errors in parentheses are heteroskedasticity consistent and account forclustering of errors within 42 consistent NIPA sectors in each decade (168 clusters). Standard errors inbrackets additionally account for potential serial correlation within sectors (42 clusters). Each columnpresents a separate OLS regression of ten times annual industry changes in task input on the indicatedcovariates. Sample is 123 consistent CIC industries, with four observations per industry. 1960–1970 and1970–1980 changes use Census IPUMS samples, and 1980–1990 and 1990–1998 use CPS MORG samples.Estimates are weighted by mean industry share of total employment (in FTEs) over the endpoints of the yearsused to form the dependent variable. All capital measures are in millions of real 1996 dollars.
Log(Cl/L) and Log(Kl/L) are, respectively, one-tenth the log of annual computer investment per FTE andtotal capital investment per FTE between the two end years used to form the dependent variable. Means ofLog(Cl/L) are �1.08, �0.95, �0.87, and �0.73 in 1960–1970, 1970–1980, 1980–1990, and 1990–1998,respectively. Means of Log(Kl/L) are �0.57, �0.54, �0.54, and �0.52 in the corresponding years.
� Log(K/L) is ten times the annual change in log capital/FTE over the two end years used to form thedependent variable. Means are 0.43, 0.10, 0.10, and 0.24 in the corresponding years.
1308 QUARTERLY JOURNAL OF ECONOMICS
A notable pattern in Table IV is that the coefficients on thecapital investment and capital intensity variables are economi-cally small and in most cases insignificant. This indicates thataggregate capital deepening—apart from computer investment—explains little of the observed change in task input.22 We havealso explored a large number of variations of these models includ-ing estimating separate models for manufacturing and nonmanu-facturing industries and for male and female task input; subdi-viding capital investment into equipment and structures invest-ment; subdividing computer investment into hardware andsoftware investment; and controlling for industries’ log output,capital-output ratios, and import and export penetration. Thesetests confirm the overall robustness of our results.
V. TASK CHANGE WITHIN EDUCATION GROUPS AND OCCUPATIONS
The analyses above establish that industries undergoingrapid computerization reduced labor input of routine cognitiveand manual tasks and increased labor input of nonroutine inter-active and analytic tasks. Since better educated workers arelikely to hold a comparative advantage in nonroutine versusroutine tasks, one interpretation of these results is that theyconfirm the established pattern of increasing relative educationalintensity in computerizing industries over the past several de-cades. While we do not disagree with this interpretation, our taskframework makes a broader claim, namely that changes in thedemand for workplace tasks, stemming from technologicalchange, are an underlying cause—not merely a reflection—ofrelative demand shifts favoring educated labor. To test thisbroader implication, we exploit the unique features of the DOT toanalyze two novel margins of task change: changes within edu-cation groups and changes within occupations.
V.A. Within-Industry Task Shifts by Education Group:1980–1998
We showed in Tables III and IV that increased industrycomputerization predicts increased nonroutine cognitive activityand reduced routine cognitive and manual activities. Why does
22. This pattern echoes the findings of Berman, Bound, and Griliches [1994],Autor, Katz, and Krueger [1998], and Bresnahan, Brynjolfsson, and Hitt [2002]for skill upgrading.
1309SKILL CONTENT OF TECHNICAL CHANGE
this occur? One possibility is that as industries purchase com-puter capital, they hire better educated workers who specialize inthese tasks. Alternatively, industries may change the task as-signments of workers with given educational attainments, reduc-ing their allocation to routine tasks and raising it to nonroutinetasks. We explore the relative importance of these two channelsby estimating a variant of equation (13) for within-industry taskupgrading by education group. Specifically, we estimate themodel,
(15) �Tijk� � �i � �i�Cj � εijk�,
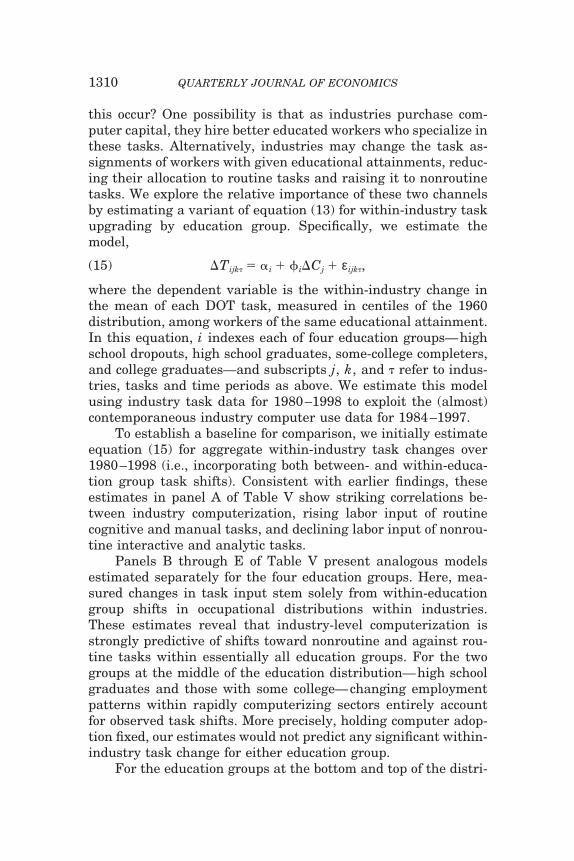
where the dependent variable is the within-industry change inthe mean of each DOT task, measured in centiles of the 1960distribution, among workers of the same educational attainment.In this equation, i indexes each of four education groups—highschool dropouts, high school graduates, some-college completers,and college graduates—and subscripts j, k, and � refer to indus-tries, tasks and time periods as above. We estimate this modelusing industry task data for 1980–1998 to exploit the (almost)contemporaneous industry computer use data for 1984–1997.
To establish a baseline for comparison, we initially estimateequation (15) for aggregate within-industry task changes over1980–1998 (i.e., incorporating both between- and within-educa-tion group task shifts). Consistent with earlier findings, theseestimates in panel A of Table V show striking correlations be-tween industry computerization, rising labor input of routinecognitive and manual tasks, and declining labor input of nonrou-tine interactive and analytic tasks.
Panels B through E of Table V present analogous modelsestimated separately for the four education groups. Here, mea-sured changes in task input stem solely from within-educationgroup shifts in occupational distributions within industries.These estimates reveal that industry-level computerization isstrongly predictive of shifts toward nonroutine and against rou-tine tasks within essentially all education groups. For the twogroups at the middle of the education distribution—high schoolgraduates and those with some college—changing employmentpatterns within rapidly computerizing sectors entirely accountfor observed task shifts. More precisely, holding computer adop-tion fixed, our estimates would not predict any significant within-industry task change for either education group.
For the education groups at the bottom and top of the distri-
1310 QUARTERLY JOURNAL OF ECONOMICS
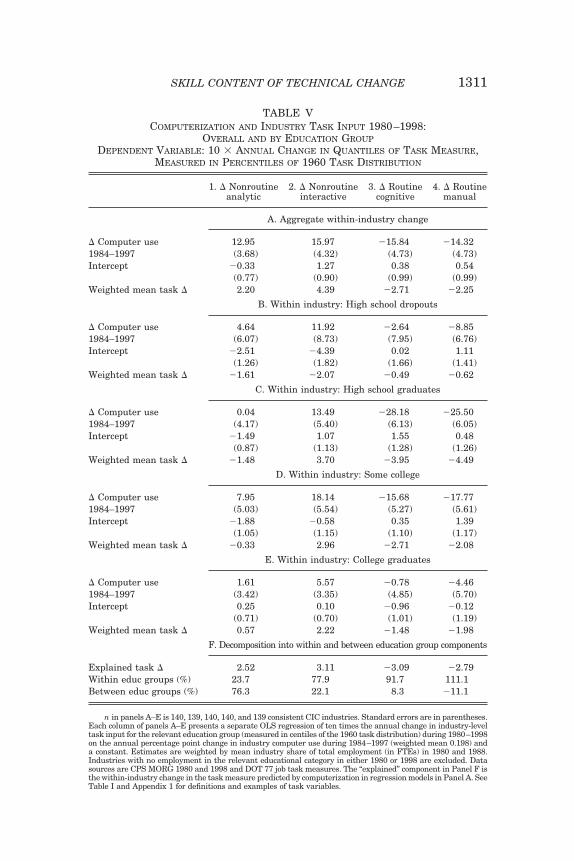
TABLE VCOMPUTERIZATION AND INDUSTRY TASK INPUT 1980–1998:
OVERALL AND BY EDUCATION GROUPDEPENDENT VARIABLE: 10 � ANNUAL CHANGE IN QUANTILES OF TASK MEASURE,
MEASURED IN PERCENTILES OF 1960 TASK DISTRIBUTION
1. � Nonroutineanalytic
2. � Nonroutineinteractive
3. � Routinecognitive
4. � Routinemanual
A. Aggregate within-industry change
� Computer use 12.95 15.97 �15.84 �14.321984–1997 (3.68) (4.32) (4.73) (4.73)Intercept �0.33 1.27 0.38 0.54
(0.77) (0.90) (0.99) (0.99)Weighted mean task � 2.20 4.39 �2.71 �2.25
B. Within industry: High school dropouts
� Computer use 4.64 11.92 �2.64 �8.851984–1997 (6.07) (8.73) (7.95) (6.76)Intercept �2.51 �4.39 0.02 1.11
(1.26) (1.82) (1.66) (1.41)Weighted mean task � �1.61 �2.07 �0.49 �0.62
C. Within industry: High school graduates
� Computer use 0.04 13.49 �28.18 �25.501984–1997 (4.17) (5.40) (6.13) (6.05)Intercept �1.49 1.07 1.55 0.48
(0.87) (1.13) (1.28) (1.26)Weighted mean task � �1.48 3.70 �3.95 �4.49
D. Within industry: Some college
� Computer use 7.95 18.14 �15.68 �17.771984–1997 (5.03) (5.54) (5.27) (5.61)Intercept �1.88 �0.58 0.35 1.39
(1.05) (1.15) (1.10) (1.17)Weighted mean task � �0.33 2.96 �2.71 �2.08
E. Within industry: College graduates
� Computer use 1.61 5.57 �0.78 �4.461984–1997 (3.42) (3.35) (4.85) (5.70)Intercept 0.25 0.10 �0.96 �0.12
(0.71) (0.70) (1.01) (1.19)Weighted mean task � 0.57 2.22 �1.48 �1.98
F. Decomposition into within and between education group components
Explained task � 2.52 3.11 �3.09 �2.79Within educ groups (%) 23.7 77.9 91.7 111.1Between educ groups (%) 76.3 22.1 8.3 �11.1
n in panels A–E is 140, 139, 140, 140, and 139 consistent CIC industries. Standard errors are in parentheses.Each column of panels A–E presents a separate OLS regression of ten times the annual change in industry-leveltask input for the relevant education group (measured in centiles of the 1960 task distribution) during 1980–1998on the annual percentage point change in industry computer use during 1984–1997 (weighted mean 0.198) anda constant. Estimates are weighted by mean industry share of total employment (in FTEs) in 1980 and 1988.Industries with no employment in the relevant educational category in either 1980 or 1998 are excluded. Datasources are CPS MORG 1980 and 1998 and DOT 77 job task measures. The “explained” component in Panel F isthe within-industry change in the task measure predicted by computerization in regression models in Panel A. SeeTable I and Appendix 1 for definitions and examples of task variables.
1311SKILL CONTENT OF TECHNICAL CHANGE

bution—college graduates and high school dropouts—similarpatterns prevail, but they are less precisely estimated. In allcases, the estimates are of the expected sign, but none is statis-tically significant. For college graduates, this is likely to reflect“topping out,” since this education group was already at theextreme of the distribution for all tasks. We are less certain whythe relationships are weaker for high school dropouts, but onepossibility is that this group has insufficient human capital to beeffectively redeployed to alternative job tasks.
To assess whether these within-education group shifts are aquantitatively important component of the overall change in in-dustry task content, panel F of Table V presents a decompositionof industry task changes into within and between educationgroup components. This exercise shows that in every case, within-education group task upgrading explains a substantial share, 24to 111 percent, of total task upgrading over these two decades.For example, the annual within-industry change in nonroutineinteractive tasks over the period 1980–1998 is 4.4 centiles perdecade, of which 3.1 centiles (71 percent) is accounted for bycontemporaneous industry computerization. Within-educationgroup task changes explain the bulk of these shifts: 78 percent ofthe explained component and 55 percent of the total. Subdividingthe explained within-education group component further, 59 per-cent is due to changes in task assignment among high schoolgraduates and those with some college, and the rest is equallyaccounted for by task shifts among college graduates and highschool dropouts.
This exercise demonstrates that within-education groupshifts in task content are the primary channel through which thestructure of workplace tasks has shifted over the past two de-cades. Furthermore, a large portion of the within-education groupchanges are accounted for by cross-industry patterns of computeradoption. This suggests to us that task change is antecedent toeducational upgrading, rather than merely a reflection of it.
V.B. Task Shifts within Occupations
The analyses above exploit shifts in occupational composi-tion—the extensive margin—to quantify changes in task input.This approach is imperfect since it assumes that the tasks per-formed within occupations are static, which is unlikely to beaccurate over long time intervals. Moreover, our task frameworkimplies that this assumption should be violated in a specific
1312 QUARTERLY JOURNAL OF ECONOMICS
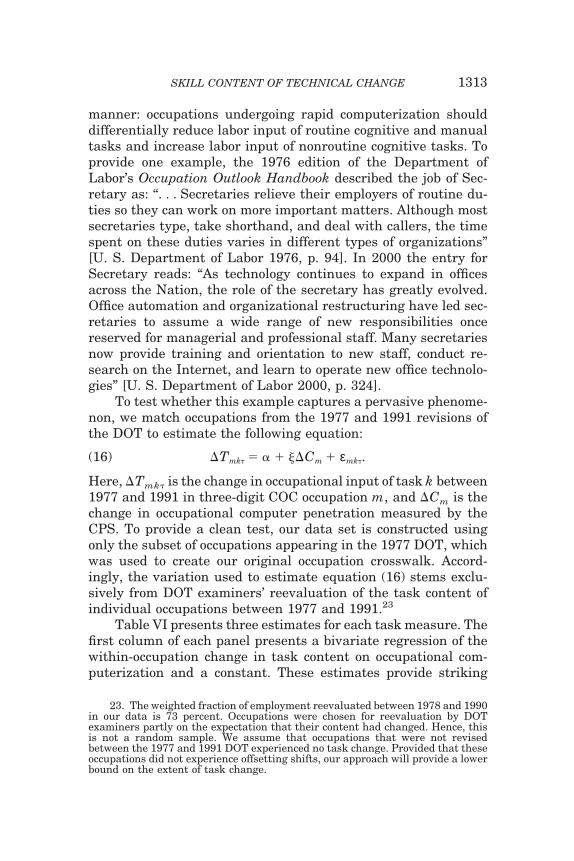
manner: occupations undergoing rapid computerization shoulddifferentially reduce labor input of routine cognitive and manualtasks and increase labor input of nonroutine cognitive tasks. Toprovide one example, the 1976 edition of the Department ofLabor’s Occupation Outlook Handbook described the job of Sec-retary as: “. . . Secretaries relieve their employers of routine du-ties so they can work on more important matters. Although mostsecretaries type, take shorthand, and deal with callers, the timespent on these duties varies in different types of organizations”[U. S. Department of Labor 1976, p. 94]. In 2000 the entry forSecretary reads: “As technology continues to expand in officesacross the Nation, the role of the secretary has greatly evolved.Office automation and organizational restructuring have led sec-retaries to assume a wide range of new responsibilities oncereserved for managerial and professional staff. Many secretariesnow provide training and orientation to new staff, conduct re-search on the Internet, and learn to operate new office technolo-gies” [U. S. Department of Labor 2000, p. 324].
To test whether this example captures a pervasive phenome-non, we match occupations from the 1977 and 1991 revisions ofthe DOT to estimate the following equation:
(16) �Tmk� � � � ��Cm � εmk�.
Here, �Tmk� is the change in occupational input of task k between1977 and 1991 in three-digit COC occupation m, and �Cm is thechange in occupational computer penetration measured by theCPS. To provide a clean test, our data set is constructed usingonly the subset of occupations appearing in the 1977 DOT, whichwas used to create our original occupation crosswalk. Accord-ingly, the variation used to estimate equation (16) stems exclu-sively from DOT examiners’ reevaluation of the task content ofindividual occupations between 1977 and 1991.23
Table VI presents three estimates for each task measure. Thefirst column of each panel presents a bivariate regression of thewithin-occupation change in task content on occupational com-puterization and a constant. These estimates provide striking
23. The weighted fraction of employment reevaluated between 1978 and 1990in our data is 73 percent. Occupations were chosen for reevaluation by DOTexaminers partly on the expectation that their content had changed. Hence, thisis not a random sample. We assume that occupations that were not revisedbetween the 1977 and 1991 DOT experienced no task change. Provided that theseoccupations did not experience offsetting shifts, our approach will provide a lowerbound on the extent of task change.
1313SKILL CONTENT OF TECHNICAL CHANGE
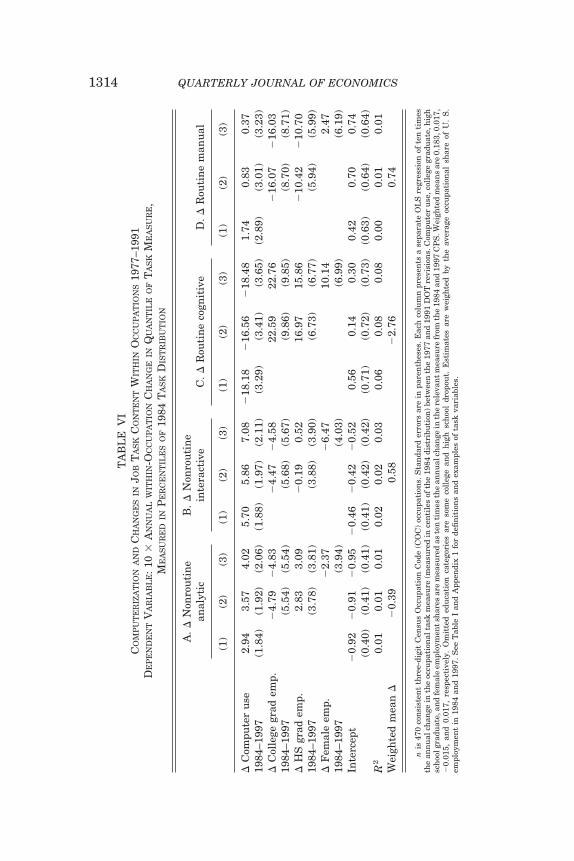
TA
BL
EV
IC
OM
PU
TE
RIZ
AT
ION
AN
DC
HA
NG
ES
INJO
BT
AS
KC
ON
TE
NT
WIT
HIN
OC
CU
PA
TIO
NS
1977
–199
1D
EP
EN
DE
NT
VA
RIA
BL
E:
10�
AN
NU
AL
WIT
HIN
-OC
CU
PA
TIO
NC
HA
NG
EIN
QU
AN
TIL
EO
FT
AS
KM
EA
SU
RE,
ME
AS
UR
ED
INP
ER
CE
NT
ILE
SO
F19
84T
AS
KD
IST
RIB
UT
ION
A.
�N
onro
uti
ne
anal
ytic
B.
�N
onro
uti
ne
inte
ract
ive
C.
�R
outi
ne
cogn
itiv
eD
.�
Rou
tin
em
anu
al
(1)
(2)
(3)
(1)
(2)
(3)
(1)
(2)
(3)
(1)
(2)
(3)
�C
ompu
ter
use
2.94
3.57
4.02
5.70
5.86
7.08
�18
.18
�16
.56
�18
.48
1.74
0.83
0.37
1984
–199
7(1
.84)
(1.9
2)(2
.06)
(1.8
8)(1
.97)
(2.1
1)(3
.29)
(3.4
1)(3
.65)
(2.8
9)(3
.01)
(3.2
3)�
Col
lege
grad
emp.
�4.
79�
4.83
�4.
47�
4.58
22.5
922
.76
�16
.07
�16
.03
1984
–199
7(5
.54)
(5.5
4)(5
.68)
(5.6
7)(9
.86)
(9.8
5)(8
.70)
(8.7
1)�
HS
grad
emp.
2.83
3.09
�0.
190.
5216
.97
15.8
6�
10.4
2�
10.7
019
84–1
997
(3.7
8)(3
.81)
(3.8
8)(3
.90)
(6.7
3)(6
.77)
(5.9
4)(5
.99)
�F
emal
eem
p.�
2.37
�6.
4710
.14
2.47
1984
–199
7(3
.94)
(4.0
3)(6
.99)
(6.1
9)In
terc
ept
�0.
92�
0.91
�0.
95�
0.46
�0.
42�
0.52
0.56
0.14
0.30
0.42
0.70
0.74
(0.4
0)(0
.41)
(0.4
1)(0
.41)
(0.4
2)(0
.42)
(0.7
1)(0
.72)
(0.7
3)(0
.63)
(0.6
4)(0
.64)
R2
0.01
0.01
0.01
0.02
0.02
0.03
0.06
0.08
0.08
0.00
0.01
0.01
Wei
ghte
dm
ean
��
0.39
0.58
�2.
760.
74
nis
470
con
sist
ent
thre
e-di
git
Cen
sus
Occ
upa
tion
Cod
e(C
OC
)oc
cupa
tion
s.S
tan
dard
erro
rsar
ein
pare
nth
eses
.Eac
hco
lum
npr
esen
tsa
sepa
rate
OL
Sre
gres
sion
ofte
nti
mes
the
ann
ual
chan
gein
the
occu
pati
onal
task
mea
sure
(mea
sure
din
cen
tile
sof
the
1984
dist
ribu
tion
)bet
wee
nth
e19
77an
d19
91D
OT
revi
sion
s.C
ompu
ter
use
,col
lege
grad
uat
e,h
igh
sch
oolg
radu
ate,
and
fem
ale
empl
oym
ent
shar
esar
em
easu
red
aste
nti
mes
the
ann
ual
chan
gein
the
rele
van
tm
easu
refr
omth
e19
84an
d19
97C
PS
.Wei
ghte
dm
ean
sar
e0.
183,
0.01
7,�
0.01
5,an
d0.
017,
resp
ecti
vely
.O
mit
ted
edu
cati
onca
tego
ries
are
som
eco
lleg
ean
dh
igh
sch
ool
drop
out.
Est
imat
esar
ew
eigh
ted
byth
eav
erag
eoc
cupa
tion
alsh
are
ofU
.S
.em
ploy
men
tin
1984
and
1997
.S
eeT
able
Ian
dA
ppen
dix
1fo
rde
fin
itio
ns
and
exam
ples
ofta
skva
riab
les.
1314 QUARTERLY JOURNAL OF ECONOMICS

confirmation of the predicted relationships between computeriza-tion and task change. Occupations making relatively large in-creases in computer use saw relatively greater increases in laborinput of nonroutine cognitive analytic and interactive tasks andlarger declines in labor input of routine cognitive skills. Each ofthese relationships is significant at the 10 percent level orgreater, and is of sizable magnitude: for all three cognitive taskmeasures, the computerization variable more than fully accountsfor the observed change in occupational task input. Only in thecase of routine manual tasks, where the point estimate is close tozero, do we fail to find the expected relationship.
To examine whether intra-occupational task changes are im-plicitly captured by shifts in the educational and gender distri-bution of employees within an occupation, we add controls for thecontemporaneous change in the percentage of workers in anoccupation who are college graduates, high school graduates, andfemales.24 As is visible in specifications 2 and 3, the relationshipbetween computerization and within-occupation task change issurprisingly insensitive to these controls. In fact, standard mea-sures of educational and gender composition are poor proxies forchanges in job tasks observed by DOT examiners. In net, thesefindings demonstrate that shifts in job content away from routinetasks and toward nonroutine cognitive tasks are a pervasivefeature of the data and are concentrated in industries and occu-pations that adopted computer technology most rapidly.
VI. QUANTIFYING THE MAGNITUDE OF TASK STRUCTURE CHANGES
What is the economic significance of the change in the tasksperformed by the U. S. labor force during the last three decades?The answer is not immediately apparent since units of task inputdo not have a familiar scale. To quantify task shifts in concreteeconomic terms, we draw together task changes within indus-tries, education groups, and occupations to calculate their poten-tial contribution to the demand for college-educated labor during1970 to 1998. This analysis proceeds in three steps.
We begin by estimating a “fixed coefficients” model of educa-
24. For consistency of measurement, we employ CPS computerization, edu-cation, and gender means by occupation for 1984 to 1997. We cannot perform ananalogous exercise using the NIPA investment measures since they are notavailable for occupations.
1315SKILL CONTENT OF TECHNICAL CHANGE
tion requirements in industries and occupations as a function oftheir task inputs:
(17) College Sharej � � � �k�1
4
�k � Tjk � εj.
In this equation, College Sharej is the college-equivalent share ofemployment (in FTEs) in industry or occupation j at the midpointof our samples, and the Tj
k’s measure industry or occupation taskinput in centiles during the same period.25 The coefficients, �̂k,obtained from (17) provide an estimate of college-equivalent labordemand as a function of industry or occupation task inputs. Weestimate this model separately for industry and occupation taskdemands, using employment data from our CPS samples from1980 and 1984 paired to the 1977 DOT job task measures.26
We refer to equation (17) as a fixed coefficients model becauseit neglects the impact of task prices on task demands—or equiva-lently, assumes that the elasticity of substitution between collegeand noncollege equivalent workers is zero. This is an imperfectapproximation: if the market price of nonroutine relative to rou-tine tasks has risen, this calculation will understate demandshifts favoring nonroutine tasks and, by implication, collegegraduate employment.
The second step of our methodology is to translate taskshifts into predicted changes in college employment. We firstassemble changes in our four key task measures over 1970 to1998, �T1970–1998
k . We then apply these task shift measures tothe “fixed coefficients” estimated from equation (17) to calculate
(18) �̃College Share1970–1998 � �k�1
4
�̃k � �T1970–1998k .
Here, �̃College Share1970–1998 is the change in the college share ofaggregate employment predicted by task shifts over 1970–1998.
25. We follow Autor, Katz, and Krueger [1998] and Murphy, Romer, andRiddell [1998] in defining college equivalent workers as all those with a collegedegree or greater plus half of those with some college. Results using exclusivelycollege graduates are quite similar.
26. The industry task demand model is estimated using the 1980 MORGemployment data, which is at the midpoint of our sample. The occupation taskdemand model is estimated using the 1984 CPS sample, which is at the midpointof our occupation sample. For completeness, estimates of equation (17) also controlfor input of nonroutine manual tasks. Inclusion or exclusion of this covariate hasno substantive impact.
1316 QUARTERLY JOURNAL OF ECONOMICS

The intuition for this calculation is that industries and occupa-tions that are high in nonroutine cognitive task input, and low inroutine manual and routine cognitive task input, employ collegegraduates relatively intensively. Consequently, secular increasein nonroutine cognitive task input and declines in nonroutinecognitive and manual task input over 1970–1998 will cause equa-tion (18) to predict corresponding growth in the college graduateshare of aggregate employment.
Table VII summarizes the changes in job task input due tocross-occupation (extensive margin) and within-occupation (inten-sive margin) shifts documented by our earlier analyses. Panel Apresents observed economywide shifts in task input during the pe-riod 1970 to 1998. Panel B presents analogous numbers where inplace of observed task changes, we tabulate changes in task inputpredicted by computerization. Specifically, we use estimates of equa-tions (14)–(16), corresponding to the models in Tables IV–VI, tocalculate the predicted mean change in each task measure due tocontemporaneous industry or occupation computerization. A limita-tion of this approach is that it treats computerization as an exoge-nous determinant of industry and occupation task change. Since, asstressed above, we view computer adoption and task change assimultaneously determined, we view this exercise as primarilyillustrative.
We implement these calculations in panels C and D. Panel Cuses equation (18) to estimate the extent to which rising input ofnonroutine tasks and declining input of routine tasks raised thecollege share of aggregate employment over 1970–1998. As seenin columns 1–4, observed cross-occupation (extensive margin)task changes raised college employment by 2.1 percentage pointsper decade between 1970 and 1998. Three-quarters of this con-tribution (1.5 percentage points) is due to shifts favoring nonrou-tine cognitive tasks. The remainder is explained by shifts againstroutine cognitive and manual tasks.
Columns 5–7 perform analogous calculations for 1980 to 1998.Here we add within-occupation (intensive) margin task change for1977 to 1991. In net, shifts favoring nonroutine over routine taskscontributed 2.5 percentage points growth per decade to college-equivalent employment over these eighteen years.27
27. Observed intensive margin shifts did not contribute to this demandgrowth, however, due to the offsetting effects of routine cognitive and nonroutineanalytic tasks. This stands in contrast to within-occupation task changes pre-dicted by computerization, where intensive margin shifts are economically large.
1317SKILL CONTENT OF TECHNICAL CHANGE
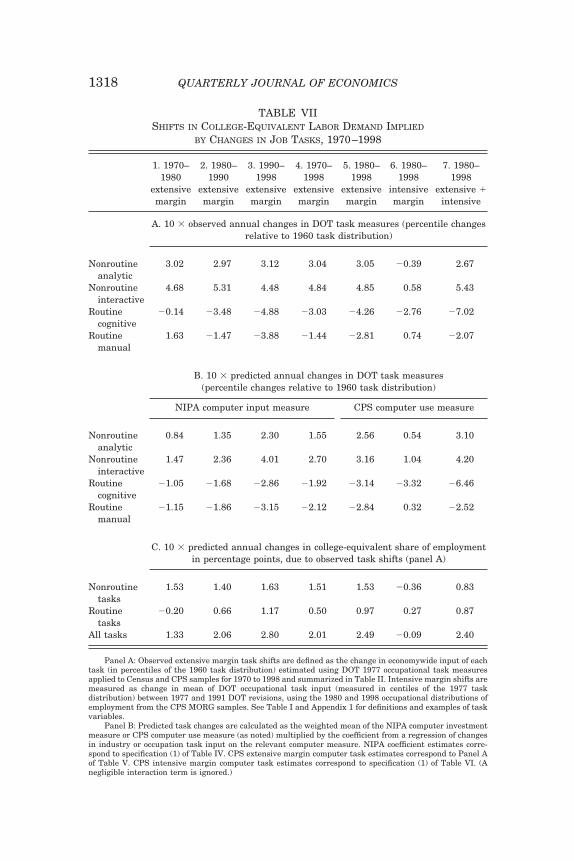
TABLE VIISHIFTS IN COLLEGE-EQUIVALENT LABOR DEMAND IMPLIED
BY CHANGES IN JOB TASKS, 1970–1998
1. 1970–1980
extensivemargin
2. 1980–1990
extensivemargin
3. 1990–1998
extensivemargin
4. 1970–1998
extensivemargin
5. 1980–1998
extensivemargin
6. 1980–1998
intensivemargin
7. 1980–1998
extensive intensive
A. 10 � observed annual changes in DOT task measures (percentile changesrelative to 1960 task distribution)
Nonroutineanalytic
3.02 2.97 3.12 3.04 3.05 �0.39 2.67
Nonroutineinteractive
4.68 5.31 4.48 4.84 4.85 0.58 5.43
Routinecognitive
�0.14 �3.48 �4.88 �3.03 �4.26 �2.76 �7.02
Routinemanual
1.63 �1.47 �3.88 �1.44 �2.81 0.74 �2.07
B. 10 � predicted annual changes in DOT task measures(percentile changes relative to 1960 task distribution)
NIPA computer input measure CPS computer use measure
Nonroutineanalytic
0.84 1.35 2.30 1.55 2.56 0.54 3.10
Nonroutineinteractive
1.47 2.36 4.01 2.70 3.16 1.04 4.20
Routinecognitive
�1.05 �1.68 �2.86 �1.92 �3.14 �3.32 �6.46
Routinemanual
�1.15 �1.86 �3.15 �2.12 �2.84 0.32 �2.52
C. 10 � predicted annual changes in college-equivalent share of employmentin percentage points, due to observed task shifts (panel A)
Nonroutinetasks
1.53 1.40 1.63 1.51 1.53 �0.36 0.83
Routinetasks
�0.20 0.66 1.17 0.50 0.97 0.27 0.87
All tasks 1.33 2.06 2.80 2.01 2.49 �0.09 2.40
Panel A: Observed extensive margin task shifts are defined as the change in economywide input of eachtask (in percentiles of the 1960 task distribution) estimated using DOT 1977 occupational task measuresapplied to Census and CPS samples for 1970 to 1998 and summarized in Table II. Intensive margin shifts aremeasured as change in mean of DOT occupational task input (measured in centiles of the 1977 taskdistribution) between 1977 and 1991 DOT revisions, using the 1980 and 1998 occupational distributions ofemployment from the CPS MORG samples. See Table I and Appendix 1 for definitions and examples of taskvariables.
Panel B: Predicted task changes are calculated as the weighted mean of the NIPA computer investmentmeasure or CPS computer use measure (as noted) multiplied by the coefficient from a regression of changesin industry or occupation task input on the relevant computer measure. NIPA coefficient estimates corre-spond to specification (1) of Table IV. CPS extensive margin computer task estimates correspond to Panel Aof Table V. CPS intensive margin computer task estimates correspond to specification (1) of Table VI. (Anegligible interaction term is ignored.)
1318 QUARTERLY JOURNAL OF ECONOMICS
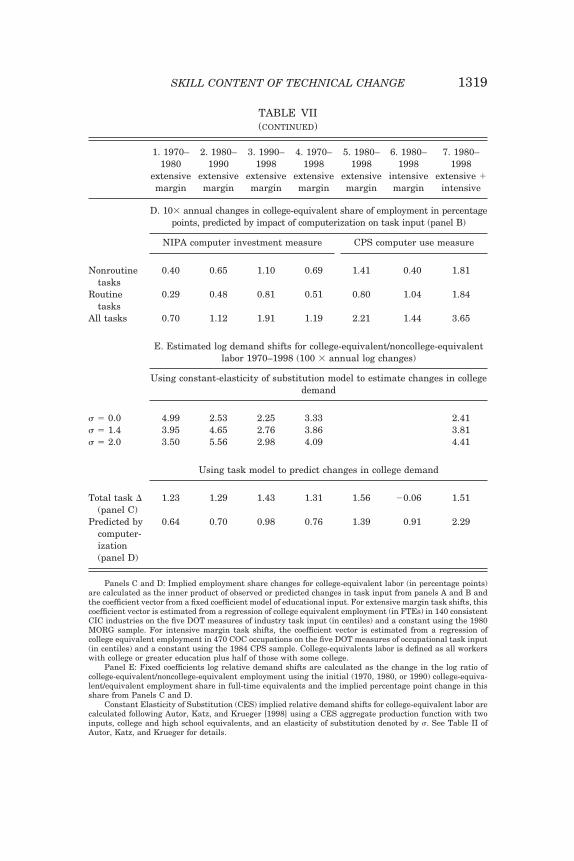
TABLE VII(CONTINUED)
1. 1970–1980
extensivemargin
2. 1980–1990
extensivemargin
3. 1990–1998
extensivemargin
4. 1970–1998
extensivemargin
5. 1980–1998
extensivemargin
6. 1980–1998
intensivemargin
7. 1980–1998
extensive intensive
D. 10� annual changes in college-equivalent share of employment in percentagepoints, predicted by impact of computerization on task input (panel B)
NIPA computer investment measure CPS computer use measure
Nonroutinetasks
0.40 0.65 1.10 0.69 1.41 0.40 1.81
Routinetasks
0.29 0.48 0.81 0.51 0.80 1.04 1.84
All tasks 0.70 1.12 1.91 1.19 2.21 1.44 3.65
E. Estimated log demand shifts for college-equivalent/noncollege-equivalentlabor 1970–1998 (100 � annual log changes)
Using constant-elasticity of substitution model to estimate changes in collegedemand
� � 0.0 4.99 2.53 2.25 3.33 2.41� � 1.4 3.95 4.65 2.76 3.86 3.81� � 2.0 3.50 5.56 2.98 4.09 4.41
Using task model to predict changes in college demand
Total task �(panel C)
1.23 1.29 1.43 1.31 1.56 �0.06 1.51
Predicted bycomputer-ization(panel D)
0.64 0.70 0.98 0.76 1.39 0.91 2.29
Panels C and D: Implied employment share changes for college-equivalent labor (in percentage points)are calculated as the inner product of observed or predicted changes in task input from panels A and B andthe coefficient vector from a fixed coefficient model of educational input. For extensive margin task shifts, thiscoefficient vector is estimated from a regression of college equivalent employment (in FTEs) in 140 consistentCIC industries on the five DOT measures of industry task input (in centiles) and a constant using the 1980MORG sample. For intensive margin task shifts, the coefficient vector is estimated from a regression ofcollege equivalent employment in 470 COC occupations on the five DOT measures of occupational task input(in centiles) and a constant using the 1984 CPS sample. College-equivalents labor is defined as all workerswith college or greater education plus half of those with some college.
Panel E: Fixed coefficients log relative demand shifts are calculated as the change in the log ratio ofcollege-equivalent/noncollege-equivalent employment using the initial (1970, 1980, or 1990) college-equiva-lent/equivalent employment share in full-time equivalents and the implied percentage point change in thisshare from Panels C and D.
Constant Elasticity of Substitution (CES) implied relative demand shifts for college-equivalent labor arecalculated following Autor, Katz, and Krueger [1998] using a CES aggregate production function with twoinputs, college and high school equivalents, and an elasticity of substitution denoted by �. See Table II ofAutor, Katz, and Krueger for details.
1319SKILL CONTENT OF TECHNICAL CHANGE
We next estimate the contribution of task changes attribut-able to computerization to growth in college graduate employ-ment. These estimates, shown in panel D, implement equation(18) using the within-industry and within-occupation task shiftspredicted by computerization (panel B). The estimates of the“computer-induced” changes in college employment are compara-ble in magnitude to, and in some cases larger than, the analogousestimates based on observed task inputs. We find, for example,that computer-induced task changes along the extensive margincontributed 1.2 percentage points per decade to growth in collegeemployment during 1970 to 1998, and 2.2 percentage points dur-ing 1980 to 1998. Adding intensive margin task changes raisesthis estimate considerably. In net, we estimate that task shiftsattributable to computerization increased college employment by3.7 percentage points per decade from 1980 to 1998.
The final step of our estimation is to benchmark employmentchanges induced by shifting task demands against conventionalestimates of demand for college labor calculated for the sameperiod. For this benchmarking exercise, we use the familiar con-stant elasticity of substitution (CES) framework with two factorsof production—college equivalent and high school equivalent la-bor—to estimate log relative demand shifts favoring college laborduring 1970 to 1998. Under the assumptions that the economyoperates on the demand curve and that factors are paid theirmarginal products, the CES model calculates the implied shift incollege/noncollege relative demand consistent with observedshifts in relative employment and earnings of college versusnoncollege workers.28 This procedure also requires us to assumean elasticity of substitution, �, between college and high schoolequivalent workers. Following a large literature, we use values of�, ranging from 0 to 2, with a consensus estimate of � � 1.4.
Panel E of the table presents the benchmark CES estimatesfor the period 1970 to 1998. We calculate that relative demand for
28. The demand model is Qt � [�t(atNct)� (1 � �t)(btNht)
�]1/�, where Q isaggregate output, Nct, Nht are quantities of employed college and high schoolequivalent labor, at, bt are factor-augmenting technological parameters, � is anindex of the share of work activities allocated to college versus high school labor,and the elasticity of substitution is given by � � 1/(1 � �). The demand index isDt � � ln(�t/[1 � �t]) (� � 1)ln(at /bt). Katz and Murphy [1992], Johnson[1997], Murphy, Romer, and Riddell [1999], and Acemoglu [2002] implementsimilar models. Our estimates are based on Table II of Autor, Katz, and Krueger[1998] and updated in 1998 (from 1996) for this analysis. Unlike these authors, wealso include estimates for � � 0 since our fixed coefficients model incorporates thisassumption.
1320 QUARTERLY JOURNAL OF ECONOMICS
college-educated labor grew rapidly between 1970 and 1998. Us-ing the consensus value of � � 1.4, we estimate that demand forcollege labor rose by 3.9 log points annually. If we instead assumethat � � 0, we obtain a smaller—though still quite rapid—demand shift of 3.3 log points annually.29
In the bottom of panel E we finally compare our task-baseddemand estimates with the CES-based numbers. To facilitatecomparison, we convert predicted changes in the college employ-ment level (panels C and D) into changes in log relative college-equivalent/noncollege employment. As noted above, this task-based calculation ignores wage changes and hence corresponds toan elasticity of substitution of � � 0. It is therefore useful tocompare the task-based demand estimates to the correspondingCES numbers using both the consensus elasticity of � � 1.4 andthe more comparable, albeit less realistic, value of � � 0.
As is visible in panel E, the task model explains a sizableshare—25 to 65 percent—of the estimated growth in college-equivalent/noncollege-equivalent demand in each decade. Consis-tent with the accelerating rate of task change shown in Figure I,the smallest share of the overall demand shift is explained bytask shifts in the 1970s and the largest share in the 1990s.
Comparing task changes potentially attributable to comput-erization to the CES demand index for these three decades, wefind that these extensive margin task changes explain 20 to 25percent of the estimated demand shift for college versus noncol-lege labor during 1970 to 1998. If we focus on only the two mostrecent decades and include both intensive and extensive marginchanges, the task model can explain a large fraction—60 to 90percent—of the estimated increase in relative demand for collegeemployment. Notably, almost 40 percent of the computer contri-bution to rising educational demand in the last two decades is dueto shifts in task composition within nominally unchangingoccupations.
In net, these illustrative calculations demonstrate thatchanges in task demands accompanying workplace computeriza-tion are economically large and—with caveats noted—could havecontributed substantially to relative demand shifts favoring edu-cated labor in the United States since 1970.
29. The estimated demand shift is smaller in the latter calculation because ahigher value of � places greater weight on relative wage changes, and the relativeearnings of college graduates rose rapidly after 1980.
1321SKILL CONTENT OF TECHNICAL CHANGE
VII. CONCLUSION
What is it that computers do—or what is it that people dowith computers—that appears to increase demand for educatedworkers? This paper formalizes and tests an intuitive answer tothis question that has been informally articulated by scholars ina number of disciplines over several decades. Computer technol-ogy substitutes for workers in performing routine tasks that canbe readily described with programmed rules, while complement-ing workers in executing nonroutine tasks demanding flexibility,creativity, generalized problem-solving capabilities, and complexcommunications. As the price of computer capital fell precipi-tously in recent decades, these two mechanisms—substitutionand complementarity—have raised relative demand for workerswho hold a comparative advantage in nonroutine tasks, typicallycollege-educated workers.
Our task framework emphasizes that the causal force bywhich advancing computer technology affects skill demand is thedeclining price of computer capital—an economywide phenome-non. We developed a simple model to explore how this pricedecline alters task demand within industries and occupations.This model predicts that industries that were intensive in laborinput of routine tasks in the precomputer era would make rela-tively larger investments in computer capital. Simultaneously,they would reduce labor input of routine tasks, for which com-puter capital substitutes, and increase demand for nonroutinetask input, which computer capital complements.
Employing consistent, representative, time series observa-tions on the task composition of jobs from the Dictionary ofOccupational Titles, we affirm these predictions across severalmargins of task change and estimate that they may have contrib-uted substantially to demand shifts favoring educated labor overthe past three decades. We also considered several alternativeexplanations for our findings, most significantly the rising humancapital and labor force attachment of women. We find that thedocumented task shifts, and their associations with the adoptionof computer technology, are as evident within gender, education,and occupation groups as between them. The pervasiveness ofthese shifts suggests to us that changes in job task content—spurred by technological change—may plausibly be viewed as anunderlying factor contributing to recent demand shifts favoringeducated labor.
1322 QUARTERLY JOURNAL OF ECONOMICS
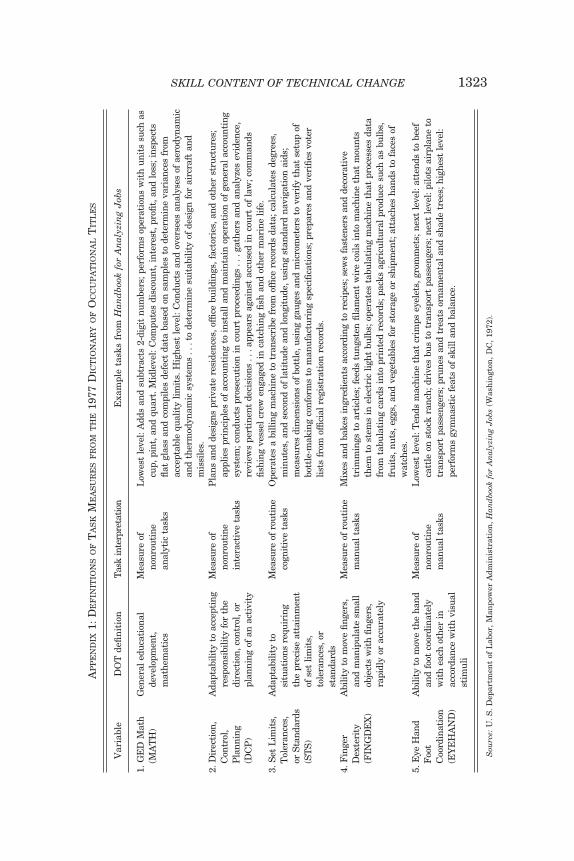
AP
PE
ND
IX1:
DE
FIN
ITIO
NS
OF
TA
SK
ME
AS
UR
ES
FR
OM
TH
E19
77D
ICT
ION
AR
YO
FO
CC
UP
AT
ION
AL
TIT
LE
S
Var
iabl
eD
OT
defi
nit
ion
Tas
kin
terp
reta
tion
Exa
mpl
eta
sks
from
Han
dbo
okfo
rA
nal
yzin
gJ
obs
1.G
ED
Mat
h(M
AT
H)
Gen
eral
educ
atio
nal
deve
lopm
ent,
mat
hem
atic
s
Mea
sure
ofno
nrou
tine
anal
ytic
task
s
Low
est
leve
l:A
dds
and
subt
ract
s2-
digi
tnu
mbe
rs;p
erfo
rms
oper
atio
nsw
ith
unit
ssu
chas
cup,
pint
,and
quar
t.M
idle
vel:
Com
pute
sdi
scou
nt,i
nter
est,
profi
t,an
dlo
ss;i
nspe
cts
flat
glas
san
dco
mpi
les
defe
ctda
taba
sed
onsa
mpl
esto
dete
rmin
eva
rian
ces
from
acce
ptab
lequ
alit
ylim
its.
Hig
hest
leve
l:C
ondu
cts
and
over
sees
anal
yses
ofae
rody
nam
ican
dth
erm
odyn
amic
syst
ems
...t
ode
term
ine
suit
abili
tyof
desi
gnfo
rai
rcra
ftan
dm
issi
les.
2.D
irec
tion
,C
ontr
ol,
Pla
nnin
g(D
CP
)
Ada
ptab
ility
toac
cept
ing
resp
onsi
bilit
yfo
rth
edi
rect
ion,
cont
rol,
orpl
anni
ngof
anac
tivi
ty
Mea
sure
ofno
nrou
tine
inte
ract
ive
task
s
Pla
nsan
dde
sign
spr
ivat
ere
side
nces
,offi
cebu
ildin
gs,f
acto
ries
,and
othe
rst
ruct
ures
;ap
plie
spr
inci
ples
ofac
coun
ting
toin
stal
lan
dm
aint
ain
oper
atio
nof
gene
ral
acco
unti
ngsy
stem
;con
duct
spr
osec
utio
nin
cour
tpr
ocee
ding
s..
.gat
hers
and
anal
yzes
evid
ence
,re
view
spe
rtin
ent
deci
sion
s..
.app
ears
agai
nst
accu
sed
inco
urt
ofla
w;c
omm
ands
fishi
ngve
ssel
crew
enga
ged
inca
tchi
ngfis
han
dot
her
mar
ine
life.
3.S
etL
imit
s,T
oler
ance
s,or
Sta
ndar
ds(S
TS
)
Ada
ptab
ility
tosi
tuat
ions
requ
irin
gth
epr
ecis
eat
tain
men
tof
set
limit
s,to
lera
nces
,or
stan
dard
s
Mea
sure
ofro
utin
eco
gnit
ive
task
sO
pera
tes
abi
lling
mac
hine
totr
ansc
ribe
from
offic
ere
cord
sda
ta;c
alcu
late
sde
gree
s,m
inut
es,a
ndse
cond
ofla
titu
dean
dlo
ngit
ude,
usin
gst
anda
rdna
viga
tion
aids
;m
easu
res
dim
ensi
ons
ofbo
ttle
,usi
ngga
uges
and
mic
rom
eter
sto
veri
fyth
atse
tup
ofbo
ttle
-mak
ing
conf
orm
sto
man
ufac
turi
ngsp
ecifi
cati
ons;
prep
ares
and
veri
fies
vote
rlis
tsfr
omof
ficia
lre
gist
rati
onre
cord
s.
4.F
inge
rD
exte
rity
(FIN
GD
EX
)
Abi
lity
tom
ove
finge
rs,
and
man
ipul
ate
smal
lob
ject
sw
ith
finge
rs,
rapi
dly
orac
cura
tely
Mea
sure
ofro
utin
em
anua
lta
sks
Mix
esan
dba
kes
ingr
edie
nts
acco
rdin
gto
reci
pes;
sew
sfa
sten
ers
and
deco
rati
vetr
imm
ings
toar
ticl
es;f
eeds
tung
sten
filam
ent
wir
eco
ilsin
tom
achi
neth
atm
ount
sth
emto
stem
sin
elec
tric
light
bulb
s;op
erat
esta
bula
ting
mac
hine
that
proc
esse
sda
tafr
omta
bula
ting
card
sin
topr
inte
dre
cord
s;pa
cks
agri
cult
ural
prod
uce
such
asbu
lbs,
frui
ts,n
uts,
eggs
,and
vege
tabl
esfo
rst
orag
eor
ship
men
t;at
tach
esha
nds
tofa
ces
ofw
atch
es.
5.E
yeH
and
Foo
tC
oord
inat
ion
(EY
EH
AN
D)
Abi
lity
tom
ove
the
hand
and
foot
coor
dina
tely
wit
hea
chot
her
inac
cord
ance
wit
hvi
sual
stim
uli
Mea
sure
ofno
nrou
tine
man
ual
task
s
Low
est
leve
l:T
ends
mac
hine
that
crim
psey
elet
s,gr
omm
ets;
next
leve
l:at
tend
sto
beef
catt
leon
stoc
kra
nch;
driv
esbu
sto
tran
spor
tpa
ssen
gers
;nex
tle
vel:
pilo
tsai
rpla
neto
tran
spor
tpa
ssen
gers
;pru
nes
and
trea
tsor
nam
enta
lan
dsh
ade
tree
s;hi
ghes
tle
vel:
perf
orm
sgy
mna
stic
feat
sof
skill
and
bala
nce.
Sou
rce:
U.
S.
Dep
artm
ent
ofL
abor
,M
anpo
wer
Adm
inis
trat
ion
,H
and
book
for
An
alyz
ing
Job
s(W
ash
ingt
on,
DC
,19
72).
1323SKILL CONTENT OF TECHNICAL CHANGE

DATA APPENDIX
A.1. Samples Used from Current Population Survey and Censusof Populations
To calculate occupational and education distributions econo-mywide and within industries for 1960 to 1998, we used obser-vations on all noninstitutionalized, employed workers ages
APPENDIX 2: COMPUTERIZATION AND INDUSTRY TASK INPUT, 1960–1998:USING COMPOSITE TASK MEASURES
DEPENDENT VARIABLE: 10 � ANNUAL WITHIN-INDUSTRY CHANGE IN TASK INPUT,MEASURED IN PERCENTILES OF 1960 TASK DISTRIBUTION
1. 1990–1998
2. 1980–1990
3. 1970–1980
4. 1960–1970
A. � Nonroutineanalytic
� Computer use 8.21 12.09 6.50 8.571984–1997 (4.55) (4.55) (4.21) (5.74)Intercept 0.64 �0.67 0.07 �0.07
(0.96) (0.94) (0.86) (1.14)R2 0.02 0.05 0.02 0.02Weighted mean � 2.26 1.67 1.32 1.51
B. � Nonroutineinteractive
� Computer use 9.83 9.93 5.67 10.451984–1997 (4.39) (4.74) (3.47) (5.00)Intercept 0.54 0.53 1.42 0.00
(0.92) (0.98) (0.71) (1.00)R2 0.04 0.03 0.02 0.03Weighted mean � 2.48 2.45 2.51 1.93
C. � Routinecognitive
� Computer use �13.40 �4.59 �4.76 �7.021984–1997 (4.44) (5.58) (3.70) (4.75)Intercept 0.23 �0.39 0.56 �0.05
(0.94) (1.16) (0.76) (0.95)R2 0.06 0.00 0.01 0.02Weighted mean � �2.41 �1.28 �0.35 �1.35
D. � Routinemanual
� Computer use �23.17 �15.27 �13.25 3.981984–1997 (6.99) (6.86) (5.34) (4.13)Intercept �0.52 �0.80 1.97 1.35
(1.47) (1.42) (1.09) (0.82)R2 0.07 0.03 0.04 0.01Weighted mean � �5.09 �3.76 �0.56 2.09
n is 140 consistent CIC industries. Standard errors are in parentheses. Each column of panels A–Dpresents a separate OLS regression of ten times the annual change in industry-level task input between theendpoints of the indicated time interval (measured in centiles of the 1960 task distribution) on the annualpercentage point change in industry computer use during 1984–1997 (mean 0.193) and a constant. Computeruse is the fraction of industry workers using a computer at their jobs, estimated from the October 1984 and1997 CPS samples. Estimates are weighted by mean industry share of total employment in FTEs over theendpoints of the years used to form the dependent variable. Samples used are Census 1960, 1970, and 1980and CPS MORG 1980, 1990, and 1998. See the Data Appendix for details on construction of the compositetask variables. See Table I for definitions and examples of task variables.
1324 QUARTERLY JOURNAL OF ECONOMICS
18–64 from the Census PUMS one percent samples for 1960,1970, 1980, and 1990 [Ruggles and Sobek, 1997] and the MergedOutgoing Rotation Groups of the Current Population Survey forthe years 1980, 1990, and 1998. All individual and industry levelanalyses are performed using as weights full-time equivalenthours of labor supply, which is the product of the individualCensus or CPS sampling weight times hours of work in thesample reference week divided by 35 and, for Census samples,weeks of work in the previous year. Because hours are not re-ported for the self-employed in the CPS prior to 1994, we assignedself-employed workers in all CPS samples the average laborhours in their industry-education-year cell. In cases where indus-try hours supplied by education category were unavailable (due toan empty industry-education-year cell), we assigned weeklyhours as the mean of workers’ education-year cells.
To attain comparable educational categories across the re-definition of Census Bureau’s education variable introduced in1990 in the Census and in 1992 in the CPS, we use the methodproposed by Jaeger [1997]. In data coded with the pre-1992 edu-cation question (Census PUMS 1960, 1970, and 1980, and CPSMORG files 1980 and 1990), we defined high school dropouts asthose with fewer than twelve years of completed schooling; highschool graduates as those having twelve years of completedschooling; some college attendees as those with any schoolingbeyond twelve years (completed or not) and fewer than sixteencompleted years; and college plus graduates as those with sixteenor more years of completed schooling. In data coded with therevised education question (1990 Census PUMS and 1998 CPSMORG file), we define high school dropouts as those with fewerthan twelve years of completed schooling, high school graduatesas those with either twelve completed years of schooling or a highschool diploma or G.E.D.; some college as those with some collegeor holding an Associate’s Degree; and college plus as those with aB.A. or higher.
A.2. Computing DOT Task Means for Census OccupationCategories (COCs)
To compute DOT Task Means for 1970 CIC Occupations, weused the April 1971 CPS Monthly File issued by the NationalAcademy of Sciences [1981] in which experts assigned individualDOT occupation codes and associated DOT measures to each of60,441 workers. Because Census occupation categories are sig-
1325SKILL CONTENT OF TECHNICAL CHANGE
nificantly coarser than DOT occupation categories, the 411 1970census occupation codes represented in the 1971 CPS were as-signed a total of 3886 unique 1977 DOT occupations. We used theCPS sampling weights to calculate means of each DOT taskmeasure by occupation. Because the gender distribution of DOToccupations differs substantially within COC occupation cells, weperformed this exercise separately by gender. In cases where aCOC cell contained exclusively males or females, we assigned thecell mean to both genders. This provided a set of 822 DOT occu-pation means by 1970 COC and gender.
To generate DOT means for 1960 occupations, we developeda crosswalk from the 1970 to 1960 COC occupational classifica-tion schemes using information in Priebe and Greene [1972]. Ourcrosswalk (available on request) provides a set of 211 consistent1960–1970 occupations representing the lowest common level ofaggregation needed to obtain a consistent series. We applied the1970 COC means to our 1970 Census sample by occupation andgender and calculated weighted gender-occupation means acrossthe 211 consistent 1960–1970 occupational categories.
It was not possible to develop a bridging crosswalk between1970 and 1980 COC occupations due to the substantial differ-ences between these classifications. Instead, we employed a Cen-sus sample prepared for the Committee on Occupational Classi-fication and Analysis chaired by Donald Treiman and provided tous by Michael Handel. This file contains 122,141 observationsfrom the 1980 Census that are individually dual coded with both1970 and 1980 COC occupation codes based on occupational andother demographic information supplied by Census respondents.To calculate DOT means by 1980 occupation, we merged the 1970COC-DOT means (above) to the Treiman file by gender and 1970COC occupation, achieving a 97 percent match rate. We appendedto the Treiman file consistent occupation codes for the years 1980to 1998 developed by Autor, Katz, and Krueger [1998], and cal-culated weighted means of each DOT measure within occupation-gender categories. This yielded DOT means by gender for each of485 DOT occupations.
A.3. Computing DOT Task Means by Consistent1960–1998 Industry
To compute DOT task means overall, by industry, and byindustry-education cell for 1960–1998, we assigned the consis-tent DOT occupational task means for 1960–1998 by gender and
1326 QUARTERLY JOURNAL OF ECONOMICS
occupation to each observation in our Census and CPS samplesfor 1960–1998. Using labor supply in FTEs as weights, we calcu-lated means of each DOT measure for each occupation-industry-education-year cell. These means provide the primary outcomemeasures for our analysis. To attain compatibility betweenchanging Census Industry Codes for 1960–1998, we use a cross-walk developed by Autor, Katz, and Krueger [1998] providing 140consistent CIC industries spanning all sectors of the economy.This crosswalk includes all CIC industries and attains consis-tency by aggregating where necessary to the lowest common levelof consistent industry definition among 1970, 1980, and 1990 CICstandards.
A.4. Composite Task Indicators from the DOT
To verify that our results are robust to plausible alternativeselections of DOT variables, we formed composite indicators ofour intended constructs using Principal Components Analysis.We chose a short list of alternative DOT variables that appearedrelevant to each of our conceptual categories. These choices areNonroutine Analytic Tasks: GED-MATH, GED-REASON, NUM-BER, MVC; Nonroutine Interactive Tasks: DCP, GED-LAN-GUAGE, DEPL, VARCH; Routine Cognitive Tasks: STS, COL-ORDIS, REPCON, VOCPREP; Routine Manual Tasks: FING-DEX, MOTOR, FORM, MANUAL. Definitions and representativeexamples of these variables are found in U. S. Department ofLabor [1972]. Using 1980 employment as weights, we performedprincipal components analysis for each set of variables to identifythe linear combinations that maximized common variation sub-ject to the constraint that the sum of squared vector weights isequal to one. In each case, we used the first principal component.
A.5. Calculating DOT Quantiles
To convert DOT measures into percentiles of the 1960 taskdistribution, we used DOT 1977 task measures paired to the 1960Census to form an employment-weighted empirical cumulativedistribution function of task input for each task measure across1120 industry-education-gender cells: 140 industries, two gender,and four education levels (high school dropout, high school grad-uate, some college, and college graduate). We applied a smallamount of interpolation to remove flat spots in the distribution.We inverted this empirical distribution and applied it to all DOTtask measures in subsequent years by industry-education-gender
1327SKILL CONTENT OF TECHNICAL CHANGE
and year. These centile values are the unit of measure for all lateranalyses. A limitation of this methodology is that DOT valuesafter 1960 may potentially lie outside the support of the 1960distribution, leading to truncation. In practice, this issue affectsat most 4 percent of the distribution of each task in any year. Anearlier version of this paper [Autor, Levy, and Murnane, 2001]employed raw DOT scores rather than the percentile measuresused here. Results were qualitatively identical.
A.6. Calculating within-Occupation Changes in DOT TaskMeasures: 1977–1991
To measure within-occupation changes in task content, weemployed the 1991 Revised Fourth Edition of the Dictionary ofOccupational Titles, available in electronic form from the Na-tional Academy of Sciences [1981]. Based on a study of selectindustries to determine which jobs had undergone the most sig-nificant occupational changes since the 1977 publication of theDOT fourth edition, DOT analysts introduced, revised, and elimi-nated occupational definitions for occupations that were observedto have most substantively changed between 1977 and 1991. Atotal of 2452 occupations were reviewed, updated, or were added;646 nominal titles were revised; 136 titles were combined; and 75were deleted. To provide a conservative measure of total taskchange, we assume that any occupation that was not revised inthe 1991 DOT experienced no task change.
We used documentation from the North Carolina Employ-ment Security Commission [1992a, 1992b] to construct a cross-walk between the 1991 DOT and 1997 DOT occupation codes.With this crosswalk, we applied DOT 1991 task variables to our1971 CPS file, yielding a match rate of 99.9 percent. Of thesematched occupations, 73 percent (weighted by employment) hadbeen updated between 1977 and 1991 by DOT examiners. Wethen calculated DOT means by 1970 and 1980 COC occupationsand gender using a procedure identical to that described in A.3, toobtain 1991 DOT task means for the 1977 occupations. The with-in-occupation variation that we exploit over 1977–1991 stemsexclusively from reevaluation of occupational content by DOTexaminers, rather than from changes in the relative size of DOTsuboccupations within CIC occupations.
We assigned the 1977 DOT and 1991 DOT task measures to470 consistent COC occupations in the 1984 and 1998 CPS sam-ples (corresponding to the years of our CPS computer measure).
1328 QUARTERLY JOURNAL OF ECONOMICS
As with the industry data, we transformed the DOT task mea-sures into percentiles of the base year distribution, in this caseusing occupational employment shares from 1984 to form employ-ment weights.
A.7. Computer Usage Data from the Current Population Survey
Industry computer use frequencies were calculated from theOctober 1984 and 1997 School Enrollment Supplements to theCurrent Population Survey (CPS) as the weighted fraction ofcurrently employed workers ages 18–65 who answered yes to thequestion, “Do you use a computer directly at work?” within con-sistent CIC industries. A computer is defined as a desktop termi-nal or PC with keyboard and monitor and does not include anelectronic cash register or a handheld data device. To calculatethese frequencies in 1984 and 1997, 61,712 and 56,247 observa-tions were used, respectively.
A.8. Computer and Capital Investment Measures from theNational Income and Products Accounts
We used data on industry capital stocks and flows of equip-ment, structures, and computers from the National Income andProduct Accounts [U. S. Department of Commerce, 2002a, 2002b]for the years 1950–1998. All NIPA stock and investment vari-ables are measured in real 1996 dollars. Investment variablesmeasure cumulated real investment in the relevant asset over theprior ten years, except in 1998 where we use 1.25 times cumu-lated investment over the previous eight years. Deflation of NIPAmeasures is performed by the Bureau of Economic Analysis usingprimarily Producer Price Indexes (PPIs). PPIs for computer in-vestment are based on quality adjustment, price linking, andhedonic regression methods. As denominators for capital/FTEand computer investment/FTE variables, we used Census andCPS samples to calculate FTEs by industry by year. Computerinvestment is calculated as the sum of investment in mainframecomputers, personal computers, packaged and custom software,printers, terminals, storage devices, and other integrated devices.Structures and equipment variables are defined in the NIPA.
To match CPS and Census data to the NIPA, we used acrosswalk developed by Autor, Katz, and Krueger [1998] andrevised for this analysis to accommodate small changes in theNIPA sector scheme made during the recent NIPA revision. Theresulting aggregation of NIPA and CIC data contains 47 consis-
1329SKILL CONTENT OF TECHNICAL CHANGE
tent industries covering all industrial sectors excluding Govern-ment and Private Households, spanning 1960–1998. Of these 47,we exclude from our analysis agriculture and government domi-nated services (5 NIPA industries).
MASSACHUSETTS INSTITUTE OF TECHNOLOGY AND NATIONAL BUREAU
OF ECONOMIC RESEARCH
MASSACHUSETTS INSTITUTE OF TECHNOLOGY
HARVARD UNIVERSITY AND NATIONAL BUREAU OF ECONOMIC RESEARCH
REFERENCES
Acemoglu, Daron, “Why Do New Technologies Complement Skills? Directed Tech-nical Change and Wage Inequality,” Quarterly Journal of Economic, CXIII(1998), 1055–1089.
——, “Changes in Unemployment and Wage Inequality: An Alternative Theoryand Some Evidence,” American Economic Review, LXXXIX (1999),1259–1278.
——, “Technical Change, Inequality, and the Labor Market,” Journal of EconomicLiterature, XL (2002), 7–72.
Adler, Paul S., “New Technologies, New Skills,” California Management Review,XXIX (1986), 9–28.
Autor, David H., Lawrence F. Katz, and Alan B. Krueger, “Computing Inequality:Have Computers Changed the Labor Market?” Quarterly Journal of Econom-ics, CXIII (1998), 1169–1214.
Autor, David H., Frank Levy, and Richard J. Murnane, “The Skill Content ofRecent Technological Change: An Empirical Exploration,” National Bureau ofEconomics Research Working Paper No. 8337, 2001.
Autor, David H., Frank Levy, and Richard J. Murnane, “Upstairs, Downstairs:Computers and Skills on Two Floors of a Large Bank,” Industrial and LaborRelations Review, LV (2002), 432–447.
Bartel, Anne P., Casey Ichniowski, and Kathryn Shaw, “New Technology, HumanResource Practices and Skill Requirements: Evidence from Plant Visits inThree Industries,” mimeograph, Carnegie Mellon University, 2000.
Beamish, Anne, Frank Levy, and Richard J. Murnane, “Computerization andSkills: Examples from a Car Dealership,” mimeograph, Massachusetts Insti-tute of Technology, Department of Urban Studies, 1999.
Berman, Eli, John Bound, and Zvi Griliches, “Changes in the Demand for SkilledLabor within U. S. Manufacturing Industries: Evidence from the AnnualSurvey of Manufacturers,” Quarterly Journal of Economics, CIX (1994),367–397.
Berman, Eli, John Bound, and Stephen Machin, “Implications of Skill-BiasedTechnological Change: International Evidence,” Quarterly Journal of Eco-nomics, CXIII (1998), 1245–1279.
Berman, Eli, and Stephen Machin, “Skill-Biased Technology Transfer: Evidence ofFactor Biased Technological Change in Developing Countries,” mimeograph,Boston University, 2000.
Bertrand, Marianne, Esther Duflo, and Sendhil Mullainathan, “How MuchShould we Trust Difference-in-Differences Estimates?” Quarterly Journal ofEconomics, CXIX (2004), forthcoming.
Blau, Francine, Marianne Ferber, and Anne Winkler, The Economics of Women,Men and Work, 4th ed. (Upper Saddle River, NJ: Prentice-Hall, 2002).
Borghans, Lex, and Bas ter Weel, “The Diffusion of Computers and the Distribu-tion of Wages,” mimeograph, Maastricht University, 2002.
Bresnahan, Timothy F., “Computerization and Wage Dispersion: An AnalyticalReinterpretation,” Economic Journal, CIX (1999), 390–415.
Bresnahan, Timothy F., Erik Brynjolfsson, and Lorin M. Hitt, “Information Tech-
1330 QUARTERLY JOURNAL OF ECONOMICS
nology, Workplace Organization and the Demand for Skilled Labor: Firm-Level Evidence,” Quarterly Journal of Economics, CXVII (2002), 339–376.
Brynjolfsson, Erik, and Lorin M. Hitt, “Beyond Computation: Information Tech-nology, Organizational Transformation and Business Performance,” Journalof Economic Perspectives, XIV (2000), 23–48.
Card, David, and John E. DiNardo, “Skill-Biased Technological Change andRising Wage Inequality: Some Problems and Puzzles,” Journal of LaborEconomics, XX (2002), 733–783.
Caroli, Eve, and John Van Reenen, “Skill-Biased Organizational Change? Evi-dence from a Panel of British and French Establishments,” Quarterly Journalof Economics, CXVI (2001), 1449–1492.
Chandler, Alfred, The Visible Hand: The Managerial Revolution in AmericanBusiness (Cambridge, MA: Belknap Press, 1977).
Dixit, Avinish K., and Joseph E. Stiglitz, “Monopolistic Competition and OptimumProduct Diversity,” American Economic Review, LXVII (1977), 297–308.
Doms, Mark, Timothy Dunne, and Kenneth R. Troske, “Workers, Wages, andTechnology,” Quarterly Journal of Economics, CXII (1997), 253–290.
Drucker, Peter F., The Practice of Management (New York, NY: Harper Press,1954).
Fernandez, Roberto, “Skill-Biased Technological Change and Wage Inequality:Evidence from a Plant Retooling,” American Journal of Sociology, CVII(2001), 273–320.
Gera, Surendra, Wulong Gu, and Zhengxi Lin, “Technology and the Demand forSkills in Canada: An Industry-Level Analysis,” Canadian Journal of Econom-ics, XXXIV (2001), 132–148.
Goldin, Claudia, Understanding the Gender Gap (New York, NY: Oxford Univer-sity Press, 1990).
Goldin, Claudia, and Lawrence F. Katz, “The Decline of Non-Competing Groups:Changes in the Premium to Education, 1890 to 1940,” National Bureau ofEconomics Research Working Paper No. 5202, 1995.
Goldin, Claudia, and Lawrence F. Katz, “The Origins of Technology-Skill Comple-mentarity,” Quarterly Journal of Economics, CXIII (1998), 693–732.
Griliches, Zvi, “Capital-Skill Complementarity,” Review of Economics and Statis-tics, LI (1969), 465–468.
Handel, Michael, “Trends in Direct Measures of Job Skill Requirements,” JeromeLevy Economics Institute Working Paper No. 301, 2000.
Hounshell, David A, From the American System to Mass Production, 1800–1932:The Development of Manufacturing Technology in the United States (Balti-more, MD: Johns Hopkins University Press, 1985).
Howell, David R., and Edward N. Wolff, “Trends in the Growth and Distributionof Skills in the U. S. Workplace, 1960–1985,” Industrial and Labor RelationsReview, XLI (1991), 486–502.
Ichniowski, Casey, and Kathryn Shaw, “Beyond Incentive Pay: Insiders’ Esti-mates of the Value of Complementary Human Resource Management Prac-tices,” Journal of Economic Perspectives, XVII (2003), 155–180.
Ingram, Beth F., and George R. Neumann, “The Returns to Skill.” mimeograph,University of Iowa, 2000.
Jaeger, David A., “Reconciling the Old and New Census Bureau Education Ques-tions: Recommendations for Researchers,” Journal of Business and Econom-ics Statistics, XV (1997), 300–309.
Johnson, George, “Changes in Earnings Inequality: The Role of Demand Shifts,”Journal of Economic Perspectives, XI (1997), 41–54.
Katz, Lawrence F., and David H. Autor, “Changes in the Wage Structure andEarnings Inequality,” in Handbook of Labor Economics, Vol. 3, O. Ashenfelterand D. Card, eds. (Amsterdam: North-Holland and Elsevier, 1999).
Katz, Lawrence F., and Kevin M. Murphy, “Changes in Relative Wages, 1963–1987: Supply and Demand Factors,” Quarterly Journal of Economics, CVII(1992), 35–78.
Lang, Kevin, “Of Pencils and Computers,” mimeograph, Boston University, 2002.Levy, Frank, and Richard J. Murnane, “With What Skills Are Computers a
Complement?” American Economic Review Papers and Proceedings, LXXXVI(1996), 258–262.
1331SKILL CONTENT OF TECHNICAL CHANGE
Lindbeck, Assar, and Dennis J. Shower, “Multitask Learning and the Reorgani-zation of Work: From Tayloristic to Holistic Organization,” Journal of LaborEconomics, XVIII (2000), 353–376.
Machin, Stephen, and John Van Reenen, “Technology and Changes in SkillStructure: Evidence from Seven OECD Countries,” Quarterly Journal ofEconomics, CXIII (1998), 1215–1244.
Miller, Anne R., Donald J. Treiman, Pamela S. Cain, and Patricia A. Roose,editors, Work, Jobs and Occupations: A Critical Review of the Dictionary ofOccupational Titles (Washington, DC: National Academy Press, 1980).
Mobius, Markus, “The Evolution of Work,” mimeograph, Harvard University,2000.
Mokyr, Joel, The Lever of Riches: Technological Creativity and Economic Progress(New York, NY: Oxford University Press, 1990).
Murphy, Kevin M., Paul Romer, and W. Craig Riddell, “Wages, Skills, and Tech-nology in the United States and Canada,” in Elhanan Helpman, ed., GeneralPurpose Technologies and Economic Growth (Cambridge, MA: MIT Press,1998).
National Academy of Science, Committee on Occupational Classification andAnalysis, “Fourth Edition Dictionary of DOT Scores for 1970 Census Catego-ries,” ICPSR Document No. 7845, Ann Arbor, MI, 1981.
Nelson, Richard R., and Sidney G. Winter, An Evolutionary Theory of EconomicChange (Cambridge, MA: Harvard University Press, 1982).
Nordhaus, William D., “The Progress of Computing,” Yale Cowles FoundationDiscussion Paper No. 1324, 2001.
North Carolina Employment Security Commission, Occupational Analysis FieldCenter, “Conversion Tables of Code and Title Changes: Fourth to RevisedFourth Edition Dictionary of Occupational Titles.” Raleigh, NC, 1992a.
——, “Errata: Dictionary of Occupational Titles, Fourth Edition, Revised 1991,”Raleigh, NC, 1992b.
Orr, Julian E., Talking about Machines: An Ethnography of a Modern Job (Ithaca,NY: Cornell University Press, 1996).
Pinker, Steven, How the Mind Works (New York, NY: Norton, 1997).Polanyi, Michael, The Tacit Dimension (New York, NY: Doubleday Press, 1966).Priebe, J. A., J. Heinkel, and S. Greene, “1970 Occupation and Industry Classi-
fications in Terms of their 1960 Occupation and Industry Elements,” CensusBureau Technical Paper No. 26, 1972.
Roy, A. D., “Some Thoughts on the Distribution of Earnings,” Oxford EconomicPapers, III (1951), 235–246.
Ruggles, Steven, Matthew Sobek, et al., Integrated Public Use Microdata Series:Version 2.0 (Minneapolis, MN: Historical Census Projects, University of Min-nesota, 1997).
Rumberger, Russell W., “The Changing Skill Requirements of Jobs in the U. S.Economy,” Industrial and Labor Relations Review, XXXIV (1981), 578–590.
Simon, Herbert A., “The Corporation: Will it Be Managed by Machines?” in M. L.Anshen and G. L. Bach, eds, Management and the Corporations, 1985 (NewYork, NY: McGraw-Hill, 1960).
Spenner, Kenneth I., “Deciphering Prometheus: Temporal Change in the SkillLevel of Work,” American Sociological Review, LXVII (1983), 824–837.
——, “Skill: Meaning, Methods and Measures,” Work and Occupations, XVII(1990), 399–421.
Spitz, Alexandra, “IT Capital, Job Content and Educational Attainment,” ZEWDiscussion Paper No. 03-04, 2003.
Stiroh, Kevin J., “Information Technology and the U. S. Productivity Revival:What Do the Industry Data Say?” American Economic Review, XCII (2002),1559–1576.
Thesmar, David, and Mathias Thoenig, “Creative Destruction and Firm Organi-zation Choice: A New Look into the Growth-Inequality Relationship,” Quar-terly Journal of Economics, CXV (2000), 1201–1238.
U. S. Department of Commerce, Bureau of Economic Analysis, “Detailed Data forFixed Assets and Consumer Durable Goods: 1947–2001,” 2002a, available athttp://www.bea.gov/.
——, “Industry Accounts Data: 1947–2001,” 2002b, available at http://www.bea.gov/.
1332 QUARTERLY JOURNAL OF ECONOMICS
U. S. Department of Labor, Manpower Administration, Handbook for AnalyzingJobs (Washington, DC: 1972).
U. S. Department of Labor, Dictionary of Occupational Titles: First Edition(Washington, DC: 1939).
U. S. Department of Labor, Employment and Training Administration, Dictionaryof Occupational Titles: Fourth Edition (Washington, DC: 1977).
U. S. Department of Labor, Employment and Training Administration, Dictionaryof Occupational Titles: Revised Fourth Edition (Washington, DC: 1991).
U. S. Department of Labor, Occupational Outlook Handbook, 1976–1977 Edition,Bulletin 1875, 1976.
U. S. Department of Labor, Occupational Outlook Handbook, 2000–2001 Edition,Bulletin 2520, 2000.
Weinberg, Bruce, “Computer Use and the Demand for Female Workers,” Indus-trial and Labor Relations Review, LIII (2000), 209–308.
Winston, Patrick H., “Why We Should Start Over,” Keynote address, AmericanAssociation for Artificial Intelligence, Orlando, FL, July 18, 1999.
Wolff, Edward N., “The Growth of Information Workers in the U. S. Economy,1859–1990: The Role of Technological Change, Computerization, and Struc-tural Change,” C. V. Starr Center for Applied Economics, New York Univer-sity RR No. 96-41, 1996.
——, “Computerization and Structural Change,” Review of Income and Wealth,XLVII (2002), 59–75.
Xiang, Chong, “New Goods and Rising Skill Premium: An Empirical Investiga-tion,” Research Seminar in International Economics Working Paper No. 478,University of Michigan, 2002.
Zuboff, Shoshana, In the Age of the Smart Machine (New York, NY: Basic Books,1988).
Zue, V. W., and J. R. Glass, “Conversational Interfaces: Advances and Challenges,”Proceedings of the IEEE, LXXXVIII (2000), 1166–1180.
1333SKILL CONTENT OF TECHNICAL CHANGE