Embed Size (px)
Citation preview

The social determinants of The social determinants of health and well being: achieving health and well being: achieving
actionaction
Michael MarmotMichael MarmotUCLUCL
Chair: Commission on Social Determinants of HealthChair: Commission on Social Determinants of HealthFulbright SymposiumFulbright Symposium
AdelaideAdelaide
1010thth July 2008July 2008
VALUESVALUES

Imperative for action Imperative for action –– why and why now?why and why now?Areas for actionAreas for actionAdvancing SDH Advancing SDH

Health inequalities within and between Health inequalities within and between countriescountriesSocial gradient within countriesSocial gradient within countries

Mortality over 25 years according to level in Mortality over 25 years according to level in the occupational hierarchy: Whitehallthe occupational hierarchy: Whitehall
01020304050607080
40-64yrs 65-69yrs 70-89yrsAll
caus
e m
orta
lity
(per
100
0 pe
rson
yrs
) Admin Prof/Exec Clerical Other
(Marmot & Shipley, BMJ, 1996)

Life expectancy at age 25 by education,Life expectancy at age 25 by education,United States, 1988 United States, 1988 -- 19981998
47.9
53.4
50.6
56.4
52.2
57.4
54.7
58.5
40
45
50
55
60
Men Women
Less than 121213-15More than 15LE
at a
ge 2
5 Years of school completed:
Source: Robert Wood Johnson Foundation, Commission to build a Healthier America, 2008
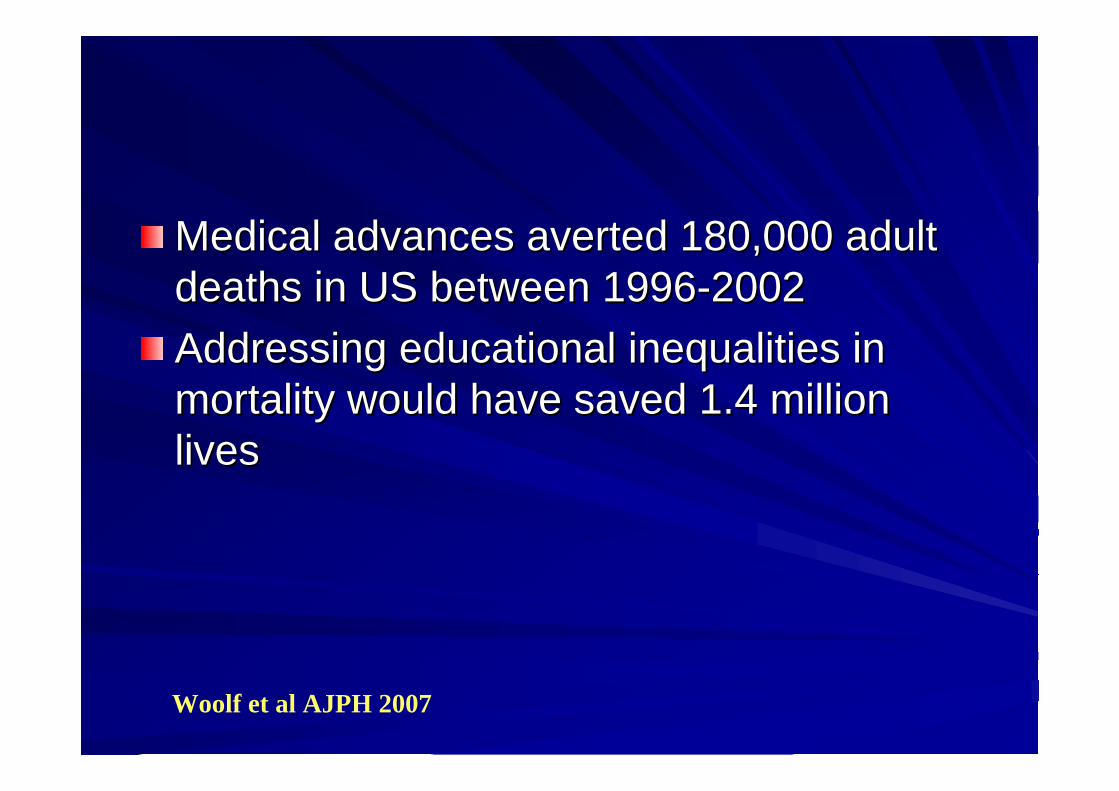
Medical advances averted 180,000 adult Medical advances averted 180,000 adult deaths in US between 1996deaths in US between 1996--20022002Addressing educational inequalities in Addressing educational inequalities in mortality would have saved 1.4 million mortality would have saved 1.4 million liveslives
Woolf et al AJPH 2007

Cardiovascular disease mortality by quintile of socioeconomic disadvantage, 25–74, 2002, Australia
Note: Age-standardised to the 2001 Australian population aged 25–74 years.Source: AIHW Mortality Database in AIHW Bulletin, 37, 2006

In AustraliaIn Australia
If everyone experienced the same death rates as those in the least disadvantaged areas 28% of deaths from CVD - over 3,400 CVD deaths - would have been avoided in 2002.These excess deaths are due to socioeconomic inequality.
AIHW 2006

(Source: Angus Deaton)

% PROBABILITY OF DYING BETWEEN % PROBABILITY OF DYING BETWEEN AGES 15 AND 60 (2006)AGES 15 AND 60 (2006)
SOURCE: WHO World Health Statistics 2008
4.94.97.87.8SWEDENSWEDEN8.78.717.617.6COLOMBIACOLOMBIA
19.419.421.821.8PAKISTANPAKISTAN9.59.523.423.4SRI LANKASRI LANKA
17.617.624.224.2BOLIVIABOLIVIA15.815.843.243.2RUSSIARUSSIA66.366.379.879.8LESOTHOLESOTHO
FEMALESFEMALESMALESMALES

Reaching the poorReaching the pooror or universal policiesuniversal policies

Use of maternal and child health services by Use of maternal and child health services by lowest and highest economic quintiles, 50 + lowest and highest economic quintiles, 50 +
countriescountries
0102030405060708090
100
Antenatal care Oralrehydration
therapy
Fullimmunisation
Attendeddelivery
Medicaltreatmentof
diarrhea
Higest economic quintiles Lowest economic quintiles% of populationgroup covered
Adapted from Gwatkin et al 2005

0
50
100
150
200
Uganda2000/01
India 1998/99
Turkmenistan2000
Peru 2000 Morocco2003/04
Poorest Less poor Middle Less rich Richest
Under 5 mortality per 1000 live Under 5 mortality per 1000 live births by wealth quintilebirths by wealth quintile
Gwatkin et al, DHS data

Deaths rates (age standardized) for all causes of death by Deaths rates (age standardized) for all causes of death by deprivation twentieth, ages 15deprivation twentieth, ages 15--64, 199964, 1999--2003, England and Wales2003, England and Wales
males
females
The dashed lines are average mortality rates for men and women inEngland and Wales
women
men
Romeri et al 2006

Life expectancy at birth (men)Life expectancy at birth (men)
7979JapanJapan8080US, Montgomery County (white)US, Montgomery County (white)
6363US, Washington D.C. (black)US, Washington D.C. (black)
8282UK, Glasgow (UK, Glasgow (LenzieLenzie N.)N.)
7777UKUK7575USUS7575CubaCuba7272MexicoMexico7171PolandPoland6565LithuaniaLithuania6464PhilippinesPhilippines
6262IndiaIndia5454UK, Glasgow (UK, Glasgow (CaltonCalton))
Sources: WHO World Health Statistics 2007; Hanlon, Walsh & Whyte 2006; Murray et al. 2006

Obesity - selected countries
Source: International Obesity Taskforce
0 10 20 30 40
USA
Australia
Brazil
Canada
England
India
Japan
Mexico
New Zealand
Russia
Scotland
% BMI 30kg/m3 and over
Men Women
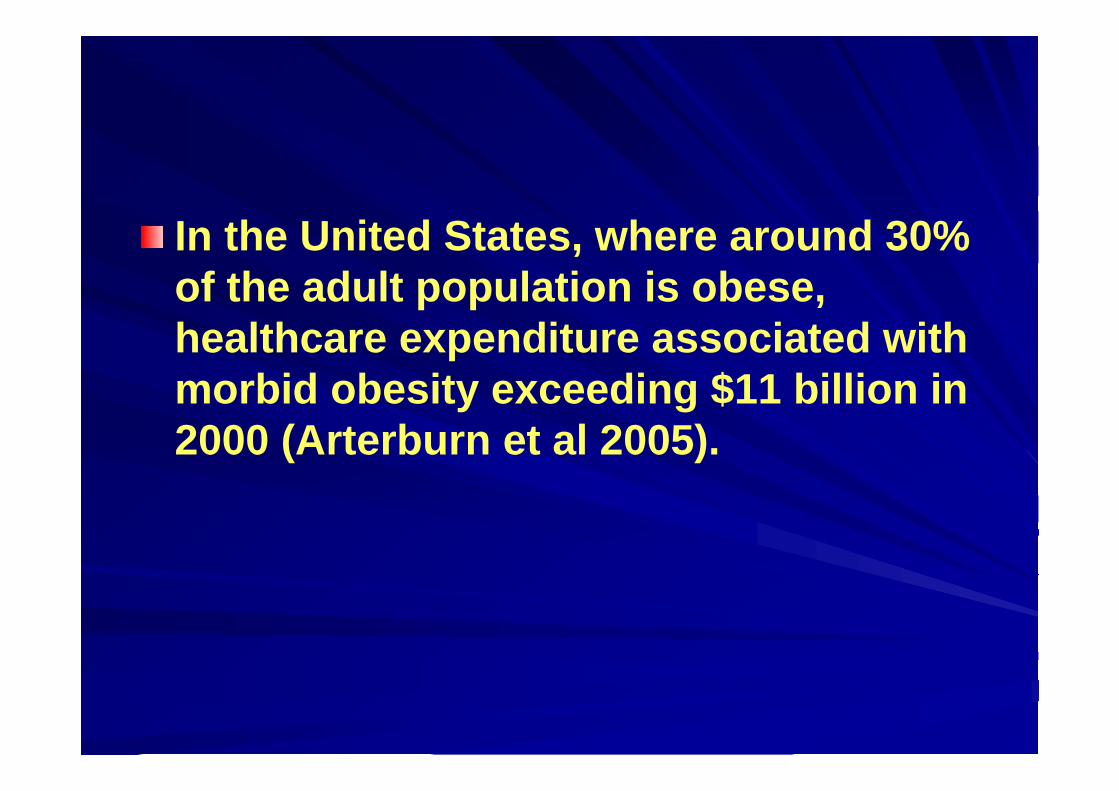
In the United States, where around 30% of the adult population is obese, healthcare expenditure associated with morbid obesity exceeding $11 billion in 2000 (Arterburn et al 2005).

Global Trends in Road Traffic DeathsGlobal Trends in Road Traffic Deaths

Proportion of population aged 60 or overProportion of population aged 60 or over
0
5
10
15
20
25
30
35
1950 1975 2007 2025 2050
World More developed regions Less developed regions
%
Source: World Population Ageing 2007, UNDESA

Source: World Health Statistics, WHO, 2008
Projected deaths by cause for high-, middleand low-income countries
CVD
CVD
CVD


Imperative for action Imperative for action –– why and why now?why and why now?Areas for actionAreas for actionAdvancing SDH Advancing SDH

Conditions in which people are born, grow, live, work and age
Structural drivers of those conditions at global, national and local level
CSDH CSDH –– Areas for ActionAreas for Action
Monitoring, Training, Research

England and Wales experienceEngland and Wales experienceScientific Reference groupScientific Reference group

UK Government Target to UK Government Target to Reduce Health InequalitiesReduce Health Inequalities
By 2010 to reduce inequalities in By 2010 to reduce inequalities in health outcomes by 10% as health outcomes by 10% as measured by infant mortality measured by infant mortality and life expectancy at birthand life expectancy at birth

TACKLING HEALTH INEQUALITIESTACKLING HEALTH INEQUALITIESUK GOVERNMENTUK GOVERNMENT
ACHESON 1998ACHESON 1998
HMT CROSS CUTTING REVIEW 2002HMT CROSS CUTTING REVIEW 2002
PROGRAMME FOR ACTION 2003PROGRAMME FOR ACTION 2003

Female life expectancy at birth, inequality gapFemale life expectancy at birth, inequality gap
DH Status Report 2007

Infant mortality by socioeconomic group, Infant mortality by socioeconomic group, England and WalesEngland and Wales
DH Status Report on Tackling Health Inequalities

Policy choicesPolicy choicesMedical care?Medical care?GrowingGrowingLiving and workingLiving and workingAgeingAgeingHealth behavioursHealth behaviours

Policy Entry PointsPolicy Entry PointsSocial stratification Social stratification ––peoplepeople’’s social s social position related to position related to their healththeir healthDifferential exposure Differential exposure to health damaging to health damaging conditionsconditionsDifferential Differential vulnerability vulnerability Differential Differential consequences of ill consequences of ill healthhealth
LevelLevel
GlobalGlobalRegionalRegionalNationalNationalLocalLocalHouseholdHouseholdIndividualIndividual

Participationin
society
Economicand socialsecurity
Conditions inchildhood
and adolescence
Healthierworking
life
Environmentsand
products
Healthpromotingmedical
care
Preventioncommunicable
disease
Sexualhealth
Physicalactivity
EatingSafe food
Alcoholdrugs
tobacco
SWEDISH PUBLIC HEALTH POLICY

Proportion relatively poor pre and Proportion relatively poor pre and post welfare state redistributionpost welfare state redistribution
05
1015202530354045
Finland
Norway
Sweden
BelgiumGerm
any
Netherlands
Italy
SpainCanada UK US
poverty rates post tax & transfers poverty reduction by income redistribution
71% 71% 72%
Source: Fritzell & Ritakallio 2004 using Luxembourg Income Study data,CSDH Nordic Network
62% 63% 59%
54%49%
44%50%
24%
Pove
rty
%

FAMILY POLICY GENEROSITY AND FAMILY POLICY GENEROSITY AND CHILD POVERTYCHILD POVERTY
SWENOR
SWINET
ITAIRE
GERFRA
FIN
CAN
BELAUT
AUS UK
USA
0
5
10
15
20
25
0 10 20 30 40 50 60 70 80 90 100
–– Countries with generous Countries with generous family policies have lower family policies have lower child poverty rateschild poverty rates
–– This association is mainly This association is mainly due to policies that support due to policies that support dual earner familiesdual earner families
–– The contribution may be The contribution may be direct through the amount direct through the amount of benefits paid, or indirect of benefits paid, or indirect by supporting two earners by supporting two earners and thereby raising the and thereby raising the market income of the market income of the household household
Povety Povety (%)(%)
Family Policy Family Policy Generosity (%)Generosity (%)
CSDH Nordic Network

Effects of direct and indirect taxation on % shares of Effects of direct and indirect taxation on % shares of equivalisedequivalisedincome for all households by quintile* UK, 2005income for all households by quintile* UK, 2005--0606
0
10
20
30
40
50
60
Bottom 2nd 3rd 4th Top Gini co %
Original Gross Disposable Post-tax
* Households are ranked by equivalised disposable income Source: Office for National Statistics
% Gross income = original income + cash benefitsDisposable income = after direct taxesPost-tax income = after direct and indirect taxes

Effects of benefits in kind (state education, health Effects of benefits in kind (state education, health service etc) on final income by quintile groups (2005service etc) on final income by quintile groups (2005--06)06)
05 000
10 00015 00020 00025 00030 00035 00040 00045 00050 000
Bottom
2n
d
3rd
4th
Top
All hous
eholds
Post-tax income Final income
Households are ranked by equivalised disposable income Source: Office for National Statistics
£ per yearper household

Social Determinants of HealthSocial Determinants of Health
The causesThe causes……And the causes of the And the causes of the
causescauses

Medical care?Medical care?GrowingGrowingLiving and workingLiving and workingAgeingAgeingHealth behavioursHealth behaviours

EXPENDITURE ON MEDICAL CARE EXPENDITURE ON MEDICAL CARE PER CAPITA IN US AND UKPER CAPITA IN US AND UK
UNITED STATES: UNITED STATES: –– US$ 6,096US$ 6,096
UNITED KINGDOM: UNITED KINGDOM: –– US$ 2,560 (adjusted for purchasing US$ 2,560 (adjusted for purchasing
power)power)
(Human Development Report 2007/2008)

HEALTH DIFFERENCES BETWEEN ENGLAND AND HEALTH DIFFERENCES BETWEEN ENGLAND AND THE USTHE US
5555--64 year olds64 year olds
0
5
10
15
20
25
England US England US England US
Low income Middle income High Income
Heart disease Diabetes CancerSource: Banks, Marmot, Oldfield and Smith; JAMA 2006
% Prevalence

Medical careMedical careGrowingGrowingLiving and workingLiving and workingAgeingAgeingHealth behavioursHealth behaviours

Effects of nutritional supplementation and psychosocial Effects of nutritional supplementation and psychosocial stimulation on stunted children in a 2 year study, Jamaicastimulation on stunted children in a 2 year study, Jamaica
Granthan-McGregor et al 1991

Effect of psychosocial stimulation in early Effect of psychosocial stimulation in early childhood on school drop out age 17childhood on school drop out age 17--18: 18:
Jamaican cohort studyJamaican cohort study
0
5
10
15
20
25
30
35
Control Stimulated
% School dropout: stunted % School drop out: not stunted
Walker et al, Lancet, 2005
%Drop out

Medical care?Medical care?GrowingGrowingLiving and workingLiving and workingAgeingAgeingHealth behavioursHealth behaviours

WorkWork
Stress in the workplace Stress in the workplace increases the risk of increases the risk of disease.disease.

The The IsoIso--strain concept of stress at workstrain concept of stress at work
Socially isolated Socially isolated –– (no supportive co(no supportive co--workers or supervisors)workers or supervisors)High strain High strain –– (High demands and low control)(High demands and low control)

ODDS RATIO* OF METABOLIC SYNDROME BY EXPOSURE TOODDS RATIO* OF METABOLIC SYNDROME BY EXPOSURE TOISOISO--STRAIN: WHITEHALL II PHASES 1 TO 5STRAIN: WHITEHALL II PHASES 1 TO 5
0
0.5
1
1.5
2
2.5
3
No exposure 1 exposure 2 exposures 3 or moreexposures
Odds Ratio
Exposure to Iso-strain
Chandola, Brunner & Marmot, BMJ, 2006
*Adj. for age, employment, grade and health behaviours

PAR* for coronary heart disease (fatal CHD/non fatal MI/definite angina)
0
10
20
30
40
50
DCS
ERIJu
stice
CombinedFull a
djustmen
t
PAR%
Each domainCombinedFull adjustment
PAR for all combined *
30% 95% CI 10%-46%
adjusted for other predictors
29% 95% CI 9%-45%
odds ratios adjusted for age, sex, employment grade J Head et al,2007*Population attributable risk

SOCIAL EXCLUSIONSOCIAL EXCLUSION
SOCIAL SUPPORTSOCIAL SUPPORT
SOCIAL CAPITAL?SOCIAL CAPITAL?

NEIGHBOURHOOD SOCIAL COHESION AND NEIGHBOURHOOD SOCIAL COHESION AND SELFSELF--RATED HEALTHRATED HEALTH
0.5
1
1.5Odds ratio of poor health compared to high social cohesion areas
Family ties Trust Attachment Tolerance
High Medium Low
Source: HSE participants living in Greater London

POOR SELFPOOR SELF--RATED HEALTH AND % SINGLE RATED HEALTH AND % SINGLE PARENT HOUSEHOLDS IN NEIGHBOURHOODPARENT HOUSEHOLDS IN NEIGHBOURHOOD
0.80.9
11.11.21.31.41.51.61.71.8
HELSINKI LONDON
Low High Low High% single parent households in neighbourhood
Odd
s rat
io*
Poor self-rated health
(Stafford et al. JECH 2004)*Adjusted for age and sex

Medical care?Medical care?GrowingGrowingLiving and workingLiving and workingAgeingAgeingHealth behavioursHealth behaviours

Loneliness by wealthLoneliness by wealth
0%
10%
20%
30%
40%
50%
60%
Poorest q
uintile2n
d quint
ile3rd
quintile
4th quintile
Wealth
iest q
uintile
Feel lack ofcompanionshipFeel left out
Feel isolated fromothersFeel in tune withpeople around
% often/some of the time (except for “Feel in tune with people around”where % refers to hardly ever/never)
Source: English Longitudinal Study of Ageing

Poor SelfPoor Self--rated health at ages 65 and over by rated health at ages 65 and over by perceptions of neighbourhood environment: UKperceptions of neighbourhood environment: UK
0
0.5
1
1.5
2
2.5
Area rating of facilities*
very good goodfair poor/v. poor
0
0.2
0.4
0.6
0.8
1
1.2
Problems in area
very big bigsome fewno problems
Odds ratio Odds ratio
(Source: Bowling et al JECH 2006; 60:476-483)
*facilities in the local area: leisure/social/facilities for people aged 65+, rubbish collectionhealth facilities, transport, closeness to shops, somewhere nice to go for a walk)

Minimum income for healthy living Minimum income for healthy living –– Morris et al.Morris et al.–– DietDiet–– Physical activity/body and mindPhysical activity/body and mind–– Psychosocial relations/social connections/activePsychosocial relations/social connections/active
mindsminds–– Getting aboutGetting about–– Medical careMedical care–– HygieneHygiene–– HousingHousing

Psychosocial relations/social connections/active mindsPsychosocial relations/social connections/active minds
TelephoneTelephoneStationery, stampsStationery, stampsGifts to Gifts to grandchildren/othersgrandchildren/othersCinema, sports, etcCinema, sports, etcMeeting friends, Meeting friends, entertainingentertaining
TV set and licenceTV set and licenceNewspapersNewspapersHolidays (UK)Holidays (UK)Miscellaneous, Miscellaneous, hobbies, gardening hobbies, gardening etcetc
Morris et al 2007

Disposable incomes for people Disposable incomes for people over 65, England 2007over 65, England 2007
State State pensionpension
Pension Pension credit credit guarantee*guarantee*
Minimum Minimum income for income for healthy healthy living **living **
Single Single personperson
££87.3087.30 ££119.05119.05 ££131.00131.00
CoupleCouple ££139.60139.60 ££181.70181.70 ££208.00208.00
*Rent, mortgage and council tax may be paid after further means testing** people 65+ living independently in the community; excludes rent, mortgageand council taxMorris et al 2007 IJE

Medical care?Medical care?GrowingGrowingLiving and workingLiving and workingAgeingAgeingHealth behavioursHealth behaviours

health is not simply about individual behaviour or exposure to risk, but how the socially and economically
structured way of life of a population shapes its health
The Causes of the Causes

Average weekly alcohol consumption by Average weekly alcohol consumption by sex and socioeconomic class sex and socioeconomic class –– Great Great
BritainBritain
02468
1012141618
Managerial andprofessional
Intermediate Routine and manual
men women
ONS General Household Survey 2005
Mean numberof units a week

AgeAge--standardised alcoholstandardised alcohol--related death rates by deprivation* related death rates by deprivation* twentieth and sex, England and Wales 1999twentieth and sex, England and Wales 1999--20032003
* Carstairs deprivation index
Mostdeprived
Least deprived
Source: ONS 2007

Socioeconomic inequalities in male cirrhosis of Socioeconomic inequalities in male cirrhosis of the liver mortality: Australian manual and nonthe liver mortality: Australian manual and non--
manual workersmanual workers
02468
1012141618
1992 2002
manual non-manual
Najman et al 2007
1992: manual 2 times mortality rateof non-manual
2002: manual 2.5 times mortality rateof non-manual
Age
stan
dard
ised
Mor
talit
y p
er 1
00,0
00

Closing the gap in a Closing the gap in a generationgeneration

Improvements in under 5 mortality rates/1000 live Improvements in under 5 mortality rates/1000 live births births –– selected countries 1970 selected countries 1970 -- 20052005
0 50 100 150 200 250 300
Nigeria
Ghana
Egypt
Tunisia
Brazil
Mexico
Costa Rica
Chile
Portugal
19702005
Source: UNDP 2007

Early child development and education
Healthy Places Fair Employment Social Protection
Universal Health Care
Health Equity in all Policies
Fair Financing Good GlobalGovernance
Market Responsibility
Gender Equity
Political empowerment – inclusion and voice
CSDH CSDH –– Areas for ActionAreas for Action

Positioning health equity as a global Positioning health equity as a global development outcome;development outcome;Development of society judged by:Development of society judged by:–– population healthpopulation health–– fair distribution of healthfair distribution of health–– protection from disadvantage due to illprotection from disadvantage due to ill--healthhealth

Early child development and education
Healthy Places Fair Employment Social Protection
Universal Health Care
Health Equity in all Policies
Fair Financing Good GlobalGovernance
Market Responsibility
Gender Equity
Political empowerment – inclusion and voice
CSDH CSDH –– Areas for ActionAreas for Action

CSDH CSDH –– where we are where we are –– where we are where we are goinggoingImperative for action Imperative for action –– why and why now?why and why now?Canada Canada –– action on SDHaction on SDHAreas for actionAreas for actionAdvancing SDH Advancing SDH

Building a social movement for Building a social movement for action on the social action on the social
determinants of health and determinants of health and health equityhealth equity

““LetLet’’s not forget that visionaries have s not forget that visionaries have been the realists in human been the realists in human progressprogress…”…”
HalfdanHalfdan Mahler, WHA 2008Mahler, WHA 2008

www.who.int/social_determinants/en
A world where social
justice is taken
seriously