Embed Size (px)
Citation preview
The Software IndustryThe Software IndustryThe Software Industry Financial Report
The Software Industry Financial Report
S ft E it G L L CSoftware Equity Group, L.L.C.12220 El Camino RealSuite 320San Diego, CA [email protected](858) 509-2800
SOFTWARE INDUSTRY FINANCIAL REPORT CONTENTSAbout Software Equity Group
Leaders in Software M&A 4Extensive Global Reach 5
Software Industry MacroeconomicsGlobal GDP 7Global GDP 7U.S. GDP and Unemployment 8Global IT Spending 9E-Commerce and Digital Advertising Spend 10Stock Market Performance 11
Public Software Financial and Valuation PerformanceThe SEG Software Index 13The SEG Software Index: Financial Performance 14-15The SEG Software Index: Market Multiples 16-17The SEG Software Index by Product Category 18The SEG Software Index by Product Category: Financial Performance 19The SEG Software Index by Product Category: Market Multiples 20
Public SaaS Company Financial and Valuation PerformanceThe SEG SaaS Index 22The SEG SaaS Index: Financial Performance 23-24The SEG SaaS Index: Market Multiples 25-29Th SEG S S I d b P d t C t 30 31The SEG SaaS Index by Product Category 30-31The SEG SaaS Index by Product Category: Financial Performance 32The SEG SaaS Index by Product Category: Market Multiples 33
Public Internet Company Financial and Valuation PerformanceThe SEG Internet Index 35Th SEG I t t I d Fi i l P f 36 37The SEG Internet Index: Financial Performance 36-37The SEG Internet Index: Market Multiples 38-39The SEG Internet Index by Product Category 40The SEG Internet Index by Product Category: Financial Performance 41The SEG Internet Index by Product Category: Market Multiples 42
1 Q1 2014 Software Industry Financial ReportCopyright © 2014 by Software Equity Group, LLC
All Rights Reserved
SOFTWARE INDUSTRY FINANCIAL REPORT CONTENTSSoftware Industry M&A Market Update
Software/SaaS M&A Deal Volume and Spending 44Software M&A Exit Multiples 45Software M&A by Ownership Structure and Size 46Software M&A by Vertical and Horizontal Markets 47ySoftware M&A Deal Volume by Product Category 48Software M&A Exit Valuations by Product Category 49SaaS M&A Deal Volume and Exit Multiples 50SaaS M&A by Product Category 51SaaS M&A 1Q14 Transactions 52-54Internet M&A: Deal Volume and Exit Multiples 55Internet M&A: By Product Category 56
AppendixSEG Software Index Key Metrics 58-61SEG Software Index Key Metrics by Product Category 62-63SEG SaaS Index Key Metrics 64SEG SaaS Index Key Metrics by Product Category 65 SEG Internet Index Key Metrics 66-68SEG Internet Index Key Metrics by Product Category 691Q14 Select Public Sellers 701Q14 Mega Deals 711Q14 Mega Deals 711Q14 Most Active Buyers 72About Software Equity Group 73
2 Q1 2014 Software Industry Financial ReportCopyright © 2014 by Software Equity Group, LLC
All Rights Reserved
ABOUT SOFTWARE EQUITY GROUP
3
• Industry leading boutique investment bank founded in
LEADERS IN SOFTWARE M&AIndustry leading boutique investment bank, founded in 1992, representing public and private software and internet companies seeking:
• Strategic exit• Growth capital
We Do Deals.
Growth capital• Buyout • Inorganic growth via acquisition• Buy and sell-side mentoring• Fairness opinions and valuationsFairness opinions and valuations
• Sell-side client revenue range: $5 - 75 million• Buy-side clients include private equity firms and
NASDAQ, NYSE and foreign exchange listed companies• Clients span virtually every software technology, product
category, delivery model and vertical market• Global presence providing advice and guidance to more
th 2 000 i t d bli i th h t USthan 2,000 private and public companies throughout US, Canada, Europe, Asia-Pacific, Africa and Israel
• Strong cross-functional team leveraging transaction, operating, legal and engineering experience
• Unparalleled software industry reputation and track record.
• Highly referenceable base of past clients
4 Q1 2014 Software Industry Financial ReportCopyright © 2014 by Software Equity Group, LLC
All Rights Reserved
EXTENSIVE GLOBAL REACH
Current Sell-side Representation
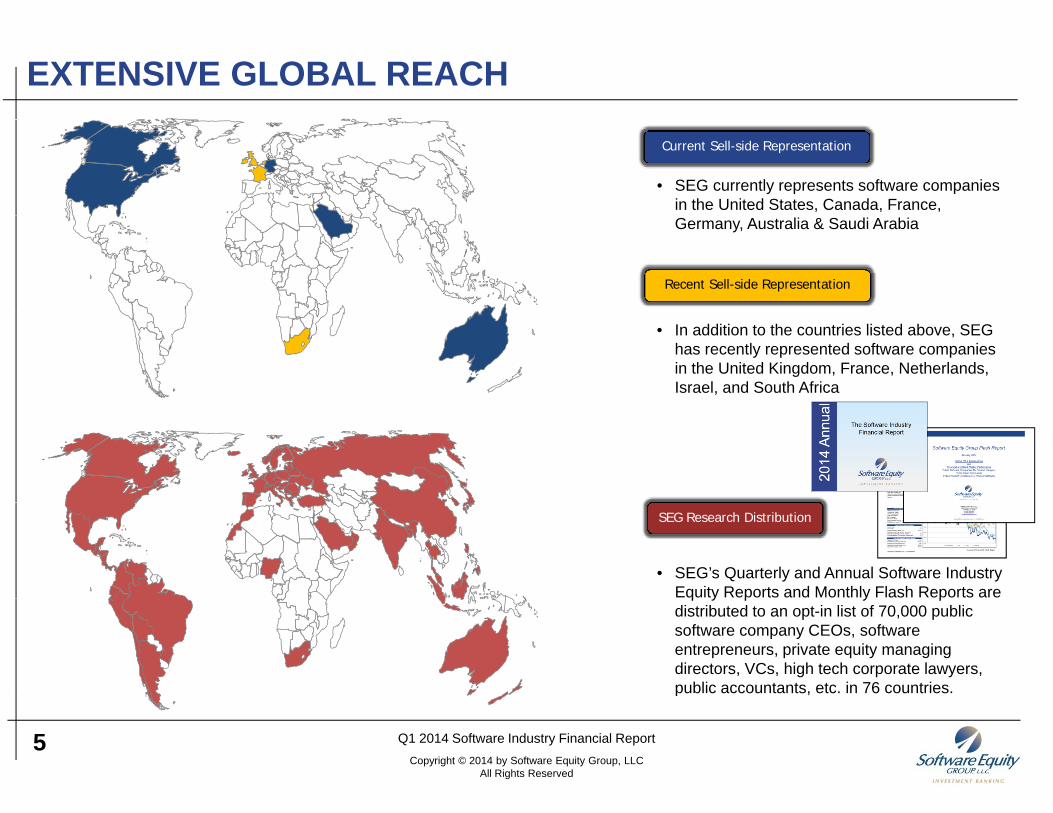
• SEG currently represents software companies in the United States, Canada, France,
Recent Sell-side Representation
Germany, Australia & Saudi Arabia
• In addition to the countries listed above, SEG has recently represented software companies in the United Kingdom, France, Netherlands, Israel, and South Africa
SEG Research Distribution
• SEG’s Quarterly and Annual Software Industry Equity Reports and Monthly Flash Reports are q y p y pdistributed to an opt-in list of 70,000 public software company CEOs, software entrepreneurs, private equity managing directors, VCs, high tech corporate lawyers, public accountants, etc. in 76 countries.
5 Q1 2014 Software Industry Financial ReportCopyright © 2014 by Software Equity Group, LLC
All Rights Reserved
p ,
SOFTWARE INDUSTRY MACROECONOMICS
6
GLOBAL GDPGDP SizeGlobal GDP (% YoY Change)
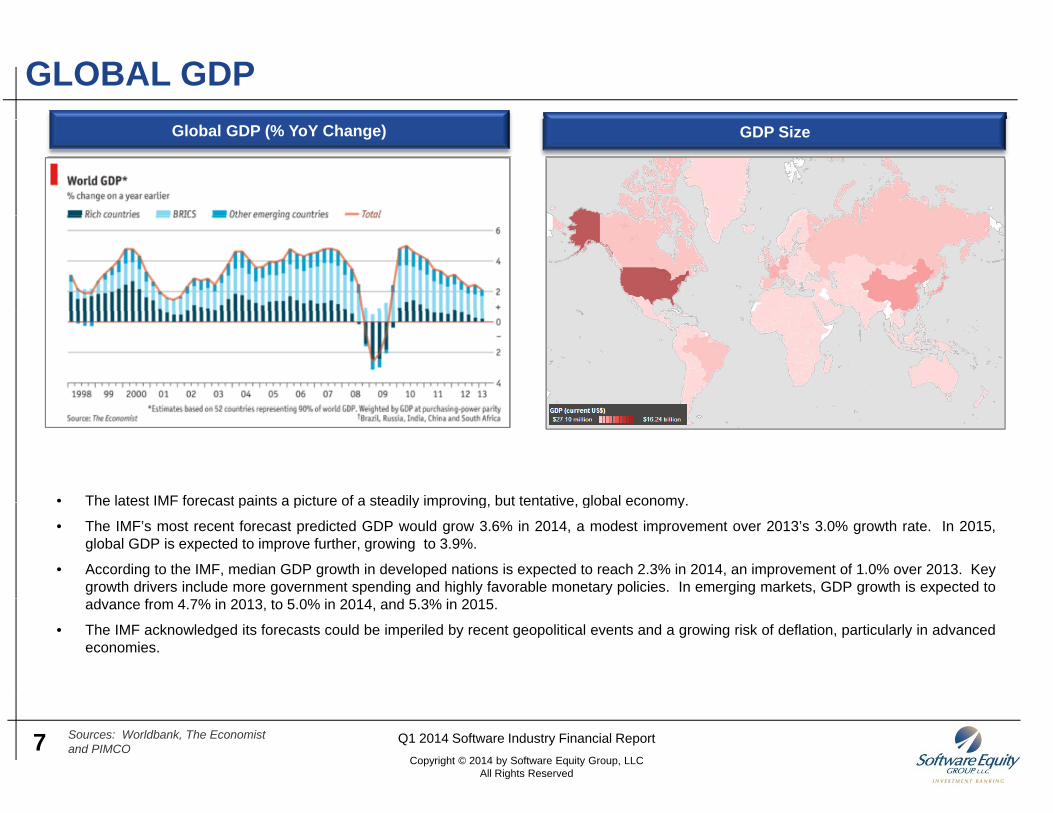
• The latest IMF forecast paints a picture of a steadily improving but tentative global economyThe latest IMF forecast paints a picture of a steadily improving, but tentative, global economy.
• The IMF’s most recent forecast predicted GDP would grow 3.6% in 2014, a modest improvement over 2013’s 3.0% growth rate. In 2015,global GDP is expected to improve further, growing to 3.9%.
• According to the IMF, median GDP growth in developed nations is expected to reach 2.3% in 2014, an improvement of 1.0% over 2013. Keygrowth drivers include more government spending and highly favorable monetary policies. In emerging markets, GDP growth is expected toadvance from 4.7% in 2013, to 5.0% in 2014, and 5.3% in 2015.
• The IMF acknowledged its forecasts could be imperiled by recent geopolitical events and a growing risk of deflation, particularly in advancedeconomies.
7 Q1 2014 Software Industry Financial ReportCopyright © 2014 by Software Equity Group, LLC
All Rights Reserved
Sources: Worldbank, The Economist and PIMCO
U.S. GDP AND UNEMPLOYMENT
5.0%3.7%
3 1%4.1% 4.1%
4%
6%
8%
10%GDP % GrowthUnemployment Rate
-0.7%
1.5%
-0.7%
2.2%1.7%
2.6%3.1%
0.4%
2.5%1.3%
2.0%1.3%
3.1%
0.4%
2.5%1.8%
2.6% 2.0%
-2%
0%
2%
4%
-2.7%
-5.4%-6.4%
-8%
-6%
-4%
-2%
• According to February’s Federal Reserve survey of 45 economists GDP growth in 1Q14 is forecast to be 2 0% For the year expectations
1Q08 1Q09 1Q10 1Q11 1Q12 1Q13 1Q14
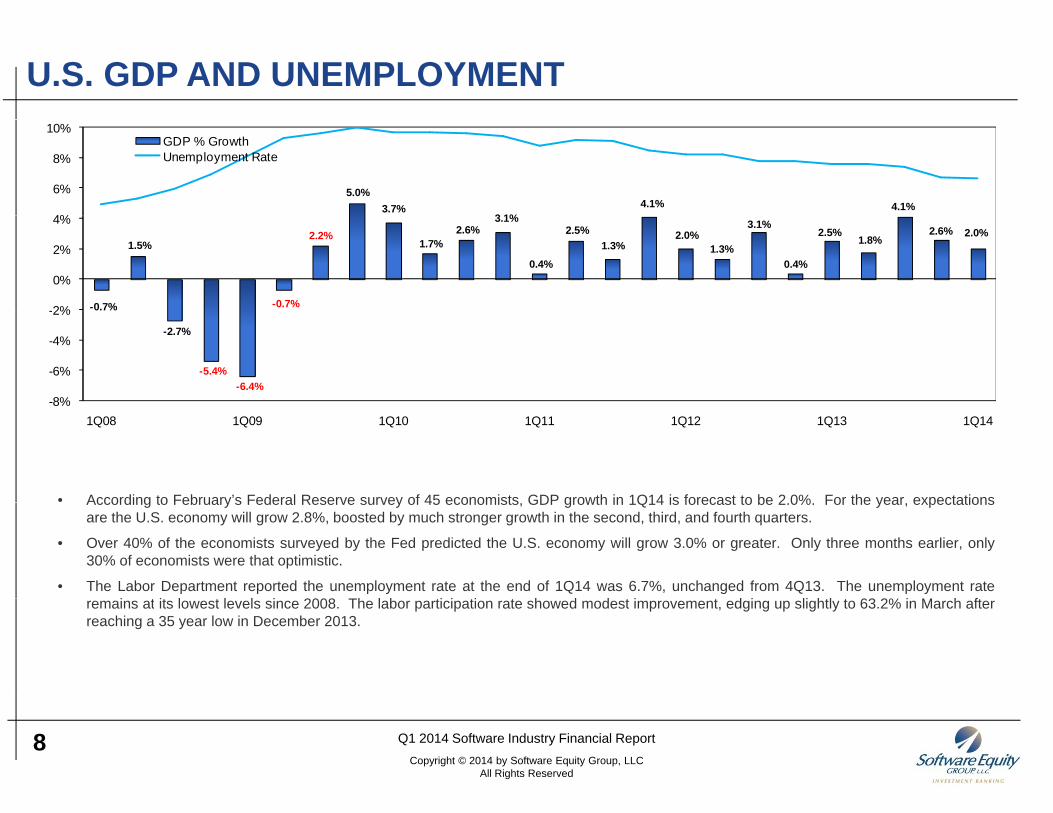
According to February s Federal Reserve survey of 45 economists, GDP growth in 1Q14 is forecast to be 2.0%. For the year, expectationsare the U.S. economy will grow 2.8%, boosted by much stronger growth in the second, third, and fourth quarters.
• Over 40% of the economists surveyed by the Fed predicted the U.S. economy will grow 3.0% or greater. Only three months earlier, only30% of economists were that optimistic.
• The Labor Department reported the unemployment rate at the end of 1Q14 was 6.7%, unchanged from 4Q13. The unemployment ratei t it l t l l i 2008 Th l b ti i ti t h d d t i t d i li htl t 63 2% i M h ftremains at its lowest levels since 2008. The labor participation rate showed modest improvement, edging up slightly to 63.2% in March after
reaching a 35 year low in December 2013.
8 Q1 2014 Software Industry Financial ReportCopyright © 2014 by Software Equity Group, LLC
All Rights Reserved
GLOBAL IT SPENDINGGlobal IT Spending by CategoryGlobal IT Spending (% YoY Change)
9.0%
6.0%
8.0%
6.0%4 8%
2.0% 2.0%
4.8%
2007 2008 2009 2010 2011 2012 2013 2014 (F)
10 0%
• On average, analysts were more bullish in their forecasts for Global IT spending in 2014, predicting IT budget increases will more than
-10.0%
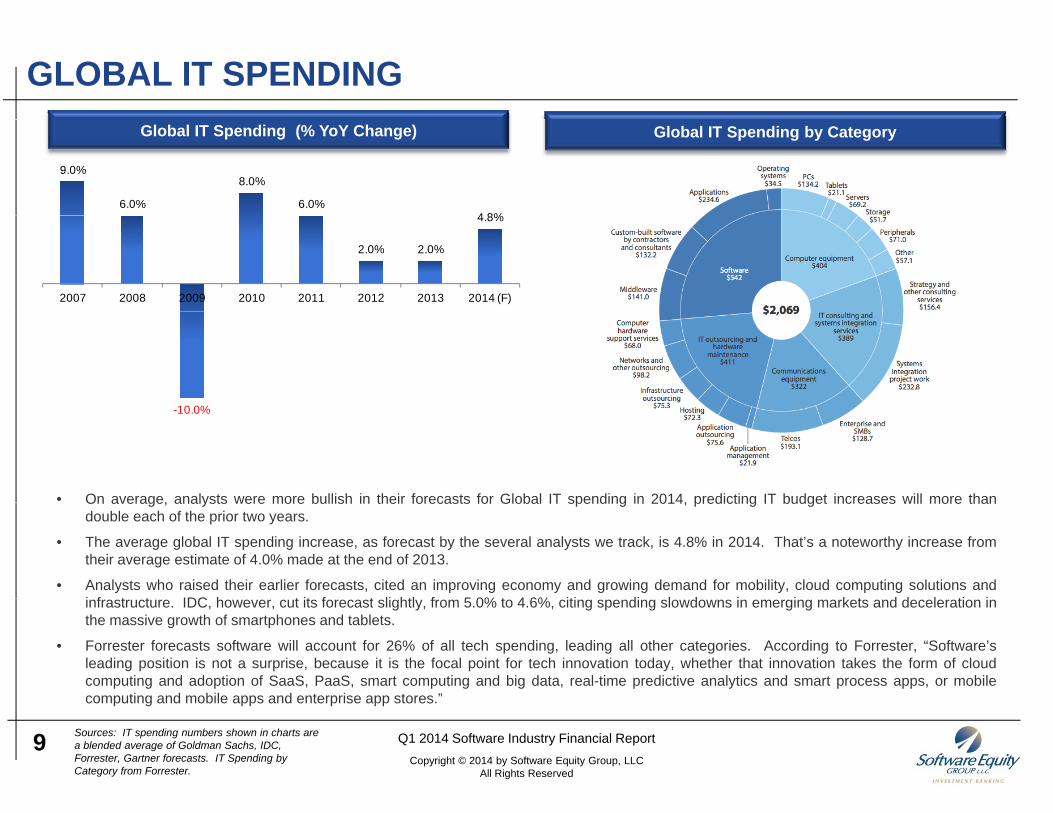
On average, analysts were more bullish in their forecasts for Global IT spending in 2014, predicting IT budget increases will more thandouble each of the prior two years.
• The average global IT spending increase, as forecast by the several analysts we track, is 4.8% in 2014. That’s a noteworthy increase fromtheir average estimate of 4.0% made at the end of 2013.
• Analysts who raised their earlier forecasts, cited an improving economy and growing demand for mobility, cloud computing solutions andi f t t IDC h t it f t li htl f 5 0% t 4 6% iti di l d i i k t d d l ti iinfrastructure. IDC, however, cut its forecast slightly, from 5.0% to 4.6%, citing spending slowdowns in emerging markets and deceleration inthe massive growth of smartphones and tablets.
• Forrester forecasts software will account for 26% of all tech spending, leading all other categories. According to Forrester, “Software’sleading position is not a surprise, because it is the focal point for tech innovation today, whether that innovation takes the form of cloudcomputing and adoption of SaaS, PaaS, smart computing and big data, real-time predictive analytics and smart process apps, or mobile
ti d bil d t i t ”
9 Q1 2014 Software Industry Financial ReportCopyright © 2014 by Software Equity Group, LLC
All Rights Reserved
Sources: IT spending numbers shown in charts are a blended average of Goldman Sachs, IDC, Forrester, Gartner forecasts. IT Spending by Category from Forrester.
computing and mobile apps and enterprise app stores.”
E-COMMERCE AND DIGITAL ADVERTISING SPENDDigital Advertising SpendE-Commerce Spend
25%
30%
$12
$14
B)
Digital Advertising Spend ($B) YoY Percent Change20%
$60
$70E-Commerce Spend ($B) YoY Percent Change
5%
10%
15%
20%
$6
$8
$10
YoY
Cha
nge
dver
tisin
g R
even
ue ($
B
5%
10%
15%
$30
$40
$50
$
YoY
Cha
nge
erce
Spe
ndin
g ($
B)
-10%
-5%
0%
$0
$2
$4
Dig
ital A
d
-5%
0%
$0
$10
$20
Y
E-C
omm
e
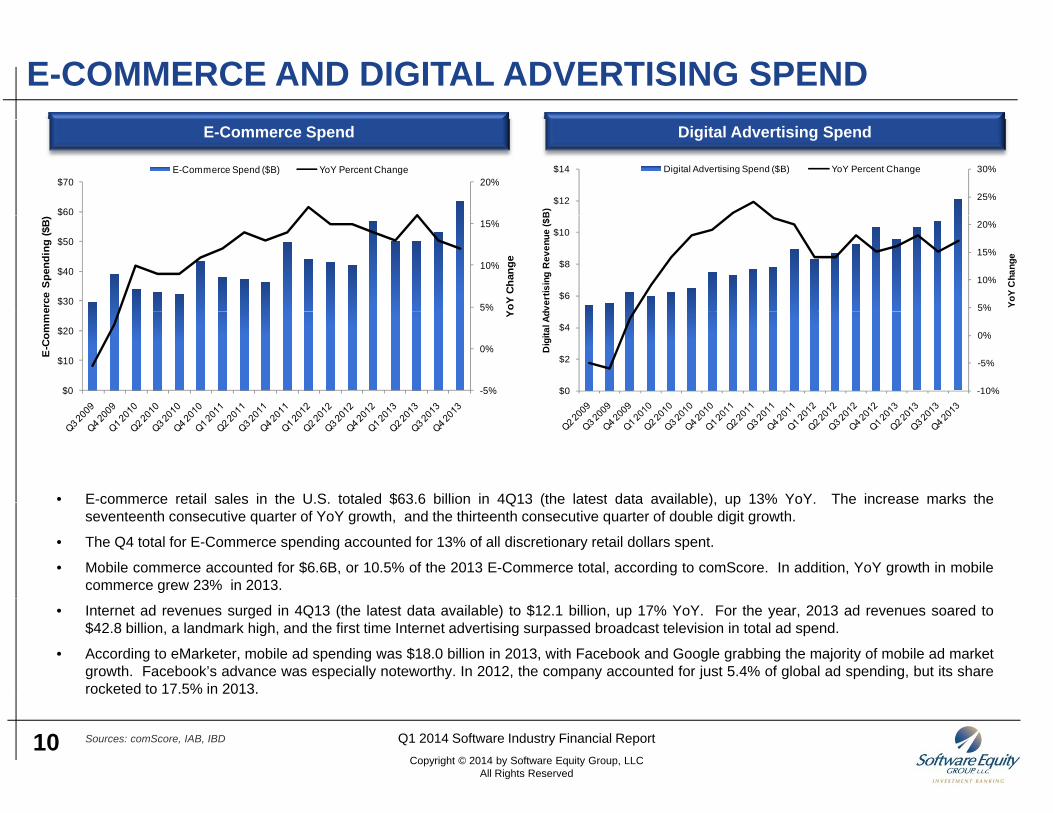
• E-commerce retail sales in the U.S. totaled $63.6 billion in 4Q13 (the latest data available), up 13% YoY. The increase marks theE commerce retail sales in the U.S. totaled $63.6 billion in 4Q13 (the latest data available), up 13% YoY. The increase marks theseventeenth consecutive quarter of YoY growth, and the thirteenth consecutive quarter of double digit growth.
• The Q4 total for E-Commerce spending accounted for 13% of all discretionary retail dollars spent.
• Mobile commerce accounted for $6.6B, or 10.5% of the 2013 E-Commerce total, according to comScore. In addition, YoY growth in mobilecommerce grew 23% in 2013.
• Internet ad revenues surged in 4Q13 (the latest data available) to $12.1 billion, up 17% YoY. For the year, 2013 ad revenues soared to$42.8 billion, a landmark high, and the first time Internet advertising surpassed broadcast television in total ad spend.
• According to eMarketer, mobile ad spending was $18.0 billion in 2013, with Facebook and Google grabbing the majority of mobile ad marketgrowth. Facebook’s advance was especially noteworthy. In 2012, the company accounted for just 5.4% of global ad spending, but its sharerocketed to 17.5% in 2013.
10 Q1 2014 Software Industry Financial ReportCopyright © 2014 by Software Equity Group, LLC
All Rights Reserved
Sources: comScore, IAB, IBD
STOCK MARKET PERFORMANCE
8.0%
10.0%
12.0% DOW S&P NASDAQ SEG SW Index SEG SaaS SEG Internet Index
0.0%
2.0%
4.0%
6.0%
(8 0%)
(6.0%)
(4.0%)
(2.0%)
• After a five year run up that included stellar returns in 2013, the bull market is showing signs of fatigue. After a very slow start in January,
(10.0%)
(8.0%)
Jan 2014 Feb 2014 Mar 2014
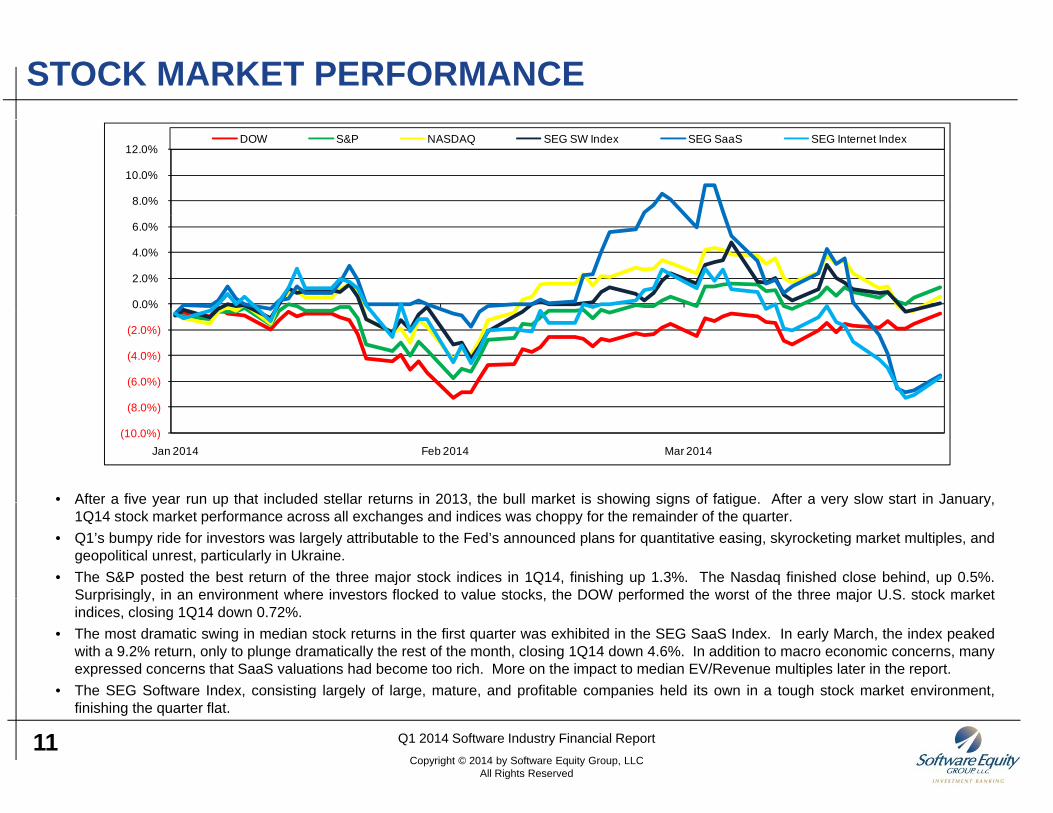
After a five year run up that included stellar returns in 2013, the bull market is showing signs of fatigue. After a very slow start in January,1Q14 stock market performance across all exchanges and indices was choppy for the remainder of the quarter.
• Q1’s bumpy ride for investors was largely attributable to the Fed’s announced plans for quantitative easing, skyrocketing market multiples, andgeopolitical unrest, particularly in Ukraine.
• The S&P posted the best return of the three major stock indices in 1Q14, finishing up 1.3%. The Nasdaq finished close behind, up 0.5%.Surprisingly, in an environment where investors flocked to value stocks, the DOW performed the worst of the three major U.S. stock marketSurprisingly, in an environment where investors flocked to value stocks, the DOW performed the worst of the three major U.S. stock marketindices, closing 1Q14 down 0.72%.
• The most dramatic swing in median stock returns in the first quarter was exhibited in the SEG SaaS Index. In early March, the index peakedwith a 9.2% return, only to plunge dramatically the rest of the month, closing 1Q14 down 4.6%. In addition to macro economic concerns, manyexpressed concerns that SaaS valuations had become too rich. More on the impact to median EV/Revenue multiples later in the report.
• The SEG Software Index, consisting largely of large, mature, and profitable companies held its own in a tough stock market environment,
11 Q1 2014 Software Industry Financial ReportCopyright © 2014 by Software Equity Group, LLC
All Rights Reserved
The SEG Software Index, consisting largely of large, mature, and profitable companies held its own in a tough stock market environment,finishing the quarter flat.
THE SEG SOFTWARE INDEX
PUBLIC SOFTWARE COMPANY FINANCIAL ANDPUBLIC SOFTWARE COMPANY FINANCIAL AND VALUATION PERFORMANCE
12
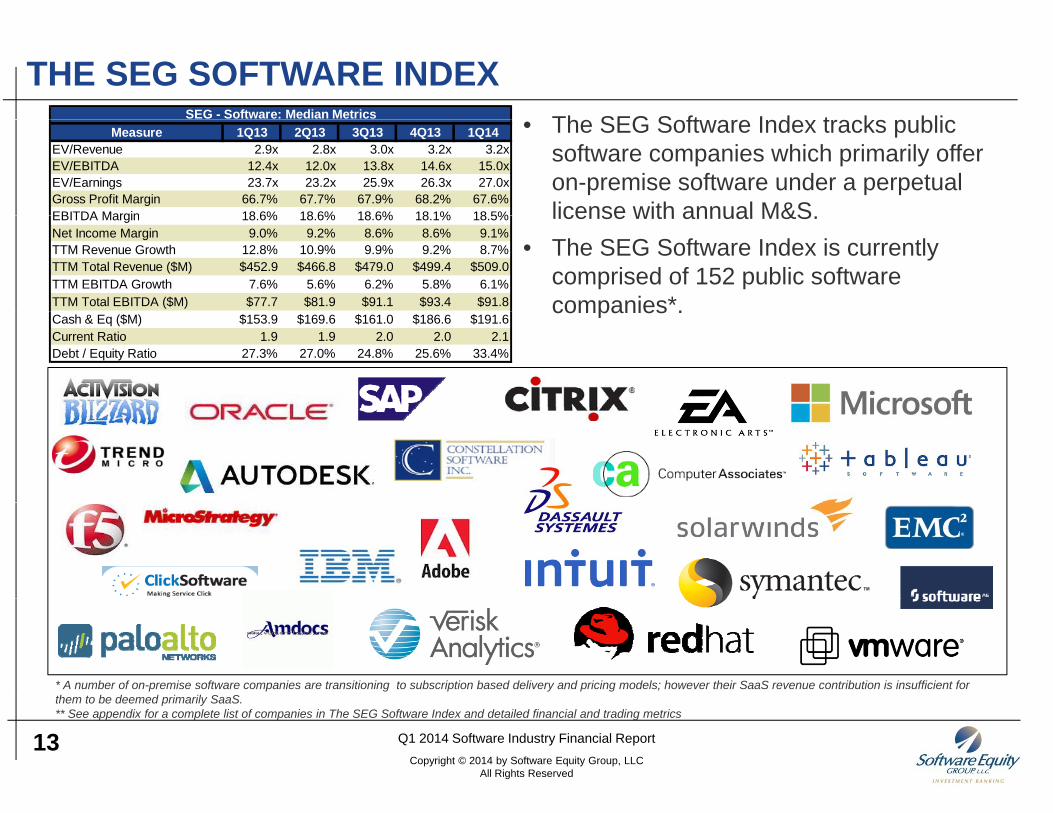
THE SEG SOFTWARE INDEXTh SEG S ft I d t k bliSEG - Software: Median Metrics • The SEG Software Index tracks public software companies which primarily offer on-premise software under a perpetual license with annual M&S
Measure 1Q13 2Q13 3Q13 4Q13 1Q14EV/Revenue 2.9x 2.8x 3.0x 3.2x 3.2xEV/EBITDA 12.4x 12.0x 13.8x 14.6x 15.0xEV/Earnings 23.7x 23.2x 25.9x 26.3x 27.0xGross Profit Margin 66.7% 67.7% 67.9% 68.2% 67.6%EBITDA Margin 18 6% 18 6% 18 6% 18 1% 18 5% license with annual M&S.
• The SEG Software Index is currently comprised of 152 public software companies*.
EBITDA Margin 18.6% 18.6% 18.6% 18.1% 18.5%Net Income Margin 9.0% 9.2% 8.6% 8.6% 9.1%TTM Revenue Growth 12.8% 10.9% 9.9% 9.2% 8.7%TTM Total Revenue ($M) $452.9 $466.8 $479.0 $499.4 $509.0TTM EBITDA Growth 7.6% 5.6% 6.2% 5.8% 6.1%TTM Total EBITDA ($M) $77.7 $81.9 $91.1 $93.4 $91.8 companies .Cash & Eq ($M) $153.9 $169.6 $161.0 $186.6 $191.6Current Ratio 1.9 1.9 2.0 2.0 2.1Debt / Equity Ratio 27.3% 27.0% 24.8% 25.6% 33.4%
* A number of on-premise software companies are transitioning to subscription based delivery and pricing models; however their SaaS revenue contribution is insufficient for
13 Q1 2014 Software Industry Financial ReportCopyright © 2014 by Software Equity Group, LLC
All Rights Reserved
them to be deemed primarily SaaS. ** See appendix for a complete list of companies in The SEG Software Index and detailed financial and trading metrics
THE SEG SOFTWARE INDEX: FINANCIAL PERFORMANCEMedian Revenue Performance - Quarterly TTM Revenue Growth Rate Distribution – 1Q14
14%$600
TTM Total Revenue ($M) TTM Revenue Growth
8%
10%
12%
$300
$400
$500
enue
Gro
wth
al R
even
ue
25%
29%
20%
ompanies
0%
2%
4%
6%
$0
$100
$200
TTM
Rev
e
TTM
Tot
a
11%
5%
10%
% of C
o
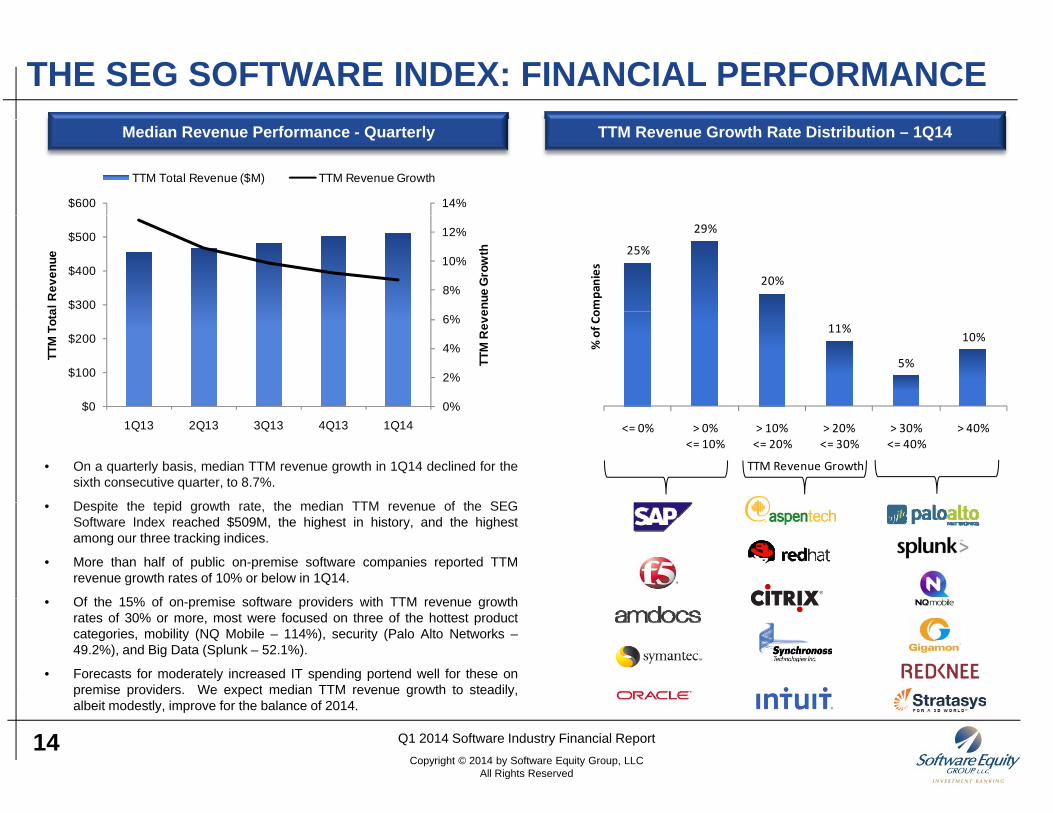
• On a quarterly basis, median TTM revenue growth in 1Q14 declined for thesixth consecutive quarter, to 8.7%.
D it th t id th t th di TTM f th SEG
0%$01Q13 2Q13 3Q13 4Q13 1Q14 <= 0% > 0%
<= 10%> 10%<= 20%
> 20%<= 30%
> 30%<= 40%
> 40%
TTM Revenue Growth
• Despite the tepid growth rate, the median TTM revenue of the SEGSoftware Index reached $509M, the highest in history, and the highestamong our three tracking indices.
• More than half of public on-premise software companies reported TTMrevenue growth rates of 10% or below in 1Q14.
Of th 15% f i ft id ith TTM th• Of the 15% of on-premise software providers with TTM revenue growthrates of 30% or more, most were focused on three of the hottest productcategories, mobility (NQ Mobile – 114%), security (Palo Alto Networks –49.2%), and Big Data (Splunk – 52.1%).
• Forecasts for moderately increased IT spending portend well for these onpremise providers. We expect median TTM revenue growth to steadily,
14 Q1 2014 Software Industry Financial ReportCopyright © 2014 by Software Equity Group, LLC
All Rights Reserved
p e se p o de s e e pect ed a e e ue g o t to stead y,albeit modestly, improve for the balance of 2014.
THE SEG SOFTWARE INDEX: FINANCIAL PERFORMANCETTM EBITDA Margin Distribution – 1Q14Median EBITDA Margin Performance - Quarterly
29%18.6% 18.6% 18.6% 18.1% 18.5%
17%
12%
24%
14%
ompanies
TDA
Mar
gin
12%
5%
% of C
o
EBIT
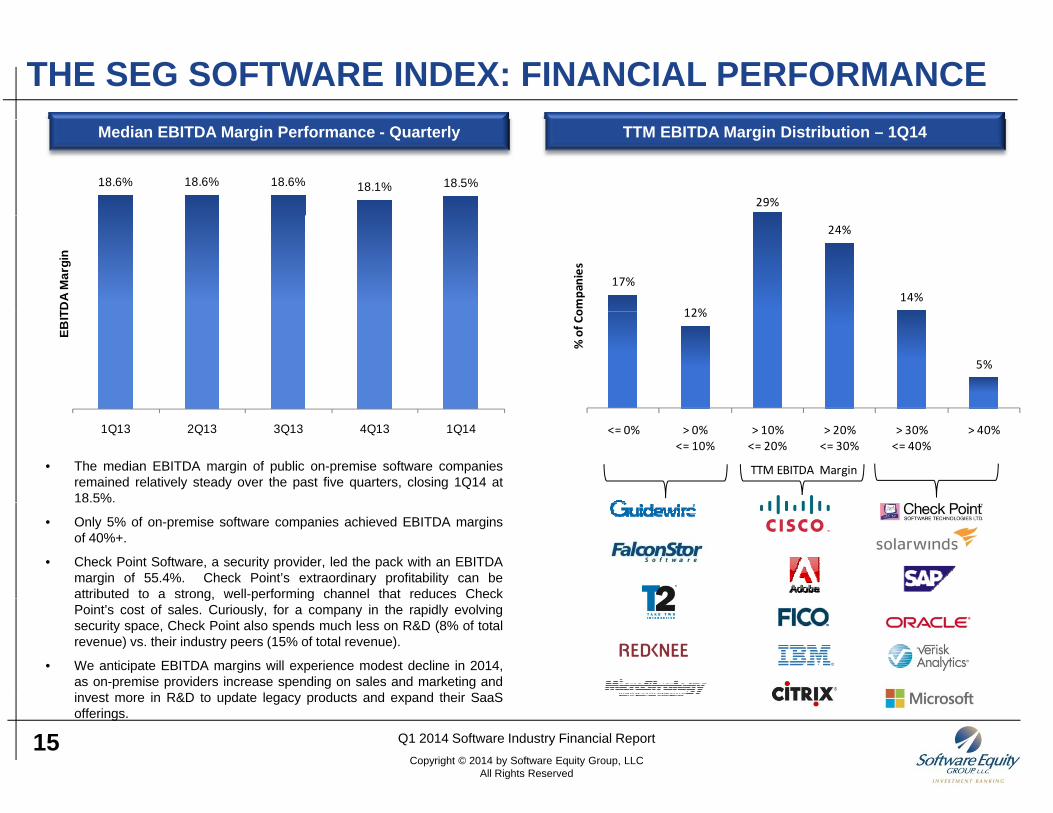
• The median EBITDA margin of public on-premise software companiesremained relatively steady over the past five quarters, closing 1Q14 at18.5%.
<= 0% > 0%<= 10%
> 10%<= 20%
> 20%<= 30%
> 30%<= 40%
> 40%
TTM EBITDA Margin
1Q13 2Q13 3Q13 4Q13 1Q14
%
• Only 5% of on-premise software companies achieved EBITDA marginsof 40%+.
• Check Point Software, a security provider, led the pack with an EBITDAmargin of 55.4%. Check Point’s extraordinary profitability can beattributed to a strong, well-performing channel that reduces Checkg, p gPoint’s cost of sales. Curiously, for a company in the rapidly evolvingsecurity space, Check Point also spends much less on R&D (8% of totalrevenue) vs. their industry peers (15% of total revenue).
• We anticipate EBITDA margins will experience modest decline in 2014,as on-premise providers increase spending on sales and marketing andi t i R&D t d t l d t d d th i S S
15 Q1 2014 Software Industry Financial ReportCopyright © 2014 by Software Equity Group, LLC
All Rights Reserved
invest more in R&D to update legacy products and expand their SaaSofferings.
THE SEG SOFTWARE INDEX: MARKET MULTIPLESEV/Revenue Multiples by Size (TTM Revenue) - QuarterlyMedian EV/Revenue and EV/EBITDA Multiples - Quarterly
14.6x 15.0x
EV/Revenue EV/EBITDA
4.0x
Revenue Greater Than $1 billion Revenue Between $500 million and $1 billion
Revenue Between $100 million and $500 million Revenue Less Than $100 million
12.4x 12.0x
13.8x
2 0x
2.5x
3.0x
3.5x
V/Re
venu
e
2.9x 2.8x 3.0x 3.2x 3.2x
0 0x
0.5x
1.0x
1.5x
2.0x
Med
ian
EV
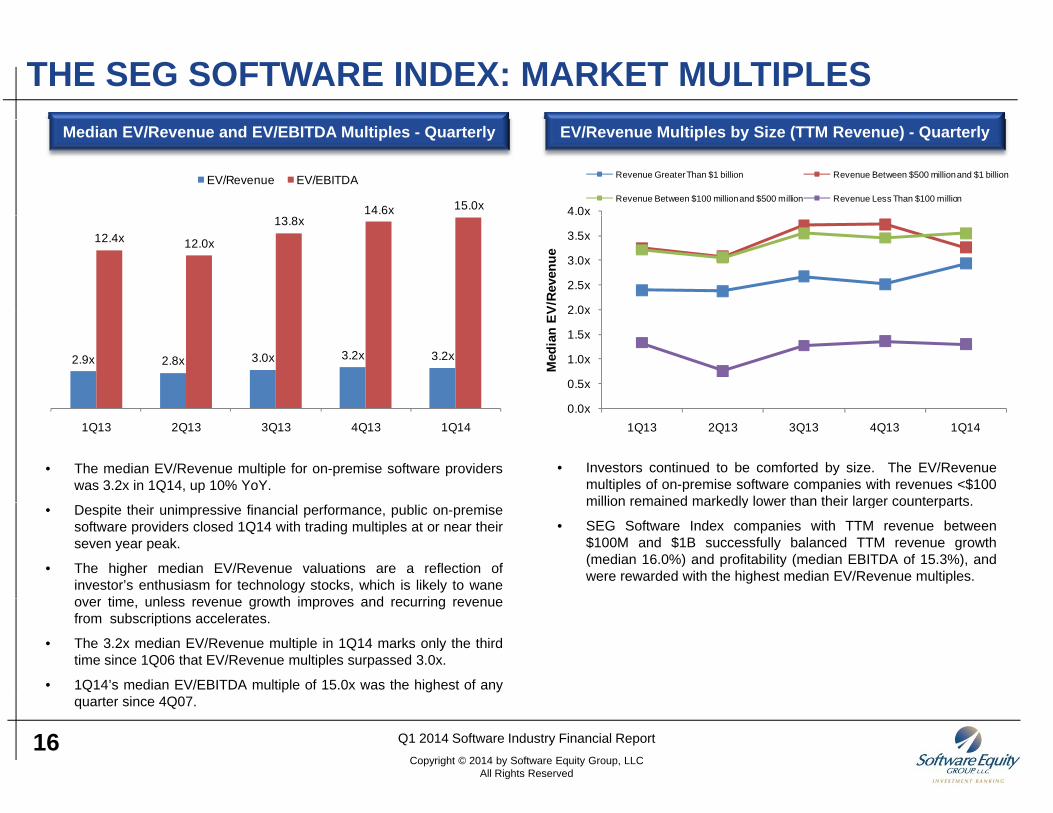
• The median EV/Revenue multiple for on-premise software providerswas 3.2x in 1Q14, up 10% YoY.
• Investors continued to be comforted by size. The EV/Revenuemultiples of on-premise software companies with revenues <$100million remained markedly lower than their larger counterparts
1Q13 2Q13 3Q13 4Q13 1Q140.0x
1Q13 2Q13 3Q13 4Q13 1Q14
• Despite their unimpressive financial performance, public on-premisesoftware providers closed 1Q14 with trading multiples at or near theirseven year peak.
• The higher median EV/Revenue valuations are a reflection ofinvestor’s enthusiasm for technology stocks, which is likely to wane
ti l th i d i
million remained markedly lower than their larger counterparts.
• SEG Software Index companies with TTM revenue between$100M and $1B successfully balanced TTM revenue growth(median 16.0%) and profitability (median EBITDA of 15.3%), andwere rewarded with the highest median EV/Revenue multiples.
over time, unless revenue growth improves and recurring revenuefrom subscriptions accelerates.
• The 3.2x median EV/Revenue multiple in 1Q14 marks only the thirdtime since 1Q06 that EV/Revenue multiples surpassed 3.0x.
• 1Q14’s median EV/EBITDA multiple of 15.0x was the highest of any
16 Q1 2014 Software Industry Financial ReportCopyright © 2014 by Software Equity Group, LLC
All Rights Reserved
quarter since 4Q07.
THE SEG SOFTWARE INDEX: MARKET MULTIPLESEV/Revenue Multiples vs. TTM EBITDA Margins – 1Q14EV/Revenue Multiples vs. TTM Revenue Growth – 1Q14
10.9x7 7
4 8x 5.1xEV/R
even
ue
3 6x 3 5x
7.7x
EV/R
even
ue
2.1x3.1x 3.5x
4.8x
Med
ian
E 3.6x
2.5x 2.4x
3.5x3.0x
Med
ian
E
• The correlation between the public market EV/Revenue multiples • In a departure from the past several years, the market multiples of
<= 0% > 0%<= 10%
> 10%<= 20%
> 20%<= 30%
> 30%<= 40%
> 40%
TTM Revenue Growth
<= 0% > 0%<= 10%
> 10%<= 20%
> 20%<= 30%
> 30%<= 40%
> 40%
TTM EBITDA Margin
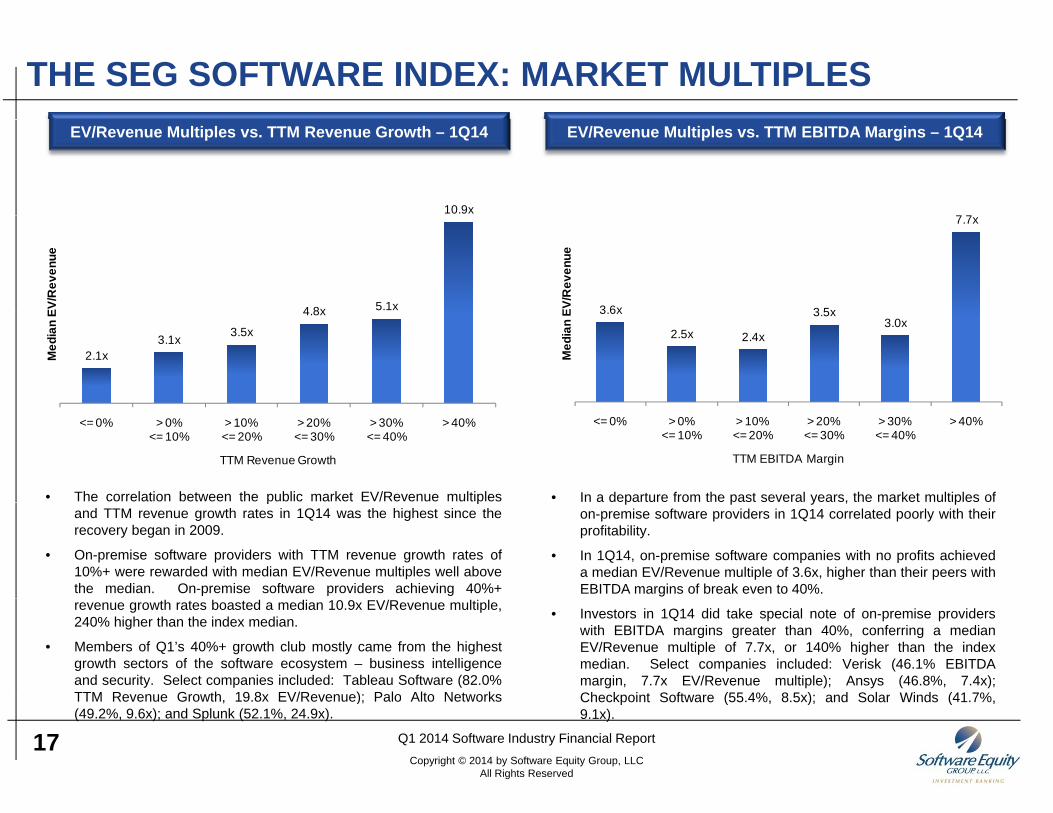
p pand TTM revenue growth rates in 1Q14 was the highest since therecovery began in 2009.
• On-premise software providers with TTM revenue growth rates of10%+ were rewarded with median EV/Revenue multiples well abovethe median. On-premise software providers achieving 40%+
p p y , pon-premise software providers in 1Q14 correlated poorly with theirprofitability.
• In 1Q14, on-premise software companies with no profits achieveda median EV/Revenue multiple of 3.6x, higher than their peers withEBITDA margins of break even to 40%.
revenue growth rates boasted a median 10.9x EV/Revenue multiple,240% higher than the index median.
• Members of Q1’s 40%+ growth club mostly came from the highestgrowth sectors of the software ecosystem – business intelligenceand security. Select companies included: Tableau Software (82.0%TTM Re en e Gro th 19 8 EV/Re en e) Palo Alto Net orks
• Investors in 1Q14 did take special note of on-premise providerswith EBITDA margins greater than 40%, conferring a medianEV/Revenue multiple of 7.7x, or 140% higher than the indexmedian. Select companies included: Verisk (46.1% EBITDAmargin, 7.7x EV/Revenue multiple); Ansys (46.8%, 7.4x);Ch k i t S ft (55 4% 8 5 ) d S l Wi d (41 7%
17 Q1 2014 Software Industry Financial ReportCopyright © 2014 by Software Equity Group, LLC
All Rights Reserved
TTM Revenue Growth, 19.8x EV/Revenue); Palo Alto Networks(49.2%, 9.6x); and Splunk (52.1%, 24.9x).
Checkpoint Software (55.4%, 8.5x); and Solar Winds (41.7%,9.1x).
THE SEG SOFTWARE INDEX BY PRODUCT CATEGORY
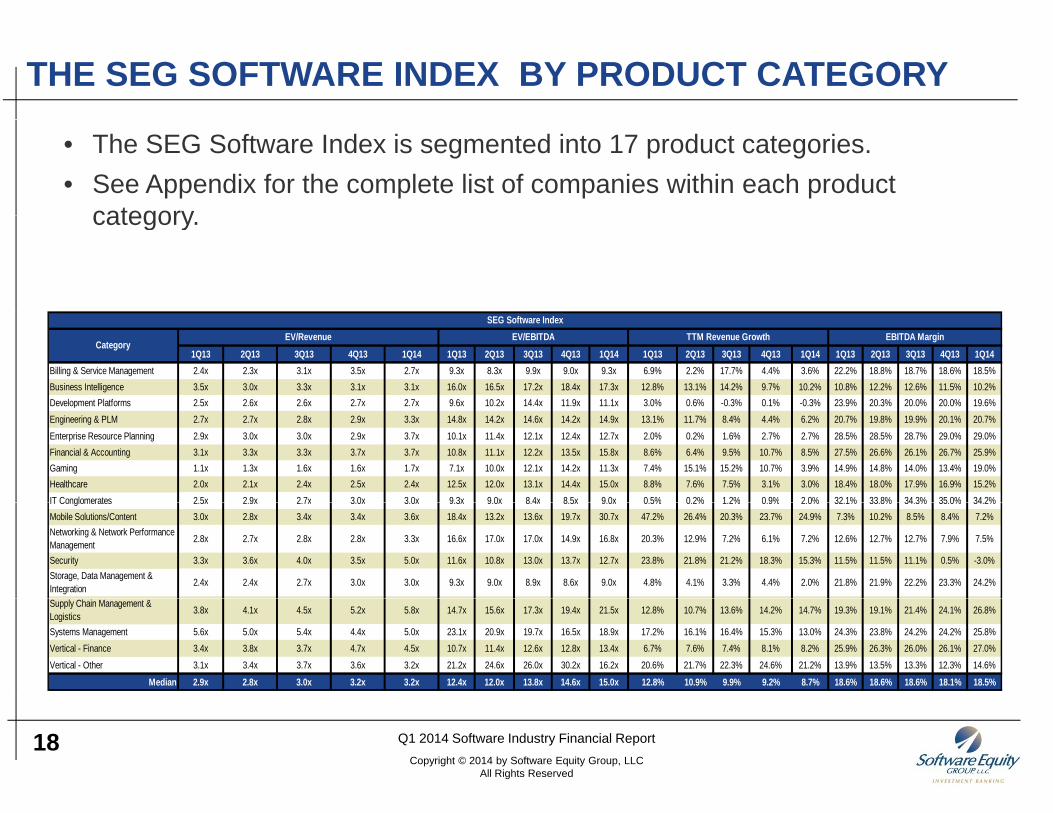
• The SEG Software Index is segmented into 17 product categories.• See Appendix for the complete list of companies within each product
categorycategory.
1Q13 2Q13 3Q13 4Q13 1Q14 1Q13 2Q13 3Q13 4Q13 1Q14 1Q13 2Q13 3Q13 4Q13 1Q14 1Q13 2Q13 3Q13 4Q13 1Q14Billing & Service Management 2.4x 2.3x 3.1x 3.5x 2.7x 9.3x 8.3x 9.9x 9.0x 9.3x 6.9% 2.2% 17.7% 4.4% 3.6% 22.2% 18.8% 18.7% 18.6% 18.5%Business Intelligence 3.5x 3.0x 3.3x 3.1x 3.1x 16.0x 16.5x 17.2x 18.4x 17.3x 12.8% 13.1% 14.2% 9.7% 10.2% 10.8% 12.2% 12.6% 11.5% 10.2%Development Platforms 2.5x 2.6x 2.6x 2.7x 2.7x 9.6x 10.2x 14.4x 11.9x 11.1x 3.0% 0.6% -0.3% 0.1% -0.3% 23.9% 20.3% 20.0% 20.0% 19.6%
SEG Software Index
CategoryEV/Revenue EV/EBITDA TTM Revenue Growth EBITDA Margin
pEngineering & PLM 2.7x 2.7x 2.8x 2.9x 3.3x 14.8x 14.2x 14.6x 14.2x 14.9x 13.1% 11.7% 8.4% 4.4% 6.2% 20.7% 19.8% 19.9% 20.1% 20.7%Enterprise Resource Planning 2.9x 3.0x 3.0x 2.9x 3.7x 10.1x 11.4x 12.1x 12.4x 12.7x 2.0% 0.2% 1.6% 2.7% 2.7% 28.5% 28.5% 28.7% 29.0% 29.0%Financial & Accounting 3.1x 3.3x 3.3x 3.7x 3.7x 10.8x 11.1x 12.2x 13.5x 15.8x 8.6% 6.4% 9.5% 10.7% 8.5% 27.5% 26.6% 26.1% 26.7% 25.9%Gaming 1.1x 1.3x 1.6x 1.6x 1.7x 7.1x 10.0x 12.1x 14.2x 11.3x 7.4% 15.1% 15.2% 10.7% 3.9% 14.9% 14.8% 14.0% 13.4% 19.0%Healthcare 2.0x 2.1x 2.4x 2.5x 2.4x 12.5x 12.0x 13.1x 14.4x 15.0x 8.8% 7.6% 7.5% 3.1% 3.0% 18.4% 18.0% 17.9% 16.9% 15.2%IT Conglomerates 2 5x 2 9x 2 7x 3 0x 3 0x 9 3x 9 0x 8 4x 8 5x 9 0x 0 5% 0 2% 1 2% 0 9% 2 0% 32 1% 33 8% 34 3% 35 0% 34 2%IT Conglomerates 2.5x 2.9x 2.7x 3.0x 3.0x 9.3x 9.0x 8.4x 8.5x 9.0x 0.5% 0.2% 1.2% 0.9% 2.0% 32.1% 33.8% 34.3% 35.0% 34.2%Mobile Solutions/Content 3.0x 2.8x 3.4x 3.4x 3.6x 18.4x 13.2x 13.6x 19.7x 30.7x 47.2% 26.4% 20.3% 23.7% 24.9% 7.3% 10.2% 8.5% 8.4% 7.2%Networking & Network Performance Management 2.8x 2.7x 2.8x 2.8x 3.3x 16.6x 17.0x 17.0x 14.9x 16.8x 20.3% 12.9% 7.2% 6.1% 7.2% 12.6% 12.7% 12.7% 7.9% 7.5%
Security 3.3x 3.6x 4.0x 3.5x 5.0x 11.6x 10.8x 13.0x 13.7x 12.7x 23.8% 21.8% 21.2% 18.3% 15.3% 11.5% 11.5% 11.1% 0.5% -3.0%Storage, Data Management & Integration 2.4x 2.4x 2.7x 3.0x 3.0x 9.3x 9.0x 8.9x 8.6x 9.0x 4.8% 4.1% 3.3% 4.4% 2.0% 21.8% 21.9% 22.2% 23.3% 24.2%
Supply Chain Management & Logistics 3.8x 4.1x 4.5x 5.2x 5.8x 14.7x 15.6x 17.3x 19.4x 21.5x 12.8% 10.7% 13.6% 14.2% 14.7% 19.3% 19.1% 21.4% 24.1% 26.8%
Systems Management 5.6x 5.0x 5.4x 4.4x 5.0x 23.1x 20.9x 19.7x 16.5x 18.9x 17.2% 16.1% 16.4% 15.3% 13.0% 24.3% 23.8% 24.2% 24.2% 25.8%Vertical - Finance 3.4x 3.8x 3.7x 4.7x 4.5x 10.7x 11.4x 12.6x 12.8x 13.4x 6.7% 7.6% 7.4% 8.1% 8.2% 25.9% 26.3% 26.0% 26.1% 27.0%Vertical - Other 3.1x 3.4x 3.7x 3.6x 3.2x 21.2x 24.6x 26.0x 30.2x 16.2x 20.6% 21.7% 22.3% 24.6% 21.2% 13.9% 13.5% 13.3% 12.3% 14.6%
Median 2.9x 2.8x 3.0x 3.2x 3.2x 12.4x 12.0x 13.8x 14.6x 15.0x 12.8% 10.9% 9.9% 9.2% 8.7% 18.6% 18.6% 18.6% 18.1% 18.5%
18 Q1 2014 Software Industry Financial ReportCopyright © 2014 by Software Equity Group, LLC
All Rights Reserved
1Q14 Median YoY Change in Revenue Growth1Q14 Median TTM Revenue Growth
THE SEG SOFTWARE INDEX BY PRODUCT CATEGORY:FINANCIAL PERFORMANCE
1Q14 Median YoY Change in Revenue Growth1Q14 Median TTM Revenue Growth
(131%)
3.6%10.2%
(0.5%)6.2%
2 7%
Billing & Service ManagementBusiness Intelligence
Development PlatformsEngineering & PLM
Enterprise Resource Planning
(47.6%)(20.2%)
(52.6%)34 8%
Billing & Service ManagementBusiness Intelligence
Development PlatformsEngineering & PLM
Enterprise Resource Planning2.7%8.5%
3.9%3.0%
2.0%24.9%
7.2%
Enterprise Resource PlanningFinancial & Accounting
GamingHealthcare
IT ConglomeratesMobile Solutions/Content
Networking & Network Performance …
34.8% (0.3%)
(47.1%)(65.3%)
(47.3%)(64.6%)
Enterprise Resource PlanningFinancial & Accounting
GamingHealthcare
IT ConglomeratesMobile Solutions/Content
Networking & Network Performance…
343.5%
15.3%2.0%
14.7%13.0%
8.2%21.2%
gSecurity
Storage, Data Management & IntegrationSupply Chain Management & Logistics
Systems ManagementVertical - Finance
Vertical - Other
(64.6%)(35.6%)
(57.7%)15.0%
(24.8%)21.8%
2.6%
Networking & Network Performance …Security
Storage, Data Management & IntegrationSupply Chain Management & Logistics
Systems ManagementVertical - Finance
Vertical - Other
1Q14 Median YoY Change EBITDA Margin1Q14 Median TTM EBITDA Margin(16.4%)
(5.9%)(18.1%)
0 1%
Billing & Service ManagementBusiness Intelligence
Development PlatformsEngineering & PLM
18.5%10.2%
19.6%
Billing & Service ManagementBusiness Intelligence
Development Platforms0.1% 1.9%
(5.9%)27.5%
(17.8%)6.7%
(2.1%)
Engineering & PLMEnterprise Resource Planning
Financial & AccountingGaming
HealthcareIT Conglomerates
Mobile Solutions/Content
20.7%29.0%
25.9%19.0%
15.2%34.2%
7 2%
Engineering & PLMEnterprise Resource Planning
Financial & AccountingGaming
HealthcareIT Conglomerates
M bil S l ti /C t t( )
(40.2%)
11.0% 38.4%
6.1% 4.3%
Networking & Network Performance …Security
Storage, Data Management & IntegrationSupply Chain Management & Logistics
Systems ManagementVertical - Finance
7.2%7.5%
(3.0%)24.2%
26.8%25.8%27 0%
Mobile Solutions/ContentNetworking & Network Performance …
SecurityStorage, Data Management & Integration
Supply Chain Management & LogisticsSystems Management
Vertical - Finance
19 Q1 2014 Software Industry Financial ReportCopyright © 2014 by Software Equity Group, LLC
All Rights Reserved
5.1% Vertical - Other27.0%14.6%
Vertical - FinanceVertical - Other
THE SEG SOFTWARE INDEX BY PRODUCT CATEGORY:MARKET MULTIPLES
Median 1Q14 YoY Change in EV/Revenue Multiples1Q14 Median EV/Revenue Multiples Median 1Q14 YoY Change in EV/Revenue Multiples1Q14 Median EV/Revenue Multiples
2.7x3.1x
2.7x3.3x
Billing & Service ManagementBusiness Intelligence
Development PlatformsEngineering & PLM
10.1% (9.1%)
7.3% 21.6%
Billing & Service ManagementBusiness Intelligence
Development PlatformsEngineering & PLM
3.7x3.7x
1.7x2.4x
3.0x
Enterprise Resource PlanningFinancial & Accounting
GamingHealthcare
IT Conglomerates
28.4% 17.0%
52.3% 20.5% 22.6%
18 6%
Enterprise Resource PlanningFinancial & Accounting
GamingHealthcare
IT ConglomeratesM bil S l ti /C t t3.6x
3.3x5.0x
3.0x5.8x
5 0x
Mobile Solutions/ContentNetworking & Network Performance …
SecurityStorage, Data Management & Integration
Supply Chain Management & LogisticsSystems Management
18.6% 15.8%
51.2% 23.5%
52.0% (10 6%)
Mobile Solutions/ContentNetworking & Network Performance …
SecurityStorage, Data Management & Integration
Supply Chain Management & LogisticsSystems Management
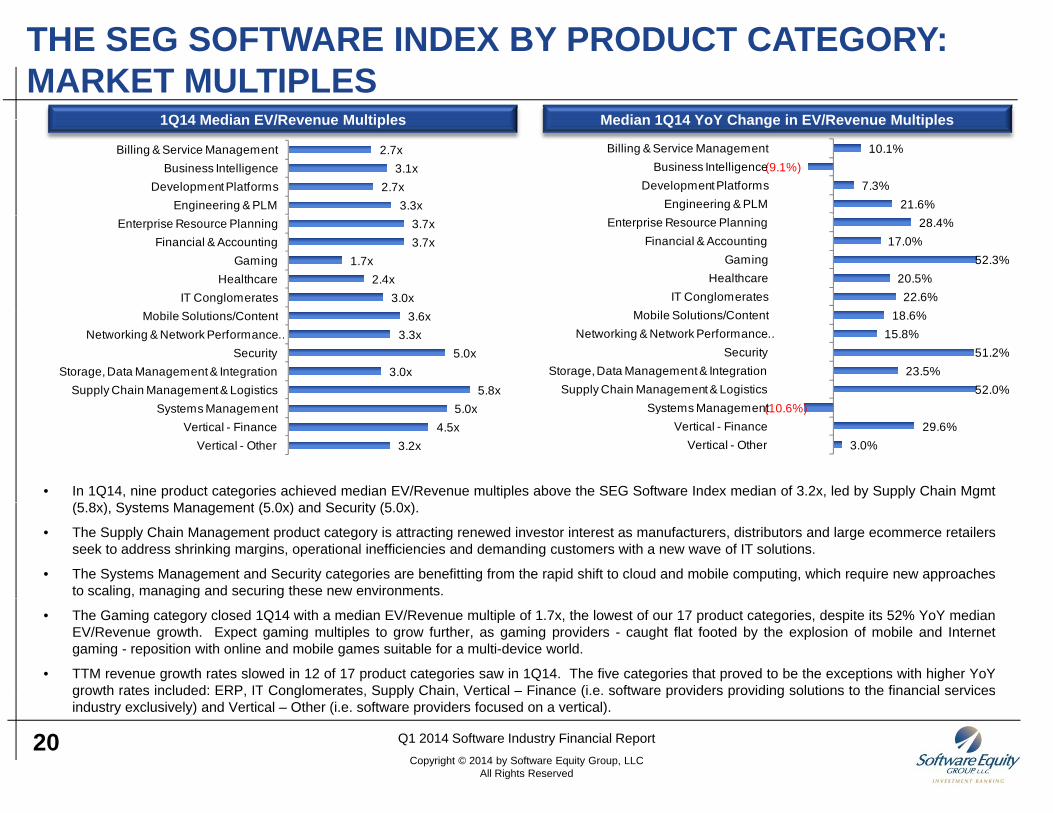
• In 1Q14, nine product categories achieved median EV/Revenue multiples above the SEG Software Index median of 3.2x, led by Supply Chain Mgmt(5 8 ) S t M t (5 0 ) d S it (5 0 )
5.0x4.5x
3.2x
Systems ManagementVertical - Finance
Vertical - Other
(10.6%)29.6%
3.0%
Systems ManagementVertical - Finance
Vertical - Other
(5.8x), Systems Management (5.0x) and Security (5.0x).
• The Supply Chain Management product category is attracting renewed investor interest as manufacturers, distributors and large ecommerce retailersseek to address shrinking margins, operational inefficiencies and demanding customers with a new wave of IT solutions.
• The Systems Management and Security categories are benefitting from the rapid shift to cloud and mobile computing, which require new approachesto scaling, managing and securing these new environments.
• The Gaming category closed 1Q14 with a median EV/Revenue multiple of 1.7x, the lowest of our 17 product categories, despite its 52% YoY medianEV/Revenue growth. Expect gaming multiples to grow further, as gaming providers - caught flat footed by the explosion of mobile and Internetgaming - reposition with online and mobile games suitable for a multi-device world.
• TTM revenue growth rates slowed in 12 of 17 product categories saw in 1Q14. The five categories that proved to be the exceptions with higher YoYgrowth rates included: ERP, IT Conglomerates, Supply Chain, Vertical – Finance (i.e. software providers providing solutions to the financial services
20 Q1 2014 Software Industry Financial ReportCopyright © 2014 by Software Equity Group, LLC
All Rights Reserved
growth rates included: ERP, IT Conglomerates, Supply Chain, Vertical Finance (i.e. software providers providing solutions to the financial servicesindustry exclusively) and Vertical – Other (i.e. software providers focused on a vertical).
THE SEG SaaS INDEX
PUBLIC S S COMPANY FINANCIAL ANDPUBLIC SaaS COMPANY FINANCIAL AND VALUATION PERFORMANCE
21
Th SEG S S I d t k bli
THE SEG SaaS INDEXSEG - SaaS: Median Metrics • The SEG SaaS Index tracks public
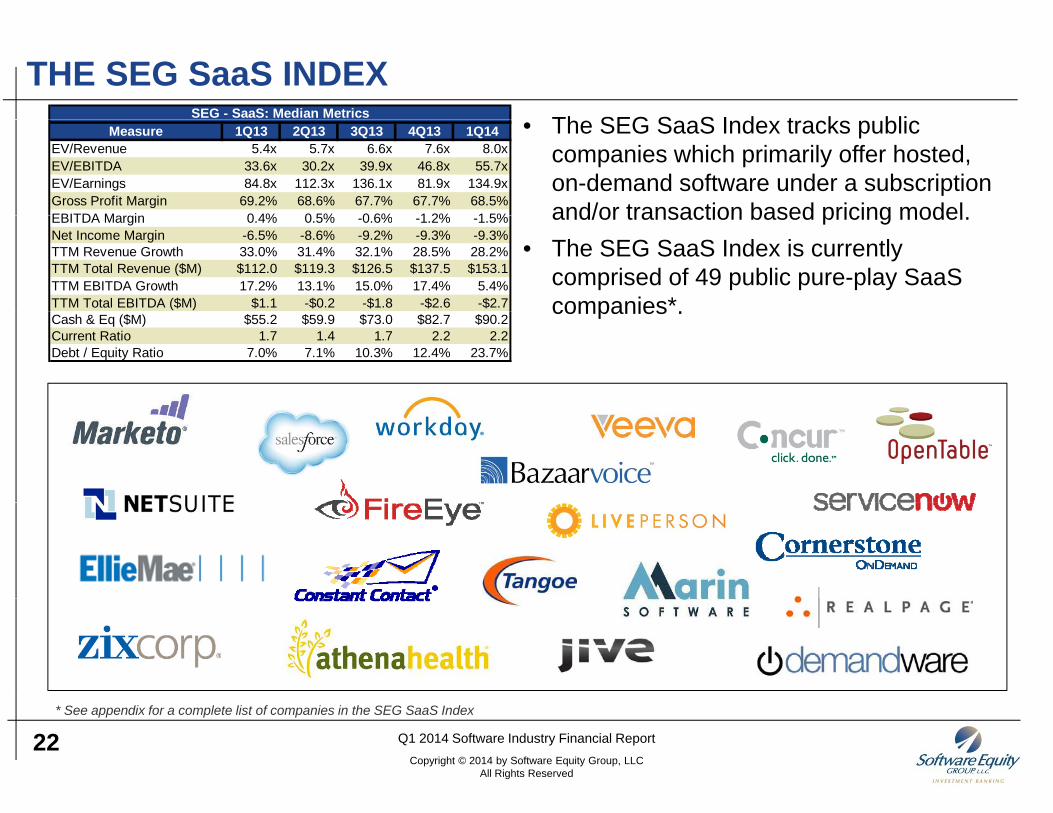
companies which primarily offer hosted, on-demand software under a subscription and/or transaction based pricing model
Measure 1Q13 2Q13 3Q13 4Q13 1Q14EV/Revenue 5.4x 5.7x 6.6x 7.6x 8.0xEV/EBITDA 33.6x 30.2x 39.9x 46.8x 55.7xEV/Earnings 84.8x 112.3x 136.1x 81.9x 134.9xGross Profit Margin 69.2% 68.6% 67.7% 67.7% 68.5%EBITDA M i 0 4% 0 5% 0 6% 1 2% 1 5% and/or transaction based pricing model.
• The SEG SaaS Index is currently comprised of 49 public pure-play SaaS companies*
EBITDA Margin 0.4% 0.5% -0.6% -1.2% -1.5%Net Income Margin -6.5% -8.6% -9.2% -9.3% -9.3%TTM Revenue Growth 33.0% 31.4% 32.1% 28.5% 28.2%TTM Total Revenue ($M) $112.0 $119.3 $126.5 $137.5 $153.1TTM EBITDA Growth 17.2% 13.1% 15.0% 17.4% 5.4%TTM Total EBITDA ($M) $1.1 -$0.2 -$1.8 -$2.6 -$2.7 companies .Cash & Eq ($M) $55.2 $59.9 $73.0 $82.7 $90.2Current Ratio 1.7 1.4 1.7 2.2 2.2Debt / Equity Ratio 7.0% 7.1% 10.3% 12.4% 23.7%
22 Q1 2014 Software Industry Financial ReportCopyright © 2014 by Software Equity Group, LLC
All Rights Reserved
* See appendix for a complete list of companies in the SEG SaaS Index
THE SEG SaaS INDEX: FINANCIAL PERFORMANCETTM Revenue Growth Rate Distribution – 1Q14Revenue Performance - Quarterly
28%34.0%$180
TTM Total Revenue ($M) TTM Revenue Growth
17%19% 19%
ompa
nies
29 0%
30.0%
31.0%
32.0%
33.0%
$80
$100
$120
$140
$160
nue
Gro
wth
al R
even
ue
2%
6%9%
% o
f Co
25 0%
26.0%
27.0%
28.0%
29.0%
$0
$20
$40
$60
$80
TTM
Rev
e
TTM
Tot
a
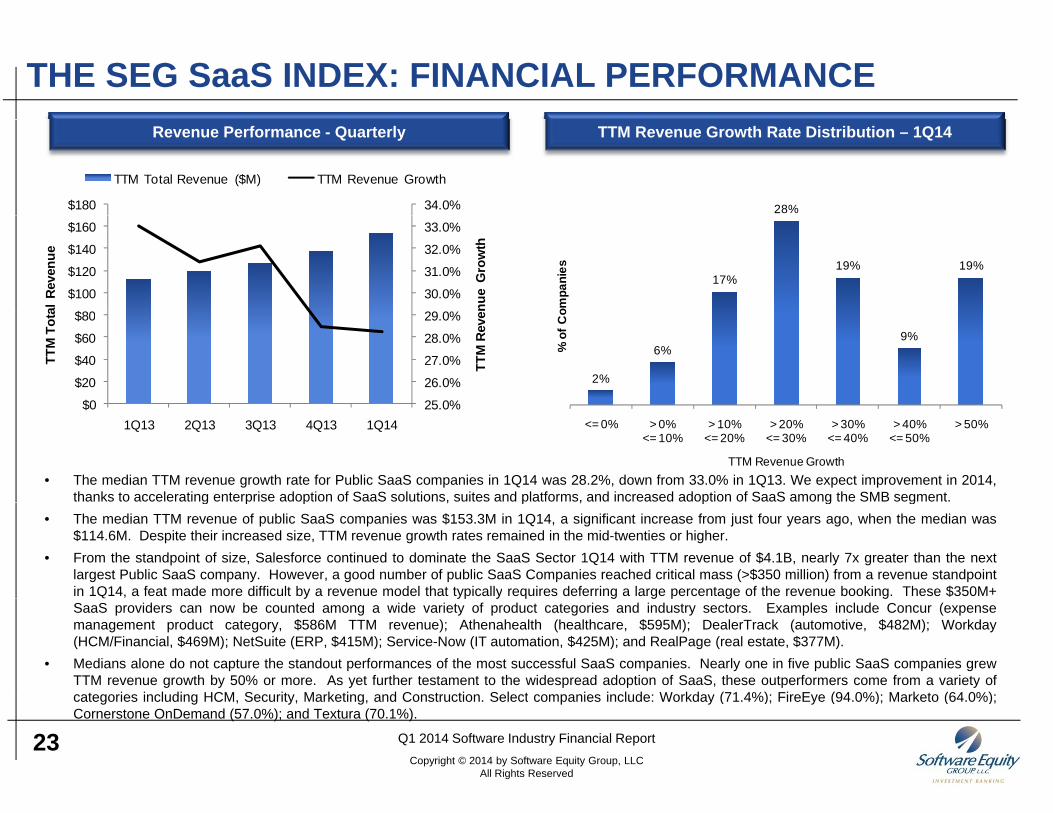
• The median TTM revenue growth rate for Public SaaS companies in 1Q14 was 28.2%, down from 33.0% in 1Q13. We expect improvement in 2014,thanks to accelerating enterprise adoption of SaaS solutions, suites and platforms, and increased adoption of SaaS among the SMB segment.
<= 0% > 0%<= 10%
> 10%<= 20%
> 20%<= 30%
> 30%<= 40%
> 40%<= 50%
> 50%
TTM Revenue Growth
25.0%$01Q13 2Q13 3Q13 4Q13 1Q14
g p p , p , p g g• The median TTM revenue of public SaaS companies was $153.3M in 1Q14, a significant increase from just four years ago, when the median was
$114.6M. Despite their increased size, TTM revenue growth rates remained in the mid-twenties or higher.• From the standpoint of size, Salesforce continued to dominate the SaaS Sector 1Q14 with TTM revenue of $4.1B, nearly 7x greater than the next
largest Public SaaS company. However, a good number of public SaaS Companies reached critical mass (>$350 million) from a revenue standpointin 1Q14, a feat made more difficult by a revenue model that typically requires deferring a large percentage of the revenue booking. These $350M+y yp y q g g p g gSaaS providers can now be counted among a wide variety of product categories and industry sectors. Examples include Concur (expensemanagement product category, $586M TTM revenue); Athenahealth (healthcare, $595M); DealerTrack (automotive, $482M); Workday(HCM/Financial, $469M); NetSuite (ERP, $415M); Service-Now (IT automation, $425M); and RealPage (real estate, $377M).
• Medians alone do not capture the standout performances of the most successful SaaS companies. Nearly one in five public SaaS companies grewTTM revenue growth by 50% or more. As yet further testament to the widespread adoption of SaaS, these outperformers come from a variety of
t i i l di HCM S it M k ti d C t ti S l t i i l d W kd (71 4%) Fi E (94 0%) M k t (64 0%)
23 Q1 2014 Software Industry Financial ReportCopyright © 2014 by Software Equity Group, LLC
All Rights Reserved
categories including HCM, Security, Marketing, and Construction. Select companies include: Workday (71.4%); FireEye (94.0%); Marketo (64.0%);Cornerstone OnDemand (57.0%); and Textura (70.1%).
THE SEG SaaS INDEX: FINANCIAL PERFORMANCETTM EBITDA Margin Distribution – 1Q14Median EBITDA Margin Performance - Quarterly
54%0.5% 54%
mpa
nies
0.4%0.5%
1Q13 2Q13 3Q13 4Q13 1Q14
A M
argi
n
21%
15%
4% 6%
% o
f Co
-0.6%
-1.2%1 5%
EBIT
DA
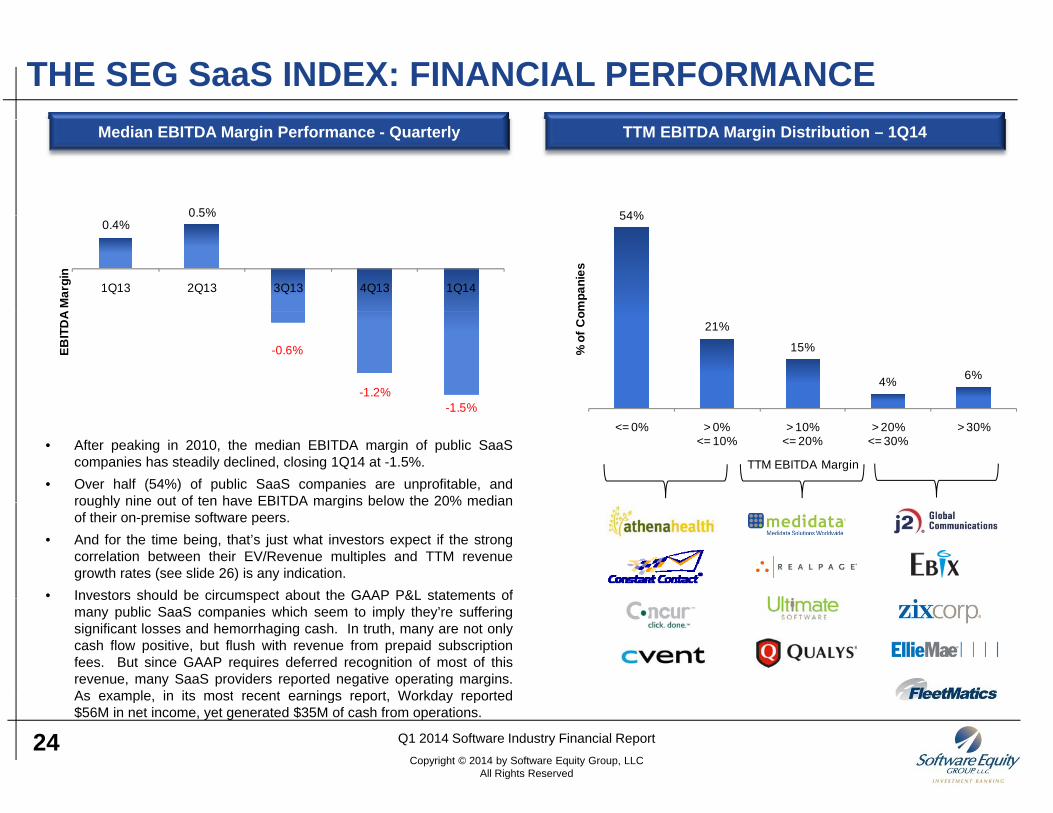
• After peaking in 2010, the median EBITDA margin of public SaaScompanies has steadily declined, closing 1Q14 at -1.5%.
• Over half (54%) of public SaaS companies are unprofitable, androughly nine out of ten have EBITDA margins below the 20% median
<= 0% > 0%<= 10%
> 10%<= 20%
> 20%<= 30%
> 30%
TTM EBITDA Margin
-1.5%
roughly nine out of ten have EBITDA margins below the 20% medianof their on-premise software peers.
• And for the time being, that’s just what investors expect if the strongcorrelation between their EV/Revenue multiples and TTM revenuegrowth rates (see slide 26) is any indication.
• Investors should be circumspect about the GAAP P&L statements ofInvestors should be circumspect about the GAAP P&L statements ofmany public SaaS companies which seem to imply they’re sufferingsignificant losses and hemorrhaging cash. In truth, many are not onlycash flow positive, but flush with revenue from prepaid subscriptionfees. But since GAAP requires deferred recognition of most of thisrevenue, many SaaS providers reported negative operating margins.As example in its most recent earnings report Workday reported
24 Q1 2014 Software Industry Financial ReportCopyright © 2014 by Software Equity Group, LLC
All Rights Reserved
As example, in its most recent earnings report, Workday reported$56M in net income, yet generated $35M of cash from operations.
THE SEG SaaS INDEX: MARKET MULTIPLESEV/Revenue Multiple Distribution – 1Q14Median EV/Revenue and EV/EBITDA Multiples - Quarterly
55.7x
EV/Revenue EV/EBITDA
33.6x30.2x
39.9x
46.8x 49%
ompa
nies
5.4x 5.7x 6.6x 7.6x 8.0x
0% 2%
9% 12%
2%7%
2%
12%
5%
% o
f Co
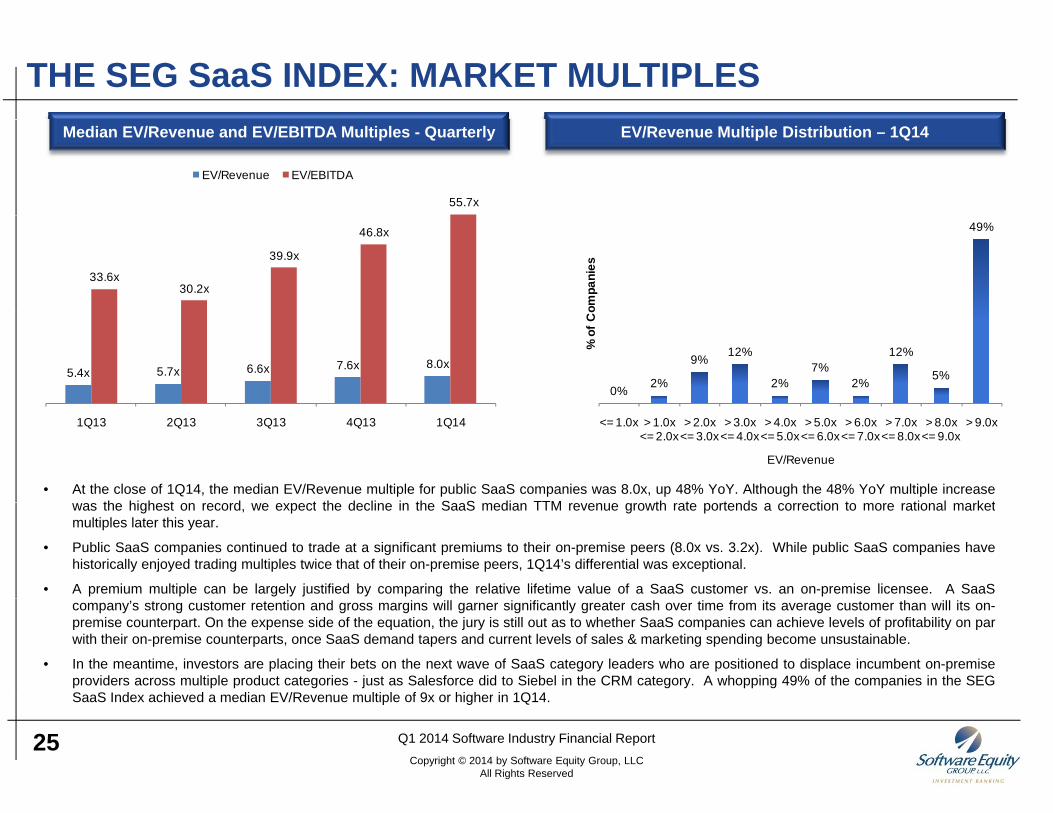
• At the close of 1Q14, the median EV/Revenue multiple for public SaaS companies was 8.0x, up 48% YoY. Although the 48% YoY multiple increaseth hi h t d t th d li i th S S di TTM th t t d ti t ti l k t
1Q13 2Q13 3Q13 4Q13 1Q14 <= 1.0x > 1.0x<= 2.0x
> 2.0x<= 3.0x
> 3.0x <= 4.0x
> 4.0x<= 5.0x
> 5.0x<= 6.0x
> 6.0x<= 7.0x
> 7.0x<= 8.0x
> 8.0x<= 9.0x
> 9.0x
EV/Revenue
was the highest on record, we expect the decline in the SaaS median TTM revenue growth rate portends a correction to more rational marketmultiples later this year.
• Public SaaS companies continued to trade at a significant premiums to their on-premise peers (8.0x vs. 3.2x). While public SaaS companies havehistorically enjoyed trading multiples twice that of their on-premise peers, 1Q14’s differential was exceptional.
• A premium multiple can be largely justified by comparing the relative lifetime value of a SaaS customer vs. an on-premise licensee. A SaaScompany’s strong customer retention and gross margins will garner significantly greater cash over time from its average customer than will its on-premise counterpart. On the expense side of the equation, the jury is still out as to whether SaaS companies can achieve levels of profitability on parwith their on-premise counterparts, once SaaS demand tapers and current levels of sales & marketing spending become unsustainable.
• In the meantime, investors are placing their bets on the next wave of SaaS category leaders who are positioned to displace incumbent on-premiseproviders across multiple product categories - just as Salesforce did to Siebel in the CRM category. A whopping 49% of the companies in the SEGS S I d hi d di EV/R lti l f 9 hi h i 1Q14
25 Q1 2014 Software Industry Financial ReportCopyright © 2014 by Software Equity Group, LLC
All Rights Reserved
SaaS Index achieved a median EV/Revenue multiple of 9x or higher in 1Q14.
THE SEG SaaS INDEX: MARKET MULTIPLESEV/Revenue Multiples vs. TTM EBITDA Margins – 1Q14EV/Revenue Multiples vs. TTM Revenue Growth Rates – 1Q14
19.1x
EV/Reven
ue
9.6x
6.3x7.2x
6.3x
EV/R
even
ue
0.0x2.5x
4.7x 5.4x
9.2x7.0x
Med
ian E 4.3x
Med
ian
E
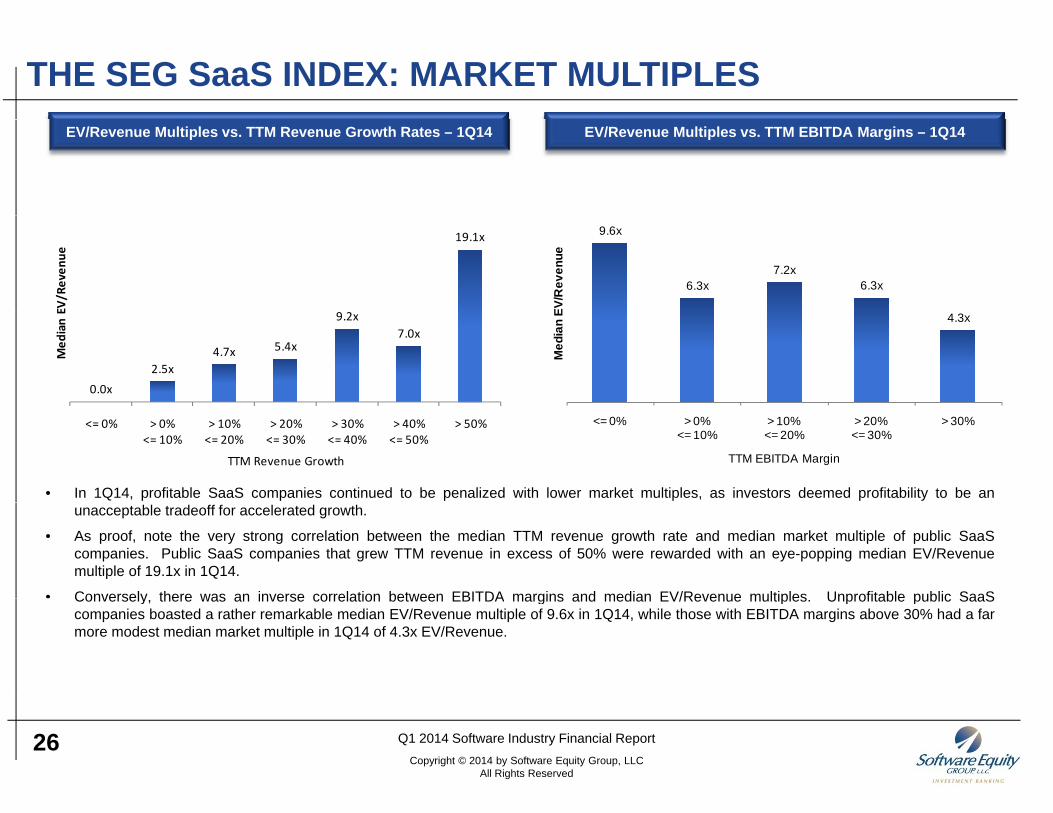
• In 1Q14, profitable SaaS companies continued to be penalized with lower market multiples, as investors deemed profitability to be an
<= 0% > 0%<= 10%
> 10%<= 20%
> 20%<= 30%
> 30%<= 40%
> 40%<= 50%
> 50%
TTM Revenue Growth
<= 0% > 0%<= 10%
> 10%<= 20%
> 20%<= 30%
> 30%
TTM EBITDA Margin
unacceptable tradeoff for accelerated growth.
• As proof, note the very strong correlation between the median TTM revenue growth rate and median market multiple of public SaaScompanies. Public SaaS companies that grew TTM revenue in excess of 50% were rewarded with an eye-popping median EV/Revenuemultiple of 19.1x in 1Q14.
• Conversely there was an inverse correlation between EBITDA margins and median EV/Revenue multiples Unprofitable public SaaSConversely, there was an inverse correlation between EBITDA margins and median EV/Revenue multiples. Unprofitable public SaaScompanies boasted a rather remarkable median EV/Revenue multiple of 9.6x in 1Q14, while those with EBITDA margins above 30% had a farmore modest median market multiple in 1Q14 of 4.3x EV/Revenue.
26 Q1 2014 Software Industry Financial ReportCopyright © 2014 by Software Equity Group, LLC
All Rights Reserved
TTM
THE SEG SaaS INDEX: MARKET MULTIPLESCompany Ticker EV (Median)
TTM Revenue
Revenue Growth
EV/Revenue
TTM EBITDA
EBITDA Margin
EV/EBITDA
Castlight Health, Inc. CSLT $2,386 $13 212% 183.9x -$62 -475.6% -FireEye, Inc. FEYE $8,974 $162 94% 55.6x -$143 -88.4% -Workday, Inc. WDAY $15,928 $469 71% 34.0x -$119 -25.3% -Demandware, Inc. DWRE $2,247 $104 31% 21.7x -$16 -15.6% -Service-now.com NOW $8,644 $425 74% 20.4x -$43 -10.1% -Netsuite N $7,723 $415 34% 18.6x -$37 -8.9% -V S t I VEEV $3 754 $210 62% 17 9 $41 19 4% 92 3Veeva Systems Inc. VEEV $3,754 $210 62% 17.9x $41 19.4% 92.3xCornerstone OnDemand CSOD $2,892 $185 57% 15.6x -$30 -16.1% -Marketo MKTO $1,457 $96 64% 15.2x -$41 -42.4% -Textura Corp. TXTR $610 $41 70% 15.0x -$33 -81.5% -Benefitfocus, Inc. BNFT $1,507 $105 28% 14.4x -$23 -21.7% -ChannelAdvisors ECOM $913 $68 27% 13.4x -$11 -15.8% -OPOWER, Inc. OPWR n/a $89 71% 13.2x -$12 -13.1% -Paylocity Holding Corp. PCTY $1,175 $91 - 13.0x $2 2.2% 602.0xCvent NYSE:CV $1 374 $111 33% 12 4x $2 1 9% 663 9x Top 25%
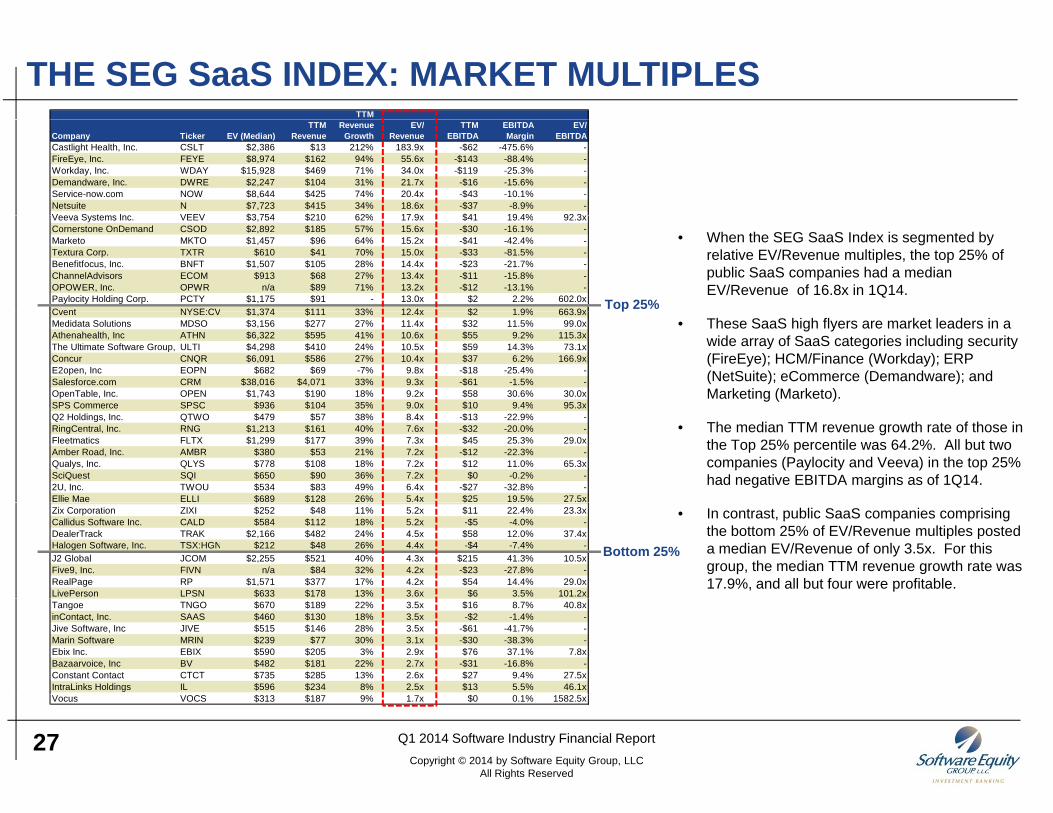
• When the SEG SaaS Index is segmented by relative EV/Revenue multiples, the top 25% of public SaaS companies had a median EV/Revenue of 16.8x in 1Q14.
Cvent NYSE:CV $1,374 $111 33% 12.4x $2 1.9% 663.9xMedidata Solutions MDSO $3,156 $277 27% 11.4x $32 11.5% 99.0xAthenahealth, Inc ATHN $6,322 $595 41% 10.6x $55 9.2% 115.3xThe Ultimate Software Group, ULTI $4,298 $410 24% 10.5x $59 14.3% 73.1xConcur CNQR $6,091 $586 27% 10.4x $37 6.2% 166.9xE2open, Inc EOPN $682 $69 -7% 9.8x -$18 -25.4% -Salesforce.com CRM $38,016 $4,071 33% 9.3x -$61 -1.5% -OpenTable, Inc. OPEN $1,743 $190 18% 9.2x $58 30.6% 30.0xSPS Commerce SPSC $936 $104 35% 9 0x $10 9 4% 95 3x
p• These SaaS high flyers are market leaders in a
wide array of SaaS categories including security (FireEye); HCM/Finance (Workday); ERP (NetSuite); eCommerce (Demandware); and Marketing (Marketo).
SPS Commerce SPSC $936 $104 35% 9.0x $10 9.4% 95.3xQ2 Holdings, Inc. QTWO $479 $57 38% 8.4x -$13 -22.9% -RingCentral, Inc. RNG $1,213 $161 40% 7.6x -$32 -20.0% -Fleetmatics FLTX $1,299 $177 39% 7.3x $45 25.3% 29.0xAmber Road, Inc. AMBR $380 $53 21% 7.2x -$12 -22.3% -Qualys, Inc. QLYS $778 $108 18% 7.2x $12 11.0% 65.3xSciQuest SQI $650 $90 36% 7.2x $0 -0.2% -2U, Inc. TWOU $534 $83 49% 6.4x -$27 -32.8% -Ellie Mae ELLI $689 $128 26% 5.4x $25 19.5% 27.5x
• The median TTM revenue growth rate of those in the Top 25% percentile was 64.2%. All but two companies (Paylocity and Veeva) in the top 25% had negative EBITDA margins as of 1Q14.
$ $ $Zix Corporation ZIXI $252 $48 11% 5.2x $11 22.4% 23.3xCallidus Software Inc. CALD $584 $112 18% 5.2x -$5 -4.0% -DealerTrack TRAK $2,166 $482 24% 4.5x $58 12.0% 37.4xHalogen Software, Inc. TSX:HGN $212 $48 26% 4.4x -$4 -7.4% -J2 Global JCOM $2,255 $521 40% 4.3x $215 41.3% 10.5xFive9, Inc. FIVN n/a $84 32% 4.2x -$23 -27.8% -RealPage RP $1,571 $377 17% 4.2x $54 14.4% 29.0xLivePerson LPSN $633 $178 13% 3.6x $6 3.5% 101.2x
Bottom 25%
• In contrast, public SaaS companies comprising the bottom 25% of EV/Revenue multiples posted a median EV/Revenue of only 3.5x. For this group, the median TTM revenue growth rate was 17.9%, and all but four were profitable.
Tangoe TNGO $670 $189 22% 3.5x $16 8.7% 40.8xinContact, Inc. SAAS $460 $130 18% 3.5x -$2 -1.4% -Jive Software, Inc JIVE $515 $146 28% 3.5x -$61 -41.7% -Marin Software MRIN $239 $77 30% 3.1x -$30 -38.3% -Ebix Inc. EBIX $590 $205 3% 2.9x $76 37.1% 7.8xBazaarvoice, Inc BV $482 $181 22% 2.7x -$31 -16.8% -Constant Contact CTCT $735 $285 13% 2.6x $27 9.4% 27.5xIntraLinks Holdings IL $596 $234 8% 2.5x $13 5.5% 46.1x
27 Q1 2014 Software Industry Financial ReportCopyright © 2014 by Software Equity Group, LLC
All Rights Reserved
Vocus VOCS $313 $187 9% 1.7x $0 0.1% 1582.5x
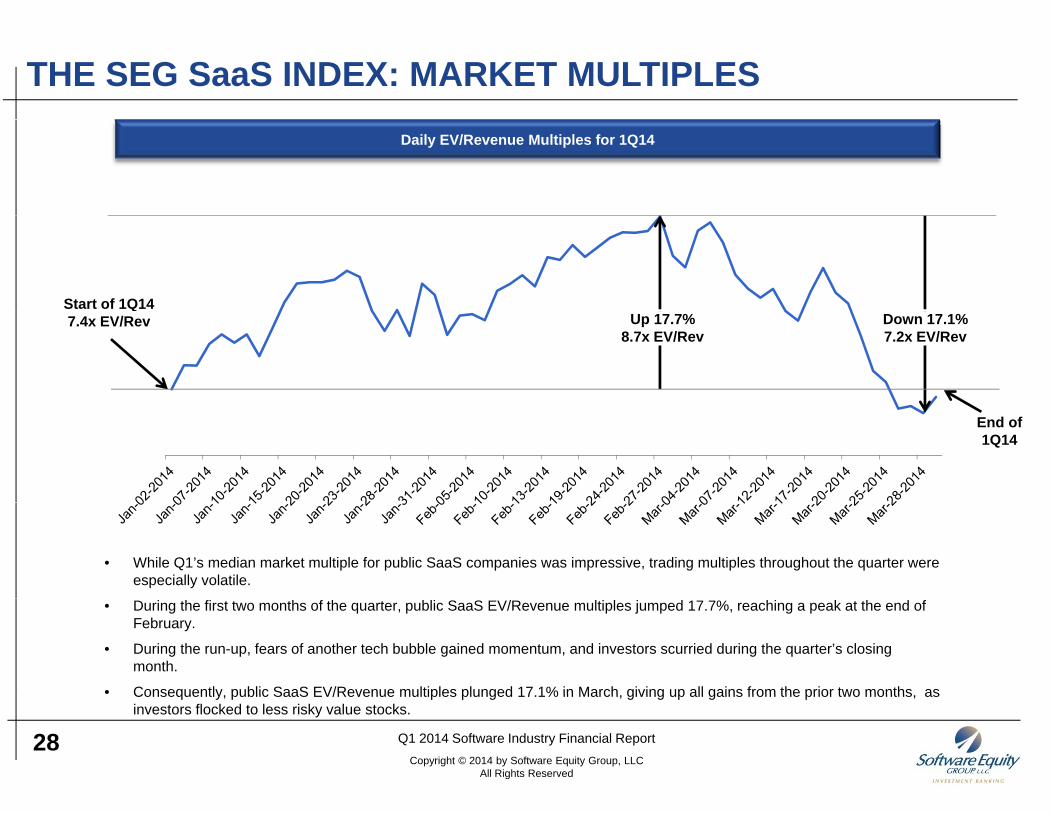
THE SEG SaaS INDEX: MARKET MULTIPLESDaily EV/Revenue Multiples for 1Q14
Start of 1Q14Up 17.7%
8.7x EV/RevDown 17.1%7.2x EV/Rev
7.4x EV/Rev
End of 1Q14
• While Q1’s median market multiple for public SaaS companies was impressive, trading multiples throughout the quarter were especially volatile.
• During the first two months of the quarter, public SaaS EV/Revenue multiples jumped 17.7%, reaching a peak at the end of February.
• During the run-up, fears of another tech bubble gained momentum, and investors scurried during the quarter’s closing month.
• Consequently public SaaS EV/Revenue multiples plunged 17 1% in March giving up all gains from the prior two months as
28 Q1 2014 Software Industry Financial ReportCopyright © 2014 by Software Equity Group, LLC
All Rights Reserved
Consequently, public SaaS EV/Revenue multiples plunged 17.1% in March, giving up all gains from the prior two months, as investors flocked to less risky value stocks.
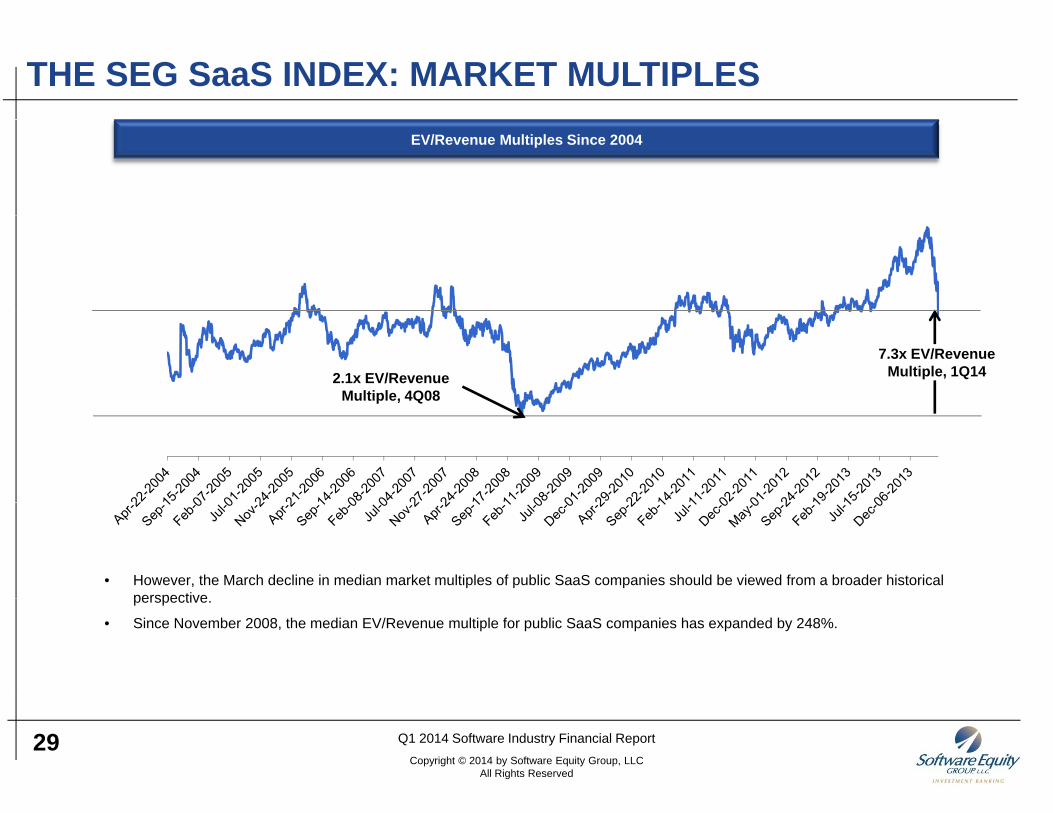
THE SEG SaaS INDEX: MARKET MULTIPLESEV/Revenue Multiples Since 2004
7.3x EV/Revenue Multiple, 1Q142.1x EV/Revenue
Multiple, 4Q08
• However, the March decline in median market multiples of public SaaS companies should be viewed from a broader historical perspectiveperspective.
• Since November 2008, the median EV/Revenue multiple for public SaaS companies has expanded by 248%.
29 Q1 2014 Software Industry Financial ReportCopyright © 2014 by Software Equity Group, LLC
All Rights Reserved
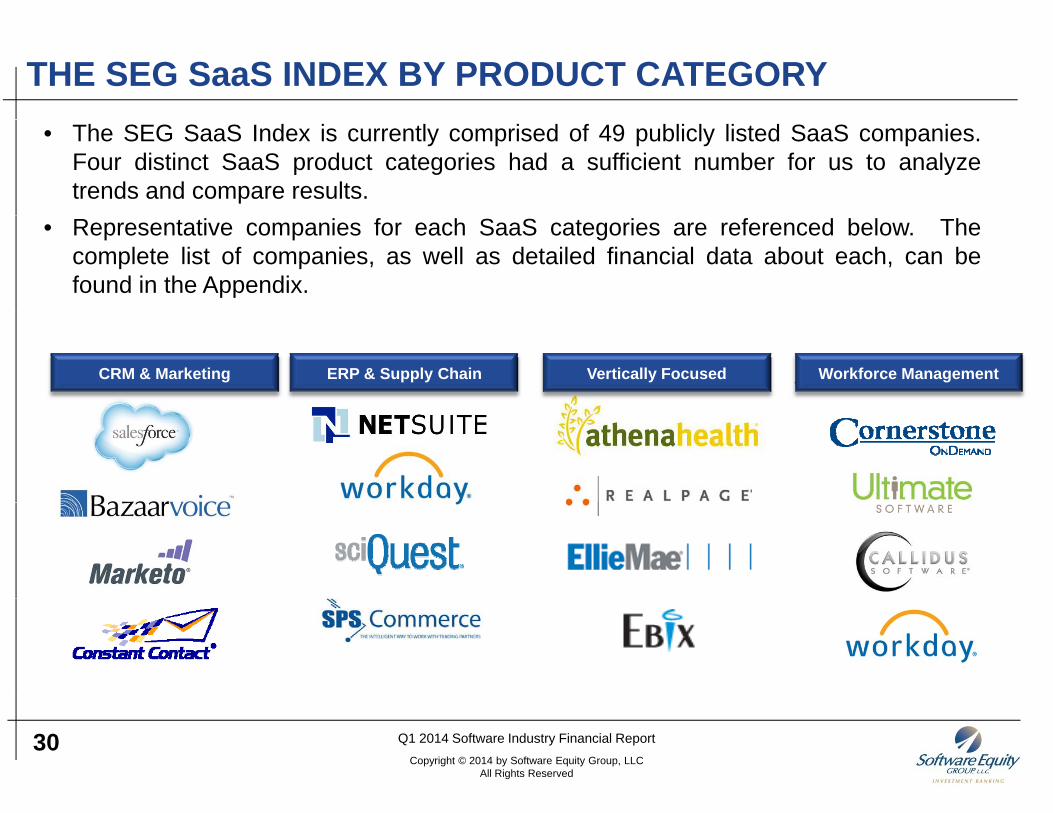
THE SEG SaaS INDEX BY PRODUCT CATEGORY• The SEG SaaS Index is currently comprised of 49 publicly listed SaaS companies.
Four distinct SaaS product categories had a sufficient number for us to analyzetrends and compare results.
• Representative companies for each SaaS categories are referenced below. Thecomplete list of companies, as well as detailed financial data about each, can befound in the Appendix.
CRM & Marketing ERP & Supply Chain Vertically Focused Workforce ManagementCRM & Marketing ERP & Supply Chain Vertically Focused Workforce Management
30 Q1 2014 Software Industry Financial ReportCopyright © 2014 by Software Equity Group, LLC
All Rights Reserved
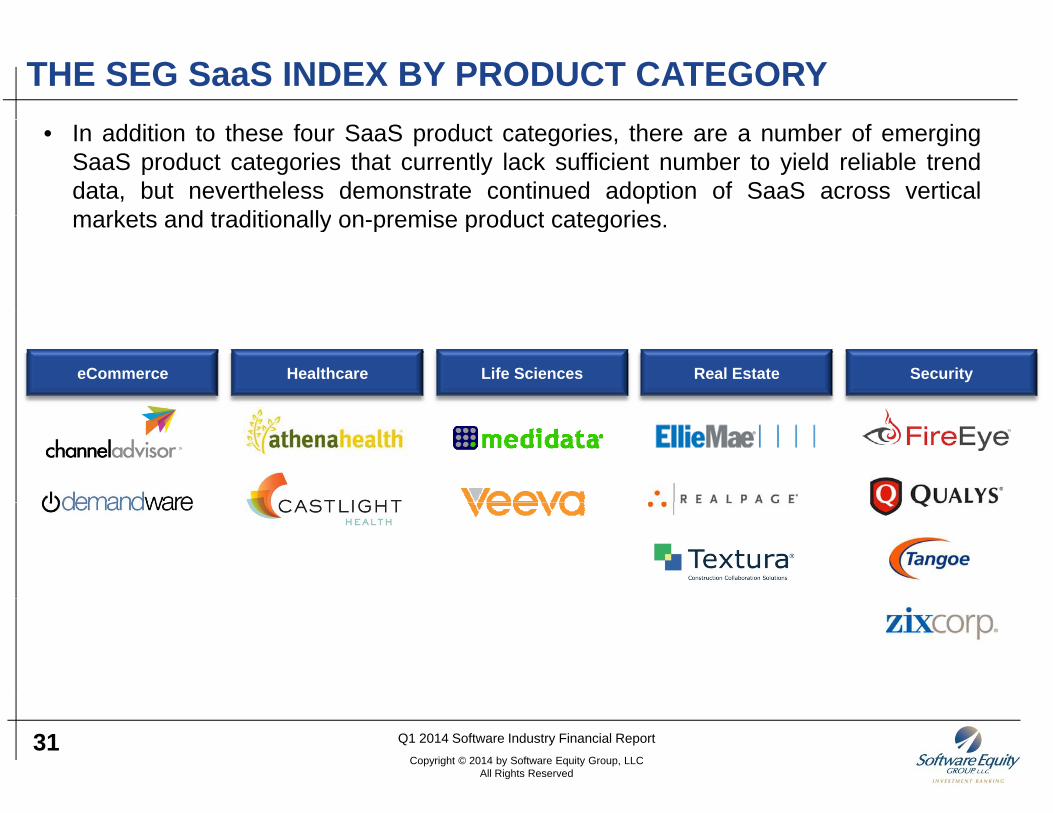
THE SEG SaaS INDEX BY PRODUCT CATEGORY• In addition to these four SaaS product categories, there are a number of emerging
SaaS product categories that currently lack sufficient number to yield reliable trenddata, but nevertheless demonstrate continued adoption of SaaS across verticalmarkets and traditionally on premise product categoriesmarkets and traditionally on-premise product categories.
eCommerce Healthcare Real Estate SecurityLife Sciences
31 Q1 2014 Software Industry Financial ReportCopyright © 2014 by Software Equity Group, LLC
All Rights Reserved
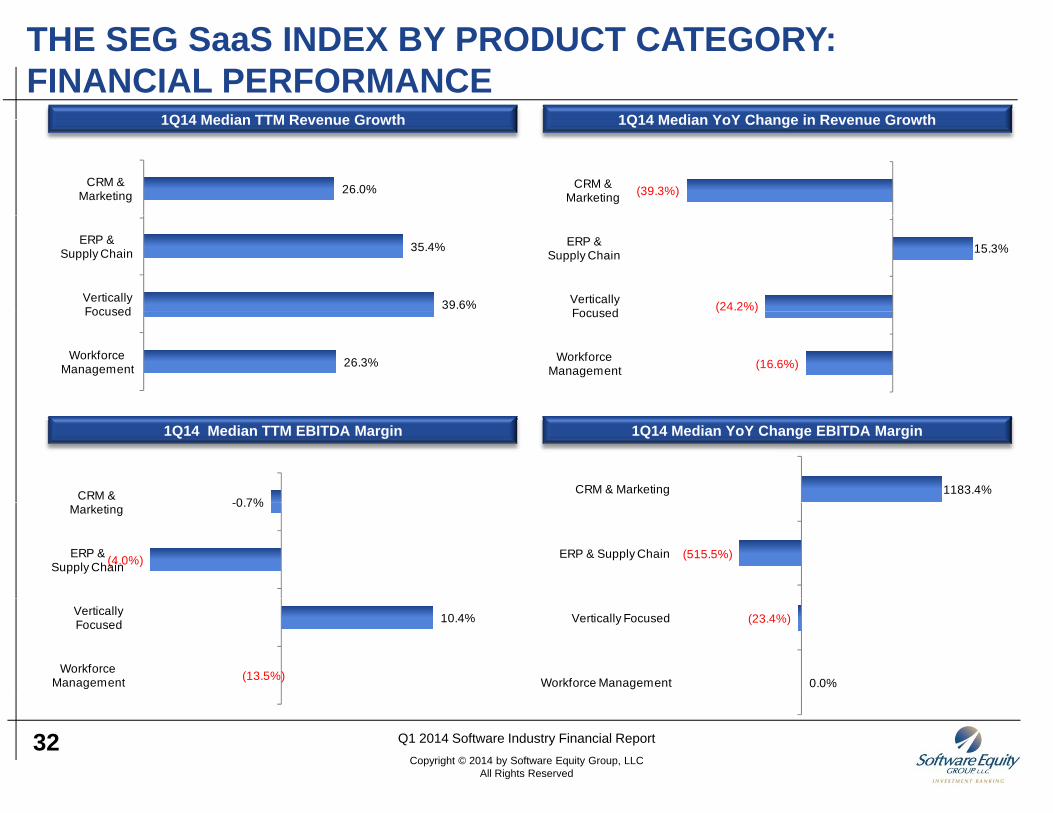
THE SEG SaaS INDEX BY PRODUCT CATEGORY: FINANCIAL PERFORMANCE
1Q14 Median YoY Change in Revenue Growth1Q14 Median TTM Revenue Growth 1Q14 Median YoY Change in Revenue Growth1Q14 Median TTM Revenue Growth
26.0%CRM &Marketing (39.3%)CRM &
Marketing
35.4%
39.6%
ERP &Supply Chain
VerticallyFocused
15.3%
(24.2%)
ERP &Supply Chain
VerticallyFocused
26.3%
Focused
WorkforceManagement
( )
(16.6%)
Focused
WorkforceManagement
1Q14 Median YoY Change EBITDA Margin1Q14 Median TTM EBITDA Margin
0 7%CRM & 1183.4% CRM & Marketing-0.7%
(4.0%)
Marketing
ERP &Supply Chain
(515.5%)ERP & Supply Chain
10.4%
(13.5%)
VerticallyFocused
WorkforceManagement
(23.4%)
0.0%
Vertically Focused
Workforce Management
32 Q1 2014 Software Industry Financial ReportCopyright © 2014 by Software Equity Group, LLC
All Rights Reserved
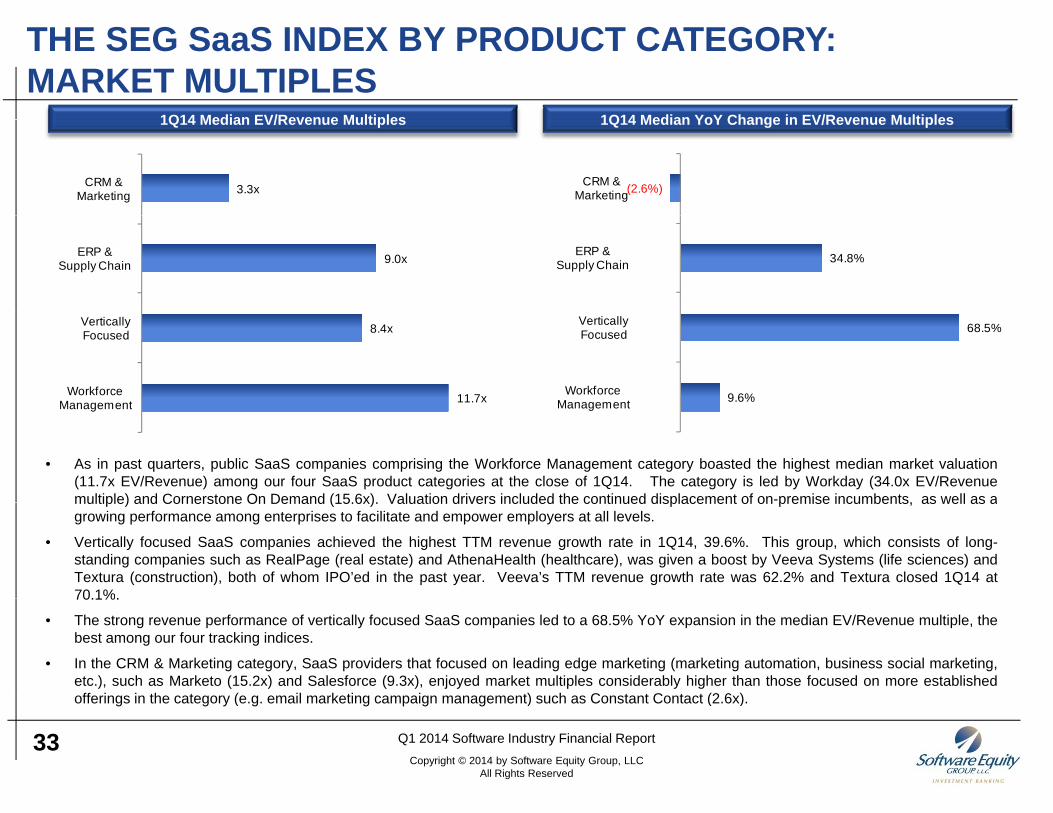
THE SEG SaaS INDEX BY PRODUCT CATEGORY: MARKET MULTIPLES
1Q14 Median YoY Change in EV/Revenue Multiples1Q14 Median EV/Revenue Multiples 1Q14 Median YoY Change in EV/Revenue Multiples1Q14 Median EV/Revenue Multiples
3.3xCRM &Marketing (2.6%)CRM &
Marketing
9.0xERP &Supply Chain 34.8% ERP &
Supply Chain
8.4x
11.7x
VerticallyFocused
WorkforceManagement
68.5%
9.6%
VerticallyFocused
WorkforceManagement
• As in past quarters, public SaaS companies comprising the Workforce Management category boasted the highest median market valuation(11.7x EV/Revenue) among our four SaaS product categories at the close of 1Q14. The category is led by Workday (34.0x EV/Revenuemultiple) and Cornerstone On Demand (15.6x). Valuation drivers included the continued displacement of on-premise incumbents, as well as a
Management Management
multiple) and Cornerstone On Demand (15.6x). Valuation drivers included the continued displacement of on premise incumbents, as well as agrowing performance among enterprises to facilitate and empower employers at all levels.
• Vertically focused SaaS companies achieved the highest TTM revenue growth rate in 1Q14, 39.6%. This group, which consists of long-standing companies such as RealPage (real estate) and AthenaHealth (healthcare), was given a boost by Veeva Systems (life sciences) andTextura (construction), both of whom IPO’ed in the past year. Veeva’s TTM revenue growth rate was 62.2% and Textura closed 1Q14 at70.1%.70.1%.
• The strong revenue performance of vertically focused SaaS companies led to a 68.5% YoY expansion in the median EV/Revenue multiple, thebest among our four tracking indices.
• In the CRM & Marketing category, SaaS providers that focused on leading edge marketing (marketing automation, business social marketing,etc.), such as Marketo (15.2x) and Salesforce (9.3x), enjoyed market multiples considerably higher than those focused on more established
ff i i th t ( il k ti i t) h C t t C t t (2 6 )
33 Q1 2014 Software Industry Financial ReportCopyright © 2014 by Software Equity Group, LLC
All Rights Reserved
offerings in the category (e.g. email marketing campaign management) such as Constant Contact (2.6x).
THE SEG INTERNET INDEX
PUBLIC INTERNET COMPANY FINANCIAL ANDPUBLIC INTERNET COMPANY FINANCIAL AND VALUATION PERFORMANCE
34
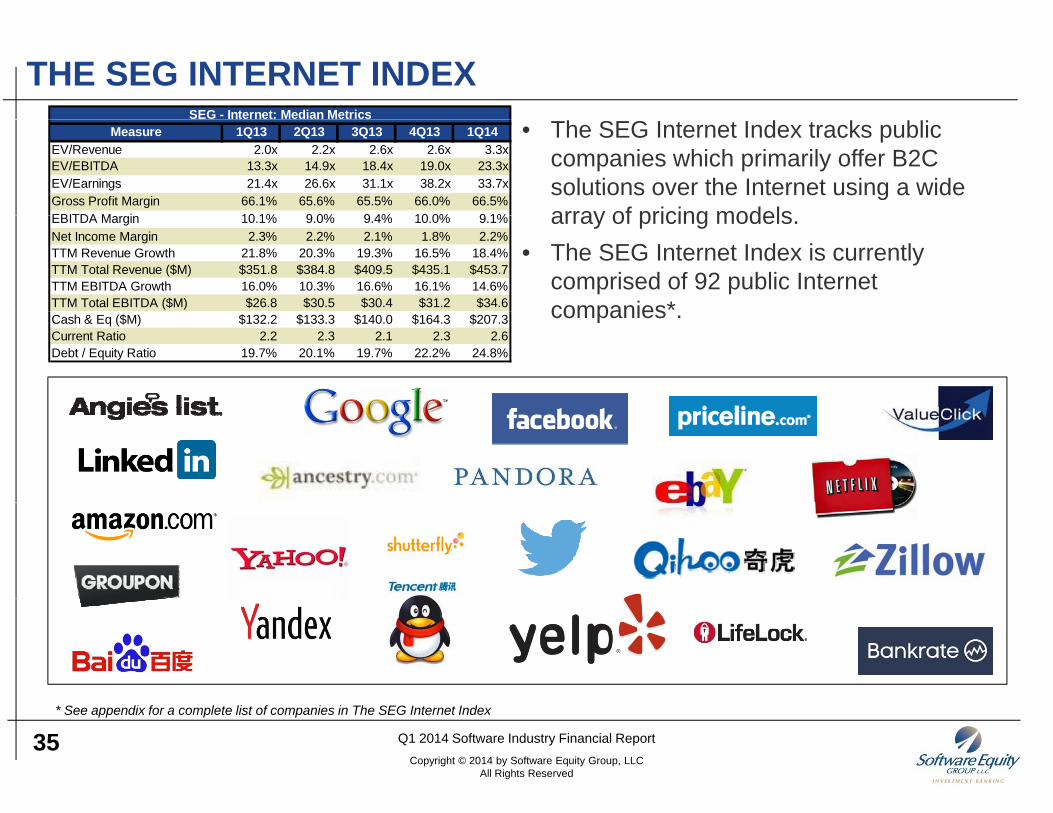
THE SEG INTERNET INDEXSEG - Internet: Median Metrics
• The SEG Internet Index tracks public companies which primarily offer B2C solutions over the Internet using a wide array of pricing models
Measure 1Q13 2Q13 3Q13 4Q13 1Q14EV/Revenue 2.0x 2.2x 2.6x 2.6x 3.3xEV/EBITDA 13.3x 14.9x 18.4x 19.0x 23.3xEV/Earnings 21.4x 26.6x 31.1x 38.2x 33.7xGross Profit Margin 66.1% 65.6% 65.5% 66.0% 66.5%EBITDA M i 10 1% 9 0% 9 4% 10 0% 9 1% array of pricing models.
• The SEG Internet Index is currently comprised of 92 public Internet companies*
EBITDA Margin 10.1% 9.0% 9.4% 10.0% 9.1%Net Income Margin 2.3% 2.2% 2.1% 1.8% 2.2%TTM Revenue Growth 21.8% 20.3% 19.3% 16.5% 18.4%TTM Total Revenue ($M) $351.8 $384.8 $409.5 $435.1 $453.7TTM EBITDA Growth 16.0% 10.3% 16.6% 16.1% 14.6%TTM Total EBITDA ($M) $26.8 $30.5 $30.4 $31.2 $34.6 companies .Cash & Eq ($M) $132.2 $133.3 $140.0 $164.3 $207.3Current Ratio 2.2 2.3 2.1 2.3 2.6Debt / Equity Ratio 19.7% 20.1% 19.7% 22.2% 24.8%
35 Q1 2014 Software Industry Financial ReportCopyright © 2014 by Software Equity Group, LLC
All Rights Reserved
* See appendix for a complete list of companies in The SEG Internet Index
THE SEG INTERNET INDEX: FINANCIAL PERFORMANCETTM Revenue Growth Rate Distribution – 1Q14Median Revenue Performance - Quarterly
25.0%$500
TTM Total Revenue ($M) TTM Revenue Growth
23%
15.0%
20.0%
$250
$300
$350
$400
$450
nue
Gro
wth
al R
even
ue
11%
20%21%
15%
ompa
nies
0 0%
5.0%
10.0%
$0
$50
$100
$150
$200
TTM
Rev
e
TTM
Tot
a
9%
% o
f Co
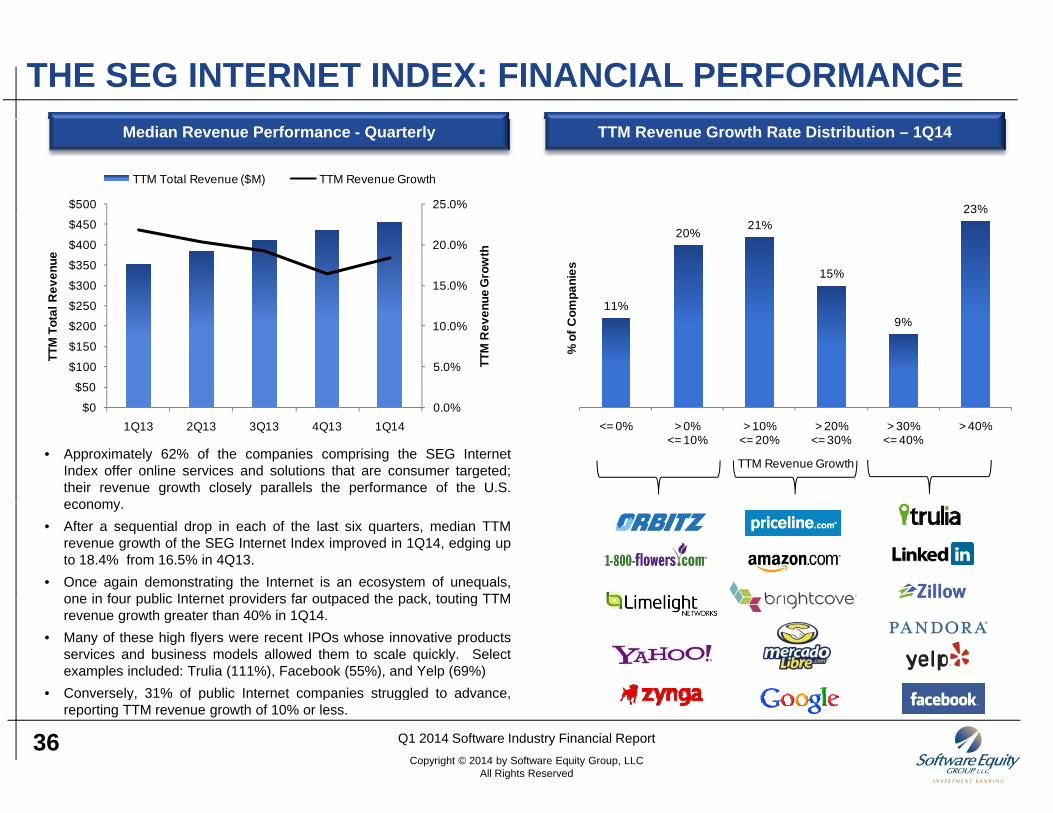
• Approximately 62% of the companies comprising the SEG InternetIndex offer online services and solutions that are consumer targeted;their revenue growth closely parallels the performance of the U.S.economy
0.0%$01Q13 2Q13 3Q13 4Q13 1Q14 <= 0% > 0%
<= 10%> 10%
<= 20%> 20%
<= 30%> 30%
<= 40%> 40%
TTM Revenue Growth
economy.• After a sequential drop in each of the last six quarters, median TTM
revenue growth of the SEG Internet Index improved in 1Q14, edging upto 18.4% from 16.5% in 4Q13.
• Once again demonstrating the Internet is an ecosystem of unequals,one in four public Internet providers far outpaced the pack touting TTMone in four public Internet providers far outpaced the pack, touting TTMrevenue growth greater than 40% in 1Q14.
• Many of these high flyers were recent IPOs whose innovative productsservices and business models allowed them to scale quickly. Selectexamples included: Trulia (111%), Facebook (55%), and Yelp (69%)
• Conversely 31% of public Internet companies struggled to advance
36 Q1 2014 Software Industry Financial ReportCopyright © 2014 by Software Equity Group, LLC
All Rights Reserved
• Conversely, 31% of public Internet companies struggled to advance,reporting TTM revenue growth of 10% or less.
THE SEG INTERNET INDEX: FINANCIAL PERFORMANCETTM EBITDA Margin Distribution – 1Q14Median EBITDA Margin Performance – Quarterly
33%10.1%9 3% 9 4%
10.0%9 1%
19%21%
mpa
nies
9.3% 9.4% 9.1%
TDA
Mar
gin
9% 9% 9%% o
f Com
EBIT
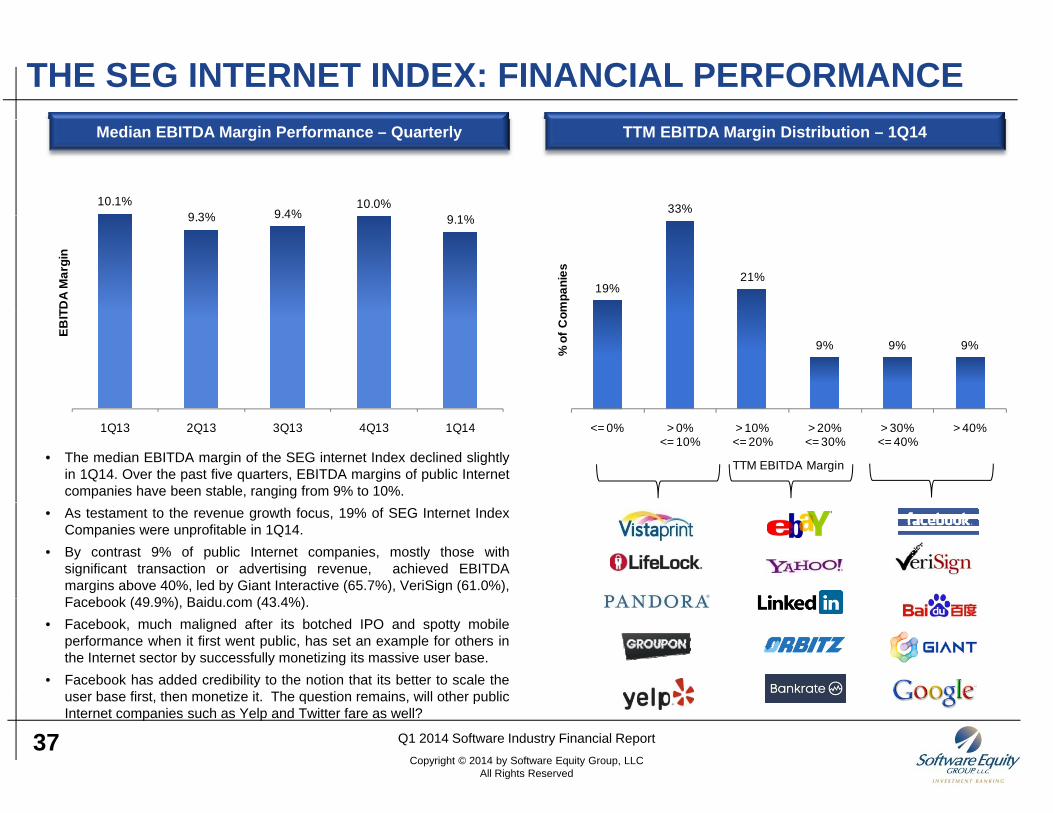
• The median EBITDA margin of the SEG internet Index declined slightlyin 1Q14. Over the past five quarters, EBITDA margins of public Internetcompanies have been stable, ranging from 9% to 10%.
<= 0% > 0%<= 10%
> 10%<= 20%
> 20%<= 30%
> 30%<= 40%
> 40%
TTM EBITDA Margin
1Q13 2Q13 3Q13 4Q13 1Q14
• As testament to the revenue growth focus, 19% of SEG Internet IndexCompanies were unprofitable in 1Q14.
• By contrast 9% of public Internet companies, mostly those withsignificant transaction or advertising revenue, achieved EBITDAmargins above 40%, led by Giant Interactive (65.7%), VeriSign (61.0%),F b k (49 9%) B id (43 4%)Facebook (49.9%), Baidu.com (43.4%).
• Facebook, much maligned after its botched IPO and spotty mobileperformance when it first went public, has set an example for others inthe Internet sector by successfully monetizing its massive user base.
• Facebook has added credibility to the notion that its better to scale theuser base first then monetize it The question remains will other public
37 Q1 2014 Software Industry Financial ReportCopyright © 2014 by Software Equity Group, LLC
All Rights Reserved
user base first, then monetize it. The question remains, will other publicInternet companies such as Yelp and Twitter fare as well?
THE SEG INTERNET INDEX: MARKET MULTIPLESEV/Revenue Multiple Distribution - QuarterlyMedian EV/Revenue and EV/EBITDA Multiples – Quarterly
23.3x
EV/Revenue EV/EBITDA
%
13.3x14.9x
18.4x 19.0x
13%
22%
12%
21%
ompa
nies
2.0x 2.2x 2.6x 2.6x 3.3x
6%
9%
5%4%
3%4%
% o
f Co
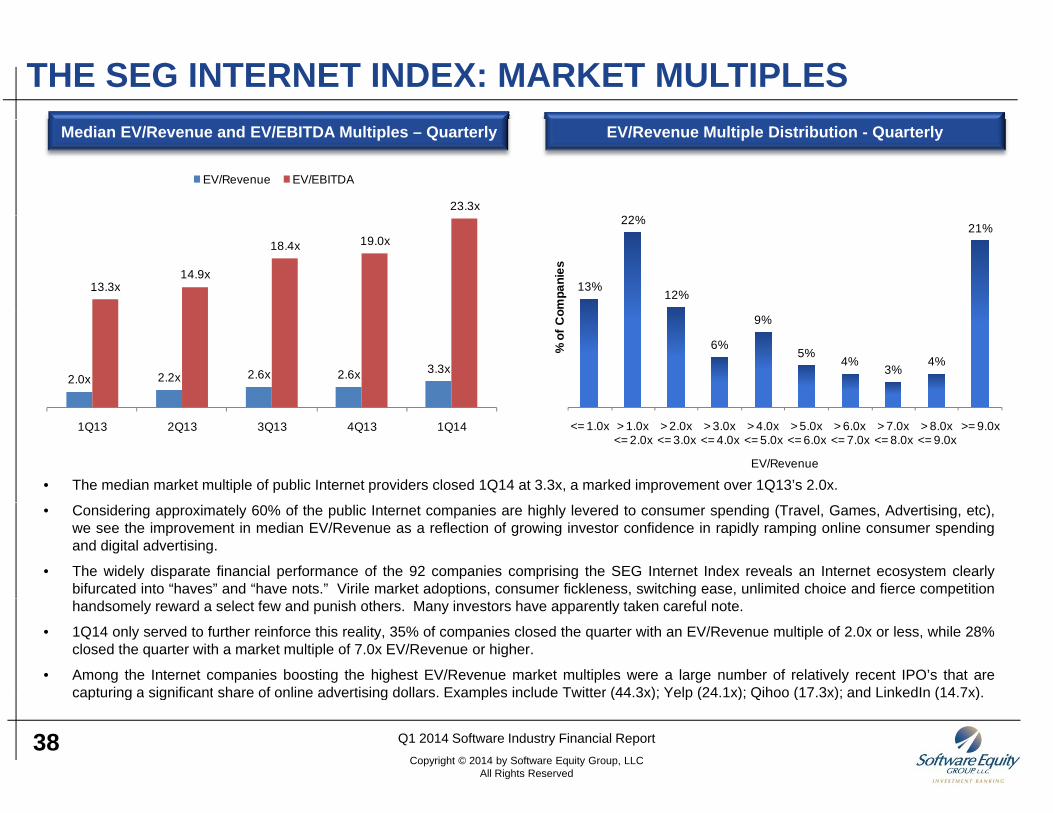
• The median market multiple of public Internet providers closed 1Q14 at 3.3x, a marked improvement over 1Q13’s 2.0x.
1Q13 2Q13 3Q13 4Q13 1Q14 <= 1.0x > 1.0x<= 2.0x
> 2.0x<= 3.0x
> 3.0x <= 4.0x
> 4.0x<= 5.0x
> 5.0x<= 6.0x
> 6.0x<= 7.0x
> 7.0x<= 8.0x
> 8.0x<= 9.0x
>= 9.0x
EV/Revenue
• Considering approximately 60% of the public Internet companies are highly levered to consumer spending (Travel, Games, Advertising, etc),we see the improvement in median EV/Revenue as a reflection of growing investor confidence in rapidly ramping online consumer spendingand digital advertising.
• The widely disparate financial performance of the 92 companies comprising the SEG Internet Index reveals an Internet ecosystem clearlybifurcated into “haves” and “have nots.” Virile market adoptions, consumer fickleness, switching ease, unlimited choice and fierce competitionhandsomely reward a select few and punish others. Many investors have apparently taken careful note.
• 1Q14 only served to further reinforce this reality, 35% of companies closed the quarter with an EV/Revenue multiple of 2.0x or less, while 28%closed the quarter with a market multiple of 7.0x EV/Revenue or higher.
• Among the Internet companies boosting the highest EV/Revenue market multiples were a large number of relatively recent IPO’s that arecapturing a significant share of online advertising dollars Examples include Twitter (44 3x); Yelp (24 1x); Qihoo (17 3x); and LinkedIn (14 7x)
38 Q1 2014 Software Industry Financial ReportCopyright © 2014 by Software Equity Group, LLC
All Rights Reserved
capturing a significant share of online advertising dollars. Examples include Twitter (44.3x); Yelp (24.1x); Qihoo (17.3x); and LinkedIn (14.7x).
THE SEG INTERNET INDEX: MARKET MULTIPLESEV/Revenue Multiples vs. TTM EBITDA Margins – 1Q14EV/Revenue Multiples vs. TTM Revenue Growth Rates – 1Q14
11.2x 7.3x6.8x
5.4x 5.7x
an E
V/R
even
ue
3.2x
4.9x
an E
V/R
even
ue
1.1x1.8x 2.1x
<= 0% > 0% > 10% > 20% > 30% > 40%
Med
ia 2.1x 2.0x
<= 0% > 0% > 10% > 20% > 30% > 40%
Med
ia
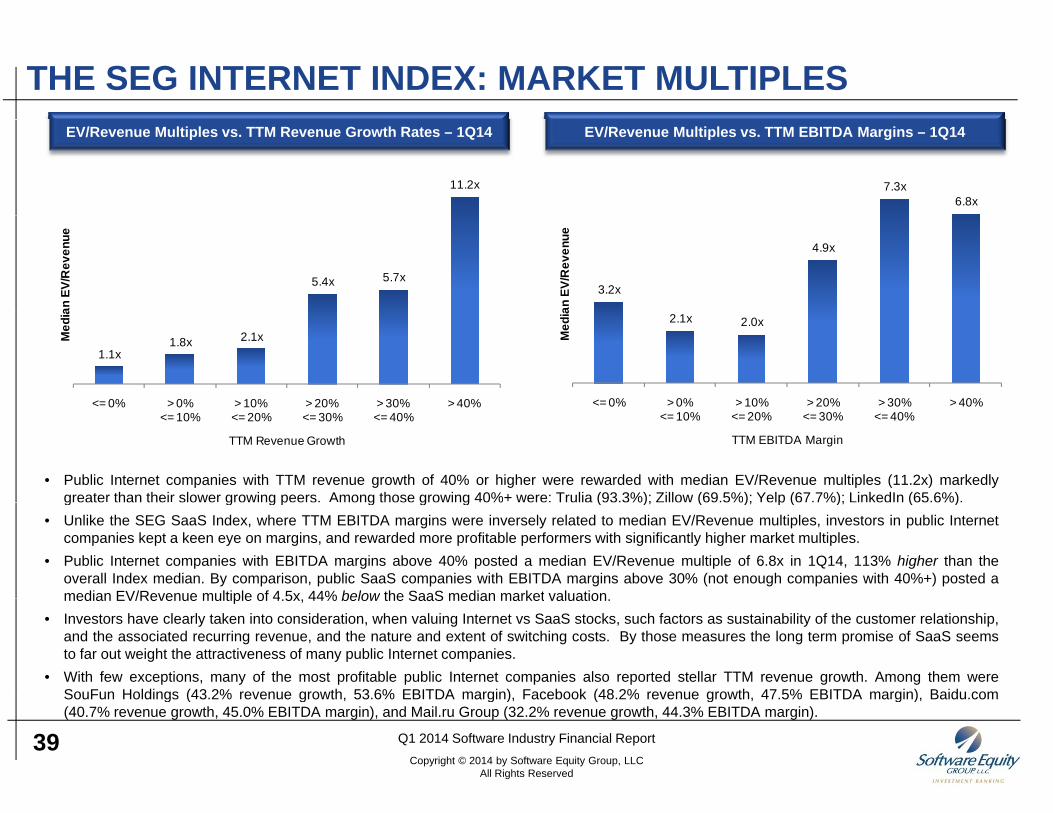
• Public Internet companies with TTM revenue growth of 40% or higher were rewarded with median EV/Revenue multiples (11.2x) markedlygreater than their slower growing peers. Among those growing 40%+ were: Trulia (93.3%); Zillow (69.5%); Yelp (67.7%); LinkedIn (65.6%).
0% 0%<= 10%
10%<= 20%
20%<= 30%
30%<= 40%
40%
TTM Revenue Growth
<= 10% <= 20% <= 30% <= 40%
TTM EBITDA Margin
g g g p g g g % ( %); ( %); p ( %); ( %)• Unlike the SEG SaaS Index, where TTM EBITDA margins were inversely related to median EV/Revenue multiples, investors in public Internet
companies kept a keen eye on margins, and rewarded more profitable performers with significantly higher market multiples.• Public Internet companies with EBITDA margins above 40% posted a median EV/Revenue multiple of 6.8x in 1Q14, 113% higher than the
overall Index median. By comparison, public SaaS companies with EBITDA margins above 30% (not enough companies with 40%+) posted amedian EV/Revenue multiple of 4 5x 44% below the SaaS median market valuationmedian EV/Revenue multiple of 4.5x, 44% below the SaaS median market valuation.
• Investors have clearly taken into consideration, when valuing Internet vs SaaS stocks, such factors as sustainability of the customer relationship,and the associated recurring revenue, and the nature and extent of switching costs. By those measures the long term promise of SaaS seemsto far out weight the attractiveness of many public Internet companies.
• With few exceptions, many of the most profitable public Internet companies also reported stellar TTM revenue growth. Among them wereSouFun Holdings (43 2% revenue growth 53 6% EBITDA margin) Facebook (48 2% revenue growth 47 5% EBITDA margin) Baidu com
39 Q1 2014 Software Industry Financial ReportCopyright © 2014 by Software Equity Group, LLC
All Rights Reserved
SouFun Holdings (43.2% revenue growth, 53.6% EBITDA margin), Facebook (48.2% revenue growth, 47.5% EBITDA margin), Baidu.com(40.7% revenue growth, 45.0% EBITDA margin), and Mail.ru Group (32.2% revenue growth, 44.3% EBITDA margin).
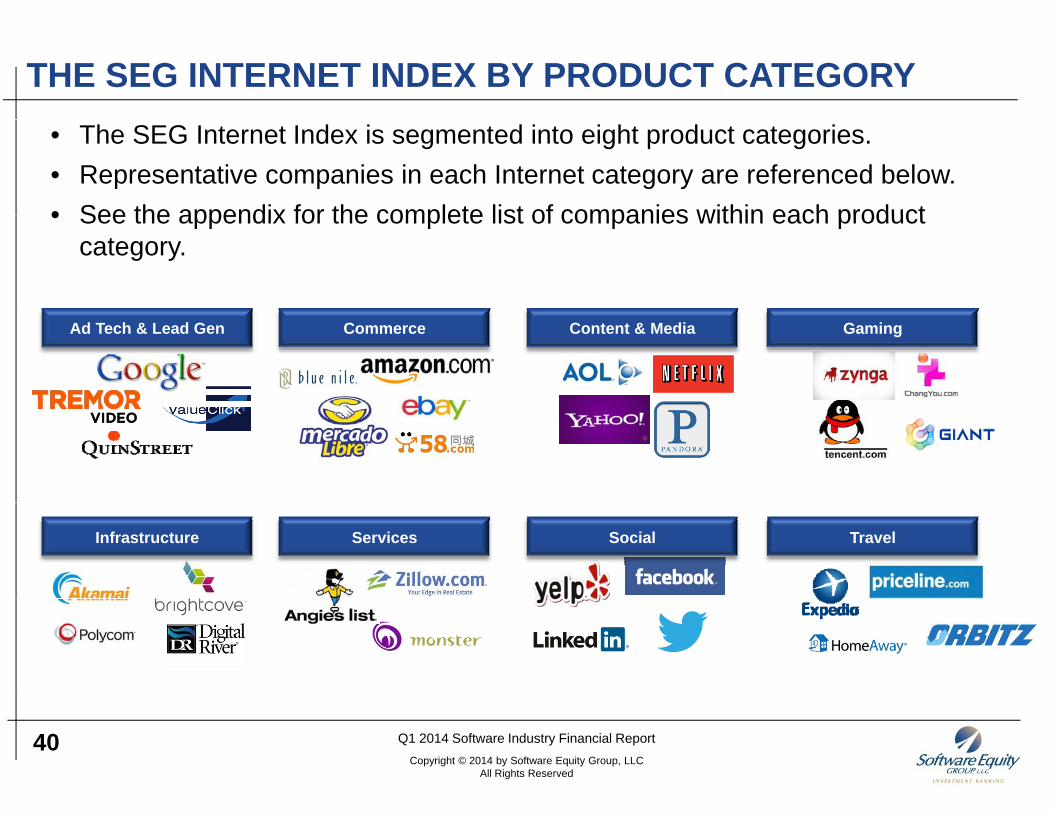
THE SEG INTERNET INDEX BY PRODUCT CATEGORY• The SEG Internet Index is segmented into eight product categories. • Representative companies in each Internet category are referenced below.• See the appendix for the complete list of companies within each product• See the appendix for the complete list of companies within each product
category.
Ad Tech & Lead Gen Commerce Content & Media GamingAd Tech & Lead Gen Commerce Content & Media Gaming
Infrastructure Services Social Travel
40 Q1 2014 Software Industry Financial ReportCopyright © 2014 by Software Equity Group, LLC
All Rights Reserved
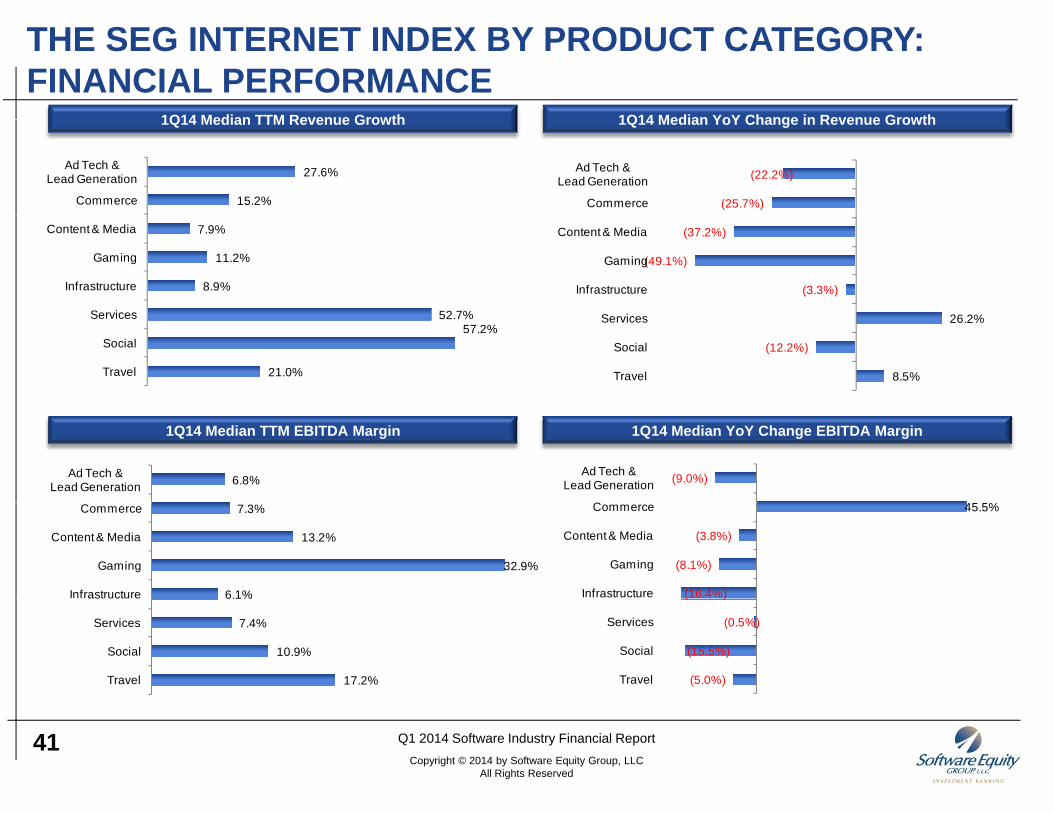
THE SEG INTERNET INDEX BY PRODUCT CATEGORY: FINANCIAL PERFORMANCE
1Q14 Median YoY Change in Revenue Growth1Q14 Median TTM Revenue Growth 1Q14 Median YoY Change in Revenue Growth1Q14 Median TTM Revenue Growth
27.6%
15.2%
Ad Tech &Lead Generation
Commerce
(22.2%)
(25.7%)
Ad Tech &Lead Generation
Commerce
7.9%
11.2%
8.9%
52 7%
Content & Media
Gaming
Infrastructure
S i
(37.2%)
(49.1%)
(3.3%)
Content & Media
Gaming
Infrastructure
52.7%57.2%
21.0%
Services
Social
Travel
26.2%
(12.2%)
8.5%
Services
Social
Travel
1Q14 Median YoY Change EBITDA Margin1Q14 Median TTM EBITDA Margin
6.8%Ad Tech &Lead Generation
(9.0%)
4 %
Ad Tech &Lead Generation
C7.3%
13.2%
32.9%
6.1%
Commerce
Content & Media
Gaming
Infrastructure
45.5%
(3.8%)
(8.1%)
(16.4%)
Commerce
Content & Media
Gaming
Infrastructure6.1%
7.4%
10.9%
17.2%
ast uctu e
Services
Social
Travel
( )
(0.5%)
(15.5%)
(5.0%)
Services
Social
Travel
41 Q1 2014 Software Industry Financial ReportCopyright © 2014 by Software Equity Group, LLC
All Rights Reserved
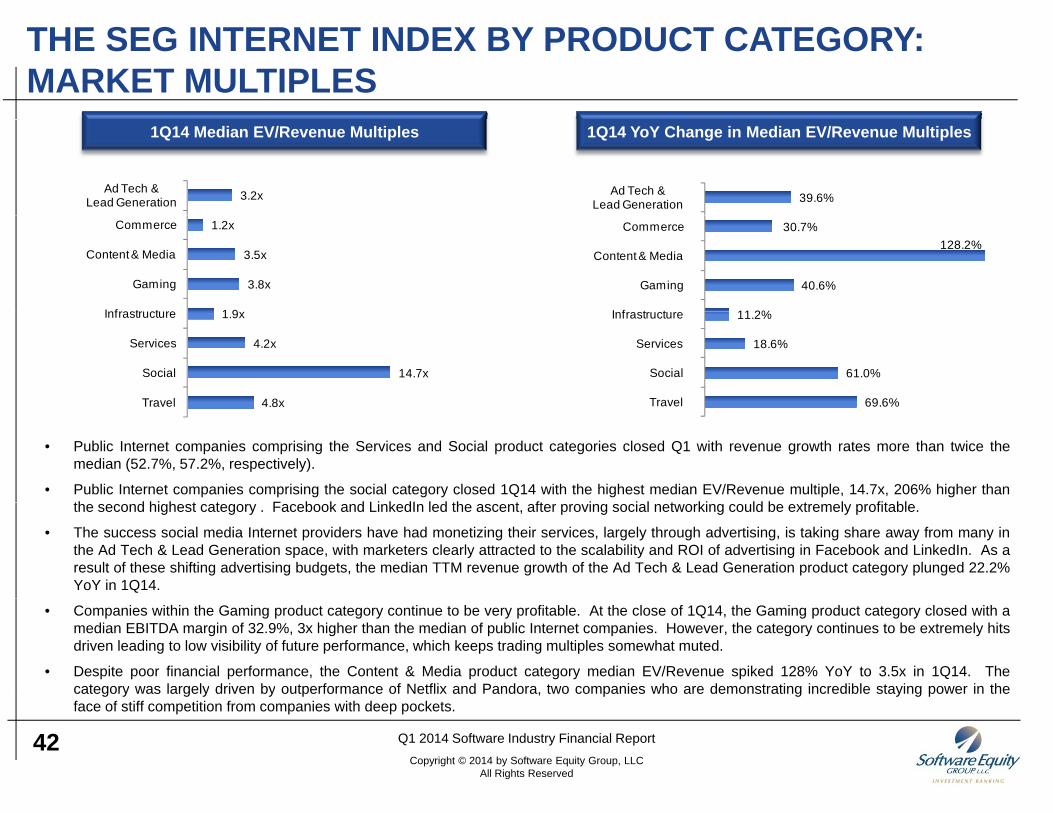
THE SEG INTERNET INDEX BY PRODUCT CATEGORY: MARKET MULTIPLES
1Q14 YoY Change in Median EV/Revenue Multiples1Q14 Median EV/Revenue Multiples
3.2xAd Tech &Lead Generation 39.6% Ad Tech &
Lead Generation
1.2x
3.5x
3.8x
1 9
Commerce
Content & Media
Gaming
I f t t
30.7% 128.2%
40.6%
11 2%
Commerce
Content & Media
Gaming
I f t t1.9x
4.2x
14.7x
4.8x
Infrastructure
Services
Social
Travel
11.2%
18.6%
61.0%
69.6%
Infrastructure
Services
Social
Travel
• Public Internet companies comprising the Services and Social product categories closed Q1 with revenue growth rates more than twice themedian (52.7%, 57.2%, respectively).
• Public Internet companies comprising the social category closed 1Q14 with the highest median EV/Revenue multiple, 14.7x, 206% higher thanth d hi h t t F b k d Li k dI l d th t ft i i l t ki ld b t l fit bl
8
the second highest category . Facebook and LinkedIn led the ascent, after proving social networking could be extremely profitable.
• The success social media Internet providers have had monetizing their services, largely through advertising, is taking share away from many inthe Ad Tech & Lead Generation space, with marketers clearly attracted to the scalability and ROI of advertising in Facebook and LinkedIn. As aresult of these shifting advertising budgets, the median TTM revenue growth of the Ad Tech & Lead Generation product category plunged 22.2%YoY in 1Q14.
• Companies within the Gaming product category continue to be very profitable. At the close of 1Q14, the Gaming product category closed with amedian EBITDA margin of 32.9%, 3x higher than the median of public Internet companies. However, the category continues to be extremely hitsdriven leading to low visibility of future performance, which keeps trading multiples somewhat muted.
• Despite poor financial performance, the Content & Media product category median EV/Revenue spiked 128% YoY to 3.5x in 1Q14. Thecategory was largely driven by outperformance of Netflix and Pandora, two companies who are demonstrating incredible staying power in the
42 Q1 2014 Software Industry Financial ReportCopyright © 2014 by Software Equity Group, LLC
All Rights Reserved
g y g y y p , p g y g pface of stiff competition from companies with deep pockets.
SOFTWARE INDUSTRY M&A MARKET UPDATE
43
SOFTWARE/SaaS M&A DEAL VOLUME AND SPENDINGMedian On-Premise Software EV/Revenue Exit MultiplesU.S. Software Mergers & Acquisitions Activity
426 430
454 456432 454
435406 394
431 444455
444
$$30
$35
450
500$54
$50 0
$60.0
ons)
394
$13.1
$21.3
$23.4
$23.1
$15.8
$20.8
$20.2 $22.8
$31.4
$15
$20
$25
200
250
300
350
400
Value (BIllions)
Num
ber o
f Deals
$37$40
$42 $41 $41 $42
$36$39
$36 $35$40
$43
$30.0
$40.0
$50.0
e De
al Value
(Milli
$12.6
$15.8
$12.3
$
$9.9
$0
$5
$10
0
50
100
150
200
1Q11 2Q11 3Q11 4Q11 1Q12 2Q12 3Q12 4Q12 1Q13 2Q13 3Q13 4Q13 1Q14
)
N
$0.0
$10.0
$20.0
11 11 11 11 12 12 12 12 13 13 13 13 14
TTM A
verag
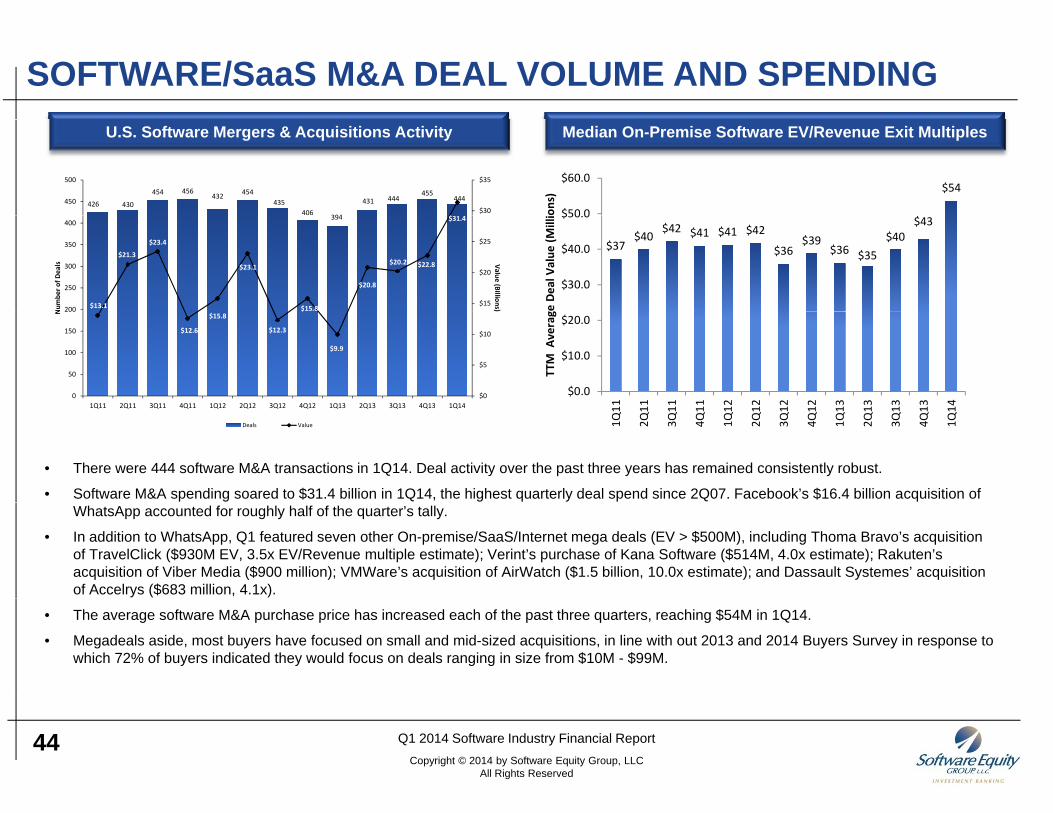
• There were 444 software M&A transactions in 1Q14. Deal activity over the past three years has remained consistently robust.
• Software M&A spending soared to $31.4 billion in 1Q14, the highest quarterly deal spend since 2Q07. Facebook’s $16.4 billion acquisition of
1Q11 2Q11 3Q11 4Q11 1Q12 2Q12 3Q12 4Q12 1Q13 2Q13 3Q13 4Q13 1Q14
Deals Value 1Q1
2Q1
3Q1
4Q1
1Q1
2Q1
3Q1
4Q1
1Q1
2Q1
3Q1
4Q1
1Q1
WhatsApp accounted for roughly half of the quarter’s tally.
• In addition to WhatsApp, Q1 featured seven other On-premise/SaaS/Internet mega deals (EV > $500M), including Thoma Bravo’s acquisition of TravelClick ($930M EV, 3.5x EV/Revenue multiple estimate); Verint’s purchase of Kana Software ($514M, 4.0x estimate); Rakuten’s acquisition of Viber Media ($900 million); VMWare’s acquisition of AirWatch ($1.5 billion, 10.0x estimate); and Dassault Systemes’ acquisition of Accelrys ($683 million, 4.1x).
• The average software M&A purchase price has increased each of the past three quarters, reaching $54M in 1Q14.
• Megadeals aside, most buyers have focused on small and mid-sized acquisitions, in line with out 2013 and 2014 Buyers Survey in response to which 72% of buyers indicated they would focus on deals ranging in size from $10M - $99M.
44 Q1 2014 Software Industry Financial ReportCopyright © 2014 by Software Equity Group, LLC
All Rights Reserved
SOFTWARE M&A EXIT MULTIPLESMedian Exit Multiples Median EV/Revenue Exit Multiple Distribution
26 2%30.0%12.7x 12.9x 13.3x14.0x
EV/Revenue EV/EBITDA
25.0%
17.9%
26.2%
14.3%16.7%
15.0%
20.0%
25.0%
2013
TTM
2013
TTM
11.6x 11.5x
8.0x
10.0x
12.0x
0.0%
5.0%
10.0%
<= 1.0x > 1.0x & <=2.0x
> 2.0x & <=3.0x
> 3.0x & <=4.0x
> 4.0x
% of D
eals‐2
% of D
eals‐2
1.6x 1.8x2.3x 2.3x 2.3x
2.0x
4.0x
6.0x
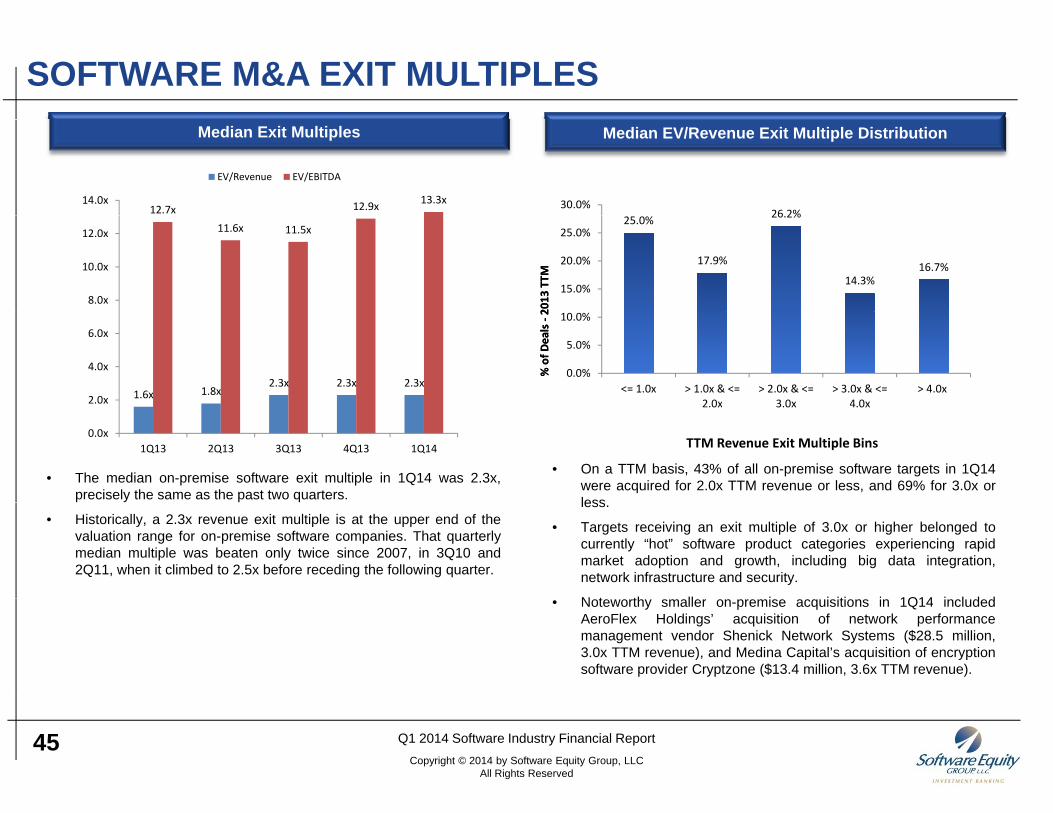
• The median on-premise software exit multiple in 1Q14 was 2.3x,precisely the same as the past two quarters.
• On a TTM basis, 43% of all on-premise software targets in 1Q14were acquired for 2.0x TTM revenue or less, and 69% for 3.0x orless
2.0x 3.0x 4.0x
TTM Revenue Exit Multiple Bins0.0x
1Q13 2Q13 3Q13 4Q13 1Q14
• Historically, a 2.3x revenue exit multiple is at the upper end of thevaluation range for on-premise software companies. That quarterlymedian multiple was beaten only twice since 2007, in 3Q10 and2Q11, when it climbed to 2.5x before receding the following quarter.
less.
• Targets receiving an exit multiple of 3.0x or higher belonged tocurrently “hot” software product categories experiencing rapidmarket adoption and growth, including big data integration,network infrastructure and security.
N t th ll i i iti i 1Q14 i l d d• Noteworthy smaller on-premise acquisitions in 1Q14 includedAeroFlex Holdings’ acquisition of network performancemanagement vendor Shenick Network Systems ($28.5 million,3.0x TTM revenue), and Medina Capital’s acquisition of encryptionsoftware provider Cryptzone ($13.4 million, 3.6x TTM revenue).
45 Q1 2014 Software Industry Financial ReportCopyright © 2014 by Software Equity Group, LLC
All Rights Reserved
SOFTWARE M&A: BY OWNERSHIP STRUCTURE AND SIZEby Sizeby Ownership Structure
Public Sellers 2.1x Median Multiple Buyer Less Than
$200 million 1.6x Median
Buyer Greater Than $200 million 3.1x Median
Private Sellers 2.3x Median Multiple
72%28%
66%34%
Multiple Multiple
Private Buyers 1.7x Median Multiple
60%40%
Seller LessSeller Less
Seller Greater Than $20 million: 1.5x
Seller Greater Than $20 million: 0.8x
Seller LessSeller Less
Seller Greater Than $20 million: 1.6x
Seller Greater Than $20 million: 2.9x
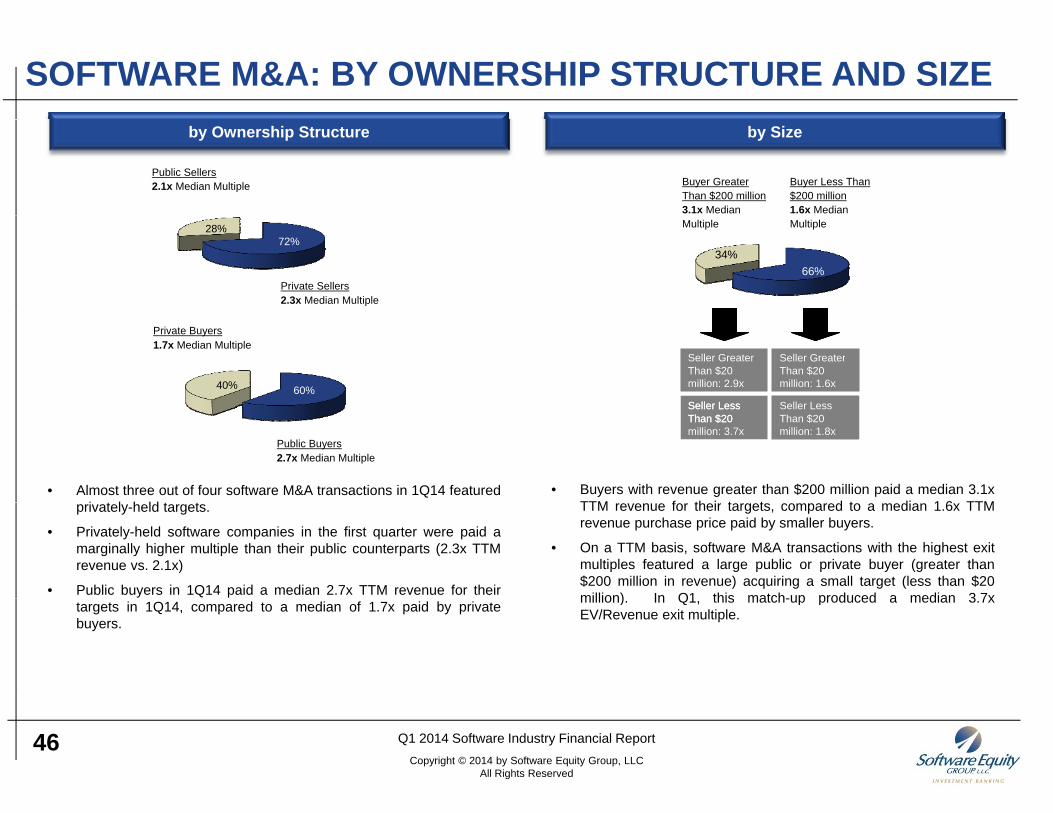
• Almost three out of four software M&A transactions in 1Q14 featuredi t l h ld t t
• Buyers with revenue greater than $200 million paid a median 3.1xTTM f th i t t d t di 1 6 TTM
Public Buyers 2.7x Median Multiple
Seller Less Than $20 million: 2.4x
Seller Less Than $20 million: 3.7x
Seller Less Than $20 million: 1.8x
Seller Less Than $20
million
privately-held targets.
• Privately-held software companies in the first quarter were paid amarginally higher multiple than their public counterparts (2.3x TTMrevenue vs. 2.1x)
• Public buyers in 1Q14 paid a median 2.7x TTM revenue for their
TTM revenue for their targets, compared to a median 1.6x TTMrevenue purchase price paid by smaller buyers.
• On a TTM basis, software M&A transactions with the highest exitmultiples featured a large public or private buyer (greater than$200 million in revenue) acquiring a small target (less than $20million) In Q1 this match-up produced a median 3 7xtargets in 1Q14, compared to a median of 1.7x paid by private
buyers.
million). In Q1, this match-up produced a median 3.7xEV/Revenue exit multiple.
46 Q1 2014 Software Industry Financial ReportCopyright © 2014 by Software Equity Group, LLC
All Rights Reserved
Horizontal & Vertical M&A Median EV/Revenue Exit
SOFTWARE M&A: BY VERTICAL AND HORIZONTAL MARKETS
Horizontal & Vertical M&A Median EV/Revenue Exit MultiplesHorizontal & Vertical M&A Volume
80%
100%
2 7x 2 5
33% 36% 33% 39% 35%
67% 64% 67% 61% 65%
20%
40%
60%
80%
1.3x
1.9x
2.7x
1.7x2.1x
1.8x1.6x
2.0x2.4x 2.5x
33% 36% 33% 39% 35%
0%
20%
1Q13 2Q13 3Q13 4Q13 1Q14
Horizontal Vertical1Q13 2Q13 3Q13 4Q13 1Q14
Vertical Horizontal
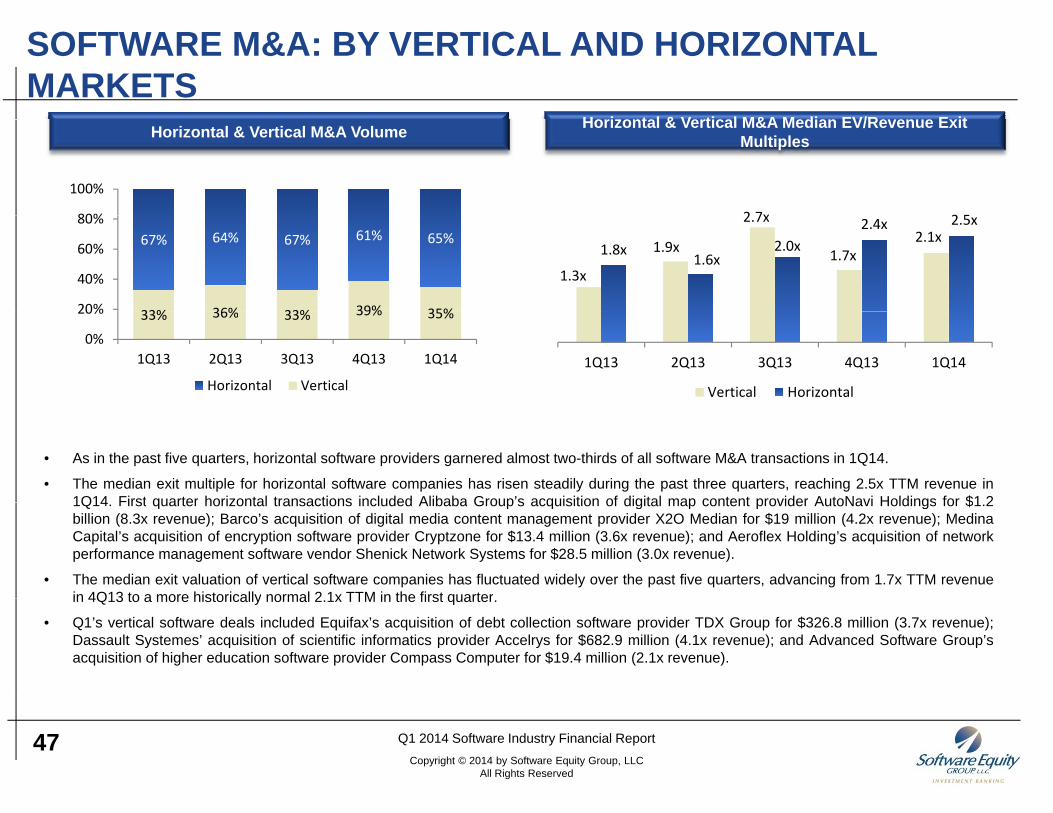
• As in the past five quarters, horizontal software providers garnered almost two-thirds of all software M&A transactions in 1Q14.
• The median exit multiple for horizontal software companies has risen steadily during the past three quarters, reaching 2.5x TTM revenue in1Q14 First quarter horizontal transactions included Alibaba Group’s acquisition of digital map content provider AutoNavi Holdings for $1 21Q14. First quarter horizontal transactions included Alibaba Group s acquisition of digital map content provider AutoNavi Holdings for $1.2billion (8.3x revenue); Barco’s acquisition of digital media content management provider X2O Median for $19 million (4.2x revenue); MedinaCapital’s acquisition of encryption software provider Cryptzone for $13.4 million (3.6x revenue); and Aeroflex Holding’s acquisition of networkperformance management software vendor Shenick Network Systems for $28.5 million (3.0x revenue).
• The median exit valuation of vertical software companies has fluctuated widely over the past five quarters, advancing from 1.7x TTM revenuein 4Q13 to a more historically normal 2 1x TTM in the first quarterin 4Q13 to a more historically normal 2.1x TTM in the first quarter.
• Q1’s vertical software deals included Equifax’s acquisition of debt collection software provider TDX Group for $326.8 million (3.7x revenue);Dassault Systemes’ acquisition of scientific informatics provider Accelrys for $682.9 million (4.1x revenue); and Advanced Software Group’sacquisition of higher education software provider Compass Computer for $19.4 million (2.1x revenue).
47 Q1 2014 Software Industry Financial ReportCopyright © 2014 by Software Equity Group, LLC
All Rights Reserved
SOFTWARE M&A ACTIVITY BY PRODUCT CATEGORY
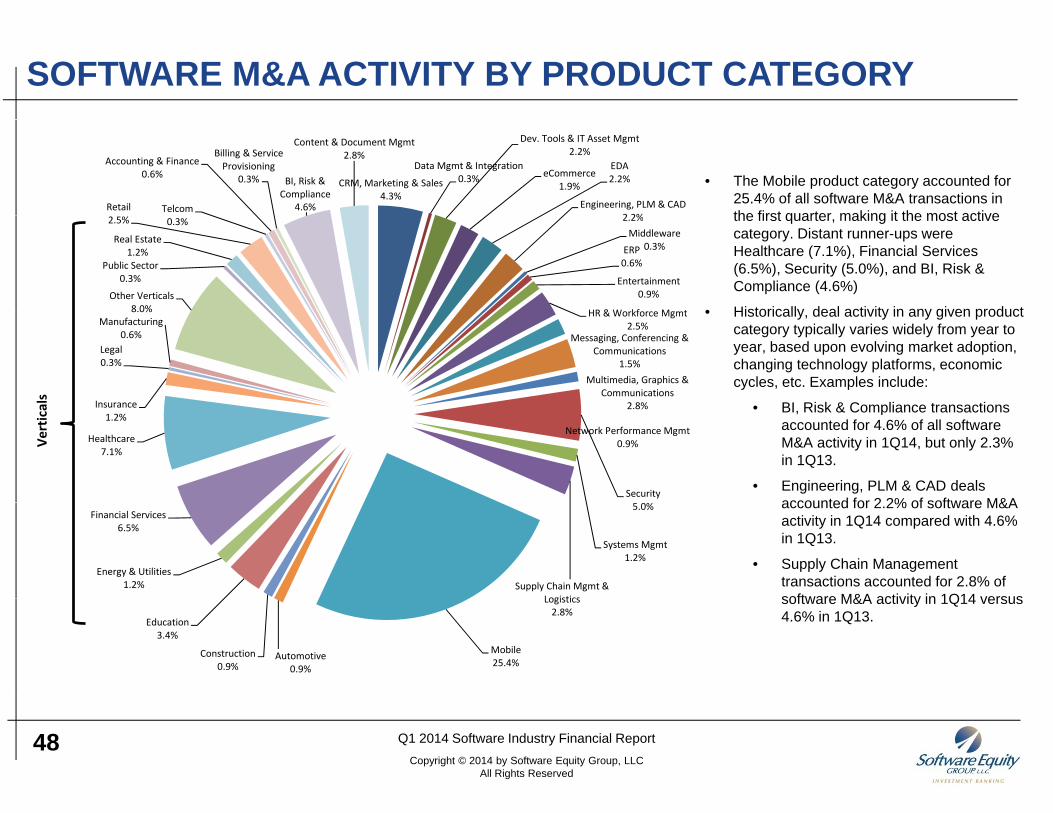
• The Mobile product category accounted for 25.4% of all software M&A transactions in the first quarter making it the most active
CRM, Marketing & Sales4.3%
Data Mgmt & Integration0.3%
Dev. Tools & IT Asset Mgmt2.2%
eCommerce1.9%
EDA2.2%
Engineering, PLM & CAD2 2%
Retail Telcom
Accounting & Finance0.6%
Billing & Service Provisioning
0.3% BI, Risk & Compliance
4.6%
Content & Document Mgmt2.8%
the first quarter, making it the most active category. Distant runner-ups were Healthcare (7.1%), Financial Services (6.5%), Security (5.0%), and BI, Risk & Compliance (4.6%)
• Historically deal activity in any given product
2.2%Middleware
0.3%ERP0.6%
Entertainment0.9%
HR &W kf M t
Other Verticals8.0%
Public Sector0.3%
Real Estate1.2%
2.5% 0.3%
• Historically, deal activity in any given product category typically varies widely from year to year, based upon evolving market adoption, changing technology platforms, economic cycles, etc. Examples include:
• BI Risk & Compliance transactions
HR & Workforce Mgmt2.5%
Messaging, Conferencing & Communications
1.5%Multimedia, Graphics &
Communications2 8%Insurance
Legal0.3%
Manufacturing0.6%
8.0%
als
• BI, Risk & Compliance transactions accounted for 4.6% of all software M&A activity in 1Q14, but only 2.3% in 1Q13.
• Engineering, PLM & CAD deals accounted for 2 2% of software M&A
2.8%
Network Performance Mgmt0.9%
Security
Healthcare7.1%
Insurance1.2%
Vertica
accounted for 2.2% of software M&A activity in 1Q14 compared with 4.6% in 1Q13.
• Supply Chain Management transactions accounted for 2.8% of software M&A activity in 1Q14 versus
5.0%
Systems Mgmt1.2%
Supply Chain Mgmt & Logistics
Energy & Utilities1.2%
Financial Services6.5%
software M&A activity in 1Q14 versus 4.6% in 1Q13.
Logistics2.8%
Mobile25.4%
Automotive0.9%
Construction0.9%
Education3.4%
48 Q1 2014 Software Industry Financial ReportCopyright © 2014 by Software Equity Group, LLC
All Rights Reserved
SOFTWARE M&A EXIT VALUATIONS BY PRODUCT CATEGORY
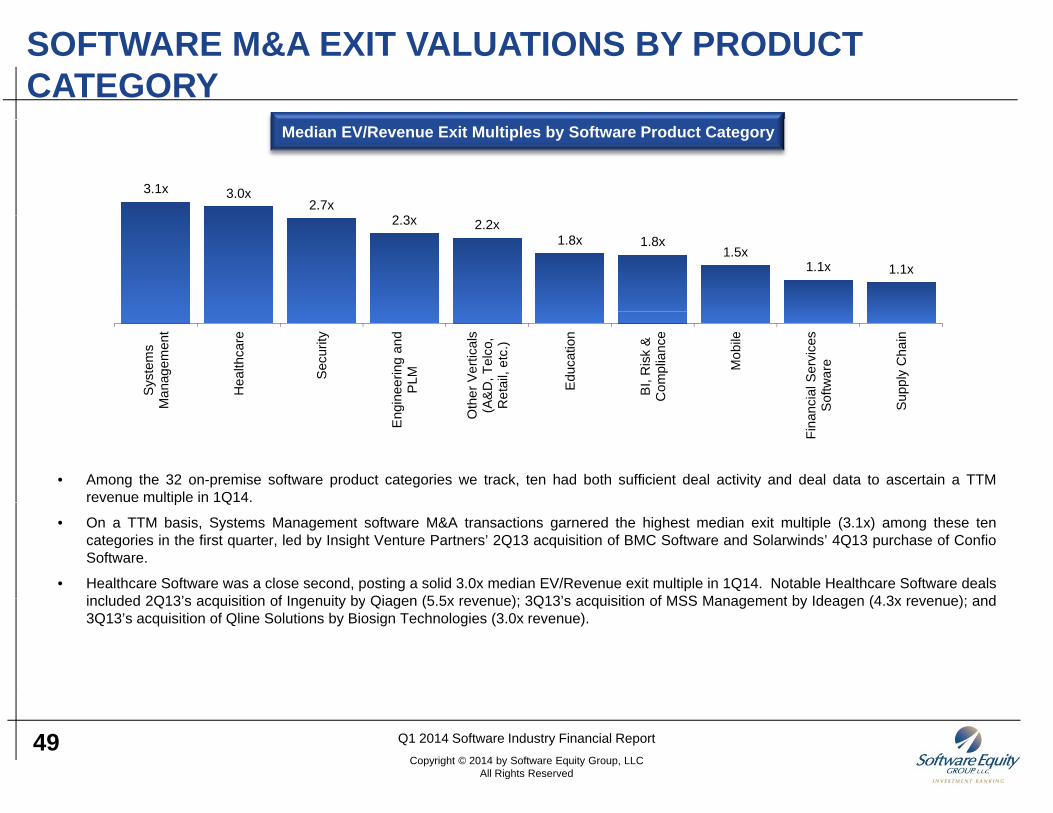
Median EV/Revenue Exit Multiples by Software Product Category
3.1x 3.0x2.7x
2 32.3x 2.2x1.8x 1.8x
1.5x1.1x 1.1x
Sys
tem
sM
anag
emen
t
Hea
lthca
re
Sec
urity
gine
erin
g an
dP
LM
ther
Ver
tical
sA&
D, T
elco
,R
etai
l, et
c.)
Edu
catio
n
BI,
Ris
k &
Com
plia
nce
Mob
ile
cial
Ser
vice
sS
oftw
are
Sup
ply
Cha
in
• Among the 32 on-premise software product categories we track, ten had both sufficient deal activity and deal data to ascertain a TTMrevenue multiple in 1Q14.
M
Eng O
t (A R
Fina
n S S
p Q
• On a TTM basis, Systems Management software M&A transactions garnered the highest median exit multiple (3.1x) among these tencategories in the first quarter, led by Insight Venture Partners’ 2Q13 acquisition of BMC Software and Solarwinds’ 4Q13 purchase of ConfioSoftware.
• Healthcare Software was a close second, posting a solid 3.0x median EV/Revenue exit multiple in 1Q14. Notable Healthcare Software dealsincluded 2Q13’s acquisition of Ingenuity by Qiagen (5 5x revenue); 3Q13’s acquisition of MSS Management by Ideagen (4 3x revenue); andincluded 2Q13’s acquisition of Ingenuity by Qiagen (5.5x revenue); 3Q13’s acquisition of MSS Management by Ideagen (4.3x revenue); and3Q13’s acquisition of Qline Solutions by Biosign Technologies (3.0x revenue).
49 Q1 2014 Software Industry Financial ReportCopyright © 2014 by Software Equity Group, LLC
All Rights Reserved
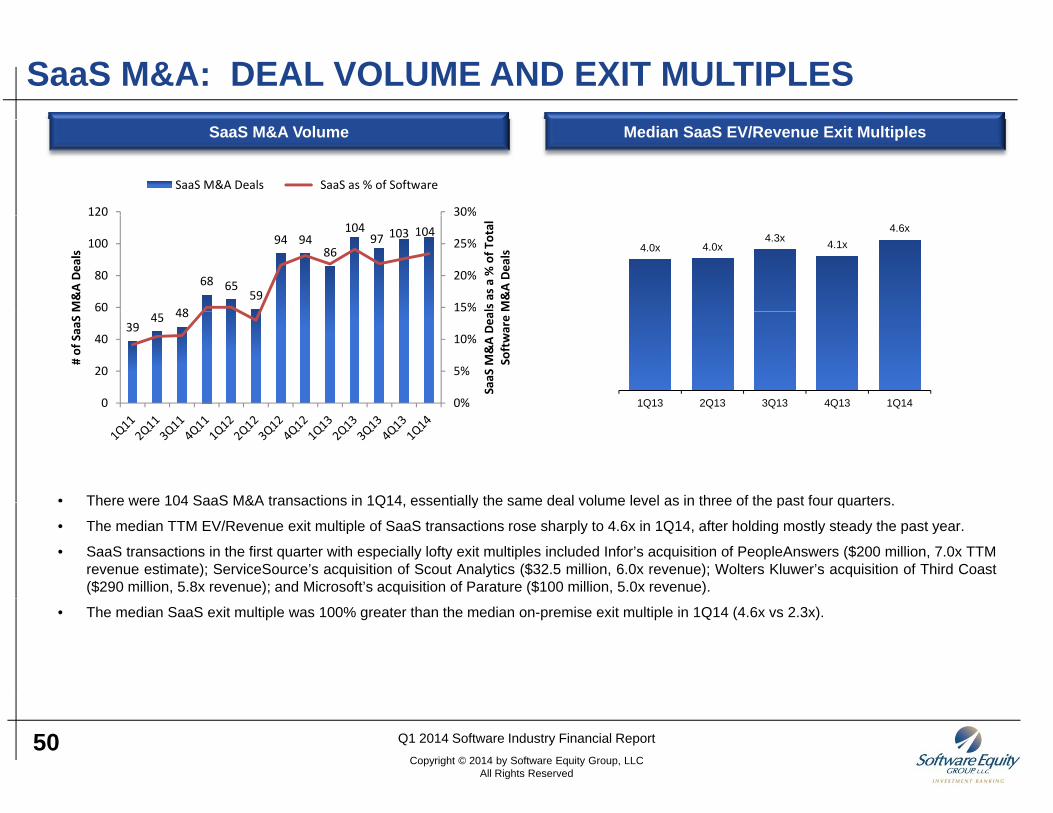
SaaS M&A: DEAL VOLUME AND EXIT MULTIPLESMedian SaaS EV/Revenue Exit MultiplesSaaS M&A Volume
30%120
SaaS M&A Deals SaaS as % of Software
4.0x 4.0x4.3x 4.1x
4.6x
48
68 6559
94 9486
10497 103 104
15%
20%
25%
30%
60
80
100
120
ls as a % of T
otal
M&A Deals
M&A Deals
1Q13 2Q13 3Q13 4Q13 1Q14
3945 48
0%
5%
10%
15%
0
20
40
60
SaaS M
&A Dea
Software
# of SaaS M
• There were 104 SaaS M&A transactions in 1Q14 essentially the same deal volume level as in three of the past four quarters
Q Q Q Q Q0%0
There were 104 SaaS M&A transactions in 1Q14, essentially the same deal volume level as in three of the past four quarters.
• The median TTM EV/Revenue exit multiple of SaaS transactions rose sharply to 4.6x in 1Q14, after holding mostly steady the past year.
• SaaS transactions in the first quarter with especially lofty exit multiples included Infor’s acquisition of PeopleAnswers ($200 million, 7.0x TTMrevenue estimate); ServiceSource’s acquisition of Scout Analytics ($32.5 million, 6.0x revenue); Wolters Kluwer’s acquisition of Third Coast($290 million, 5.8x revenue); and Microsoft’s acquisition of Parature ($100 million, 5.0x revenue).
• The median SaaS exit multiple was 100% greater than the median on-premise exit multiple in 1Q14 (4.6x vs 2.3x).
50 Q1 2014 Software Industry Financial ReportCopyright © 2014 by Software Equity Group, LLC
All Rights Reserved
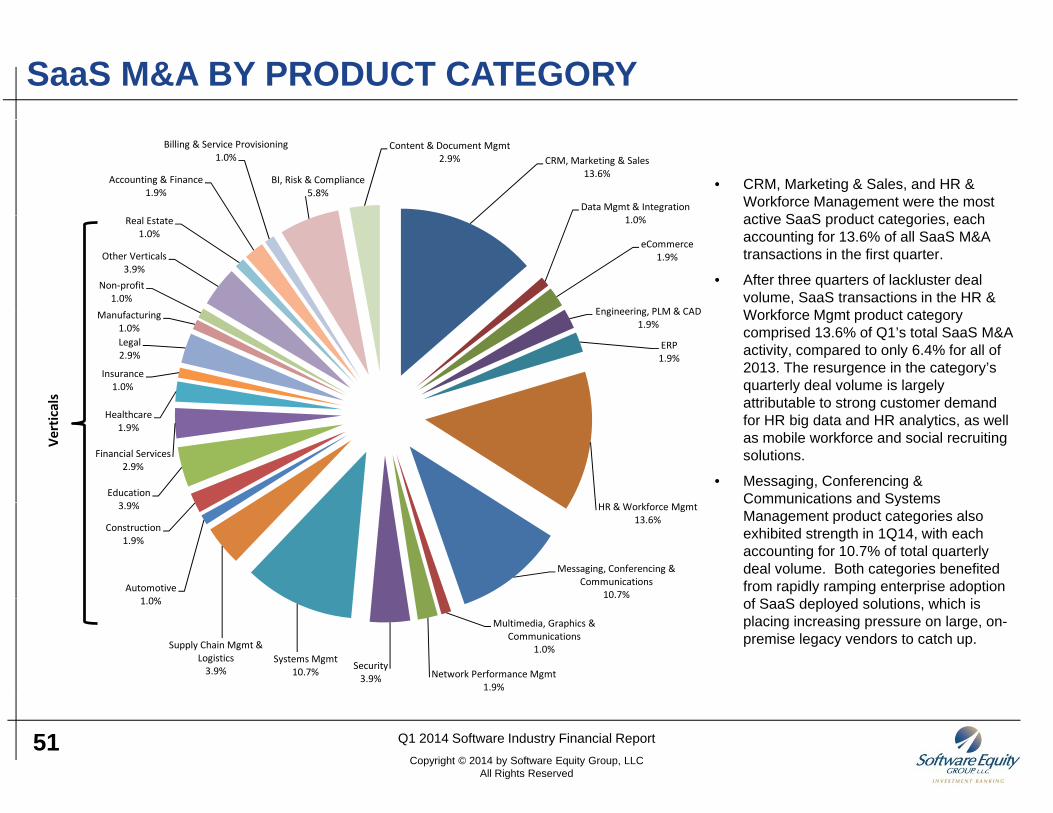
SaaS M&A BY PRODUCT CATEGORY
• CRM, Marketing & Sales, and HR & Workforce Management were the most
ti S S d t t i h
CRM, Marketing & Sales13.6%
Data Mgmt & Integration
Accounting & Finance1.9%
Billing & Service Provisioning1.0%
BI, Risk & Compliance5.8%
Content & Document Mgmt2.9%
active SaaS product categories, each accounting for 13.6% of all SaaS M&A transactions in the first quarter.
• After three quarters of lackluster deal volume, SaaS transactions in the HR & W kf M t d t t
1.0%
eCommerce1.9%
Engineering PLM & CADf
Non‐profit1.0%
Other Verticals3.9%
Real Estate1.0%
Workforce Mgmt product category comprised 13.6% of Q1’s total SaaS M&A activity, compared to only 6.4% for all of 2013. The resurgence in the category’s quarterly deal volume is largely attributable to strong customer demand
Engineering, PLM & CAD1.9%
ERP1.9%
Insurance1.0%
Legal2.9%
Manufacturing1.0%
als attributable to strong customer demand
for HR big data and HR analytics, as well as mobile workforce and social recruiting solutions.
• Messaging, Conferencing & Communications and SystemsEducation
3 9%
Financial Services2.9%
Healthcare1.9%
Vertica
Communications and Systems Management product categories also exhibited strength in 1Q14, with each accounting for 10.7% of total quarterly deal volume. Both categories benefited from rapidly ramping enterprise adoption
f S S d l d l ti hi h i
HR & Workforce Mgmt13.6%
Messaging, Conferencing & Communications
10.7%Automotive
1 0%
Construction1.9%
3.9%
of SaaS deployed solutions, which is placing increasing pressure on large, on-premise legacy vendors to catch up.
Multimedia, Graphics & Communications
1.0%
Network Performance Mgmt1.9%
Security3.9%
Systems Mgmt10.7%
Supply Chain Mgmt & Logistics3.9%
1.0%
51 Q1 2014 Software Industry Financial ReportCopyright © 2014 by Software Equity Group, LLC
All Rights Reserved
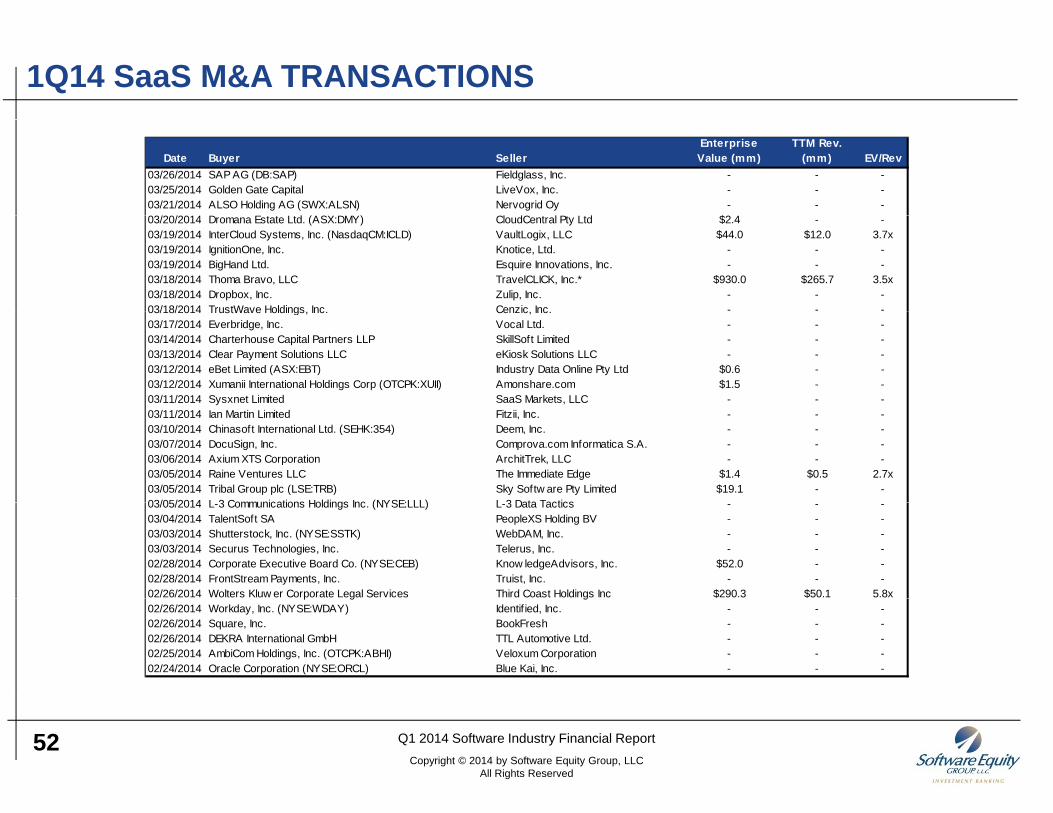
1Q14 SaaS M&A TRANSACTIONS
Date Buyer SellerEnterprise Value (mm)
TTM Rev. (mm) EV/Rev
03/26/2014 SAP AG (DB:SAP) Fieldglass, Inc. - - -03/25/2014 Golden Gate Capital LiveVox, Inc. - - -03/21/2014 ALSO Holding AG (SWX:ALSN) Nervogrid Oy - - -03/20/2014 D E L d (ASX DMY) Cl dC l P L d $2 403/20/2014 Dromana Estate Ltd. (ASX:DMY) CloudCentral Pty Ltd $2.4 - -03/19/2014 InterCloud Systems, Inc. (NasdaqCM:ICLD) VaultLogix, LLC $44.0 $12.0 3.7x03/19/2014 IgnitionOne, Inc. Knotice, Ltd. - - -03/19/2014 BigHand Ltd. Esquire Innovations, Inc. - - -03/18/2014 Thoma Bravo, LLC TravelCLICK, Inc.* $930.0 $265.7 3.5x03/18/2014 Dropbox, Inc. Zulip, Inc. - - -03/18/2014 TrustWave Holdings Inc Cenzic Inc - - -03/18/2014 TrustWave Holdings, Inc. Cenzic, Inc.03/17/2014 Everbridge, Inc. Vocal Ltd. - - -03/14/2014 Charterhouse Capital Partners LLP SkillSoft Limited - - -03/13/2014 Clear Payment Solutions LLC eKiosk Solutions LLC - - -03/12/2014 eBet Limited (ASX:EBT) Industry Data Online Pty Ltd $0.6 - -03/12/2014 Xumanii International Holdings Corp (OTCPK:XUII) Amonshare.com $1.5 - -03/11/2014 Sysxnet Limited SaaS Markets, LLC - - -03/11/2014 Ian Martin Limited Fitzii, Inc. - - -03/10/2014 Chinasoft International Ltd. (SEHK:354) Deem, Inc. - - -03/07/2014 DocuSign, Inc. Comprova.com Informatica S.A. - - -03/06/2014 Axium XTS Corporation ArchitTrek, LLC - - -03/05/2014 Raine Ventures LLC The Immediate Edge $1.4 $0.5 2.7x03/05/2014 Tribal Group plc (LSE:TRB) Sky Softw are Pty Limited $19.1 - -03/05/2014 L 3 Communications Holdings Inc (NYSE:LLL) L 3 Data Tactics03/05/2014 L-3 Communications Holdings Inc. (NYSE:LLL) L-3 Data Tactics - - -03/04/2014 TalentSoft SA PeopleXS Holding BV - - -03/03/2014 Shutterstock, Inc. (NYSE:SSTK) WebDAM, Inc. - - -03/03/2014 Securus Technologies, Inc. Telerus, Inc. - - -02/28/2014 Corporate Executive Board Co. (NYSE:CEB) Know ledgeAdvisors, Inc. $52.0 - -02/28/2014 FrontStream Payments, Inc. Truist, Inc. - - -02/26/2014 Wolters Kluw er Corporate Legal Services Third Coast Holdings Inc $290.3 $50.1 5.8xp g g02/26/2014 Workday, Inc. (NYSE:WDAY) Identif ied, Inc. - - -02/26/2014 Square, Inc. BookFresh - - -02/26/2014 DEKRA International GmbH TTL Automotive Ltd. - - -02/25/2014 AmbiCom Holdings, Inc. (OTCPK:ABHI) Veloxum Corporation - - -02/24/2014 Oracle Corporation (NYSE:ORCL) Blue Kai, Inc. - - -
52 Q1 2014 Software Industry Financial ReportCopyright © 2014 by Software Equity Group, LLC
All Rights Reserved
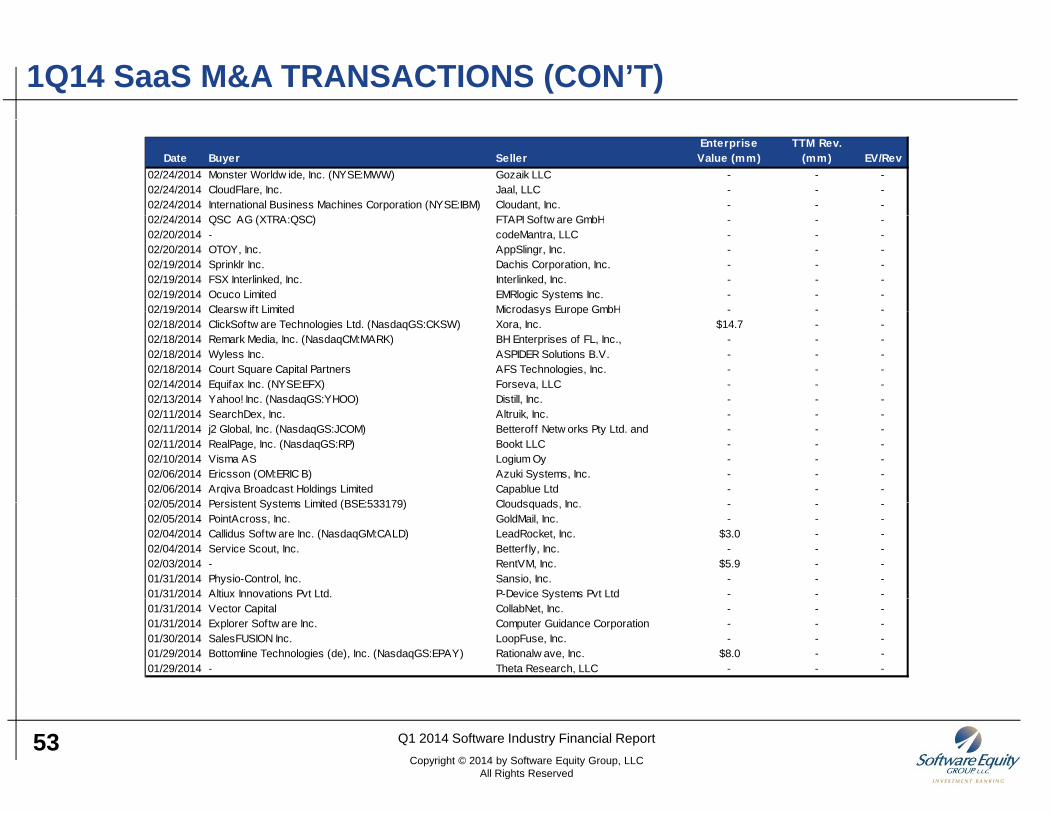
1Q14 SaaS M&A TRANSACTIONS (CON’T)
Date Buyer SellerEnterprise Value (mm)
TTM Rev. (mm) EV/Rev
02/24/2014 Monster Worldw ide, Inc. (NYSE:MWW) Gozaik LLC - - -02/24/2014 CloudFlare, Inc. Jaal, LLC - - -02/24/2014 International Business Machines Corporation (NYSE:IBM) Cloudant, Inc. - - -02/24/2014 QSC AG (XTRA QSC) FTAPI S f G bH02/24/2014 QSC AG (XTRA:QSC) FTAPI Softw are GmbH - - -02/20/2014 - codeMantra, LLC - - -02/20/2014 OTOY, Inc. AppSlingr, Inc. - - -02/19/2014 Sprinklr Inc. Dachis Corporation, Inc. - - -02/19/2014 FSX Interlinked, Inc. Interlinked, Inc. - - -02/19/2014 Ocuco Limited EMRlogic Systems Inc. - - -02/19/2014 Clearsw ift Limited Microdasys Europe GmbH - - -02/19/2014 Clearsw ift Limited Microdasys Europe GmbH02/18/2014 ClickSoftw are Technologies Ltd. (NasdaqGS:CKSW) Xora, Inc. $14.7 - -02/18/2014 Remark Media, Inc. (NasdaqCM:MARK) BH Enterprises of FL, Inc., - - -02/18/2014 Wyless Inc. ASPIDER Solutions B.V. - - -02/18/2014 Court Square Capital Partners AFS Technologies, Inc. - - -02/14/2014 Equifax Inc. (NYSE:EFX) Forseva, LLC - - -02/13/2014 Yahoo! Inc. (NasdaqGS:YHOO) Distill, Inc. - - -02/11/2014 SearchDex, Inc. Altruik, Inc. - - -02/11/2014 j2 Global, Inc. (NasdaqGS:JCOM) Betteroff Netw orks Pty Ltd. and - - -02/11/2014 RealPage, Inc. (NasdaqGS:RP) Bookt LLC - - -02/10/2014 Visma AS Logium Oy - - -02/06/2014 Ericsson (OM:ERIC B) Azuki Systems, Inc. - - -02/06/2014 Arqiva Broadcast Holdings Limited Capablue Ltd - - -02/05/2014 Persistent Systems Limited (BSE:533179) Cloudsquads Inc02/05/2014 Persistent Systems Limited (BSE:533179) Cloudsquads, Inc. - - -02/05/2014 PointAcross, Inc. GoldMail, Inc. - - -02/04/2014 Callidus Softw are Inc. (NasdaqGM:CALD) LeadRocket, Inc. $3.0 - -02/04/2014 Service Scout, Inc. Betterf ly, Inc. - - -02/03/2014 - RentVM, Inc. $5.9 - -01/31/2014 Physio-Control, Inc. Sansio, Inc. - - -01/31/2014 Altiux Innovations Pvt Ltd. P-Device Systems Pvt Ltd - - -y01/31/2014 Vector Capital CollabNet, Inc. - - -01/31/2014 Explorer Softw are Inc. Computer Guidance Corporation - - -01/30/2014 SalesFUSION Inc. LoopFuse, Inc. - - -01/29/2014 Bottomline Technologies (de), Inc. (NasdaqGS:EPAY) Rationalw ave, Inc. $8.0 - -01/29/2014 - Theta Research, LLC - - -
53 Q1 2014 Software Industry Financial ReportCopyright © 2014 by Software Equity Group, LLC
All Rights Reserved
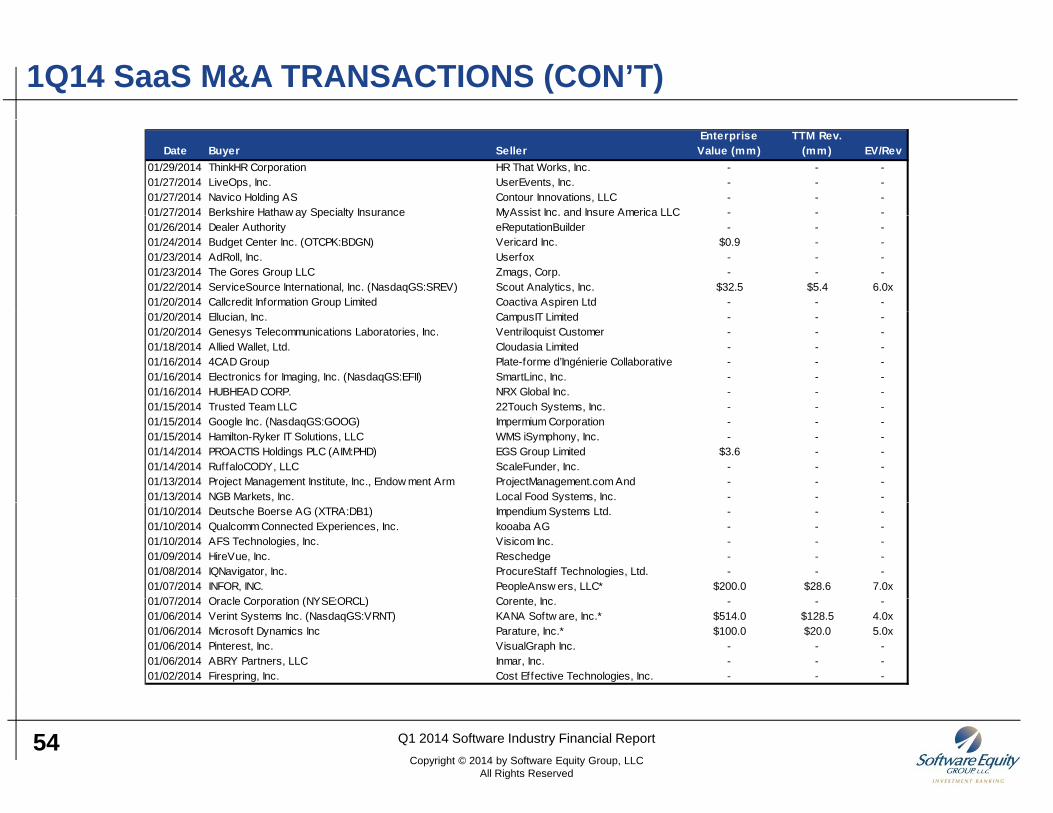
1Q14 SaaS M&A TRANSACTIONS (CON’T)
Date Buyer SellerEnterprise Value (mm)
TTM Rev. (mm) EV/Rev
01/29/2014 ThinkHR Corporation HR That Works, Inc. - - -01/27/2014 LiveOps, Inc. UserEvents, Inc. - - -01/27/2014 Navico Holding AS Contour Innovations, LLC - - -01/27/2014 Berkshire Hathaw ay Specialty Insurance MyAssist Inc. and Insure America LLC - - -01/27/2014 Berkshire Hathaw ay Specialty Insurance MyAssist Inc. and Insure America LLC01/26/2014 Dealer Authority eReputationBuilder - - -01/24/2014 Budget Center Inc. (OTCPK:BDGN) Vericard Inc. $0.9 - -01/23/2014 AdRoll, Inc. Userfox - - -01/23/2014 The Gores Group LLC Zmags, Corp. - - -01/22/2014 ServiceSource International, Inc. (NasdaqGS:SREV) Scout Analytics, Inc. $32.5 $5.4 6.0x01/20/2014 Callcredit Information Group Limited Coactiva Aspiren Ltd - - -01/20/2014 Ellucian, Inc. CampusIT Limited - - -01/20/2014 Genesys Telecommunications Laboratories, Inc. Ventriloquist Customer - - -01/18/2014 Allied Wallet, Ltd. Cloudasia Limited - - -01/16/2014 4CAD Group Plate-forme d’Ingénierie Collaborative - - -01/16/2014 Electronics for Imaging, Inc. (NasdaqGS:EFII) SmartLinc, Inc. - - -01/16/2014 HUBHEAD CORP. NRX Global Inc. - - -01/15/2014 Trusted Team LLC 22Touch Systems Inc01/15/2014 Trusted Team LLC 22Touch Systems, Inc. - - -01/15/2014 Google Inc. (NasdaqGS:GOOG) Impermium Corporation - - -01/15/2014 Hamilton-Ryker IT Solutions, LLC WMS iSymphony, Inc. - - -01/14/2014 PROACTIS Holdings PLC (AIM:PHD) EGS Group Limited $3.6 - -01/14/2014 RuffaloCODY, LLC ScaleFunder, Inc. - - -01/13/2014 Project Management Institute, Inc., Endow ment Arm ProjectManagement.com And - - -01/13/2014 NGB Markets, Inc. Local Food Systems, Inc. - - -01/10/2014 Deutsche Boerse AG (XTRA:DB1) Impendium Systems Ltd. - - -01/10/2014 Qualcomm Connected Experiences, Inc. kooaba AG - - -01/10/2014 AFS Technologies, Inc. Visicom Inc. - - -01/09/2014 HireVue, Inc. Reschedge - - -01/08/2014 IQNavigator, Inc. ProcureStaff Technologies, Ltd. - - -01/07/2014 INFOR, INC. PeopleAnsw ers, LLC* $200.0 $28.6 7.0x01/07/2014 O l C ti (NYSE ORCL) C t I01/07/2014 Oracle Corporation (NYSE:ORCL) Corente, Inc. - - -01/06/2014 Verint Systems Inc. (NasdaqGS:VRNT) KANA Softw are, Inc.* $514.0 $128.5 4.0x01/06/2014 Microsoft Dynamics Inc Parature, Inc.* $100.0 $20.0 5.0x01/06/2014 Pinterest, Inc. VisualGraph Inc. - - -01/06/2014 ABRY Partners, LLC Inmar, Inc. - - -01/02/2014 Firespring, Inc. Cost Effective Technologies, Inc. - - -
54 Q1 2014 Software Industry Financial ReportCopyright © 2014 by Software Equity Group, LLC
All Rights Reserved
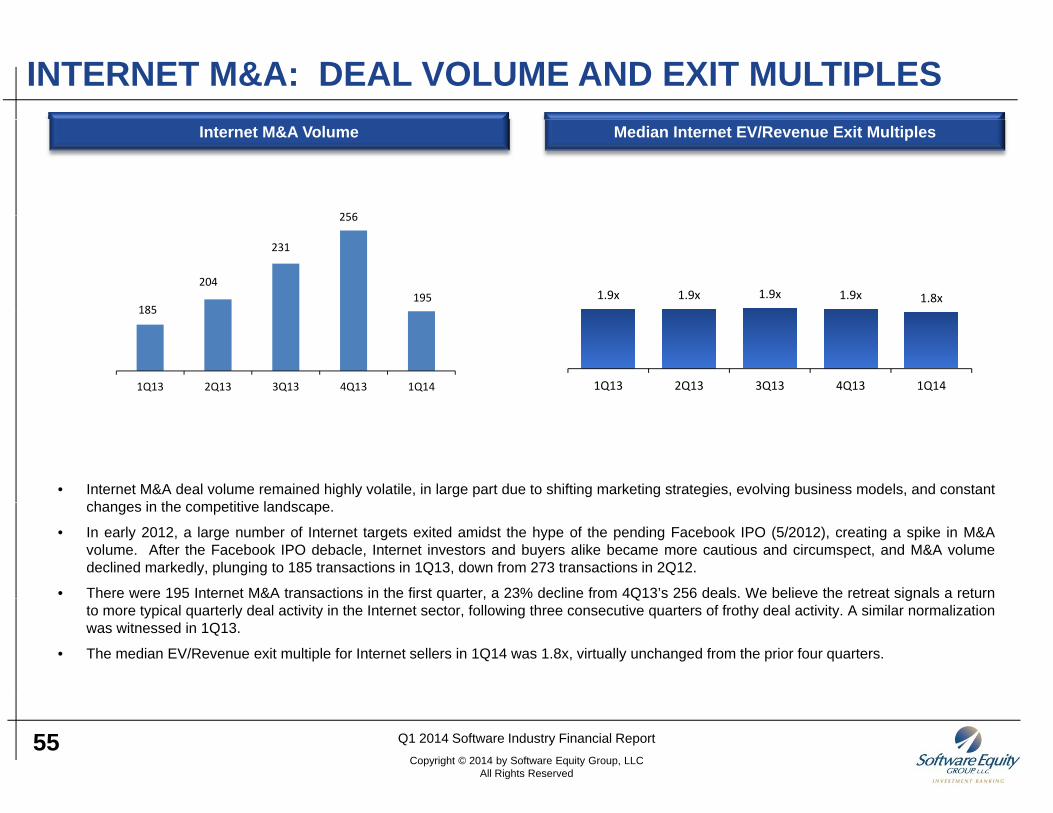
INTERNET M&A: DEAL VOLUME AND EXIT MULTIPLESInternet M&A Volume
256
Median Internet EV/Revenue Exit Multiples
185
204
231
256
195 1.9x 1.9x 1.9x 1.9x 1.8x185
1Q13 2Q13 3Q13 4Q13 1Q14 1Q13 2Q13 3Q13 4Q13 1Q14
• Internet M&A deal volume remained highly volatile, in large part due to shifting marketing strategies, evolving business models, and constanth i th titi l dchanges in the competitive landscape.
• In early 2012, a large number of Internet targets exited amidst the hype of the pending Facebook IPO (5/2012), creating a spike in M&Avolume. After the Facebook IPO debacle, Internet investors and buyers alike became more cautious and circumspect, and M&A volumedeclined markedly, plunging to 185 transactions in 1Q13, down from 273 transactions in 2Q12.
• There were 195 Internet M&A transactions in the first quarter, a 23% decline from 4Q13’s 256 deals. We believe the retreat signals a returnq , Q gto more typical quarterly deal activity in the Internet sector, following three consecutive quarters of frothy deal activity. A similar normalizationwas witnessed in 1Q13.
• The median EV/Revenue exit multiple for Internet sellers in 1Q14 was 1.8x, virtually unchanged from the prior four quarters.
55 Q1 2014 Software Industry Financial ReportCopyright © 2014 by Software Equity Group, LLC
All Rights Reserved
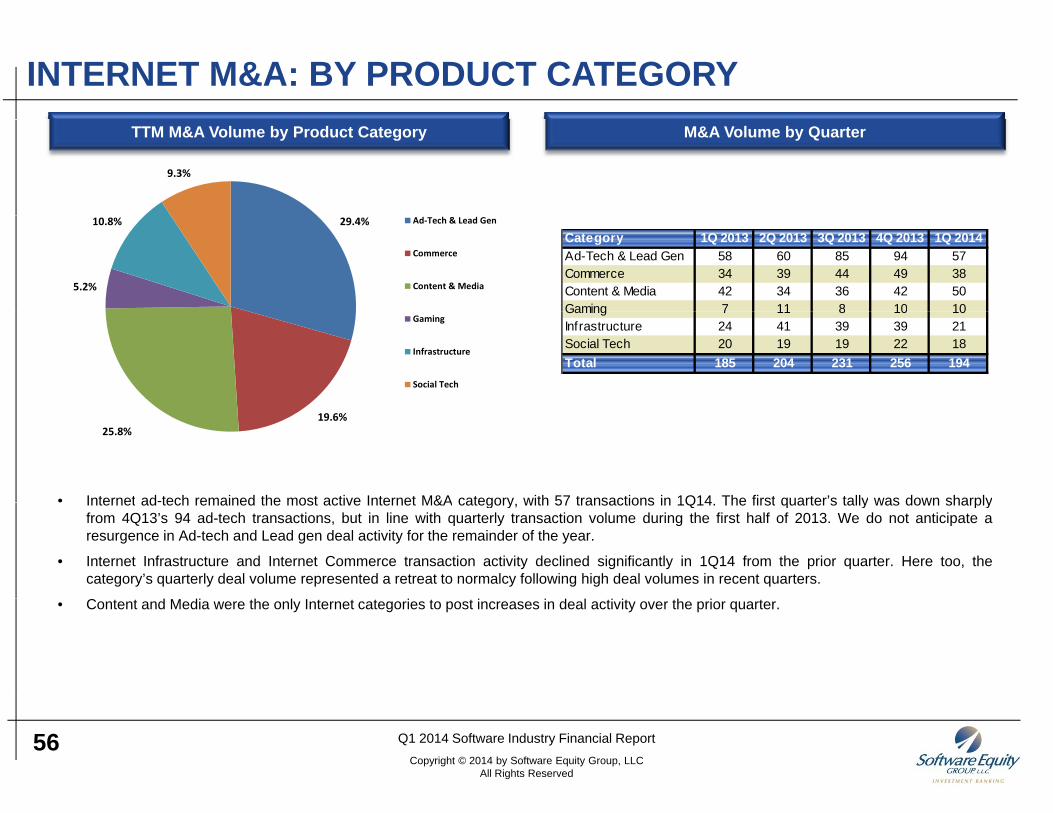
INTERNET M&A: BY PRODUCT CATEGORYM&A Volume by QuarterTTM M&A Volume by Product Category
9.3%
29.4%
5.2%
10.8% Ad‐Tech & Lead Gen
Commerce
Content & Media
Category 1Q 2013 2Q 2013 3Q 2013 4Q 2013 1Q 2014Ad-Tech & Lead Gen 58 60 85 94 57Commerce 34 39 44 49 38Content & Media 42 34 36 42 50Gaming 7 11 8 10 10
Gaming
Infrastructure
Social Tech
Gaming 7 11 8 10 10Infrastructure 24 41 39 39 21Social Tech 20 19 19 22 18Total 185 204 231 256 194
• Internet ad-tech remained the most active Internet M&A category with 57 transactions in 1Q14 The first quarter’s tally was down sharply
19.6%25.8%
Internet ad tech remained the most active Internet M&A category, with 57 transactions in 1Q14. The first quarter s tally was down sharplyfrom 4Q13’s 94 ad-tech transactions, but in line with quarterly transaction volume during the first half of 2013. We do not anticipate aresurgence in Ad-tech and Lead gen deal activity for the remainder of the year.
• Internet Infrastructure and Internet Commerce transaction activity declined significantly in 1Q14 from the prior quarter. Here too, thecategory’s quarterly deal volume represented a retreat to normalcy following high deal volumes in recent quarters.
• Content and Media were the only Internet categories to post increases in deal activity over the prior quarter.
56 Q1 2014 Software Industry Financial ReportCopyright © 2014 by Software Equity Group, LLC
All Rights Reserved
APPENDIX
57
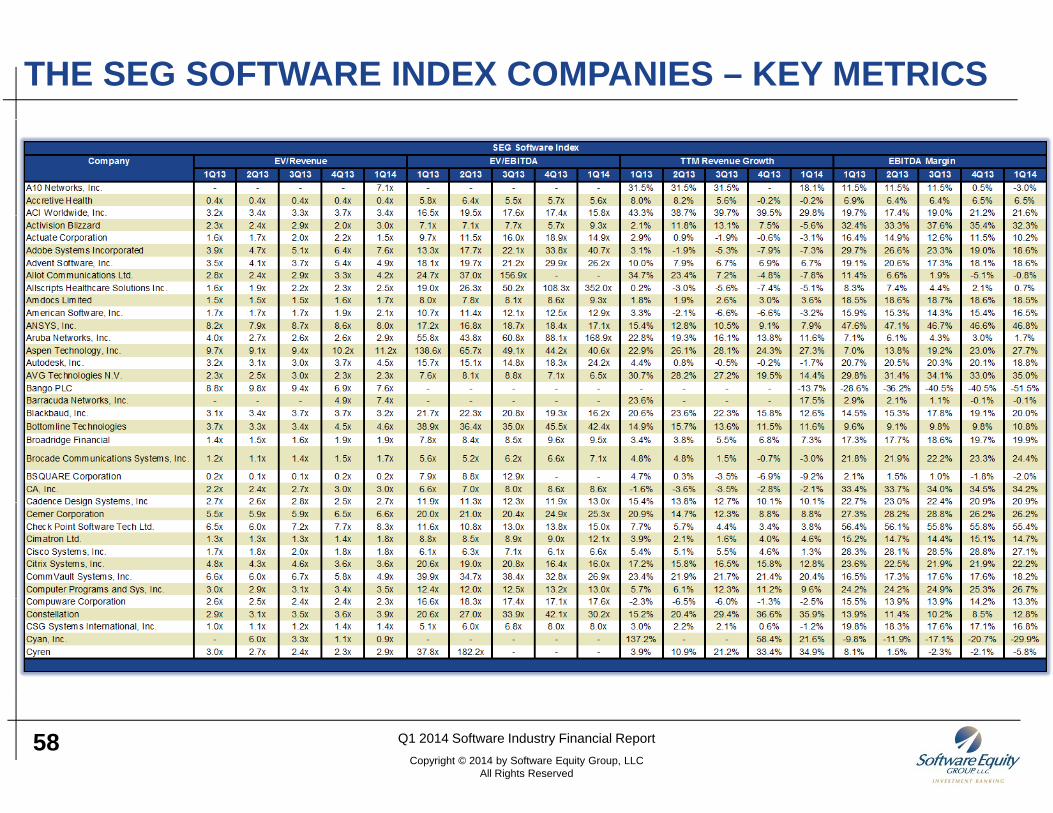
THE SEG SOFTWARE INDEX COMPANIES – KEY METRICS
58 Q1 2014 Software Industry Financial ReportCopyright © 2014 by Software Equity Group, LLC
All Rights Reserved
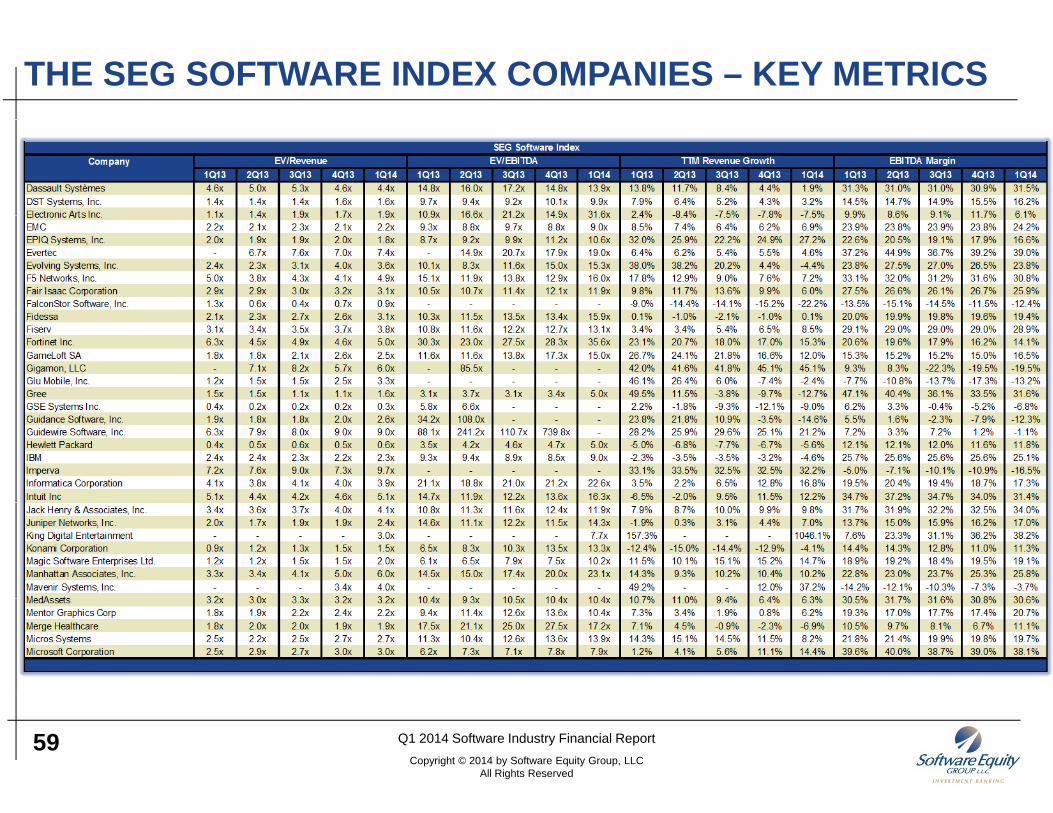
THE SEG SOFTWARE INDEX COMPANIES – KEY METRICS
59 Q1 2014 Software Industry Financial ReportCopyright © 2014 by Software Equity Group, LLC
All Rights Reserved
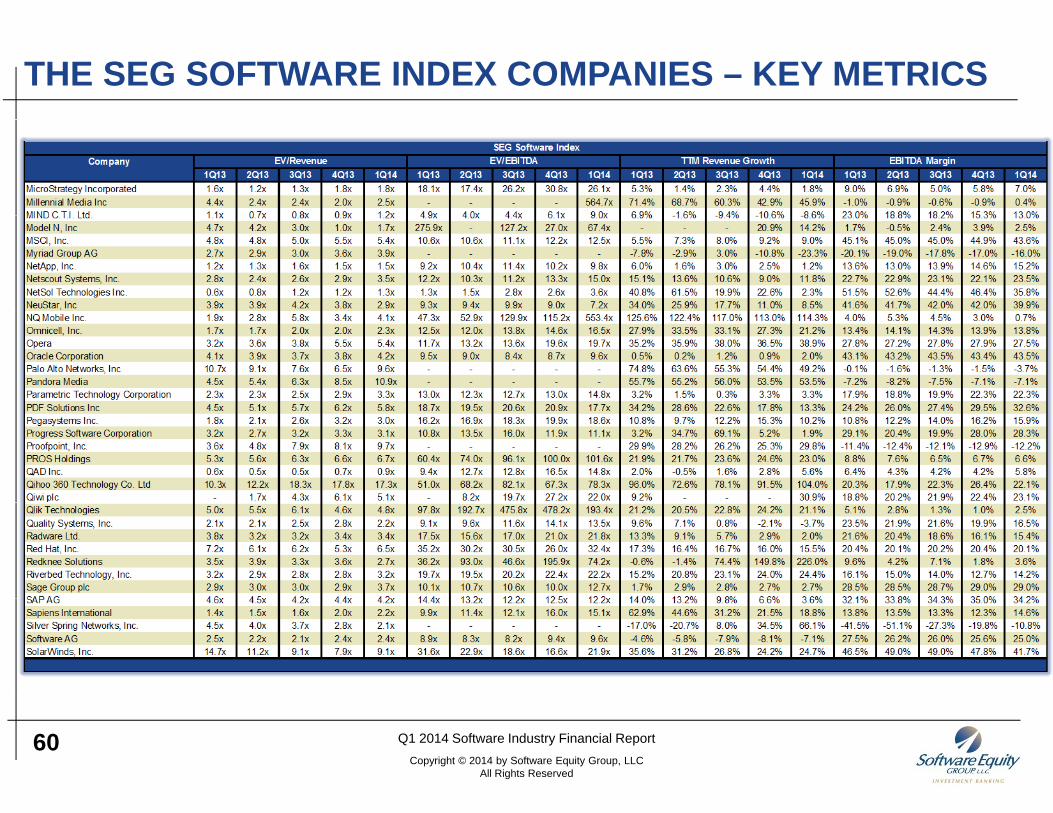
THE SEG SOFTWARE INDEX COMPANIES – KEY METRICS
60 Q1 2014 Software Industry Financial ReportCopyright © 2014 by Software Equity Group, LLC
All Rights Reserved
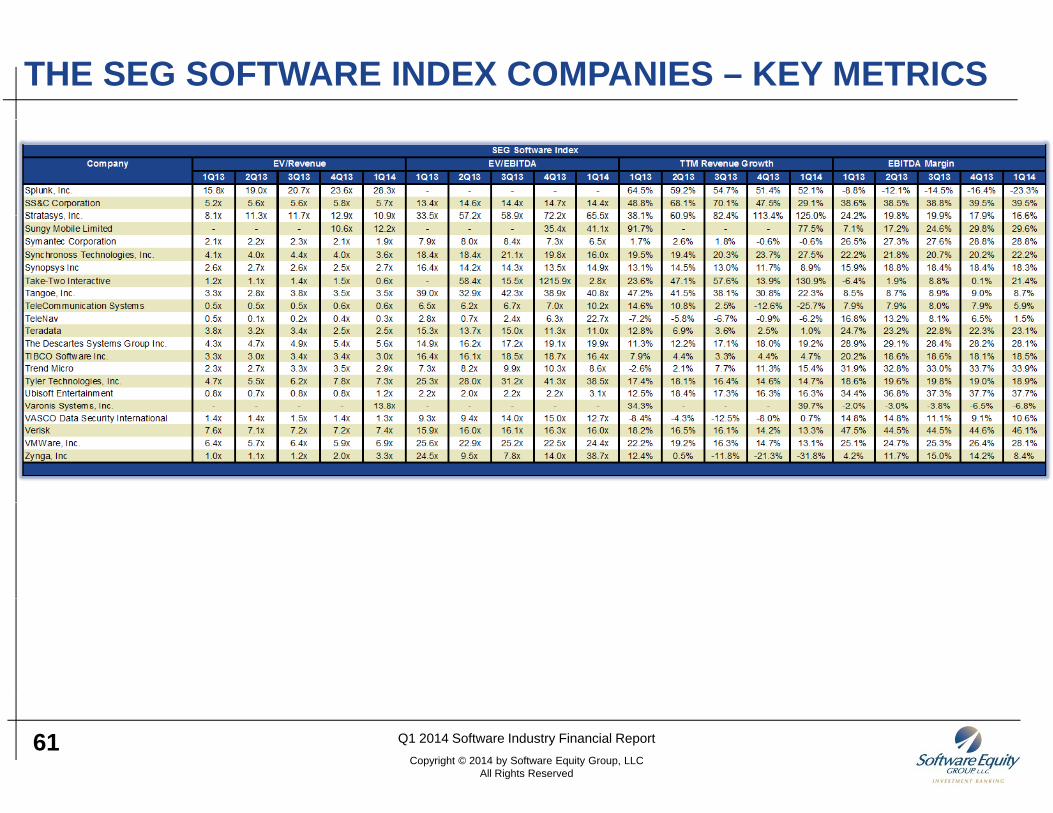
THE SEG SOFTWARE INDEX COMPANIES – KEY METRICS
61 Q1 2014 Software Industry Financial ReportCopyright © 2014 by Software Equity Group, LLC
All Rights Reserved
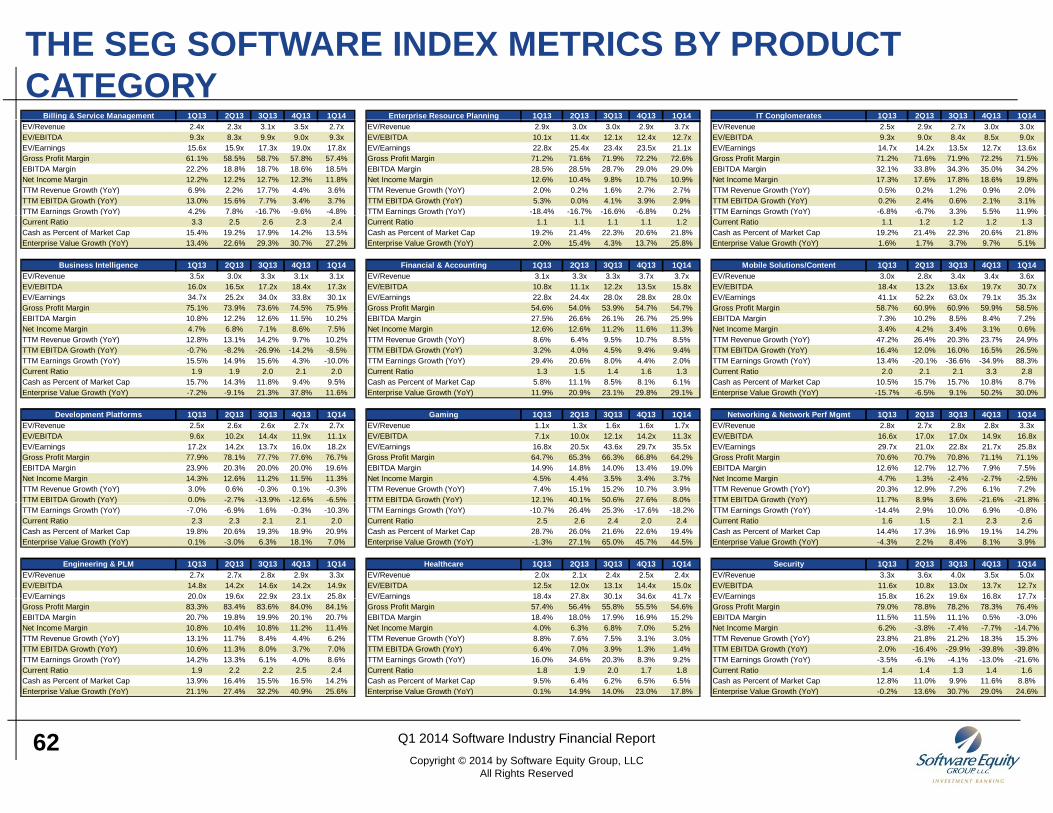
THE SEG SOFTWARE INDEX METRICS BY PRODUCT CATEGORY
Billing & Service Management 1Q13 2Q13 3Q13 4Q13 1Q14 Enterprise Resource Planning 1Q13 2Q13 3Q13 4Q13 1Q14 IT Conglomerates 1Q13 2Q13 3Q13 4Q13 1Q14g gEV/Revenue 2.4x 2.3x 3.1x 3.5x 2.7xEV/EBITDA 9.3x 8.3x 9.9x 9.0x 9.3xEV/Earnings 15.6x 15.9x 17.3x 19.0x 17.8xGross Profit Margin 61.1% 58.5% 58.7% 57.8% 57.4%EBITDA Margin 22.2% 18.8% 18.7% 18.6% 18.5%Net Income Margin 12.2% 12.2% 12.7% 12.3% 11.8%TTM Revenue Growth (YoY) 6.9% 2.2% 17.7% 4.4% 3.6%TTM EBITDA Growth (YoY) 13.0% 15.6% 7.7% 3.4% 3.7%TTM Earnings Growth (YoY) 4.2% 7.8% -16.7% -9.6% -4.8%
p gEV/Revenue 2.9x 3.0x 3.0x 2.9x 3.7xEV/EBITDA 10.1x 11.4x 12.1x 12.4x 12.7xEV/Earnings 22.8x 25.4x 23.4x 23.5x 21.1xGross Profit Margin 71.2% 71.6% 71.9% 72.2% 72.6%EBITDA Margin 28.5% 28.5% 28.7% 29.0% 29.0%Net Income Margin 12.6% 10.4% 9.8% 10.7% 10.9%TTM Revenue Growth (YoY) 2.0% 0.2% 1.6% 2.7% 2.7%TTM EBITDA Growth (YoY) 5.3% 0.0% 4.1% 3.9% 2.9%TTM Earnings Growth (YoY) -18.4% -16.7% -16.6% -6.8% 0.2%
gEV/Revenue 2.5x 2.9x 2.7x 3.0x 3.0xEV/EBITDA 9.3x 9.0x 8.4x 8.5x 9.0xEV/Earnings 14.7x 14.2x 13.5x 12.7x 13.6xGross Profit Margin 71.2% 71.6% 71.9% 72.2% 71.5%EBITDA Margin 32.1% 33.8% 34.3% 35.0% 34.2%Net Income Margin 17.3% 17.6% 17.8% 18.6% 19.8%TTM Revenue Growth (YoY) 0.5% 0.2% 1.2% 0.9% 2.0%TTM EBITDA Growth (YoY) 0.2% 2.4% 0.6% 2.1% 3.1%TTM Earnings Growth (YoY) -6.8% -6.7% 3.3% 5.5% 11.9%g ( )
Current Ratio 3.3 2.5 2.6 2.3 2.4Cash as Percent of Market Cap 15.4% 19.2% 17.9% 14.2% 13.5%Enterprise Value Growth (YoY) 13.4% 22.6% 29.3% 30.7% 27.2%
Business Intelligence 1Q13 2Q13 3Q13 4Q13 1Q14EV/Revenue 3.5x 3.0x 3.3x 3.1x 3.1xEV/EBITDA 16.0x 16.5x 17.2x 18.4x 17.3xEV/Earnings 34.7x 25.2x 34.0x 33.8x 30.1xGross Profit Margin 75.1% 73.9% 73.6% 74.5% 75.9%
g ( )Current Ratio 1.1 1.1 1.1 1.1 1.2Cash as Percent of Market Cap 19.2% 21.4% 22.3% 20.6% 21.8%Enterprise Value Growth (YoY) 2.0% 15.4% 4.3% 13.7% 25.8%
Financial & Accounting 1Q13 2Q13 3Q13 4Q13 1Q14EV/Revenue 3.1x 3.3x 3.3x 3.7x 3.7xEV/EBITDA 10.8x 11.1x 12.2x 13.5x 15.8xEV/Earnings 22.8x 24.4x 28.0x 28.8x 28.0xGross Profit Margin 54.6% 54.0% 53.9% 54.7% 54.7%
g ( )Current Ratio 1.1 1.2 1.2 1.2 1.3Cash as Percent of Market Cap 19.2% 21.4% 22.3% 20.6% 21.8%Enterprise Value Growth (YoY) 1.6% 1.7% 3.7% 9.7% 5.1%
Mobile Solutions/Content 1Q13 2Q13 3Q13 4Q13 1Q14EV/Revenue 3.0x 2.8x 3.4x 3.4x 3.6xEV/EBITDA 18.4x 13.2x 13.6x 19.7x 30.7xEV/Earnings 41.1x 52.2x 63.0x 79.1x 35.3xGross Profit Margin 58.7% 60.9% 60.9% 59.9% 58.5%g
EBITDA Margin 10.8% 12.2% 12.6% 11.5% 10.2%Net Income Margin 4.7% 6.8% 7.1% 8.6% 7.5%TTM Revenue Growth (YoY) 12.8% 13.1% 14.2% 9.7% 10.2%TTM EBITDA Growth (YoY) -0.7% -8.2% -26.9% -14.2% -8.5%TTM Earnings Growth (YoY) 15.5% 14.9% 15.6% 4.3% -10.0%Current Ratio 1.9 1.9 2.0 2.1 2.0Cash as Percent of Market Cap 15.7% 14.3% 11.8% 9.4% 9.5%Enterprise Value Growth (YoY) -7.2% -9.1% 21.3% 37.8% 11.6%
gEBITDA Margin 27.5% 26.6% 26.1% 26.7% 25.9%Net Income Margin 12.6% 12.6% 11.2% 11.6% 11.3%TTM Revenue Growth (YoY) 8.6% 6.4% 9.5% 10.7% 8.5%TTM EBITDA Growth (YoY) 3.2% 4.0% 4.5% 9.4% 9.4%TTM Earnings Growth (YoY) 29.4% 20.6% 8.0% 4.4% 2.0%Current Ratio 1.3 1.5 1.4 1.6 1.3Cash as Percent of Market Cap 5.8% 11.1% 8.5% 8.1% 6.1%Enterprise Value Growth (YoY) 11.9% 20.9% 23.1% 29.8% 29.1%
gEBITDA Margin 7.3% 10.2% 8.5% 8.4% 7.2%Net Income Margin 3.4% 4.2% 3.4% 3.1% 0.6%TTM Revenue Growth (YoY) 47.2% 26.4% 20.3% 23.7% 24.9%TTM EBITDA Growth (YoY) 16.4% 12.0% 16.0% 16.5% 26.5%TTM Earnings Growth (YoY) 13.4% -20.1% -36.6% -34.9% 88.3%Current Ratio 2.0 2.1 2.1 3.3 2.8Cash as Percent of Market Cap 10.5% 15.7% 15.7% 10.8% 8.7%Enterprise Value Growth (YoY) -15.7% -6.5% 9.1% 50.2% 30.0%
Development Platforms 1Q13 2Q13 3Q13 4Q13 1Q14EV/Revenue 2.5x 2.6x 2.6x 2.7x 2.7xEV/EBITDA 9.6x 10.2x 14.4x 11.9x 11.1xEV/Earnings 17.2x 14.2x 13.7x 16.0x 18.2xGross Profit Margin 77.9% 78.1% 77.7% 77.6% 76.7%EBITDA Margin 23.9% 20.3% 20.0% 20.0% 19.6%Net Income Margin 14.3% 12.6% 11.2% 11.5% 11.3%TTM Revenue Growth (YoY) 3.0% 0.6% -0.3% 0.1% -0.3%TTM EBITDA Growth (YoY) 0.0% -2.7% -13.9% -12.6% -6.5%
Gaming 1Q13 2Q13 3Q13 4Q13 1Q14EV/Revenue 1.1x 1.3x 1.6x 1.6x 1.7xEV/EBITDA 7.1x 10.0x 12.1x 14.2x 11.3xEV/Earnings 16.8x 20.5x 43.6x 29.7x 35.5xGross Profit Margin 64.7% 65.3% 66.3% 66.8% 64.2%EBITDA Margin 14.9% 14.8% 14.0% 13.4% 19.0%Net Income Margin 4.5% 4.4% 3.5% 3.4% 3.7%TTM Revenue Growth (YoY) 7.4% 15.1% 15.2% 10.7% 3.9%TTM EBITDA Growth (YoY) 12.1% 40.1% 50.6% 27.6% 8.0%
Networking & Network Perf Mgmt 1Q13 2Q13 3Q13 4Q13 1Q14EV/Revenue 2.8x 2.7x 2.8x 2.8x 3.3xEV/EBITDA 16.6x 17.0x 17.0x 14.9x 16.8xEV/Earnings 29.7x 21.0x 22.8x 21.7x 25.8xGross Profit Margin 70.6% 70.7% 70.8% 71.1% 71.1%EBITDA Margin 12.6% 12.7% 12.7% 7.9% 7.5%Net Income Margin 4.7% 1.3% -2.4% -2.7% -2.5%TTM Revenue Growth (YoY) 20.3% 12.9% 7.2% 6.1% 7.2%TTM EBITDA Growth (YoY) 11.7% 8.9% 3.6% -21.6% -21.8%( )
TTM Earnings Growth (YoY) -7.0% -6.9% 1.6% -0.3% -10.3%Current Ratio 2.3 2.3 2.1 2.1 2.0Cash as Percent of Market Cap 19.8% 20.6% 19.3% 18.9% 20.9%Enterprise Value Growth (YoY) 0.1% -3.0% 6.3% 18.1% 7.0%
Engineering & PLM 1Q13 2Q13 3Q13 4Q13 1Q14EV/Revenue 2.7x 2.7x 2.8x 2.9x 3.3xEV/EBITDA 14.8x 14.2x 14.6x 14.2x 14.9xEV/Earnings 20.0x 19.6x 22.9x 23.1x 25.8x
( )TTM Earnings Growth (YoY) -10.7% 26.4% 25.3% -17.6% -18.2%Current Ratio 2.5 2.6 2.4 2.0 2.4Cash as Percent of Market Cap 28.7% 26.0% 21.6% 22.6% 19.4%Enterprise Value Growth (YoY) -1.3% 27.1% 65.0% 45.7% 44.5%
Healthcare 1Q13 2Q13 3Q13 4Q13 1Q14EV/Revenue 2.0x 2.1x 2.4x 2.5x 2.4xEV/EBITDA 12.5x 12.0x 13.1x 14.4x 15.0xEV/Earnings 18.4x 27.8x 30.1x 34.6x 41.7x
( )TTM Earnings Growth (YoY) -14.4% 2.9% 10.0% 6.9% -0.8%Current Ratio 1.6 1.5 2.1 2.3 2.6Cash as Percent of Market Cap 14.4% 17.3% 16.9% 19.1% 14.2%Enterprise Value Growth (YoY) -4.3% 2.2% 8.4% 8.1% 3.9%
Security 1Q13 2Q13 3Q13 4Q13 1Q14EV/Revenue 3.3x 3.6x 4.0x 3.5x 5.0xEV/EBITDA 11.6x 10.8x 13.0x 13.7x 12.7xEV/Earnings 15.8x 16.2x 19.6x 16.8x 17.7xEV/Earnings 20.0x 19.6x 22.9x 23.1x 25.8x
Gross Profit Margin 83.3% 83.4% 83.6% 84.0% 84.1%EBITDA Margin 20.7% 19.8% 19.9% 20.1% 20.7%Net Income Margin 10.8% 10.4% 10.8% 11.2% 11.4%TTM Revenue Growth (YoY) 13.1% 11.7% 8.4% 4.4% 6.2%TTM EBITDA Growth (YoY) 10.6% 11.3% 8.0% 3.7% 7.0%TTM Earnings Growth (YoY) 14.2% 13.3% 6.1% 4.0% 8.6%Current Ratio 1.9 2.2 2.2 2.5 2.4Cash as Percent of Market Cap 13.9% 16.4% 15.5% 16.5% 14.2%Enterprise Value Growth (YoY) 21.1% 27.4% 32.2% 40.9% 25.6%
EV/Earnings 18.4x 27.8x 30.1x 34.6x 41.7xGross Profit Margin 57.4% 56.4% 55.8% 55.5% 54.6%EBITDA Margin 18.4% 18.0% 17.9% 16.9% 15.2%Net Income Margin 4.0% 6.3% 6.8% 7.0% 5.2%TTM Revenue Growth (YoY) 8.8% 7.6% 7.5% 3.1% 3.0%TTM EBITDA Growth (YoY) 6.4% 7.0% 3.9% 1.3% 1.4%TTM Earnings Growth (YoY) 16.0% 34.6% 20.3% 8.3% 9.2%Current Ratio 1.8 1.9 2.0 1.7 1.8Cash as Percent of Market Cap 9.5% 6.4% 6.2% 6.5% 6.5%Enterprise Value Growth (YoY) 0.1% 14.9% 14.0% 23.0% 17.8%
EV/Earnings 15.8x 16.2x 19.6x 16.8x 17.7xGross Profit Margin 79.0% 78.8% 78.2% 78.3% 76.4%EBITDA Margin 11.5% 11.5% 11.1% 0.5% -3.0%Net Income Margin 6.2% -3.8% -7.4% -7.7% -14.7%TTM Revenue Growth (YoY) 23.8% 21.8% 21.2% 18.3% 15.3%TTM EBITDA Growth (YoY) 2.0% -16.4% -29.9% -39.8% -39.8%TTM Earnings Growth (YoY) -3.5% -6.1% -4.1% -13.0% -21.6%Current Ratio 1.4 1.4 1.3 1.4 1.6Cash as Percent of Market Cap 12.8% 11.0% 9.9% 11.6% 8.8%Enterprise Value Growth (YoY) -0.2% 13.6% 30.7% 29.0% 24.6%
62 Q1 2014 Software Industry Financial ReportCopyright © 2014 by Software Equity Group, LLC
All Rights Reserved
p ( ) p ( ) p ( )
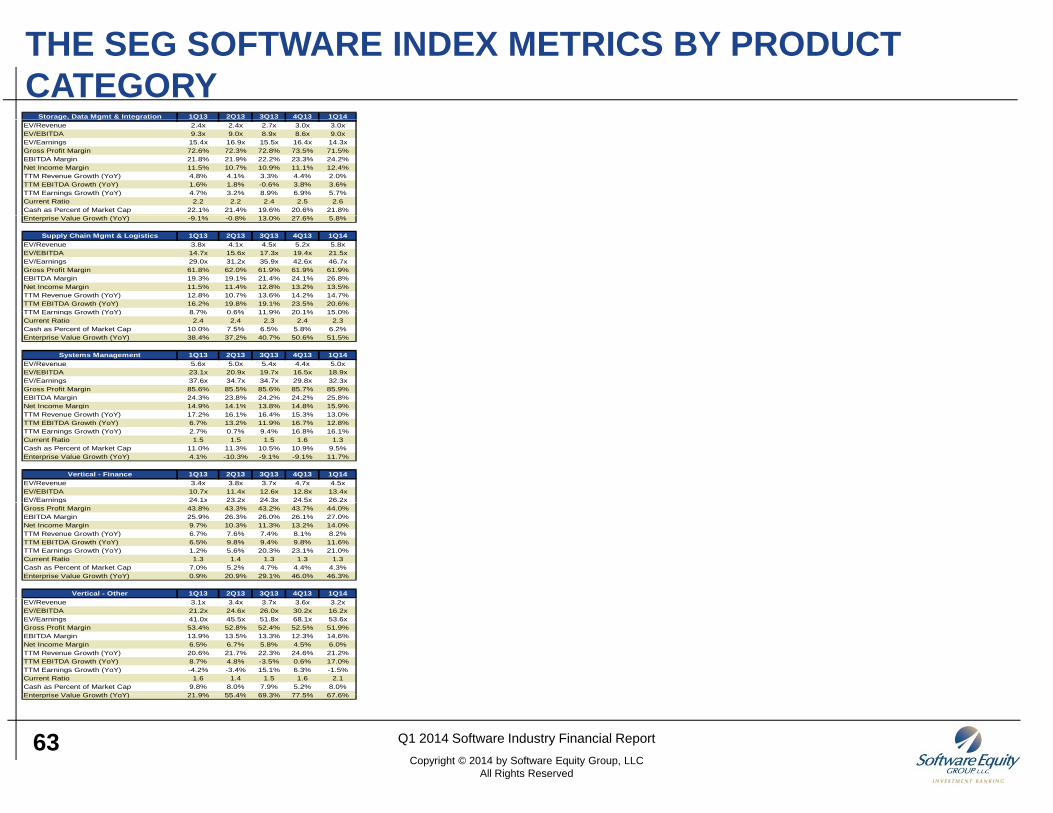
THE SEG SOFTWARE INDEX METRICS BY PRODUCT CATEGORY
Storage, Data Mgmt & Integration 1Q13 2Q13 3Q13 4Q13 1Q14g g gEV/Revenue 2.4x 2.4x 2.7x 3.0x 3.0xEV/EBITDA 9.3x 9.0x 8.9x 8.6x 9.0xEV/Earnings 15.4x 16.9x 15.5x 16.4x 14.3xGross Profit Margin 72.6% 72.3% 72.8% 73.5% 71.5%EBITDA Margin 21.8% 21.9% 22.2% 23.3% 24.2%Net Income Margin 11.5% 10.7% 10.9% 11.1% 12.4%TTM Revenue Growth (YoY) 4.8% 4.1% 3.3% 4.4% 2.0%TTM EBITDA Growth (YoY) 1.6% 1.8% -0.6% 3.8% 3.6%TTM Earnings Growth (YoY) 4.7% 3.2% 8.9% 6.9% 5.7%Current Ratio 2.2 2.2 2.4 2.5 2.6Cash as Percent of Market Cap 22.1% 21.4% 19.6% 20.6% 21.8%Enterprise Value Growth (YoY) -9.1% -0.8% 13.0% 27.6% 5.8%
Supply Chain Mgmt & Logistics 1Q13 2Q13 3Q13 4Q13 1Q14EV/Revenue 3.8x 4.1x 4.5x 5.2x 5.8xEV/EBITDA 14.7x 15.6x 17.3x 19.4x 21.5xEV/Earnings 29.0x 31.2x 35.9x 42.6x 46.7xGross Profit Margin 61.8% 62.0% 61.9% 61.9% 61.9%EBITDA Margin 19.3% 19.1% 21.4% 24.1% 26.8%Net Income Margin 11.5% 11.4% 12.8% 13.2% 13.5%TTM Revenue Growth (YoY) 12.8% 10.7% 13.6% 14.2% 14.7%TTM EBITDA Growth (YoY) 16.2% 19.8% 19.1% 23.5% 20.6%TTM Earnings Growth (YoY) 8 7% 0 6% 11 9% 20 1% 15 0%TTM Earnings Growth (YoY) 8.7% 0.6% 11.9% 20.1% 15.0%Current Ratio 2.4 2.4 2.3 2.4 2.3Cash as Percent of Market Cap 10.0% 7.5% 6.5% 5.8% 6.2%Enterprise Value Growth (YoY) 38.4% 37.2% 40.7% 50.6% 51.5%
Systems Management 1Q13 2Q13 3Q13 4Q13 1Q14EV/Revenue 5.6x 5.0x 5.4x 4.4x 5.0xEV/EBITDA 23.1x 20.9x 19.7x 16.5x 18.9xEV/Earnings 37.6x 34.7x 34.7x 29.8x 32.3xGross Profit Margin 85.6% 85.5% 85.6% 85.7% 85.9%EBITDA Margin 24.3% 23.8% 24.2% 24.2% 25.8%Net Income Margin 14 9% 14 1% 13 8% 14 8% 15 9%Net Income Margin 14.9% 14.1% 13.8% 14.8% 15.9%TTM Revenue Growth (YoY) 17.2% 16.1% 16.4% 15.3% 13.0%TTM EBITDA Growth (YoY) 6.7% 13.2% 11.9% 16.7% 12.8%TTM Earnings Growth (YoY) 2.7% 0.7% 9.4% 16.8% 16.1%Current Ratio 1.5 1.5 1.5 1.6 1.3Cash as Percent of Market Cap 11.0% 11.3% 10.5% 10.9% 9.5%Enterprise Value Growth (YoY) 4.1% -10.3% -9.1% -9.1% 11.7%
Vertical - Finance 1Q13 2Q13 3Q13 4Q13 1Q14EV/Revenue 3.4x 3.8x 3.7x 4.7x 4.5xEV/EBITDA 10.7x 11.4x 12.6x 12.8x 13.4xEV/Earnings 24.1x 23.2x 24.3x 24.5x 26.2xgGross Profit Margin 43.8% 43.3% 43.2% 43.7% 44.0%EBITDA Margin 25.9% 26.3% 26.0% 26.1% 27.0%Net Income Margin 9.7% 10.3% 11.3% 13.2% 14.0%TTM Revenue Growth (YoY) 6.7% 7.6% 7.4% 8.1% 8.2%TTM EBITDA Growth (YoY) 6.5% 9.8% 9.4% 9.8% 11.6%TTM Earnings Growth (YoY) 1.2% 5.6% 20.3% 23.1% 21.0%Current Ratio 1.3 1.4 1.3 1.3 1.3Cash as Percent of Market Cap 7.0% 5.2% 4.7% 4.4% 4.3%Enterprise Value Growth (YoY) 0.9% 20.9% 29.1% 46.0% 46.3%
Vertical - Other 1Q13 2Q13 3Q13 4Q13 1Q14EV/Revenue 3.1x 3.4x 3.7x 3.6x 3.2xEV/EBITDA 21.2x 24.6x 26.0x 30.2x 16.2xEV/Earnings 41.0x 45.5x 51.8x 68.1x 53.6xGross Profit Margin 53.4% 52.8% 52.4% 52.5% 51.9%EBITDA Margin 13.9% 13.5% 13.3% 12.3% 14.6%Net Income Margin 6.5% 6.7% 5.8% 4.5% 6.0%TTM Revenue Growth (YoY) 20.6% 21.7% 22.3% 24.6% 21.2%TTM EBITDA Growth (YoY) 8.7% 4.8% -3.5% 0.6% 17.0%TTM Earnings Growth (YoY) -4.2% -3.4% 15.1% 6.3% -1.5%Current Ratio 1.6 1.4 1.5 1.6 2.1Cash as Percent of Market Cap 9.8% 8.0% 7.9% 5.2% 8.0%Enterprise Value Growth (YoY) 21 9% 55 4% 69 3% 77 5% 67 6%
63 Q1 2014 Software Industry Financial ReportCopyright © 2014 by Software Equity Group, LLC
All Rights Reserved
Enterprise Value Growth (YoY) 21.9% 55.4% 69.3% 77.5% 67.6%
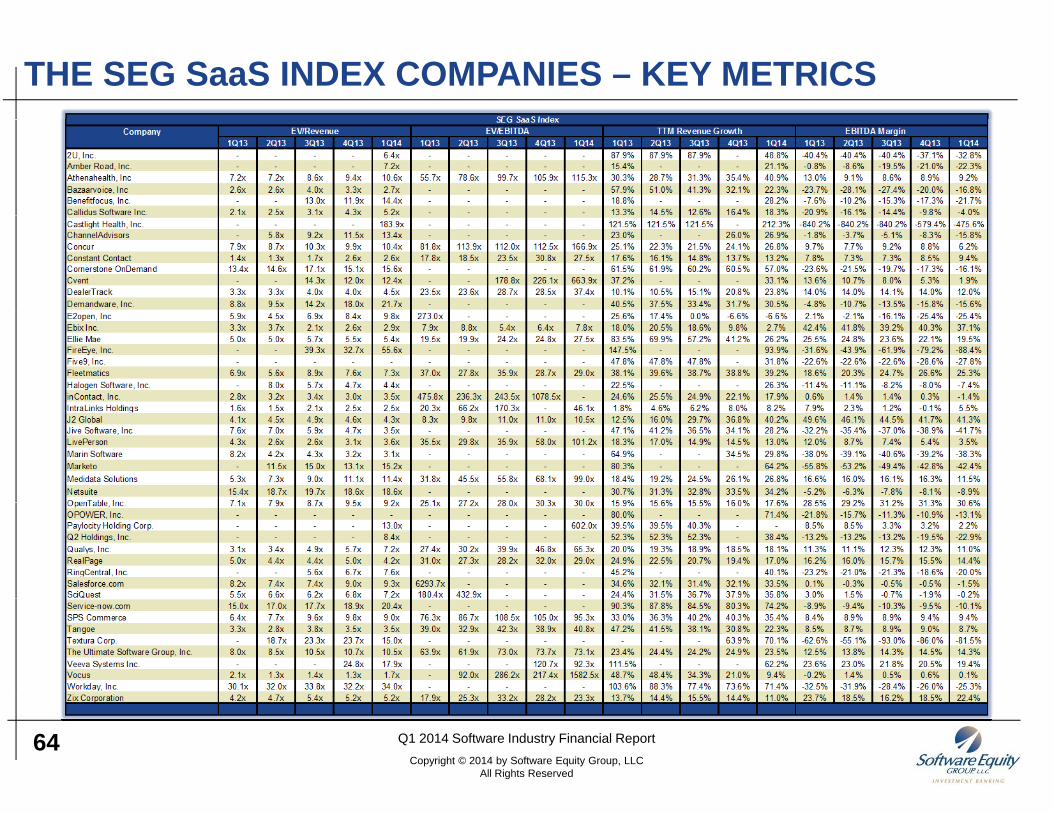
THE SEG SaaS INDEX COMPANIES – KEY METRICS
64 Q1 2014 Software Industry Financial ReportCopyright © 2014 by Software Equity Group, LLC
All Rights Reserved
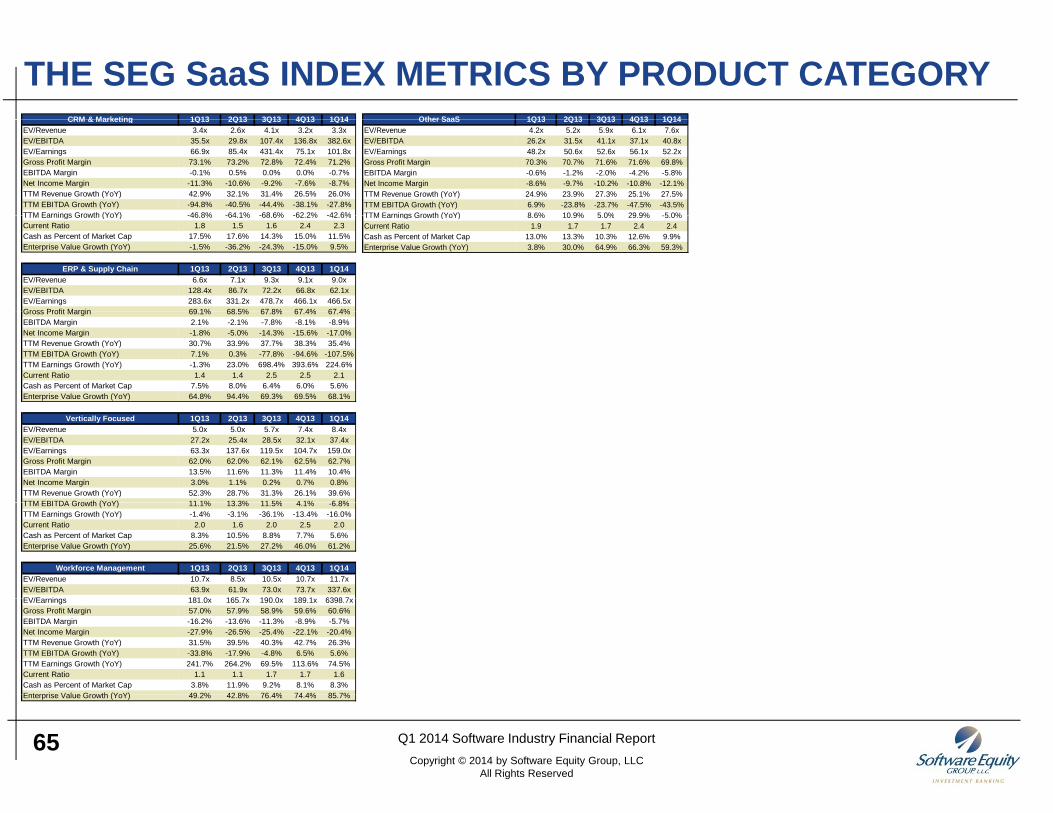
THE SEG SaaS INDEX METRICS BY PRODUCT CATEGORYCRM & Marketing 1Q13 2Q13 3Q13 4Q13 1Q14 Other SaaS 1Q13 2Q13 3Q13 4Q13 1Q14CRM & Marketing 1Q13 2Q13 3Q13 4Q13 1Q14
EV/Revenue 3.4x 2.6x 4.1x 3.2x 3.3xEV/EBITDA 35.5x 29.8x 107.4x 136.8x 382.6xEV/Earnings 66.9x 85.4x 431.4x 75.1x 101.8xGross Profit Margin 73.1% 73.2% 72.8% 72.4% 71.2%EBITDA Margin -0.1% 0.5% 0.0% 0.0% -0.7%Net Income Margin -11.3% -10.6% -9.2% -7.6% -8.7%TTM Revenue Growth (YoY) 42.9% 32.1% 31.4% 26.5% 26.0%TTM EBITDA Growth (YoY) -94.8% -40.5% -44.4% -38.1% -27.8%TTM Earnings Growth (YoY) -46 8% -64 1% -68 6% -62 2% -42 6%
Other SaaS 1Q13 2Q13 3Q13 4Q13 1Q14EV/Revenue 4.2x 5.2x 5.9x 6.1x 7.6xEV/EBITDA 26.2x 31.5x 41.1x 37.1x 40.8xEV/Earnings 48.2x 50.6x 52.6x 56.1x 52.2xGross Profit Margin 70.3% 70.7% 71.6% 71.6% 69.8%EBITDA Margin -0.6% -1.2% -2.0% -4.2% -5.8%Net Income Margin -8.6% -9.7% -10.2% -10.8% -12.1%TTM Revenue Growth (YoY) 24.9% 23.9% 27.3% 25.1% 27.5%TTM EBITDA Growth (YoY) 6.9% -23.8% -23.7% -47.5% -43.5%TTM Earnings Growth (YoY) 8 6% 10 9% 5 0% 29 9% 5 0%TTM Earnings Growth (YoY) -46.8% -64.1% -68.6% -62.2% -42.6%
Current Ratio 1.8 1.5 1.6 2.4 2.3Cash as Percent of Market Cap 17.5% 17.6% 14.3% 15.0% 11.5%Enterprise Value Growth (YoY) -1.5% -36.2% -24.3% -15.0% 9.5%
ERP & Supply Chain 1Q13 2Q13 3Q13 4Q13 1Q14EV/Revenue 6.6x 7.1x 9.3x 9.1x 9.0xEV/EBITDA 128.4x 86.7x 72.2x 66.8x 62.1xEV/Earnings 283.6x 331.2x 478.7x 466.1x 466.5xGross Profit Margin 69 1% 68 5% 67 8% 67 4% 67 4%
TTM Earnings Growth (YoY) 8.6% 10.9% 5.0% 29.9% -5.0%Current Ratio 1.9 1.7 1.7 2.4 2.4Cash as Percent of Market Cap 13.0% 13.3% 10.3% 12.6% 9.9%Enterprise Value Growth (YoY) 3.8% 30.0% 64.9% 66.3% 59.3%
Gross Profit Margin 69.1% 68.5% 67.8% 67.4% 67.4%EBITDA Margin 2.1% -2.1% -7.8% -8.1% -8.9%Net Income Margin -1.8% -5.0% -14.3% -15.6% -17.0%TTM Revenue Growth (YoY) 30.7% 33.9% 37.7% 38.3% 35.4%TTM EBITDA Growth (YoY) 7.1% 0.3% -77.8% -94.6% -107.5%TTM Earnings Growth (YoY) -1.3% 23.0% 698.4% 393.6% 224.6%Current Ratio 1.4 1.4 2.5 2.5 2.1Cash as Percent of Market Cap 7.5% 8.0% 6.4% 6.0% 5.6%Enterprise Value Growth (YoY) 64.8% 94.4% 69.3% 69.5% 68.1%
Vertically Focused 1Q13 2Q13 3Q13 4Q13 1Q14EV/Revenue 5.0x 5.0x 5.7x 7.4x 8.4xEV/EBITDA 27.2x 25.4x 28.5x 32.1x 37.4xEV/Earnings 63.3x 137.6x 119.5x 104.7x 159.0xGross Profit Margin 62.0% 62.0% 62.1% 62.5% 62.7%EBITDA Margin 13.5% 11.6% 11.3% 11.4% 10.4%Net Income Margin 3.0% 1.1% 0.2% 0.7% 0.8%TTM Revenue Growth (YoY) 52.3% 28.7% 31.3% 26.1% 39.6%TTM EBITDA Growth (YoY) 11 1% 13 3% 11 5% 4 1% 6 8%TTM EBITDA Growth (YoY) 11.1% 13.3% 11.5% 4.1% -6.8%TTM Earnings Growth (YoY) -1.4% -3.1% -36.1% -13.4% -16.0%Current Ratio 2.0 1.6 2.0 2.5 2.0Cash as Percent of Market Cap 8.3% 10.5% 8.8% 7.7% 5.6%Enterprise Value Growth (YoY) 25.6% 21.5% 27.2% 46.0% 61.2%
Workforce Management 1Q13 2Q13 3Q13 4Q13 1Q14EV/Revenue 10.7x 8.5x 10.5x 10.7x 11.7xEV/EBITDA 63.9x 61.9x 73.0x 73.7x 337.6xEV/E i 181 0 165 7 190 0 189 1 6398 7EV/Earnings 181.0x 165.7x 190.0x 189.1x 6398.7xGross Profit Margin 57.0% 57.9% 58.9% 59.6% 60.6%EBITDA Margin -16.2% -13.6% -11.3% -8.9% -5.7%Net Income Margin -27.9% -26.5% -25.4% -22.1% -20.4%TTM Revenue Growth (YoY) 31.5% 39.5% 40.3% 42.7% 26.3%TTM EBITDA Growth (YoY) -33.8% -17.9% -4.8% 6.5% 5.6%TTM Earnings Growth (YoY) 241.7% 264.2% 69.5% 113.6% 74.5%Current Ratio 1.1 1.1 1.7 1.7 1.6Cash as Percent of Market Cap 3.8% 11.9% 9.2% 8.1% 8.3%Enterprise Value Growth (YoY) 49 2% 42 8% 76 4% 74 4% 85 7%
65 Q1 2014 Software Industry Financial ReportCopyright © 2014 by Software Equity Group, LLC
All Rights Reserved
Enterprise Value Growth (YoY) 49.2% 42.8% 76.4% 74.4% 85.7%
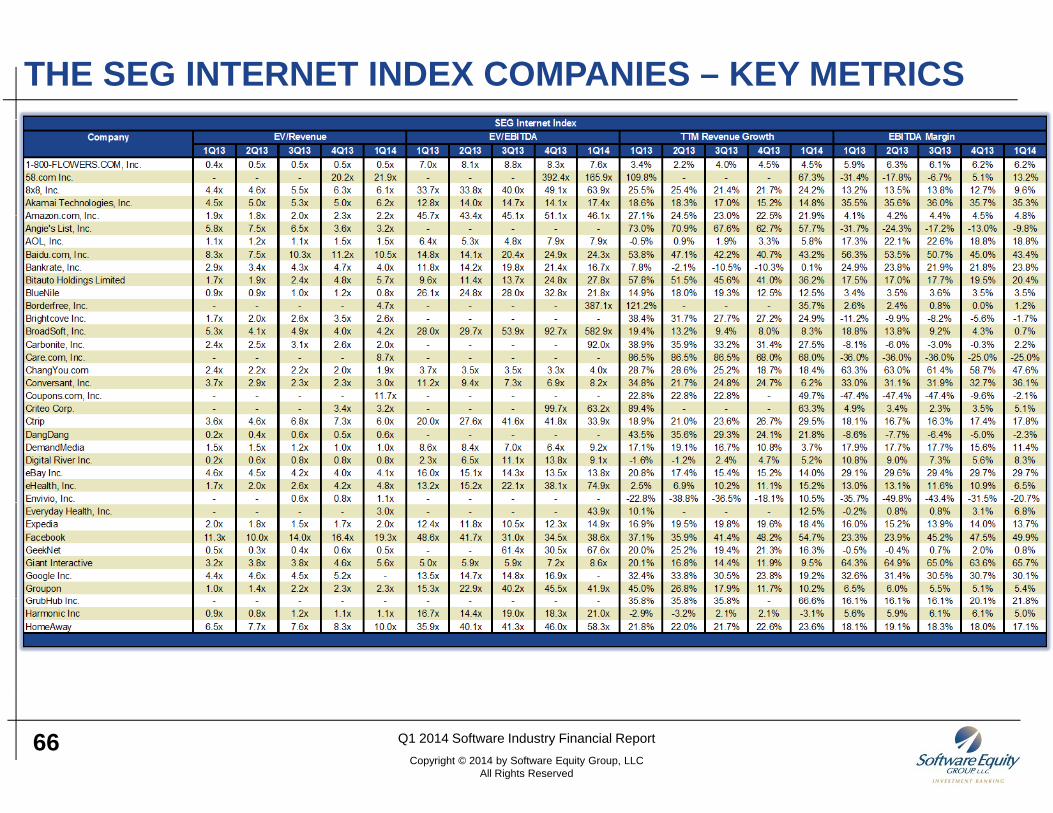
THE SEG INTERNET INDEX COMPANIES – KEY METRICS
66 Q1 2014 Software Industry Financial ReportCopyright © 2014 by Software Equity Group, LLC
All Rights Reserved
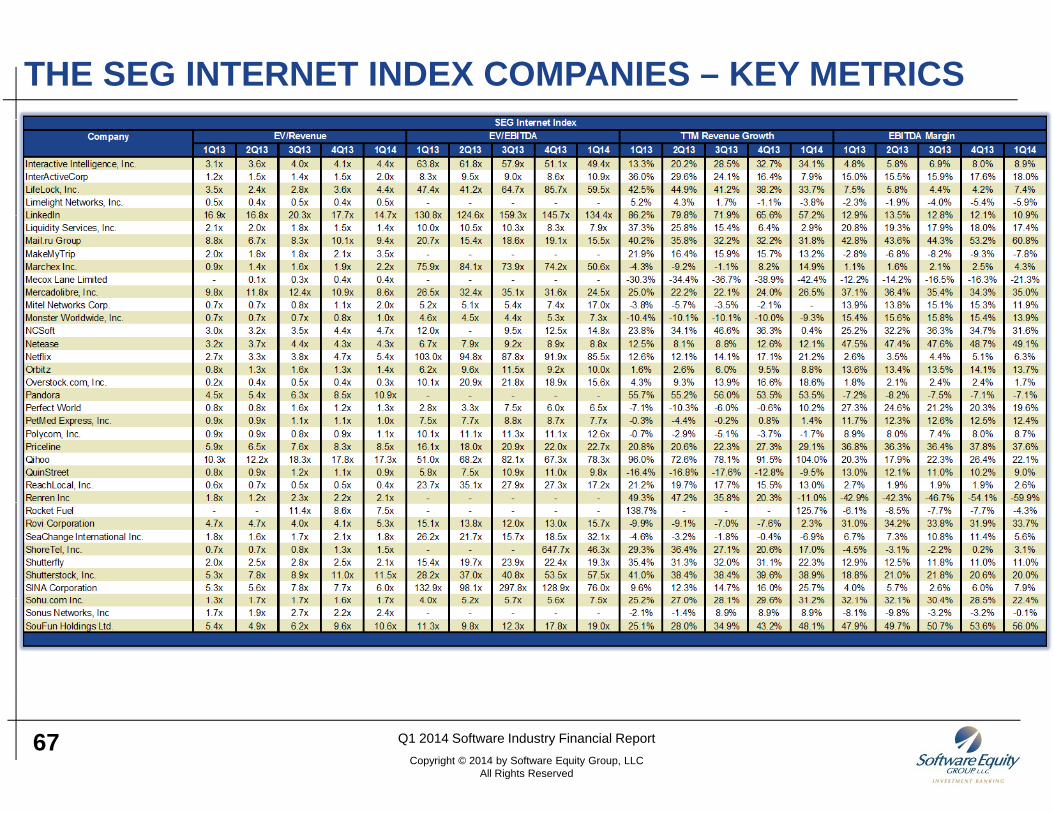
THE SEG INTERNET INDEX COMPANIES – KEY METRICS
67 Q1 2014 Software Industry Financial ReportCopyright © 2014 by Software Equity Group, LLC
All Rights Reserved
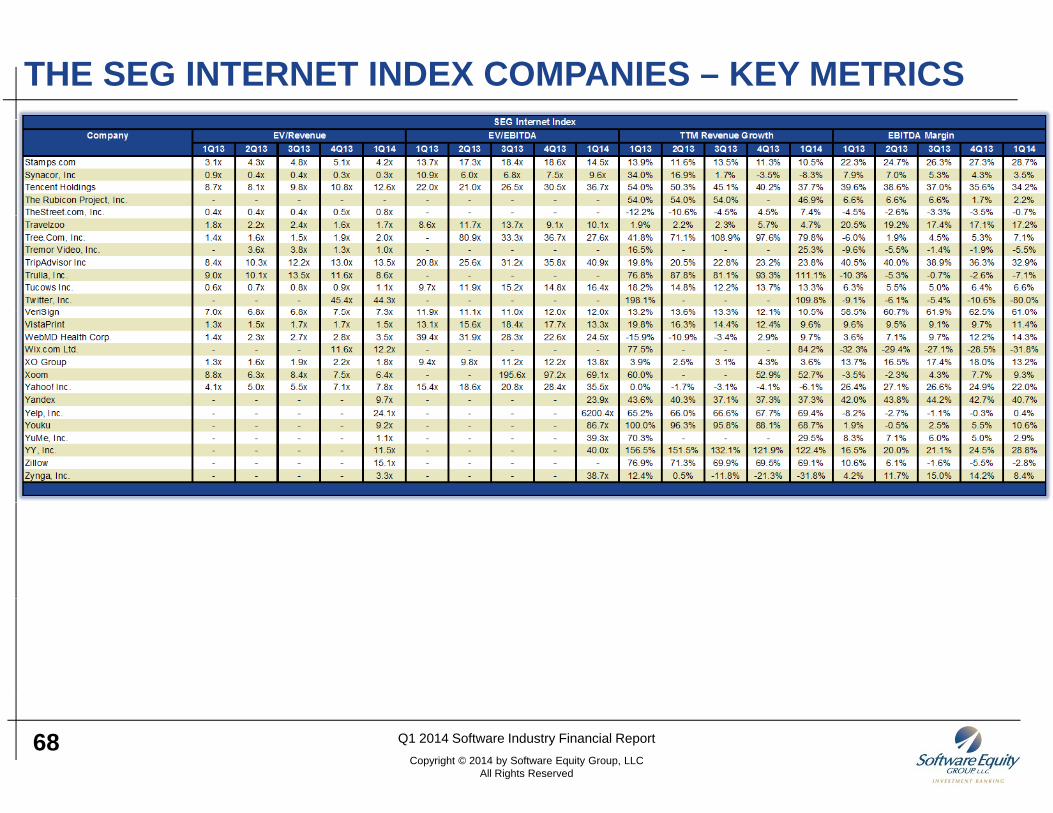
THE SEG INTERNET INDEX COMPANIES – KEY METRICS
68 Q1 2014 Software Industry Financial ReportCopyright © 2014 by Software Equity Group, LLC
All Rights Reserved
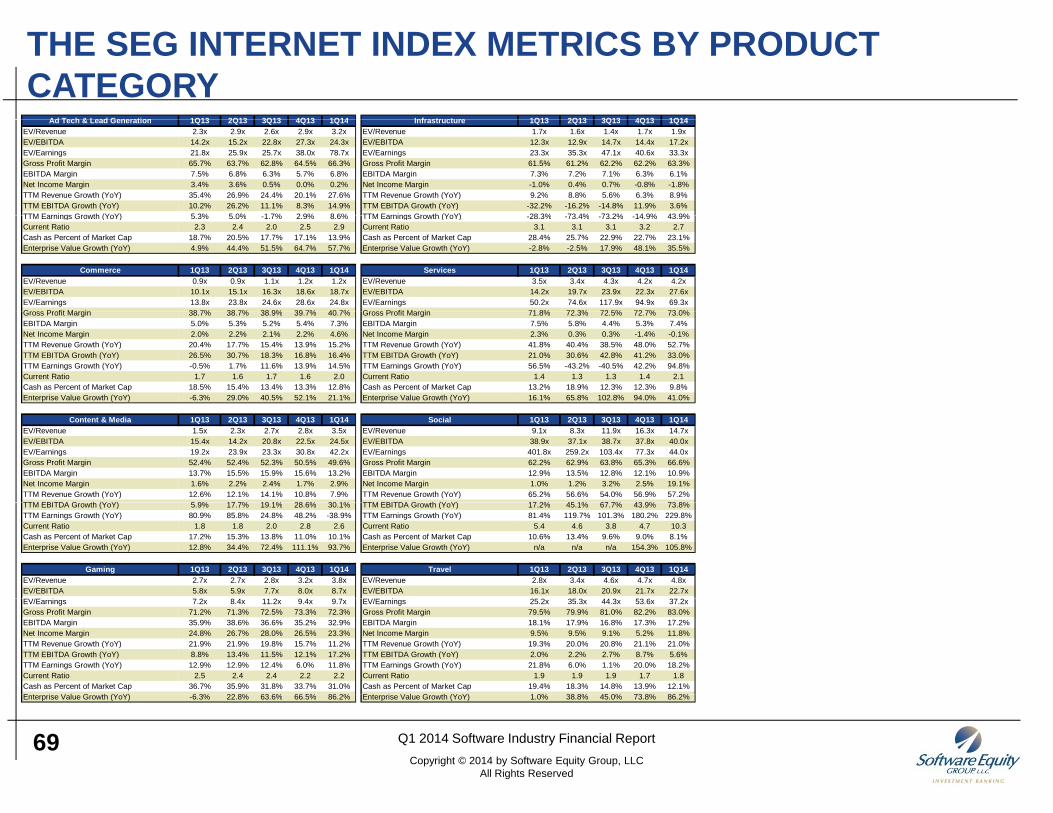
THE SEG INTERNET INDEX METRICS BY PRODUCT CATEGORY
Ad Tech & Lead Generation 1Q13 2Q13 3Q13 4Q13 1Q14 Infrastructure 1Q13 2Q13 3Q13 4Q13 1Q14Ad Tech & Lead Generation 1Q13 2Q13 3Q13 4Q13 1Q14EV/Revenue 2.3x 2.9x 2.6x 2.9x 3.2xEV/EBITDA 14.2x 15.2x 22.8x 27.3x 24.3xEV/Earnings 21.8x 25.9x 25.7x 38.0x 78.7xGross Profit Margin 65.7% 63.7% 62.8% 64.5% 66.3%EBITDA Margin 7.5% 6.8% 6.3% 5.7% 6.8%Net Income Margin 3.4% 3.6% 0.5% 0.0% 0.2%TTM Revenue Growth (YoY) 35.4% 26.9% 24.4% 20.1% 27.6%TTM EBITDA Growth (YoY) 10.2% 26.2% 11.1% 8.3% 14.9%TTM Earnings Growth (YoY) 5 3% 5 0% 1 7% 2 9% 8 6%
Infrastructure 1Q13 2Q13 3Q13 4Q13 1Q14EV/Revenue 1.7x 1.6x 1.4x 1.7x 1.9xEV/EBITDA 12.3x 12.9x 14.7x 14.4x 17.2xEV/Earnings 23.3x 35.3x 47.1x 40.6x 33.3xGross Profit Margin 61.5% 61.2% 62.2% 62.2% 63.3%EBITDA Margin 7.3% 7.2% 7.1% 6.3% 6.1%Net Income Margin -1.0% 0.4% 0.7% -0.8% -1.8%TTM Revenue Growth (YoY) 9.2% 8.8% 5.6% 6.3% 8.9%TTM EBITDA Growth (YoY) -32.2% -16.2% -14.8% 11.9% 3.6%TTM Earnings Growth (YoY) 28 3% 73 4% 73 2% 14 9% 43 9%TTM Earnings Growth (YoY) 5.3% 5.0% -1.7% 2.9% 8.6%
Current Ratio 2.3 2.4 2.0 2.5 2.9Cash as Percent of Market Cap 18.7% 20.5% 17.7% 17.1% 13.9%Enterprise Value Growth (YoY) 4.9% 44.4% 51.5% 64.7% 57.7%
Commerce 1Q13 2Q13 3Q13 4Q13 1Q14EV/Revenue 0.9x 0.9x 1.1x 1.2x 1.2xEV/EBITDA 10.1x 15.1x 16.3x 18.6x 18.7xEV/Earnings 13.8x 23.8x 24.6x 28.6x 24.8xG P fit M i 38 7% 38 7% 38 9% 39 7% 40 7%
TTM Earnings Growth (YoY) -28.3% -73.4% -73.2% -14.9% 43.9%Current Ratio 3.1 3.1 3.1 3.2 2.7Cash as Percent of Market Cap 28.4% 25.7% 22.9% 22.7% 23.1%Enterprise Value Growth (YoY) -2.8% -2.5% 17.9% 48.1% 35.5%
Services 1Q13 2Q13 3Q13 4Q13 1Q14EV/Revenue 3.5x 3.4x 4.3x 4.2x 4.2xEV/EBITDA 14.2x 19.7x 23.9x 22.3x 27.6xEV/Earnings 50.2x 74.6x 117.9x 94.9x 69.3xG P fit M i 71 8% 72 3% 72 5% 72 7% 73 0%Gross Profit Margin 38.7% 38.7% 38.9% 39.7% 40.7%
EBITDA Margin 5.0% 5.3% 5.2% 5.4% 7.3%Net Income Margin 2.0% 2.2% 2.1% 2.2% 4.6%TTM Revenue Growth (YoY) 20.4% 17.7% 15.4% 13.9% 15.2%TTM EBITDA Growth (YoY) 26.5% 30.7% 18.3% 16.8% 16.4%TTM Earnings Growth (YoY) -0.5% 1.7% 11.6% 13.9% 14.5%Current Ratio 1.7 1.6 1.7 1.6 2.0Cash as Percent of Market Cap 18.5% 15.4% 13.4% 13.3% 12.8%Enterprise Value Growth (YoY) -6.3% 29.0% 40.5% 52.1% 21.1%
Gross Profit Margin 71.8% 72.3% 72.5% 72.7% 73.0%EBITDA Margin 7.5% 5.8% 4.4% 5.3% 7.4%Net Income Margin 2.3% 0.3% 0.3% -1.4% -0.1%TTM Revenue Growth (YoY) 41.8% 40.4% 38.5% 48.0% 52.7%TTM EBITDA Growth (YoY) 21.0% 30.6% 42.8% 41.2% 33.0%TTM Earnings Growth (YoY) 56.5% -43.2% -40.5% 42.2% 94.8%Current Ratio 1.4 1.3 1.3 1.4 2.1Cash as Percent of Market Cap 13.2% 18.9% 12.3% 12.3% 9.8%Enterprise Value Growth (YoY) 16.1% 65.8% 102.8% 94.0% 41.0%
Content & Media 1Q13 2Q13 3Q13 4Q13 1Q14EV/Revenue 1.5x 2.3x 2.7x 2.8x 3.5xEV/EBITDA 15.4x 14.2x 20.8x 22.5x 24.5xEV/Earnings 19.2x 23.9x 23.3x 30.8x 42.2xGross Profit Margin 52.4% 52.4% 52.3% 50.5% 49.6%EBITDA Margin 13.7% 15.5% 15.9% 15.6% 13.2%Net Income Margin 1.6% 2.2% 2.4% 1.7% 2.9%TTM Revenue Growth (YoY) 12.6% 12.1% 14.1% 10.8% 7.9%TTM EBITDA G th (Y Y) 5 9% 17 7% 19 1% 28 6% 30 1%
Social 1Q13 2Q13 3Q13 4Q13 1Q14EV/Revenue 9.1x 8.3x 11.9x 16.3x 14.7xEV/EBITDA 38.9x 37.1x 38.7x 37.8x 40.0xEV/Earnings 401.8x 259.2x 103.4x 77.3x 44.0xGross Profit Margin 62.2% 62.9% 63.8% 65.3% 66.6%EBITDA Margin 12.9% 13.5% 12.8% 12.1% 10.9%Net Income Margin 1.0% 1.2% 3.2% 2.5% 19.1%TTM Revenue Growth (YoY) 65.2% 56.6% 54.0% 56.9% 57.2%TTM EBITDA G th (Y Y) 17 2% 45 1% 67 7% 43 9% 73 8%TTM EBITDA Growth (YoY) 5.9% 17.7% 19.1% 28.6% 30.1%
TTM Earnings Growth (YoY) 80.9% 85.8% 24.8% 48.2% -38.9%Current Ratio 1.8 1.8 2.0 2.8 2.6Cash as Percent of Market Cap 17.2% 15.3% 13.8% 11.0% 10.1%Enterprise Value Growth (YoY) 12.8% 34.4% 72.4% 111.1% 93.7%
Gaming 1Q13 2Q13 3Q13 4Q13 1Q14EV/Revenue 2.7x 2.7x 2.8x 3.2x 3.8xEV/EBITDA 5.8x 5.9x 7.7x 8.0x 8.7x
/
TTM EBITDA Growth (YoY) 17.2% 45.1% 67.7% 43.9% 73.8%TTM Earnings Growth (YoY) 81.4% 119.7% 101.3% 180.2% 229.8%Current Ratio 5.4 4.6 3.8 4.7 10.3Cash as Percent of Market Cap 10.6% 13.4% 9.6% 9.0% 8.1%Enterprise Value Growth (YoY) n/a n/a n/a 154.3% 105.8%
Travel 1Q13 2Q13 3Q13 4Q13 1Q14EV/Revenue 2.8x 3.4x 4.6x 4.7x 4.8xEV/EBITDA 16.1x 18.0x 20.9x 21.7x 22.7x
/EV/Earnings 7.2x 8.4x 11.2x 9.4x 9.7xGross Profit Margin 71.2% 71.3% 72.5% 73.3% 72.3%EBITDA Margin 35.9% 38.6% 36.6% 35.2% 32.9%Net Income Margin 24.8% 26.7% 28.0% 26.5% 23.3%TTM Revenue Growth (YoY) 21.9% 21.9% 19.8% 15.7% 11.2%TTM EBITDA Growth (YoY) 8.8% 13.4% 11.5% 12.1% 17.2%TTM Earnings Growth (YoY) 12.9% 12.9% 12.4% 6.0% 11.8%Current Ratio 2.5 2.4 2.4 2.2 2.2Cash as Percent of Market Cap 36.7% 35.9% 31.8% 33.7% 31.0%E t i V l G th (Y Y) 6 3% 22 8% 63 6% 66 5% 86 2%
EV/Earnings 25.2x 35.3x 44.3x 53.6x 37.2xGross Profit Margin 79.5% 79.9% 81.0% 82.2% 83.0%EBITDA Margin 18.1% 17.9% 16.8% 17.3% 17.2%Net Income Margin 9.5% 9.5% 9.1% 5.2% 11.8%TTM Revenue Growth (YoY) 19.3% 20.0% 20.8% 21.1% 21.0%TTM EBITDA Growth (YoY) 2.0% 2.2% 2.7% 8.7% 5.6%TTM Earnings Growth (YoY) 21.8% 6.0% 1.1% 20.0% 18.2%Current Ratio 1.9 1.9 1.9 1.7 1.8Cash as Percent of Market Cap 19.4% 18.3% 14.8% 13.9% 12.1%E t i V l G th (Y Y) 1 0% 38 8% 45 0% 73 8% 86 2%
69 Q1 2014 Software Industry Financial ReportCopyright © 2014 by Software Equity Group, LLC
All Rights Reserved
Enterprise Value Growth (YoY) -6.3% 22.8% 63.6% 66.5% 86.2% Enterprise Value Growth (YoY) 1.0% 38.8% 45.0% 73.8% 86.2%
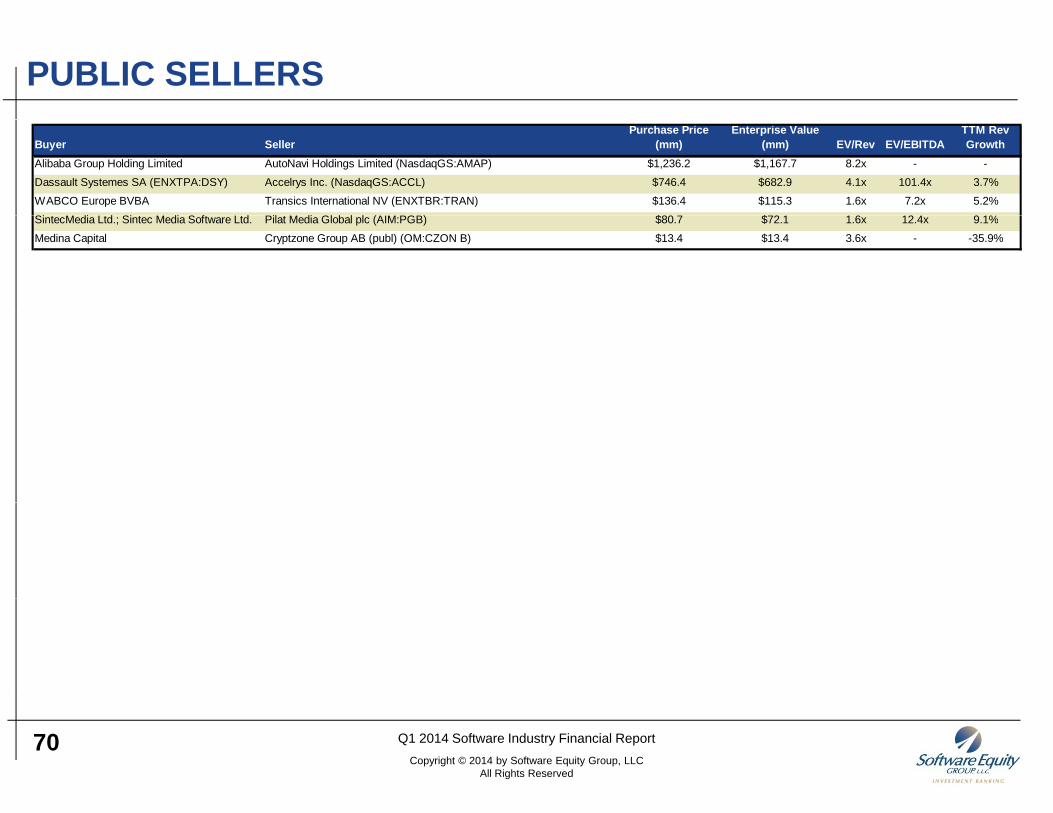
PUBLIC SELLERS
Buyer SellerPurchase Price
(mm)Enterprise Value
(mm) EV/Rev EV/EBITDATTM Rev Growth
Alibaba Group Holding Limited AutoNavi Holdings Limited (NasdaqGS:AMAP) $1,236.2 $1,167.7 8.2x - -
Dassault Systemes SA (ENXTPA:DSY) Accelrys Inc. (NasdaqGS:ACCL) $746.4 $682.9 4.1x 101.4x 3.7%
WABCO Europe BVBA Transics International NV (ENXTBR:TRAN) $136.4 $115.3 1.6x 7.2x 5.2%
Si t M di Ltd Si t M di S ft Ltd Pil t M di Gl b l l (AIM PGB) $80 7 $72 1 1 6 12 4 9 1%SintecMedia Ltd.; Sintec Media Software Ltd. Pilat Media Global plc (AIM:PGB) $80.7 $72.1 1.6x 12.4x 9.1%
Medina Capital Cryptzone Group AB (publ) (OM:CZON B) $13.4 $13.4 3.6x - -35.9%
70 Q1 2014 Software Industry Financial ReportCopyright © 2014 by Software Equity Group, LLC
All Rights Reserved
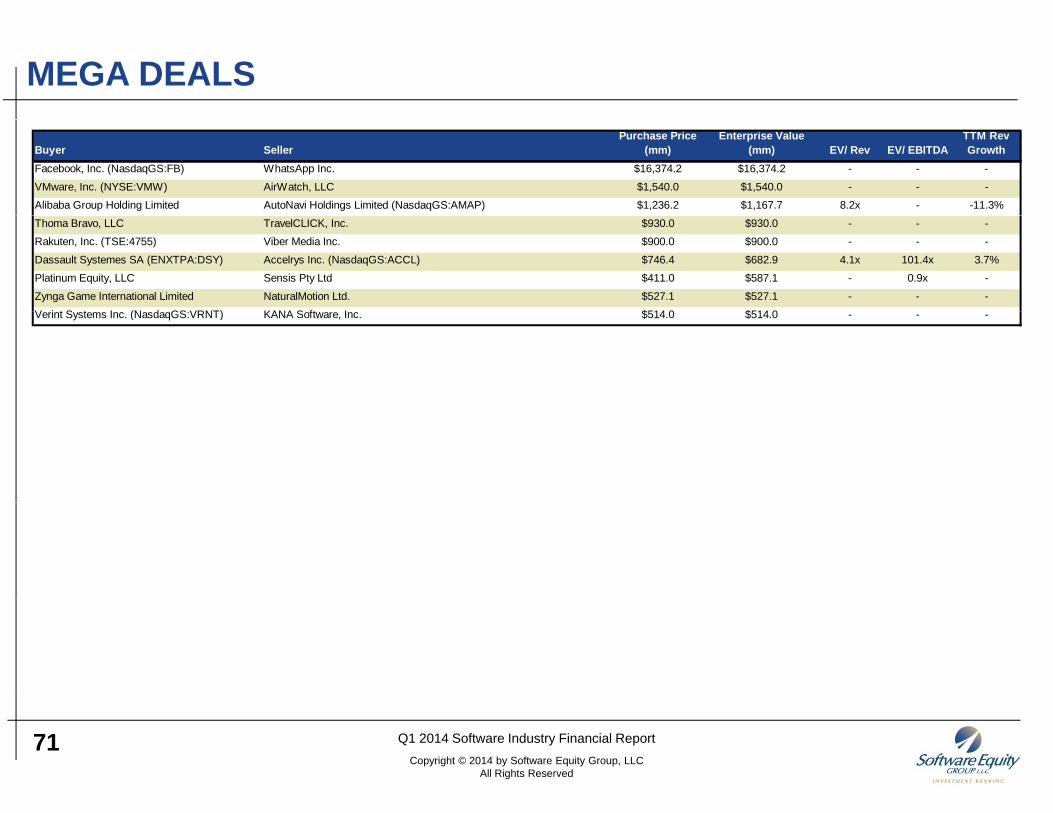
MEGA DEALS
Buyer SellerPurchase Price
(mm)Enterprise Value
(mm) EV/ Rev EV/ EBITDATTM Rev Growth
Facebook, Inc. (NasdaqGS:FB) WhatsApp Inc. $16,374.2 $16,374.2 - - -
VMware, Inc. (NYSE:VMW) AirWatch, LLC $1,540.0 $1,540.0 - - -Alibaba Group Holding Limited AutoNavi Holdings Limited (NasdaqGS:AMAP) $1,236.2 $1,167.7 8.2x - -11.3%
Thoma Bravo, LLC TravelCLICK, Inc. $930.0 $930.0 - - -Rakuten, Inc. (TSE:4755) Viber Media Inc. $900.0 $900.0 - - -
Dassault Systemes SA (ENXTPA:DSY) Accelrys Inc. (NasdaqGS:ACCL) $746.4 $682.9 4.1x 101.4x 3.7%Platinum Equity, LLC Sensis Pty Ltd $411.0 $587.1 - 0.9x -
Zynga Game International Limited NaturalMotion Ltd. $527.1 $527.1 - - -V i t S t I (N d GS VRNT) KANA S ft I $514 0 $514 0Verint Systems Inc. (NasdaqGS:VRNT) KANA Software, Inc. $514.0 $514.0 - - -
71 Q1 2014 Software Industry Financial ReportCopyright © 2014 by Software Equity Group, LLC
All Rights Reserved
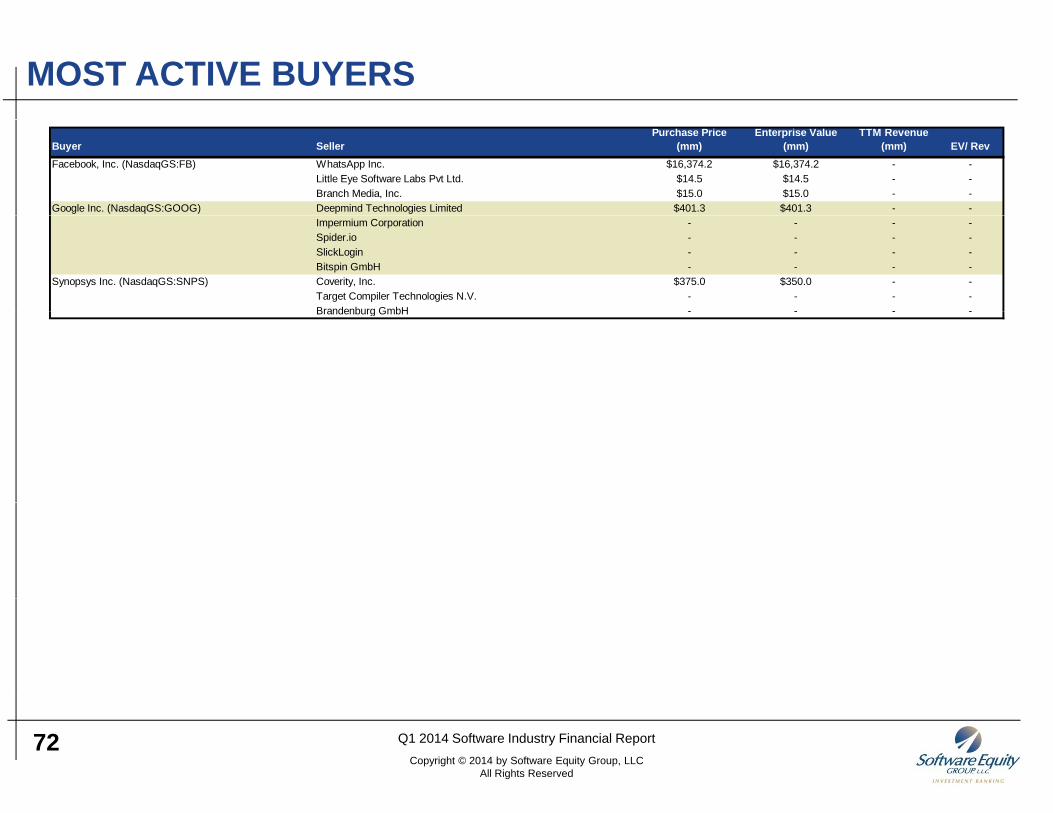
MOST ACTIVE BUYERS
Buyer SellerPurchase Price
(mm)Enterprise Value
(mm)TTM Revenue
(mm) EV/ RevFacebook, Inc. (NasdaqGS:FB) WhatsApp Inc. $16,374.2 $16,374.2 - -
Little Eye Software Labs Pvt Ltd. $14.5 $14.5 - -Branch Media, Inc. $15.0 $15.0 - -
Google Inc. (NasdaqGS:GOOG) Deepmind Technologies Limited $401.3 $401.3 - -Impermium Corporation - - - -Spider.io - - - -SlickLogin - - - -Bitspin GmbH - - - -
Synopsys Inc. (NasdaqGS:SNPS) Coverity, Inc. $375.0 $350.0 - -Target Compiler Technologies N.V. - - - -Brandenburg GmbH - - - -Brandenburg GmbH - - - -
72 Q1 2014 Software Industry Financial ReportCopyright © 2014 by Software Equity Group, LLC
All Rights Reserved
Software Equity Group is an investment bank and M&A advisory serving the software and technology sectors. Founded in 1992, our firm has guided and
ABOUT SOFTWARE EQUITY GROUPq y p y g gy , g
advised companies on five continents, including privately-held software and technology companies in the United States, Canada, Europe, Asia Pacific, Africa and Israel. We have represented public companies listed on the NASDAQ, NYSE, American, Toronto, London and Euronext exchanges. Software Equity Group also advises several of the world's leading private equity firms. We are ranked among the top ten investment banks worldwide for application software mergers and acquisitions.
Our value proposition is unique and compelling We are skilled and accomplished investment bankers with extraordinary software internet and technologyOur value proposition is unique and compelling. We are skilled and accomplished investment bankers with extraordinary software, internet and technology domain expertise. Our industry knowledge and experience span virtually every software product category, technology, market and delivery model, including Software-as-a-Service (Saas), software on-demand and perpetual license. We have profound understanding of software company finances, operations and valuation. We monitor and analyze every publicly disclosed software M&A transaction, as well as the market, economy and technology trends that impact these deals. We're formidable negotiators and savvy dealmakers who facilitate strategic combinations that enhance shareholder value.
P h t i t t th l ti hi ' b ilt d th i d t t ti j S ft E it G i k d t d b bli lPerhaps most important are the relationships we've built and the industry reputation we enjoy. Software Equity Group is known and respected by publicly traded and privately owned software and technology companies worldwide, and we speak with them often. Our Quarterly and Annual Software Industry Equity Reports are read and relied upon by more than thousands of industry executives, entrepreneurs and equity investors in sixty-one countries, and we have been quoted widely in such leading publications as The Wall Street Journal, Barrons, Information Week, The Daily Deal, The Street.com, U.S. News & World Report, Reuters, Mergers & Acquisitions, USA Today, Arizona Republic, Detroit Free Press, Entrepreneur Magazine, Softletter, Software Success, Software CEO Online and Software Business Magazine. g
To keep your finger on the pulse of the software equity markets, subscribe to our Annual and Quarterly Research Reports.
Software Equity Group is an investment bank and M&A advisory serving the software and technology sectors. For a confidential consultation without obligation, [email protected] , 2800-509) 858Beible, Director, Business Development (Kris please contact
CONTACT INFORMATION:
Software Equity Group, L.L.C.12220 El Camino Real, Suite 320San Diego, CA 92130www softwareequity comwww.softwareequity.comp: (858) 509-2800
The information contained in this Report is obtained from sources we believe to be reliable, but no representation or guarantee is made about the accuracy or completeness of such information, or the opinions expressed herein. Nothing in this Report is intended to be a recommendation of a specific security or company or intended to constitute an offer to buy or sell, or the solicitation of an offer to buy or sell, any security. Software Equity Group LLC may have an interest in one or more of the securities or companies discussed herein. Financial data provided by Capital IQ.
73 Q1 2014 Software Industry Financial ReportCopyright © 2014 by Software Equity Group, LLC
All Rights Reserved
This Report may not be reproduced in whole or in part without the expressed prior written authorization of Software Equity Group, L.L.C.Software Equity Group registers each Report with the U.S. Copyright Office and vigorously enforces its intellectual property rights.