Embed Size (px)
Citation preview
Anton Eberhard and Raine Naude
Review, Lessons Learned & Proposals to Reduce Transaction Costs
THE SOUTH AFRICAN RENEWABLE ENERGY IPP PROCUREMENT PROGRAMME

This work has been made possible by the generous support of the Royal Norwegian Embassy in South Africa. We would also like to acknowledge the support of the British High Commission's Prosperity Fund during the initial stages of this research.
i | Page
Abstract
The South African Renewable Energy Independent Power Producer Procurement Programme
(REIPPPPP) is a competitive tender process that was designed to facilitate private sector
investment into grid-connected renewable energy (RE) generation in South Africa. Part A of this
report serves as a comprehensive handbook of the REIPPPP's design, implementation and
outcomes to date.
As a result of this programme, South Africa has achieved more investment via Independent Power
Producers (IPPs) in four years than in the rest of Sub-Saharan Africa over the past two decades.
Bid tariffs have fallen sharply over the course of the programme and most recently awarded
projects are now amongst the lowest priced grid-connected RE projects in the world. Now
considered one of the top ten RE programmes globally, the REIPPPP offers valuable lessons for
other developing countries in terms of designing and running competitive tenders for grid-
connected renewable energy IPPs. Part B of this report extracts these lessons, bearing in mind that
not all are replicable in the different contexts of various African countries.
Despite the REIPPPP's unquestionable success, a much-discussed shortcoming has been the
associated high transaction costs for participating bidders, where this encompasses all costs
incurred in bid development and up to commercial operation date. While RE competitive tenders
are typically more complex and thus more expensive for IPPs than the common alternative, feed-
in tariff programmes, the REIPPPP imposed particularly stringent requirements on bidders.
Transaction costs contribute far less to bid tariff, and ultimately to the host government/ buyer's
cost of purchasing this power, than factors such as the project's cost of equipment and the cost of
capital (financing). However, they are more heavily influenced by tender design, and a
competitive tender that reduces this burden to bidders is beneficial both in terms of stimulating
competition (by reducing the irrecoverable loss in the event of an unsuccessful bid) and shaving
bid tariffs. An improved perception of the risk-return trade-off is particularly important in African
countries that have a less developed grid than South Africa and would tender much smaller
projects. Part C provides design proposals for reducing these transaction costs.
ii | Page
Table of Contents
Abstract ............................................................................................................................................................. i Table of Contents ............................................................................................................................................. ii Acronyms ........................................................................................................................................................ iv List of Figures .................................................................................................................................................. v List of Tables .................................................................................................................................................. vi PART A: Review of the South African Renewable Energy Independent Power Producer Programme (REIPPPP) ........................................................................................................................................................ 1
Section 1: Overview of the REIPPPP .......................................................................................................... 1 Section 2: Procurement Design and Requirements ...................................................................................... 3
2.1. General requirements (Part A of the RFP) ........................................................................................ 5 2.2. Qualification Criteria (Part B of the RFP) ...................................................................................... 10 2.3. Evaluation Criteria (Part C of the RFP) .......................................................................................... 23 2.4. Legal Contracts ............................................................................................................................... 26
Section 3: Outcomes of the REIPPPP, Bid Windows 1 to 4 ..................................................................... 27 3.1. Capacity and Project Investment Outcomes ................................................................................... 27 3.2 Energy Price Outcomes .................................................................................................................... 30 3.3 Investment outcomes ....................................................................................................................... 33 3.4. Economic Development Outcomes ................................................................................................. 38
Section 4: The Small Projects IPP Procurement Programme .................................................................... 42 4.1. Overview of the Small Projects IPP Procurement Programme ....................................................... 42 4.2. Key features of the SP-IPPPP ......................................................................................................... 44 4.3. Outcomes of the SP-IPPPP ............................................................................................................. 53
PART B: Lessons learned from the South African REIPPPP ....................................................................... 55 Section 1: Overview of the REIPPPP’s success to date ............................................................................. 55 Section 2: Key Lessons from the REIPPPP's success ................................................................................ 56
2.1. Enabling policy and regulatory environment .................................................................................. 56 2.2. Mandated, authorized and coordinated leadership .......................................................................... 62 2.3. Adequate resources for hiring experienced transaction advisors .................................................... 67 2.4. Auction Design Built on International Best Practice ...................................................................... 69 2.5. High quality, bankable documentation and contracts .................................................................... 78 2.6. Fairness, transparency and trust building with the private sector ................................................... 89 2.7. Capital markets that provide adequate and competitively priced funding ...................................... 90 2.8. Maintain credibility of the procurement programme ...................................................................... 91 2.9. Grid connection ............................................................................................................................... 91
iii | Page
Part C: Reducing Transaction Costs .............................................................................................................. 93 Section 1: Introduction ............................................................................................................................... 93
1.1. Capital Costs ................................................................................................................................... 94 1.2. Cost of Capital (Discount Rate) ...................................................................................................... 97 1.3. Operations & Maintenance Costs ................................................................................................... 98 1.4. Capacity factor ................................................................................................................................ 98
Section 2: Tender Design and Reducing Transaction Costs ...................................................................... 99 Conclusion ................................................................................................................................................... 107 Appendices ................................................................................................................................................... 108
Appendix 1: Project Outcomes by Geography and Technology .............................................................. 108 Appendix 2: Detailed Economic Development Criteria and Associated Outcomes ................................ 109
2.1. Job Creation .................................................................................................................................. 109 2.2. Local Content ................................................................................................................................ 111 2.3. Ownership ..................................................................................................................................... 114 2.4. Management Control .................................................................................................................... 117 2.5. Preferential Procurement ............................................................................................................... 117 2.6. Enterprise Development ................................................................................................................ 118 2.7. Socio-Economic Development ..................................................................................................... 119
Appendix 3: Geographical spread of and additional details on SP-IPPPP awarded projects .................. 121 Appendix 4: PPA Key Clauses ................................................................................................................ 122
iv | Page
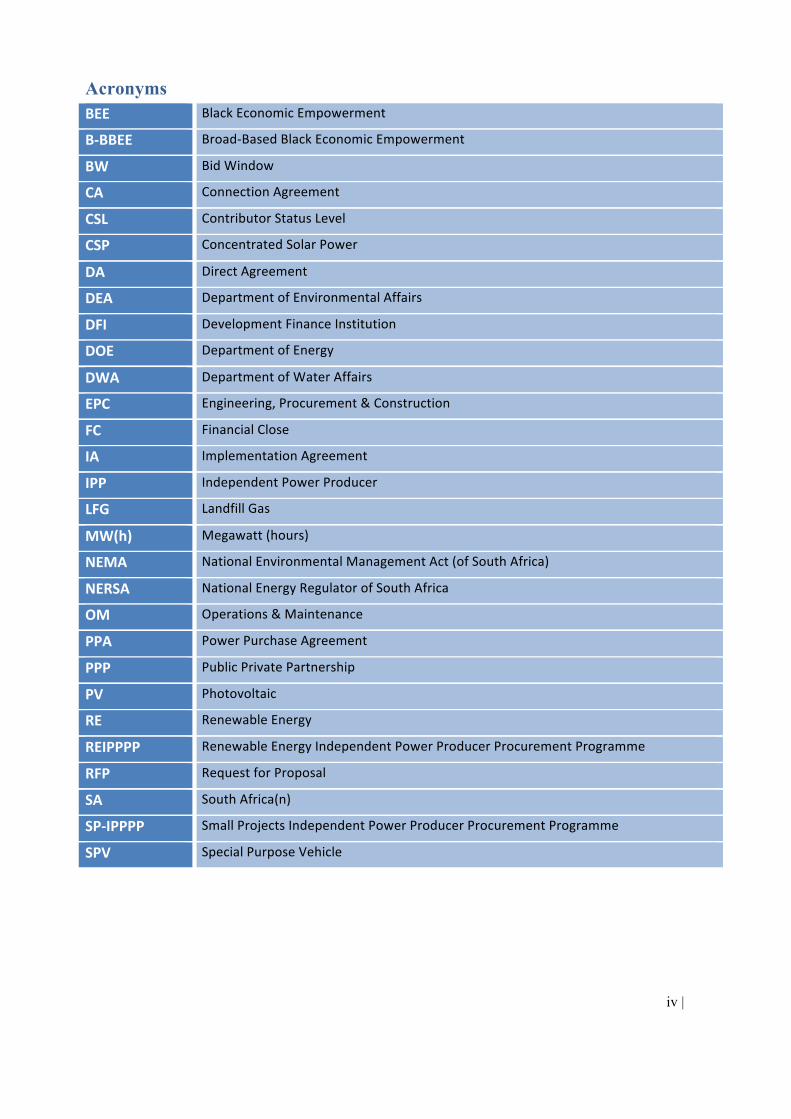
Acronyms
BEE BlackEconomicEmpowerment
B-BBEE Broad-BasedBlackEconomicEmpowerment
BW BidWindow
CA ConnectionAgreement
CSL ContributorStatusLevel
CSP ConcentratedSolarPower
DA DirectAgreement
DEA DepartmentofEnvironmentalAffairs
DFI DevelopmentFinanceInstitution
DOE DepartmentofEnergy
DWA DepartmentofWaterAffairs
EPC Engineering,Procurement&Construction
FC FinancialClose
IA ImplementationAgreement
IPP IndependentPowerProducer
LFG LandfillGas
MW(h) Megawatt(hours)
NEMA NationalEnvironmentalManagementAct(ofSouthAfrica)
NERSA NationalEnergyRegulatorofSouthAfrica
OM Operations&Maintenance
PPA PowerPurchaseAgreement
PPP PublicPrivatePartnership
PV Photovoltaic
RE RenewableEnergy
REIPPPP RenewableEnergyIndependentPowerProducerProcurementProgramme
RFP RequestforProposal
SA SouthAfrica(n)
SP-IPPPP SmallProjectsIndependentPowerProducerProcurementProgramme
SPV SpecialPurposeVehicle
v | Page
List of Figures
Figure 1: REIPPPP Tender Process Timeline .................................................................................................. 3 Figure 2: Hourly Solar PV and Wind Production Profiles for all 31 days of January 2015 & Average System Load Diurnal Course ......................................................................................................................... 29 Figure 3: Weighted Average Bid Tariff (across all selected projects) per Bid Window ............................... 30 Figure 4: Corporate finance vs. Project finance per Bid Window ................................................................. 33 Figure 5: Major Equity Providers in the REIPPPP by number of projects (BWs 1 to 4) .............................. 35 Figure 6: Major Debt Providers in the REIPPPP (based on number of projects for which debt funding was made available, based on data from IPP office bid submission documents) ................................................. 36 Figure 7: Total funding per lender category (ZAR m) and percentage contribution to total debt funding - BWs 1 to 4 (based on data in submitted bids from IPP office) 37 .................................................................. 37 Figure 8: Largest nominal debt investors in the REIPPPP (ZAR m) at bidding stage (based on data in submitted bids from IPP office) ..................................................................................................................... 38 Figure 9: The SP-IPPPP Stage 2 Evaluation and Independent Review Process ............................................ 52 Figure 10: Representation of the Coordination of Numerous Departments .................................................. 66 Figure 11: Total MW procured per Technology (BW 1 to 4, incl. CSP only round) .................................... 76 Figure 12: Average EPC cost per MW of the three primary RE technologies under the REIPPPP .............. 96 Figure 13: Success fees as % of total upfront cost, BW 1 - 4 ...................................................................... 101 Figure 14: Total number of projects procured (BW 1 - 4, including CSP only round) ............................... 108 Figure 15: Average Local Content Bid Commitments for Wind, Solar PV and CSP ................................. 113
vi | Page
List of Tables
Table 1: Ministerial Determinations in respect of Renewable Energy Technologies (under the REIPPPP and SP-IPPPP) ........................................................................................................................................................ 4 Table 2: Contracted capacity permitted per project ......................................................................................... 7 Table 3: Major categories of Legal Criteria ................................................................................................... 11 Table 4: Changes in technology-specific environmental consent criteria from BW 1 to 4 ........................... 15 Table 5: Elements of the Economic Development Criteria (as at BW 4) ...................................................... 26 Table 6: Progress of procured projects as at October 2015 ........................................................................... 27 Table 7: Dates by which awarded bidders must be capable of reaching COD per Bid Window .................. 27 Table 8: Capacity and Investment Outcomes of Bid Windows 1 to 4 ........................................................... 28 Table 9: Price caps and Average Bid Tariffs per Technology and Bid Window ........................................... 32 Table 10: Average External Debt funding as a percentage of Total Funds (where the remainder is Equity) 34 Table 11: Sub-elements of the Job Creation criterion .................................................................................... 39 Table 12: Job creation outcomes (where 1 job = 1 job year) ......................................................................... 39 Table 13: Average Local Content as a percentage of Total Project Cost versus Thresholds and Targets (where Threshold = Minimum obligation) .................................................................................................... 40 Table 14: The evaluation categories considered per stage of the SP-IPPPP ................................................. 42 Table 15: A Summary of Bid Submission Phases to date ............................................................................. 43 Table 16: Comparison of Weighting of ED Criteria between REIPPPP and SP-IPPPP ............................... 50 Table 17: Comparison of ED thresholds and targets between REIPPPP and SP-IPPPP ............................... 51 Table 18: Outcomes of SP-IPPPP Preferred Bids awarded in October 2015 ................................................ 53 Table 19: History of South Africa's RE Policy and Political Commitments ................................................. 59 Table 20: Comparison of FITs under the terminated REFIT Scheme vs. REIPPPP Round 1& 2 Bid Caps and Actual Price Outcomes ............................................................................................................................ 71 Table 21: A breakdown of the average 'upfront investment costs' per installed MW in respect of awarded wind projects under the REIPPPP .................................................................................................................. 95 Table 22: A breakdown of the average 'upfront investment costs' per installed MW in respect of awarded solar PV projects under the REIPPPP ............................................................................................................ 95 Table 23: Cost Estimate Fees since their introduction in 2013 .................................................................... 102 Table 24: Approved projects by technology and region .............................................................................. 108 Table 25: Sub-elements of the Job Creation criterion .................................................................................. 109 Table 26: Jobs for Local Citizens (where 1 job = 1 person-years) .............................................................. 110 Table 27: Key Differences in permitted “Local Content” ........................................................................... 112 Table 28: Local Content Thresholds and Targets per technology and bid window .................................... 113 Table 29: Sub-elements of the Ownership criterion .................................................................................... 115 Table 30: Average Local Community Ownership versus Thresholds and Targets ..................................... 117 Table 31: Preferential Procurement Sub-Element Targets .......................................................................... 118 Table 32: Enterprise Development Commitments per technology (ZAR m) .............................................. 119 Table 33: Socio-economic Development Commitments per technology (ZAR m) ..................................... 120 Table 34: Awarded SP-IPPPP projects per Province ................................................................................... 121
1 | Page
PART A: Review of the South African Renewable Energy Independent Power
Producer Procurement Programme (REIPPPP)
Section 1: Overview of the REIPPPP
The South African REIPPPP is a competitive tender process that has been designed to facilitate
private sector investment into grid-connected renewable energy (RE) generation in South Africa.
Independent power producers (IPPs) are invited to submit bids for onshore wind, solar
photovoltaic (PV), concentrated solar power (CSP), small hydro, biomass, biogas or landfill gas
projects. Submitted bids must first qualify for evaluation by meeting minimum compliance
requirements, after which they are evaluated based on price (bid tariff) and economic
development criteria.
Between 2011 and 2015 four such bidding rounds have been completed, referred to as Bid
Windows, with an additional round for CSP only. Competition has been fierce, with 390
submissions resulting in just under a quarter (92)1 of these being selected for procurement of
6,328 MW amounting to R193bn (USD 20.5bn)2 in investment. Prices have fallen sharply and
the projects of selected bidders (or “preferred bidders”) are now amongst the lowest priced grid-
connected RE projects in the world. The prices of winning bids in the latest tender indicate that
solar PV and wind energy are now cheaper than the national utility, Eskom’s, average cost of
supply and far below the cost of its new coal power stations.
Additionally, an Expedited Bid Window (BW) was run in 2015. This was designed primarily to
provide bid projects that had been unsuccessful during prior rounds with a second opportunity to
bid. 1,800 MW was made available for tender under this Expedited BW, with bid submissions in
November 20153. The programme is steadily progressing towards achieving the National
Development Plan’s (NDP) interim target of adding 7,000 MW of operational RE generation
capacity by 2020 and the Integrated Resource Plan's (IRP) target of 17,800 MW from RE
generation by 2030 (DOE, 2015).
1 With projects from the Small Projects IPP programme included, this total is 102 2 Based on ZAR:USD FX Rate of 9.4 3 Bid submission date was originally set for 6 October 2015, but was postponed to 11 November 2015.
2 | Page
The Department of Energy (DOE) also introduced the Small Projects IPP Procurement
Programme (SP-IPPPP) in 2013, which aims to procure 200 MW from projects of only 1 - 5
MW each. This programme aims to be simpler and less expensive for bidders so as to encourage
participation from small and medium enterprises (SMEs) in South Africa, which are often unable
to compete effectively with larger players. In October 2013 the SP-IPPPP offered 50MW for
tender. After a prequalification phase in March 2014, 29 bids totalling 139MW were received in
November 2014. Of these, 10 projects totalling 49MW were awarded in October 2015. A further
10 projects have been awarded in January 2017. The appropriateness of the REIPPPP for
procuring biomass, biogas and landfill gas projects is currently under consideration. Due to their
technology-specific requirements and small size, amongst other factors, it is believed they may
better suit the SP-IPPPP or an alternative focused procurement programme. It is therefore a
possibility that they will be excluded from future REIPPPP bid windows.
Once IPPs are appointed as Preferred Bidders they are required to sign standardised, non-
negotiable, rand (ZAR) denominated 20 year Power Purchase Agreements (PPAs) with Eskom.
Prices are indexed to inflation. The PPA is supported by an Implementation Agreement (IA)
between the IPP and government (DOE), which, along with a Government Framework Support
Agreement, 4 effectively guarantees Eskom’s payments. There is also a standard Direct
Agreement (DA) between the IPP, Eskom, the DOE and lenders, which provides the latter with
step-in rights in the event of default. Connection Agreements (CAs) are also required, although
the specific Agreement depends both on whether connection is to the Transmission or
Distribution System. In general IPPs are responsible for the costs of shallow connections (i.e. to
the nearest substation), but not for deep connection costs (i.e. those related to strengthening
Eskom transmission system).
Bidders generally regard the REIPPPP as being well designed and managed, and the process as
being transparent and fair. The REIPPPP is run by a separate DOE IPP unit, which is led by a
management team seconded from the Public-Private Partnership Unit of the National Treasury.
The DOE IPP Unit also obtained substantial input from local and international technical, legal
and financial transaction advisors.
4 This is an agreement between the Department of Energy, National Treasury, Eskom and NERSA. The effect of the agreement is that the IPP payments are ring-fenced and passed through to the consumers. This also applies in the case of Eskom defaulting on the payments, which in effect prevents the sovereign guarantee contained in the Implementation Agreement from being called by protecting the revenue flow to the IPPs.
3 | Page
The REIPPPP has not only pioneered renewable energy in South Africa, which is currently
overwhelmingly dependent on coal, but has also been the vanguard for IPPs in the country and
has loosened the monopoly hold of Eskom. In less than four years, South Africa has achieved
more investment in IPPs than in the rest of Sub-Saharan Africa over the past two decades. It
offers valuable lessons for other developing countries in terms of designing and running
competitive tenders or auctions for grid-connected renewable energy IPPs.
Section 2: Procurement Design and Requirements
The REIPPPP has been designed as a series of single step, closed-bid auctions that are initiated
by the issue of a combined Request for Qualification and Proposal (RFP). Each tender or auction
makes available a total amount of megawatts (MWs) in specific technology categories. Bids are
generally due within 3 months of the RFP and are screened initially for compliance with general
requirements and qualification criteria. Compliant bids are then evaluated on a comparative basis
and Preferred Bidder status is awarded to the highest ranked projects within the total MW
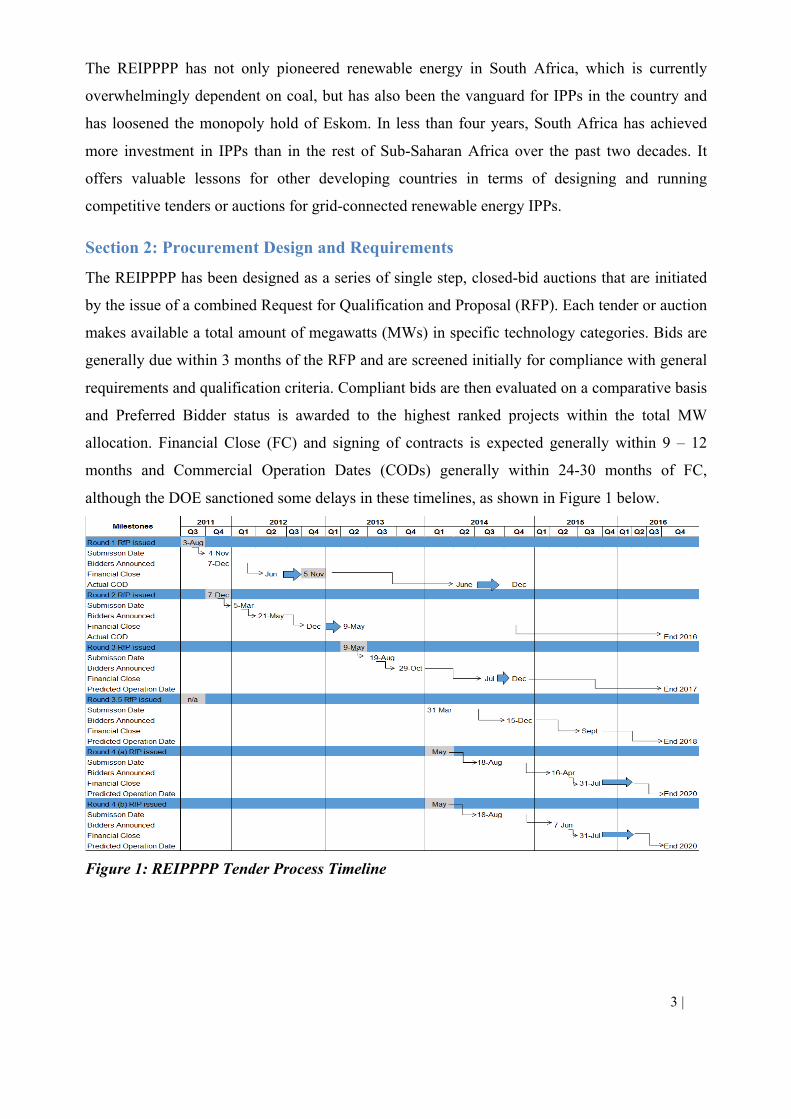
allocation. Financial Close (FC) and signing of contracts is expected generally within 9 – 12
months and Commercial Operation Dates (CODs) generally within 24-30 months of FC,
although the DOE sanctioned some delays in these timelines, as shown in Figure 1 below.
Figure 1: REIPPPP Tender Process Timeline
4 | Page
South Africa has a well-defined, centrally controlled electricity generation planning and
procurement system. The Electricity Regulation Act of 2006 (amended in 2007), and associated
Electricity Regulations on New Generation Capacity, issued in November 2010 and May 2011,
assign responsibility to the Minister of Energy to develop an Integrated Resource Plan and to
make “determinations” on what new generation capacity is needed, from which sources, and
whether it should be from Eskom or an IPP. The regulator, in issuing generation licenses, is
bound by these determinations.
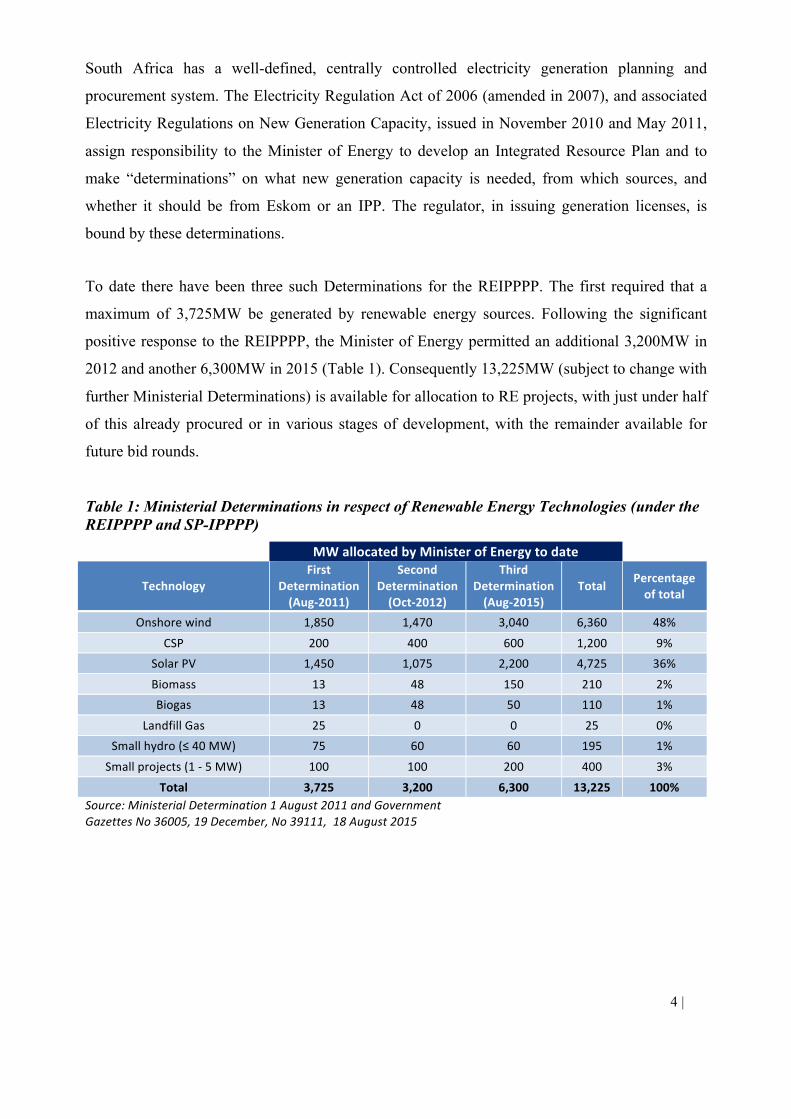
To date there have been three such Determinations for the REIPPPP. The first required that a
maximum of 3,725MW be generated by renewable energy sources. Following the significant
positive response to the REIPPPP, the Minister of Energy permitted an additional 3,200MW in
2012 and another 6,300MW in 2015 (Table 1). Consequently 13,225MW (subject to change with
further Ministerial Determinations) is available for allocation to RE projects, with just under half
of this already procured or in various stages of development, with the remainder available for
future bid rounds.
Table 1: Ministerial Determinations in respect of Renewable Energy Technologies (under the REIPPPP and SP-IPPPP)
MWallocatedbyMinisterofEnergytodate
TechnologyFirst
Determination(Aug-2011)
SecondDetermination(Oct-2012)
ThirdDetermination(Aug-2015)
Total Percentageoftotal
Onshorewind 1,850 1,470 3,040 6,360 48%
CSP 200 400 600 1,200 9%SolarPV 1,450 1,075 2,200 4,725 36%
Biomass 13 48 150 210 2%Biogas 13 48 50 110 1%
LandfillGas 25 0 0 25 0%Smallhydro(≤40MW) 75 60 60 195 1%
Smallprojects(1-5MW) 100 100 200 400 3%
Total 3,725 3,200 6,300 13,225 100%Source:MinisterialDetermination1August2011andGovernmentGazettesNo36005,19December,No39111,18August2015
5 | Page
There are two distinct sets of criteria in the bid evaluation process. These are the compliance
requirements, outlined in the General Requirements and Qualification Criteria; and the scoring
criteria, outlined in the Evaluation Criteria. In the first stage, bid submissions are assessed to
determine whether they are “Compliant Bids”. A Compliant Bid is one that meets both general
requirements (Part A of the RFP) and meets or exceeds numerous prescribed thresholds (Part B of
the RFP) to qualify for the second stage. The latter stage involves the comparative evaluation (Part
C of the RFP) of all Compliant Bids based on price (70%) and a basket of Economic Development
criteria (30%).
2.1. General requirements (Part A of the RFP)
Part A provides an overview of the REIPPPP, its key players and governing laws. It also
provides information for the relevant bid submission phase, such as the maximum capacity
(MW) available for tender per technology, price caps per technology to ensure bid tariffs are
within acceptable limits and a timetable with deadlines for each stage of the bid window (BW).
Lastly it lists general requirements for participation, in many cases introducing criteria which are
then detailed in Part B. Except where changes in the RFP documentation from BW 1 to 4 are
explicitly raised, the key requirements discussed below are based on the most recent BW 4 RFP.
2.1.1. Eligible Bidders, Documentation Fee and Registration
The RFP is not restricted to South African citizens and entities only. It is available
internationally, provided that each entity wishing to obtain a copy of the RFP pays a non-
refundable documentation fee of R15, 000. In order to be eligible for participation in a particular
bid submission phase, the bidder must pay the above documentation fee and complete the
REIPPPP Registration Form on or before the prescribed Bid Registration Date.
In addition, each eligible bidder intending to submit a bid response must notify the DOE in
writing of the following information by the Bid Registration Date: the project technology,
contracted capacity, site name and co-ordinates, co-ordinates of the substation for the intended
connection, whether it will connect to the transmission or distribution system, whether the
project was submitted under a prior bid round or in the SP-IPPPP and lastly, information on the
6 | Page
identity of all project participants and their advisors, to enable a conflict of interest check to be
undertaken. Upon providing the above information by the requisite deadline, the bidder is
assigned an IPPID number, which must be attached to the final bid response. The DOE considers
only bid responses with an IPPID number.
2.1.2. Price caps
Initially the DOE set price caps for each technology. Table 9 in Section 4 below compares these
to the average tariffs bid by Preferred Bidders. With the exception of Landfill Gas, price caps
remained unchanged from BW 1 to 2, after which they were adjusted per technology depending
on local and global influencing factors. In BW 4, price caps were removed for onshore wind and
solar PV, the two technologies that had attracted the most bids in previous rounds.
2.1.3. Capacity restrictions
The DOE placed maximum limits on the total capacity available for tender per technology
(which differed across bid rounds). From BW 1 to 3 the DOE reserved the right to reallocate the
total MW available amongst the various technologies at any stage. In BW 4 this was extended to
permit the DOE to increase or decrease the total MW available per technology and/ or for the bid
round in total, with the latter increase being capped at double the total initial allocation. Any
such changes were permitted after bid submission, but before preferred bidder announcement.
Due to the success of the bids received under BW 4 in terms of price and economic development
objectives, this enabling provision was utilised to increase the total MWs available. A second
batch (referred to as BW 4(b)) of preferred bidders was announced, with the total capacity
procured almost doubling to 2,205 MW from the initial 1,105MW initially made available. Part
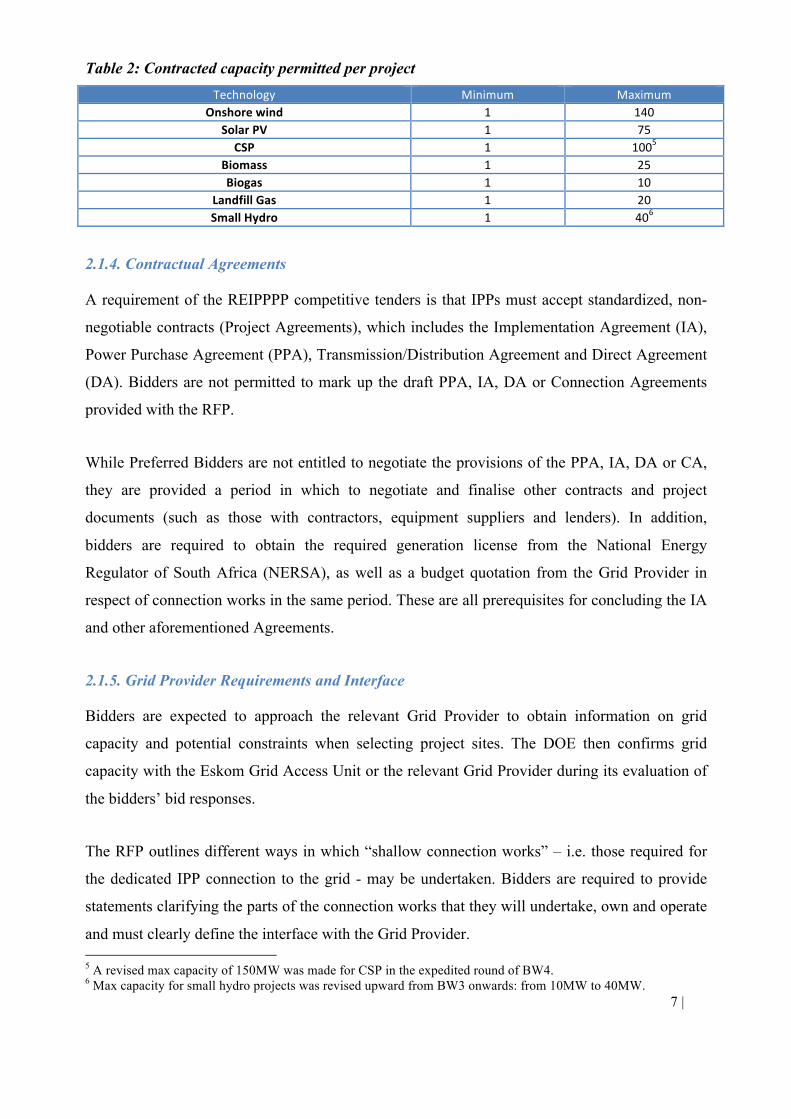
B further restricted the bid capacity per project to allow a greater number of project awards
within each technology’s available allocation and thereby stimulate competition (Table 2).
7 | Page
Table 2: Contracted capacity permitted per project
2.1.4. Contractual Agreements
A requirement of the REIPPPP competitive tenders is that IPPs must accept standardized, non-
negotiable contracts (Project Agreements), which includes the Implementation Agreement (IA),
Power Purchase Agreement (PPA), Transmission/Distribution Agreement and Direct Agreement
(DA). Bidders are not permitted to mark up the draft PPA, IA, DA or Connection Agreements
provided with the RFP.
While Preferred Bidders are not entitled to negotiate the provisions of the PPA, IA, DA or CA,
they are provided a period in which to negotiate and finalise other contracts and project
documents (such as those with contractors, equipment suppliers and lenders). In addition,
bidders are required to obtain the required generation license from the National Energy
Regulator of South Africa (NERSA), as well as a budget quotation from the Grid Provider in
respect of connection works in the same period. These are all prerequisites for concluding the IA
and other aforementioned Agreements.
2.1.5. Grid Provider Requirements and Interface
Bidders are expected to approach the relevant Grid Provider to obtain information on grid
capacity and potential constraints when selecting project sites. The DOE then confirms grid
capacity with the Eskom Grid Access Unit or the relevant Grid Provider during its evaluation of
the bidders’ bid responses.
The RFP outlines different ways in which “shallow connection works” – i.e. those required for
the dedicated IPP connection to the grid - may be undertaken. Bidders are required to provide
statements clarifying the parts of the connection works that they will undertake, own and operate
and must clearly define the interface with the Grid Provider. 5 A revised max capacity of 150MW was made for CSP in the expedited round of BW4. 6 Max capacity for small hydro projects was revised upward from BW3 onwards: from 10MW to 40MW.
Technology Minimum MaximumOnshorewind 1 140
SolarPV 1 75CSP 1 1005
Biomass 1 25Biogas 1 10
LandfillGas 1 20SmallHydro 1 406
8 | Page
2.1.6. Advisors
The DOE required extensive support from external transaction advisers in implementing and
carrying out the REIPPPP, with well over 100 representatives from 13 professional firms
offering legal, financial, technical or socio-economic and environmental advisory services over
the course of the programme. This placed significant strain on already limited local advisory
capacity, meaning that the DOE could not entirely prohibit bidders from using these professional
firms as well.
As a result the DOE published a list of the programme's advisory firms and individuals on the
IPP website, which bidders were required to consult before appointing advisers. Bidders were
permitted to use a professional firm listed without the prior written consent of the DOE, provided
that the bidder and firm put proper ring fencing mechanisms in place to manage any conflicts of
interest. However the specific individuals that were listed were prohibited from advising bidders
or serving as a bidder member, lender or any other participant in a bid response while their name
remained on the list. Furthermore, bidders were required to obtain assurance from each advisor
firm that no individual on its advisory team to the bidder had also acted for or advised the DOE
on any IPP procurement programme.
2.1.7. Generation Licence
Upon being selected as a preferred bidder, the project company must obtain a generation licence
from NERSA as required by the Electricity Regulation Act. As proof of submission of the
generation licence application to NERSA, a copy of the submitted application must be provided
to the DOE within 14 days of being awarded preferred bidder status.
2.1.8. Bid Guarantee and Preferred Bidder Guarantee
Upon bid submission, bidders are required to provide the DOE with an unconditional,
irrevocable Preferred Bidder Guarantee of R100,000 per MW of contracted capacity for the
proposed project. Once provisionally informed of its Preferred Bidder status, each IPP has 15
days to lodge a new guarantee (the “Preferred Bidder Guarantee”) with the DOE for an even
greater R200,000 per MW of contracted capacity. Only thereafter will it officially be appointed
as a Preferred Bidder.
9 | Page
The purpose of bid guarantees is to dis-incentivise bidders from submitting unrealistic proposals
by inexperienced bidders who subsequently struggle to finance and deliver on their project as it
was proposed. For example, the Preferred Bidder Guarantee may be forfeited to the DOE if the
preferred bidder fails to: comply with any conditions contained in the letter of appointment as
preferred bidder; sign any of the required contracts within the time period specified under the
RFP; or pay the development fee when prescribed (although this is not an exhaustive list). The
inclusion of high penalty costs helps to ensure that bids are as fail-safe as possible (Papapetrou,
2014).
2.1.9. Bid Validity Period
The RFP requires that bid submissions constitute valid and irrevocably binding offers for 365
calendar days from the submission date. The DOE is entitled to request an extension of this
period and the bidder must respond within the time-period specified, should they agree to extend.
2.1.10. Development Fee
Preferred bidders are required to pay a development fee equal to 1% of their total project cost7 to
the DOE’s Project Development Fund within 10 business days of the IA signature date. This
assists with programme sustainability, as funding is made available for transaction advisors and
running future tenders.
2.1.11. Bid Currency
All monetary amounts in the bid response must be presented in the local currency (the Rand)8.
As a result there is foreign exchange (forex) exposure in respect of certain upfront capital
expenditures and operating costs to be incurred after COD. The RFP permits adjustments to the
prescribed spot rate used at bid submission (and corresponding adjustments to bid tariff) at FC in
respect of capital expenditures, but DOE does not allow for similar adjustments on operating
costs.
From BW 3, the DOE placed a limit on the level of forex exposure it would accept between bid
submission and FC. This was capped at the lower of the actual forex exposure on capital
7 Total project cost included financing costs, reserves (e.g. maintenance reserves) & the development fee itself. 8The foreign exchange rate assumptions to be used for each round are communicated by the DOE in a briefing note.
10 | Page
expenditure or at 60% of the project's capital expenditure (in line with the 40% local content
requirement, to be discussed later).
2.1.12. Briefing Notes
Briefing Notes are issued by the DOE on an ad hoc basis, either to supplement or amend
information in the RFP or in response to a bidder-requested clarification. They are thereafter
deemed to be part of the RFP and require equal compliance upon bid submission. The DOE
strives to release the last Briefing Note no later than 10 days before the relevant bid submission
date.
2.1.13. Dual participation in REIPPPP and SP-IPPPP
Bidders wishing to submit a bid for the same project under the SP-IPPPP and REIPPPP
simultaneously will be subject to certain rules and restrictions. These are set out in the RFP of
the SP-IPPPP.
2.2. Qualification Criteria (Part B of the RFP)
Part B of the RFP elaborates on several requirements introduced in Part A (General
Requirements) and introduces new criteria with which the bidder must comply to qualify for the
final evaluation. As at BW 4 these Qualification Criteria are divided into eight categories,
detailed below. In broad terms projects that “qualify” for comparative evaluation are those that
are technically, financially and legally qualified, as well as having sufficient experience,
commitment and resources, to execute the project as submitted. Each submission must therefore
meet or exceed all prescribed thresholds (per criterion) to be considered a Compliant Bid.
2.2.1. Structure of the Project
Bidders must provide a diagram of the project’s structure as well as identify and explain the
Project Company (even if it was not yet established at the bid submission date), equity
participants, funders, contractors and the shareholdings of Black Enterprise members and Local
Community members, respectively. In order to pass this threshold requirement the bidder must
11 | Page
provide sufficient information to satisfy the DOE that the structure has been accurately
represented, and that the project complies with Part A requirements or restrictions relating to the
structure or bidder membership.
2.2.2. Legal Criteria and Evaluation
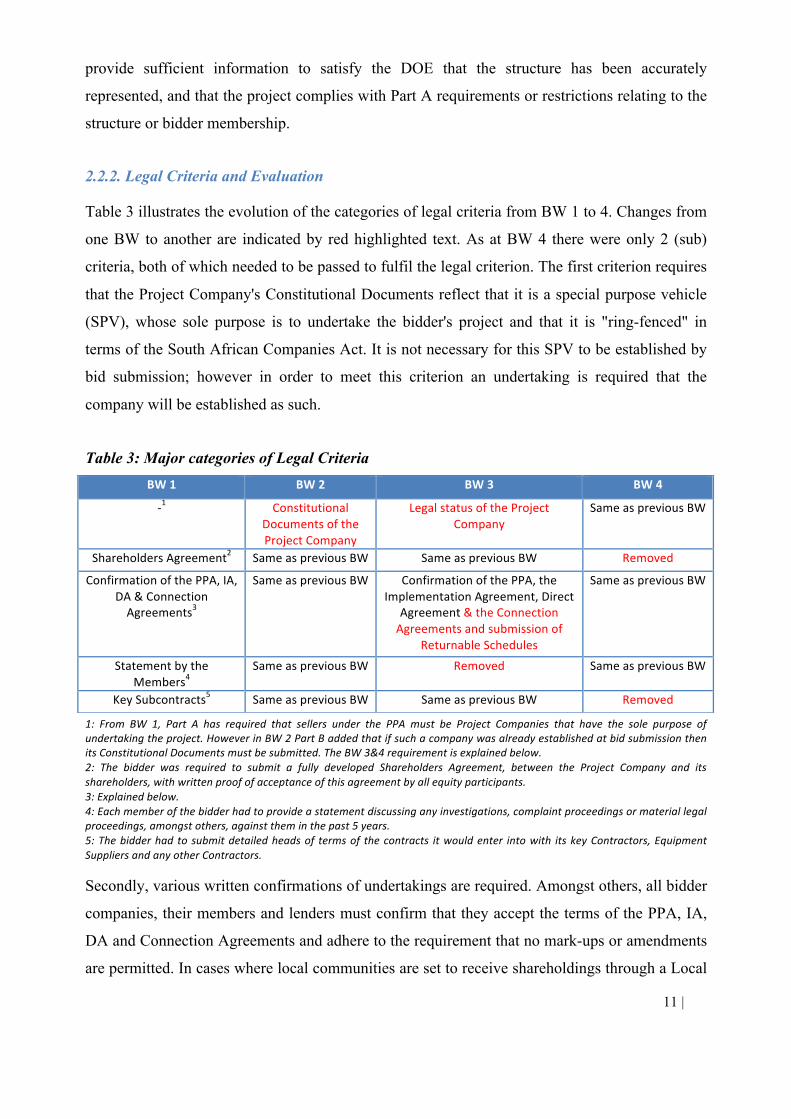
Table 3 illustrates the evolution of the categories of legal criteria from BW 1 to 4. Changes from
one BW to another are indicated by red highlighted text. As at BW 4 there were only 2 (sub)
criteria, both of which needed to be passed to fulfil the legal criterion. The first criterion requires
that the Project Company's Constitutional Documents reflect that it is a special purpose vehicle
(SPV), whose sole purpose is to undertake the bidder's project and that it is "ring-fenced" in
terms of the South African Companies Act. It is not necessary for this SPV to be established by
bid submission; however in order to meet this criterion an undertaking is required that the
company will be established as such.
Table 3: Major categories of Legal Criteria
1: From BW 1, Part A has required that sellers under the PPA must be Project Companies that have the sole purpose ofundertakingtheproject.HoweverinBW2PartBaddedthatifsuchacompanywasalreadyestablishedatbidsubmissionthenitsConstitutionalDocumentsmustbesubmitted.TheBW3&4requirementisexplainedbelow.2: The bidder was required to submit a fully developed Shareholders Agreement, between the Project Company and itsshareholders,withwrittenproofofacceptanceofthisagreementbyallequityparticipants.3:Explainedbelow.4:Eachmemberofthebidderhadtoprovideastatementdiscussinganyinvestigations,complaintproceedingsormateriallegalproceedings,amongstothers,againsttheminthepast5years.5:Thebidderhad tosubmitdetailedheadsof termsof thecontracts itwouldenter intowith itskeyContractors,EquipmentSuppliersandanyotherContractors. Secondly, various written confirmations of undertakings are required. Amongst others, all bidder
companies, their members and lenders must confirm that they accept the terms of the PPA, IA,
DA and Connection Agreements and adhere to the requirement that no mark-ups or amendments
are permitted. In cases where local communities are set to receive shareholdings through a Local
BW1 BW2 BW3 BW4
-1 ConstitutionalDocumentsoftheProjectCompany
LegalstatusoftheProjectCompany
SameaspreviousBW
ShareholdersAgreement2 SameaspreviousBW SameaspreviousBW Removed
ConfirmationofthePPA,IA,DA&ConnectionAgreements3
SameaspreviousBW ConfirmationofthePPA,theImplementationAgreement,Direct
Agreement&theConnectionAgreementsandsubmissionof
ReturnableSchedules
SameaspreviousBW
StatementbytheMembers4
SameaspreviousBW Removed SameaspreviousBW
KeySubcontracts5 SameaspreviousBW SameaspreviousBW Removed
12 | Page
Community Trust that has not yet been established at bid submission, or where any other
shareholder entities have not yet been incorporated by this time, then the appointed Lead
Member of the Project Company must confirm that these will be established and registered as
indicated in the bid response. Furthermore confirmation is required that, once they are
incorporated, they agree to be bound by the bid response to the same extent that they would have
been if they had been in existence upon bid submission.
These are the key requirements under this criterion but in order to be compliant, bidders must
provide every document or confirmation listed in the related RFP clause.
2.2.3. Land Acquisition and Land Use Criteria and Evaluation
This criterion requires bidders to submit documents that provide sufficient proof of land
acquisition. Acceptable agreements include copies of the title deeds for the project site or a copy
of a notarial lease, together with evidence that it has been registered or is capable of registration
by the IA effective date against the title deed for the site (with copies of this deed) for the
duration of the PPA. Alternatively bidders may submit (together with the relevant site title
deeds) an unconditional land option, lease or sale of land agreement exercisable at the bidder’s
choice and which allows them to secure the same real rights obtained via the aforementioned title
deed or lease agreement. Lastly, in a situation where the project site title deeds are unavailable at
bid submission, the RFP permits a Conveyancer’s Certificate in their place. This is conditional
upon the Conveyancer providing a full explanation for the title deed unavailability and bidders
assuming the risk of ensuring it will be obtained without delaying FC.
From BW 3, this section no longer required bidders intending to complete their shallow
connection works on an own-build and -ownership basis to provide evidence at bid submission
they had obtained real rights over the land to be traversed by the facility's connection line, where
this was land other than the project site. A key change in the BW 4 RFP documentation was that
bidders were no longer required to submit proof in the bid response that all necessary
applications (including those relating to land use change, subdivision and zoning applications,
respectively) had been made to secure the right to lawfully use the project site for their intended
purposes. They are now only required to provide this proof after being appointed as a Preferred
Bidder, which means that unsuccessful bidders are able to avoid incurring this cost (and time)
burden.
13 | Page
2.2.4. Environmental Consent Criteria and Evaluation
Bidders must pass both general and technology-specific sub-criteria under this Qualification
criterion, and provide evidence that all requisite environmental consents listed in the RFP have
been obtained by bid submission.
South Africa is a water scarce country and it is crucial that each bidder identifies whether their
project (including construction activities) will require an Integrated Water Use Licence under the
National Water Act. This includes providing copies in the bid response of all studies done to
determine the project's water needs and activities. For this purpose "water use" is not limited to
water extraction but also includes numerous water-related activities, such as diverting or
polluting a watercourse, disposing of waste water (for example, when cleaning the mirrors or
panels depending on the technology) and storing water to serve the facility.
To reduce the burden on the Department of Water Affairs (DWA), the licence itself is only
required to be in place before signature of the PPA9. However upon bid submission any bidder
requiring a water allocation must provide a written confirmation of this approved allocation from
the local Water Services Provider (usually the municipality) or, where this is insufficient and a
Water Use Licence will be required, provide a non-binding confirmation of water availability
from the DWA.
The primary requirement across all technologies is an Environmental Authorization per project,
in the name of the Project Company, as required by the South African National Environmental
Management Act. To achieve this the Project Company must prepare an Environmental Impact
Assessment Report (EIAR) or Basic Assessment Report (BAR). The former is required when a
project's capacity exceeds 20MW or it covers an area greater than 1 hectare, while a BAR is
typically for projects with a capacity of 10 - 20MW.
9 Along with evidence that there are no pending appeals, review proceedings or legal challenges against it at this time.
14 | Page
This Environmental Authorisation is a significant cost item for bidders (R2 - R6m) and has the
longest lead-time of all the permissions required, taking up to 24 months (Mulcahy, 2014).
Bidders must submit hard copies of the EIAR or BAR, and include details of any objections to
the facility's development raised during any public participation process as well as appeals to any
Environmental Consent required by the project. The DOE may deem the bid insufficient to pass
this criterion where the relevant appeal or review period has not expired by bid submission.
Other technology-specific consents required are greatly varied. For example, as at BW 4 only
wind and CSP projects must include proof of consent from the Civil Aviation Commissioner to
erect potential obstacles to aviation. CSP projects have a tendency to be situated in water scarce
areas and therefore require specific water consents by bid submission. This includes written
confirmation of the water availability for their projects by the Department of Water Affairs, as
well as proof that an application for an integrated water use licence has been made (or legal
opinion that it is not necessary). Lastly, biomass, biogas and landfill gas projects require a waste
management licence or legal opinion that it is not necessary.
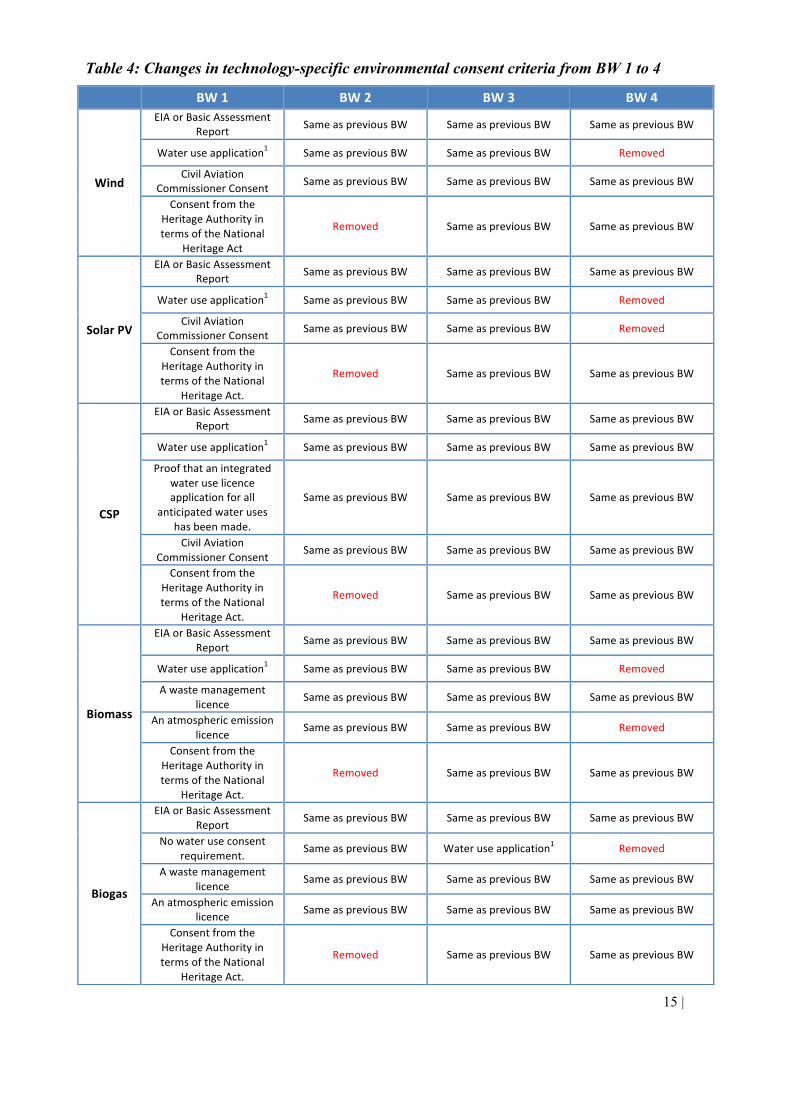
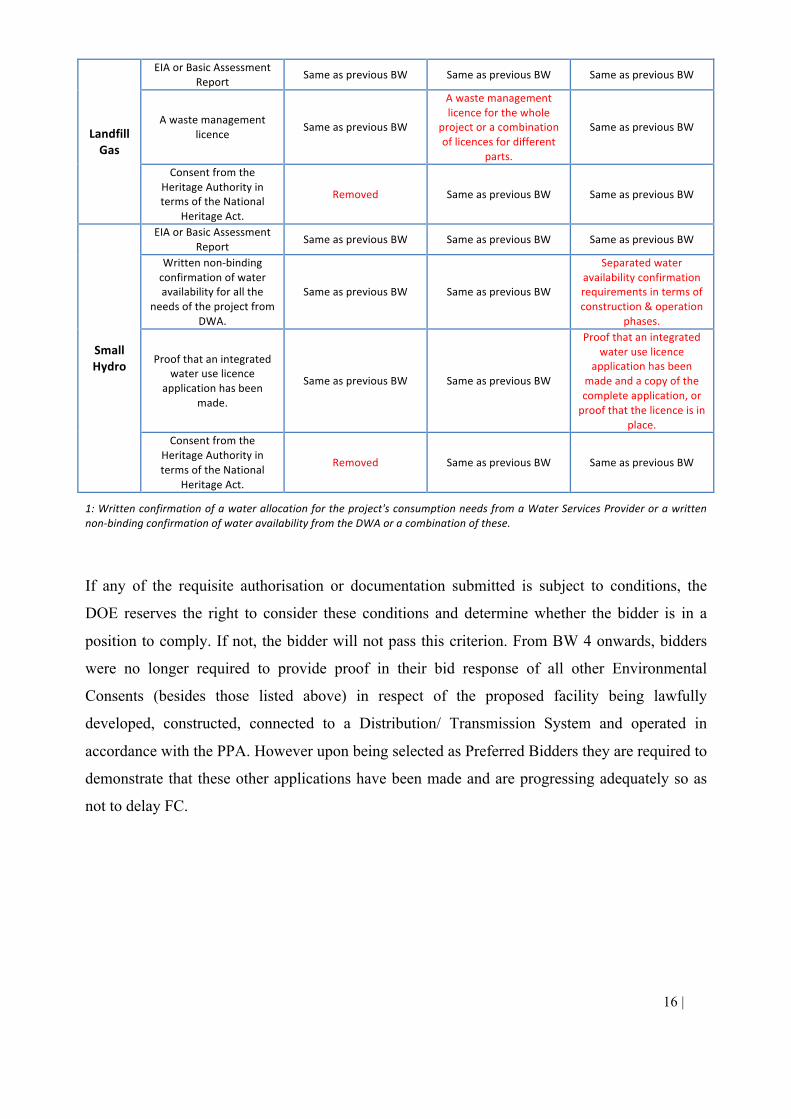
Schedule 9 under Volume 1, Part 1 to the RFP provides more detail on the primary
environmental and land use consents that are likely to be required for each technology. For each
technology the bidder would only pass the threshold requirement for this criterion where all the
requirements set out in Table 4 below were satisfied in the bid response. Changes from one bid
round to another are indicated by red text.
15 | Page
Table 4: Changes in technology-specific environmental consent criteria from BW 1 to 4
BW1 BW2 BW3 BW4
Wind
EIAorBasicAssessmentReport SameaspreviousBW SameaspreviousBW SameaspreviousBW
Wateruseapplication1 SameaspreviousBW SameaspreviousBW Removed
CivilAviationCommissionerConsent SameaspreviousBW SameaspreviousBW SameaspreviousBW
ConsentfromtheHeritageAuthorityintermsoftheNational
HeritageAct
Removed SameaspreviousBW SameaspreviousBW
SolarPV
EIAorBasicAssessmentReport SameaspreviousBW SameaspreviousBW SameaspreviousBW
Wateruseapplication1 SameaspreviousBW SameaspreviousBW Removed
CivilAviationCommissionerConsent SameaspreviousBW SameaspreviousBW Removed
ConsentfromtheHeritageAuthorityintermsoftheNational
HeritageAct.
Removed SameaspreviousBW SameaspreviousBW
CSP
EIAorBasicAssessmentReport SameaspreviousBW SameaspreviousBW SameaspreviousBW
Wateruseapplication1 SameaspreviousBW SameaspreviousBW SameaspreviousBW
Proofthatanintegratedwateruselicenceapplicationforall
anticipatedwateruseshasbeenmade.
SameaspreviousBW SameaspreviousBW SameaspreviousBW
CivilAviationCommissionerConsent SameaspreviousBW SameaspreviousBW SameaspreviousBW
ConsentfromtheHeritageAuthorityintermsoftheNational
HeritageAct.
Removed SameaspreviousBW SameaspreviousBW
Biomass
EIAorBasicAssessmentReport SameaspreviousBW SameaspreviousBW SameaspreviousBW
Wateruseapplication1 SameaspreviousBW SameaspreviousBW Removed
Awastemanagementlicence SameaspreviousBW SameaspreviousBW SameaspreviousBW
Anatmosphericemissionlicence SameaspreviousBW SameaspreviousBW Removed
ConsentfromtheHeritageAuthorityintermsoftheNational
HeritageAct.
Removed SameaspreviousBW SameaspreviousBW
Biogas
EIAorBasicAssessmentReport SameaspreviousBW SameaspreviousBW SameaspreviousBW
Nowateruseconsentrequirement. SameaspreviousBW Wateruseapplication1 Removed
Awastemanagementlicence SameaspreviousBW SameaspreviousBW SameaspreviousBW
Anatmosphericemissionlicence SameaspreviousBW SameaspreviousBW SameaspreviousBW
ConsentfromtheHeritageAuthorityintermsoftheNational
HeritageAct.
Removed SameaspreviousBW SameaspreviousBW
16 | Page
1:Writtenconfirmationofawaterallocationfortheproject'sconsumptionneedsfromaWaterServicesProviderorawrittennon-bindingconfirmationofwateravailabilityfromtheDWAoracombinationofthese.
If any of the requisite authorisation or documentation submitted is subject to conditions, the
DOE reserves the right to consider these conditions and determine whether the bidder is in a
position to comply. If not, the bidder will not pass this criterion. From BW 4 onwards, bidders
were no longer required to provide proof in their bid response of all other Environmental
Consents (besides those listed above) in respect of the proposed facility being lawfully
developed, constructed, connected to a Distribution/ Transmission System and operated in
accordance with the PPA. However upon being selected as Preferred Bidders they are required to
demonstrate that these other applications have been made and are progressing adequately so as
not to delay FC.
LandfillGas
EIAorBasicAssessmentReport SameaspreviousBW SameaspreviousBW SameaspreviousBW
Awastemanagementlicence SameaspreviousBW
Awastemanagementlicenceforthewhole
projectoracombinationoflicencesfordifferent
parts.
SameaspreviousBW
ConsentfromtheHeritageAuthorityintermsoftheNational
HeritageAct.
Removed SameaspreviousBW SameaspreviousBW
SmallHydro
EIAorBasicAssessmentReport SameaspreviousBW SameaspreviousBW SameaspreviousBW
Writtennon-bindingconfirmationofwateravailabilityforallthe
needsoftheprojectfromDWA.
SameaspreviousBW SameaspreviousBW
Separatedwateravailabilityconfirmationrequirementsintermsofconstruction&operation
phases.
Proofthatanintegratedwateruselicence
applicationhasbeenmade.
SameaspreviousBW SameaspreviousBW
Proofthatanintegratedwateruselicence
applicationhasbeenmadeandacopyofthecompleteapplication,orproofthatthelicenceisin
place.Consentfromthe
HeritageAuthorityintermsoftheNational
HeritageAct.
Removed SameaspreviousBW SameaspreviousBW
17 | Page
2.2.5. Financial Criteria and Evaluation
The financial qualification criteria broadly relate to the bid price and related financial proposal.
Four key criteria are assessed under this category.
2.2.5.1. Price
Bidders are required to submit fully indexed prices (based on CPI inflation) and partially indexed
prices10 per MWh, using the partial indexing method proposed in the RFP11. The fully indexed
prices in the bid response must be equal to or lower than the aforementioned price caps set by the
DOE in order to pass this criterion.
From BW 3 onwards, CSP was recognised as a technology with storage capabilities, and the
RFP was amended to price these projects differently to other technologies. While other RE
projects earn a flat tariff (as bid) at all times, CSP bidders must submit a “base price” which is
then adjusted upwards or downwards according to the time of day that the project’s energy is
delivered. During the standard time of day12 a CSP facility will simply earn its submitted base
price for energy output, while at peak times (daily from 4:30pm to 9:30pm) it will earn an
attractive 270%13 of the base price in BW 3 and 270% in BW 4, respectively, and at night (from
10:00pm to 5:00am) it will earn 0%. The premium payments on the base price are designed to
incentivize CSP bidders to deliver energy to the national grid during peak times (which is
possible due to their storage capabilities), thereby helping to meet peak demand on the grid.
2.2.5.2. Financial standing
This sub-category requires disclosures in respect of the funding that a bidder proposes to use for
its project. Where projects will be wholly or partially funded by corporate/ equity finance,
bidders must provide the identity of all providers/ members14, respectively, as well as the value
of the contribution from each and the source of finance (for example, reserves, parent company,
10 Bids submitted under the Expedited Round (BW 4b) only needed to submit fully indexed prices. It is not yet clear whether this is a change introduced only for the purposes of this special BW, or whether it will be taken forward into further BW’s. 11To determine the partially-indexed price, the RFP required that 20% to 50% of the price proposed was indexed at the CPI (inflation) rate, while the remainder was held constant. 12Standard time: every day from 5:00am to 4:30pm and again from 9:30pm to 10pm 13 This was originally set at 240% in a briefing note, but was adjusted to 270% prior to BW3. 14A member is a legal entity or natural person that will become a shareholder (either directly or through an intermediary entity) once the Project Company is incorporated or is a shareholder of an incorporated SPV.
18 | Page
external sources, DBSA or similar institution). Where corporate financing will be used, the
bidder is required to provide the audited financial statements for the latest 3 financial years15 of
the entity that is the ultimate provider of finance and providing the guarantee on which the
corporate finance is based. In the case of equity finance, the audited financial statements for the
latest 3 financial years must be provided for each ultimate provider16.
Additionally, the bidder must demonstrate in the bid response that the net assets of each ultimate
corporate and/ or equity finance provider(s) over the past 3 years have been at least 100% of the
finance it is proposing to put towards the bid project (“net asset test”), or that the provider has a
proven track record in the past 5 years of raising corporate/ equity finance (as applicable) to the
equivalent of at least 100% of its proposed finance (“track record test”). There is no specification
as to how many finance raisings (of similar size) within the past 5 years constitutes a “proven
track record”, other than that it must be to the satisfaction of the DOE. In BW 4 it was added that
a corporate finance guarantor must provide evidence of having raised corporate finance for its
own account or for one of its subsidiaries in order to pass the above track record test. No reliance
may be placed on the track record or third party entities or advisors to the guarantor.
From BW 2, equity members with “free carry” or “sweat equity” i.e. no equity investment in the
project, such as Black Enterprises and Local Community Trust entities that are clearly identified
as such, are exempt from the net asset and track record tests. If this were not the case this
criterion may adversely affect the achievement of some of the economic development objectives
associated with Black and Local Community Ownership (discussed in detail in Section 3.3).
2.2.5.3. Robustness and deliverability of funding proposal
Bidders must provide a clear breakdown of the sources of funds (equity, corporate finance and
external debt) and their uses (capital expenditure, grid connection costs, contingency elements
etc.). The bid response must also provide a plan, including a financial due diligence plan, setting
out key activities and proposed dates for the achievement of FC within prescribed timeframes.
15Or since incorporation if it has not been in existence for 3 years. 16Financial accounts are not required when equity/ corporate finance is being provided by the DBSA/ IDC.
19 | Page
Another requirement common to all sources of finance is that letters of support must be provided
by the ultimate finance providers, substantially in the form set out in Appendix R of Volume 4,
with slight variations depending on the source. This is a critical part of the REIPPPP, as the
letters of support require each financier to make a firm commitment and pledge that it has
conducted a due diligence on the proposed project and can confirm accuracy of the bidder's
documentation. This essentially outsourced the due diligence to the banks and other funders,
thereby reducing the DOE's load as they could perform a lighter due diligence. Funders also
have to acknowledge that they accept risk allocation as embedded in the PPA, IA and DA. Term
sheets have to be provided as well.
There are also several sub-criteria unique to the source of funding obtained, which will not be
discussed in this document. However as an example of these unique criteria, where a project will
use external debt the bidder must demonstrate that any of its members have a proven track
record, in the last 5 years, of raising external debt of a similar nature to that proposed by the
bidder. In the case of multiple lenders, the bidder should clearly distinguish between Tier 1 and
Tier 2 lender(s), where the former is responsible for the due diligence and the latter relies on this.
In addition to the above requirements, bidders only pass this threshold if they demonstrate a
“robust mitigation strategy” i.e. a clear alternative plan to obtain funds in the event that their
proposed finance provider becomes unable to do so on the terms stated. This demonstration also
requires the provision of a letter of indicative support from the alternative funders, which states
that they have held discussions with the bidder on this matter. Ultimately these financial
qualification criteria aim to ensure that projects bid are as fail-safe as possible.
2.2.5.4. Robustness of the financial models
Bidders must submit two financial models, namely the “Sponsor Case” (reviewed and agreed
upon by equity/ corporate finance providers, as applicable) and the “Banking Case” (reviewed
and agreed upon by external debt providers). Alternatively one model capable of running both
scenarios is permitted. Although the project bid price is the same under both, the RFP requires
that the “Sponsor Case” model be adopted for the purposes of the IA.
20 | Page
This criterion also requires, amongst others, that sensitivity analyses be performed to indicate the
impact of foreign currency movements on the bid tariff17; disclosures on tax and accounting
treatments and assumptions applied in the financial model; as well as an audit review opinion
(with several minimum requirements) of the financial models by a suitably qualified professional
firm.
Lastly, bidders must submit a Declaration in respect of Success Payments, which are broadly
defined as the reimbursements of costs incurred in the development of the bid project which will
be payable only on achievement of FC. Possible examples include payments to site developers,
free carry for equity members and success payments for equity and non-equity members. The
quantum, rationale and timing of all success payments must also be disclosed and all such
payments must be clearly identifiable in the submitted financial model.
2.2.6. Technical Criteria and Evaluation
Bidders must complete a standardized technical evaluation matrix as part of their bid response.
This section also contains numerous requirements around grid connection. Firstly, all bidders
must provide a signed letter stating that the project is able to comply with the applicable Grid
Codes prior to Scheduled COD18. The bid response must also clearly identify which parts of the
connection works will be implemented by the bidder (dependent on whether they choose an
own- or self-build basis), and the interface with works to be performed by the Grid Provider.
Similar clarifications must be provided for which part of these works will later be owned and
operated by the bidder versus Grid Provider.
Lastly, bidders are required to include a cost estimate letter (CEL), which provides an indicative
timeline and cost of the required connection works from the relevant Grid Provider. The onus is
on bidders to apply in sufficient time to receive this CEL by submission date, and they assume
all risk in relation to achieving grid connection by the Scheduled COD as per the PPA. Where
17Only foreign currency denominated capital expenditure (and not operating expenditure) should be linked to the spot rate in the Financial Model. The spot rate used should be that supplied in the RFP or Briefing Note. 18This letter may be signed by the bidder, EPC contractor or key electrical contractor. Any deviations must be stated and, where the bidder has obtained exemptions, signed confirmation of this from the relevant authority e.g. NERSA must be provided.
21 | Page
the bidder intends to perform shallow connection works on an own- or self-build basis, they must
also supply an itemised cost estimate for their part. Upon being appointed Preferred Bidders,
bidders must replace this CEL by obtaining a more up-to-date and accurate budget quote from
the Grid Provider (in relation to connection works) before signature date.
There are also many technology-specific criteria, all of which cannot be documented in this
report. In broad categories, technology-specific technical specifications cover:
- Eligible capacity per bid project.
- Eligible technology requirements (e.g. European and International Standards with which
they must comply; certificates of proof that certain component models adhere to prescribed
certification programme designs; components meet the “proven technology” requirements
and demonstrate a minimum prescribed Technical Availability).
- Energy Resource Certainty (in respect of biomass and biogas projects. Bidders must provide
documentary evidence, by way of a fuel supply agreement or market study, which confirms
the availability of fuel to meet the facility’s demand for at least the first 2 years of operation
and independent confirmation that supports this conclusion).
- Forecast Energy Sales Report (this must have been conducted by a suitable energy resource
assessor, and been independently reviewed by another assessor; both of whom are subject to
minimum requirements and disclosures in terms of experience).
- Contracting Company capability requirements.
- Project schedule disclosures required and a deadline by which COD must be achieved.
The Forecast Energy Sales Report is an essential part of the technical criteria, as it involves the
collection of resource data so as to estimate future energy sales. The requirements differ per
technology. For example, in respect of wind projects this report must supply at least 365
consecutive days of wind data (subject to additional criteria where there have been gaps in data
collection) measured on the project site at specific heights and in accordance with international
standards for wind testing. CSP projects also require 12 months of site-specific data. Solar PV
projects, on the other hand, require the use of at least 10 years of solar data taken from a
prescribed acceptable technology source.
22 | Page
2.2.7. Economic Development Criteria and Evaluation
These ED Qualification Criteria must not be confused with the ED Evaluation Criteria (which
are scored) in Part C to the RFP. There are two primary ED thresholds that must be passed in
order for a bid to be considered compliant. Firstly, there must be a minimum of 40% "South
African Entity Participation" in the Project Company. This was initially defined as participation
by those entities "based and registered in the Republic of South Africa, which have legal and
beneficial participation in the Project Company" (DOE RFP, 2011). However from BW 3 the
definition was narrowed to participation by South African Citizens19, established by looking
through the Bidder and Member structure to the ultimate natural citizens to whom the
shareholding benefits will accrue (DOE RFP, 2013). Proof of compliance is required, through
the submission of shareholder certificates or authorized letters indicating the respective
shareholdings, Constitutional Documents and Shareholders’ Agreements. In addition bidders
must supply the identity numbers and ID copies of these ultimate South African shareholders.
Secondly, the bidder must have a Contributor Status Level (CSL) of at least 5, although this is
only in respect of bidders based in South Africa. The CSL is determined according to the
BBBEE Codes20 and proof is required in the form of a valid verification certificate issued by an
‘eligible’ entity21.
Lastly, bidders are required to meet or exceed any minimum thresholds indicated in the
Economic Development Scorecard in Appendix JB9 to the RFP, and must provide supporting
documentation as proof. These thresholds are provided in Table 2 (Section 2.3.2) below.
2.2.8. Value for Money
This concept was introduced from BW 2 in accordance with Regulation 9 of South Africa's New
Generation Regulations, which states that the buyer cannot enter into a PPA unless it represents
19As direct or indirect shareholders in the Project Company 20As per the Government Gazette No. 36928 General Notice 1019 to the Broad-Based Black Economic Empowerment Act (53/2003) on the issue of Codes of Good Practice. 21An eligible entity is a South African National Accreditation System (SANAS)-accredited verification agency, a Chartered Accountant registered with the SA Institute of Chartered Accountants or an Auditor registered with the Independent Regulatory Board for Auditors. If the verification certificate does not specify (in addition to the B-BBEE status & Recognition Level) the actual qualification score, a verified letter indicating this score must be provided.
23 | Page
''value for money''22. The latter means that the project is in the best interests of and delivers an
acceptable outcome to both Eskom and the government (on behalf of electricity users in South
Africa). Numerous factors must be taken into account in this assessment, some of which include
the bidder’s price proposal, economic development commitments, the project’s calculated IRR
and foreign exchange risk borne by the government. If the success payments to developers are
considered to be disproportionately large or unjustifiable by the DOE, or excessive relative to the
total project cost, then the bidder may fail this Value for Money assessment.
2.2.9. Returning Compliant Bidders
While various amendments to the RFP documentation have been made as the bidding rounds
progress, the BW 4 RFP introduced some noteworthy concessions (some of which have already
been highlighted) in an attempt to reduce the time and cost required for bid preparation
(Papapetrou, 2014). Key to this was the introduction of the “Returning Compliant Bidder”
concept, which refers to those bidders who are re-submitting bids that were compliant in earlier
bid rounds, but unsuccessful in the second stage evaluation. From BW 4 these Returning
Compliant Bidders will be exempt from adhering to certain qualification criteria (relating to land
acquisition/ use and environmental consents), provided that the new bid project is located on the
same site as the previously compliant bid.
2.3. Evaluation Criteria (Part C of the RFP)
All Compliant Bids proceed to the second stage in which they are subject to a comparative
evaluation. The scoring of bid submissions is split between price (70%) and ED criteria (30%).
The latter is based on the Economic Development Policy of March 2011, which regulates
empowerment outputs in the REIPPPP.
2.3.1. Price Scoring
For each Compliant Bid received, an Equivalent Annual Tariff (EAT) is calculated in respect of
the bid price provided (both fully- and partially-indexed). The EAT is calculated in a two-step
22It was added as the 9th criterion in BW 2, at which time "Submission of original Bid Guarantee" was the 8th criterion under Part B. It then replaced the latter criterion to become the 8th criterion from BW 3.
24 | Page
process as laid out in Part C and is then used to determine the compliant bidder’s price score out
of a maximum of 70 points. The bidder’s EAT is compared to the lowest EAT offered for the
same technology in the relevant bid window, meaning that this price score is a relative metric.
As illustrated in the RFP, if Bidder A is calculated as having the lowest EAT bid for a particular
technology at R1100 per MWh, while Bidder B offers R1,400 and Bidder C offers R2,200 per
MWh, respectively, their scorings are calculated as follows:
Score of Bid Price A = 70*[1-((1,100 – 1,100)/1,100)] = 70 out of 70
Score of Bid Price B = 70*[1-((1,400 – 1,100)/1,100)] = 50.91 out of 70
Score of Bid Price C = 70*[1-((2,200 – 1,100)/1,100)] = 0 out of 70
2.3.2. Economic Development Criteria and Scoring
The ED criteria carry a maximum of 30 points. This 70:30 split between price and ED objectives
represented a significant shift from government’s usual 90:10 split (towards price) as stipulated
by the Preferential Procurement Policy Framework Act (2000), and was only made possible
through an exemption. This heavy weighting of non-price objectives in a competitive tender was
also unique globally and set the REIPPPP apart. There has been controversy over perceived
trade-offs between lowering bid prices and meeting ED criteria, with some arguing that the latter
adds complexity and therefore cost. However the underlying objectives of ED criteria are to
facilitate and expedite local job creation, community development and Black commercial
interests, as well as growth in emerging and smaller enterprises for inclusive growth within the
energy sector, in line with the government’s objectives as articulated in the National
Development Plan etc. Therefore this component was a key factor behind government support of
the REIPPPP and crucial to the success of the programme.
The ED criteria are categorised into 7 non-price categories: job creation, local content,
ownership, management control, preferential procurement, enterprise and socio-economic
development. Each category and its weighted contribution to the total ED score is shown in
Table 5 below. From a policy perspective the government has attached higher weightings to
priority objectives, such as job creation and local content (which stimulates job creation).
Together these account for 50% of the ED score, with all 7 element-weightings remaining
unchanged over the programme to date. The table also lists the sub-elements per category as at
25 | Page
BW 4, comprising 18 individual measurements compared to 17 in earlier rounds (with the
addition being “Jobs for RSA based citizens per MW of contracted capacity”).
The RFP indicates ‘thresholds’ and ‘targets’ per element and technology. Target outcomes are
provided for all categories to encourage bidder commitment; however minimum threshold
requirements are only provided for sub-elements in 4 of these 7 categories (namely job creation,
local content, ownership and socio-economic development). These minimum thresholds must be
met in order for the bid to pass the above-discussed Qualification criteria (Part B of the RFP) so
it may be considered a Compliant Bid and evaluated in Part C. No thresholds are prescribed for
management control, preferential procurement and enterprise development and they are therefore
voluntary commitments. Bidders who choose not to pursue them are still able to ‘qualify’ as a
Compliant Bid (in contrast to the above), but will not score any points in respect of these criteria
in the second stage evaluation.
There has been a change in the scoring of ED criteria to incentivise bidders to maximize their
economic development contributions. In BW 1 bidders received 10 points for any outcome in
excess of the minimum threshold level, and an additional 10 points if they exceeded the target
level as well (Eberhard et al, 2014). Absolute points are no longer awarded simply upon meeting
the minimum requirement (threshold) per sub-element. Instead the bidder with the greatest
commitment (“the Highest Compliant Bidder”) is awarded full points, provided this is at or
above the prescribed target level, while the remaining Compliant Bidders are allocated points in
proportion to how they place between the Highest Compliant Bidder and the threshold, or zero if
there is no threshold. If there is no Highest Compliant Bidder (i.e. no bidder has met or exceeded
the target), all Compliant Bidders are awarded points proportionately based on their position
between the target and threshold, or zero if there is no threshold.
The IA stipulates that IPPs are obliged to report on their ED obligations to the DOE quarterly23
and will be required to provide proof to substantiate progress claims. The first quarter of
monitoring begins at FC. There are penalties and rewards based on quarterly performance in
respect of these commitments, with underperformance resulting in financial penalties and/or
drawing termination points (if performance is below a termination threshold), which may
23 Despite the quarterly reporting only they are still required to keep monthly records of implementation.
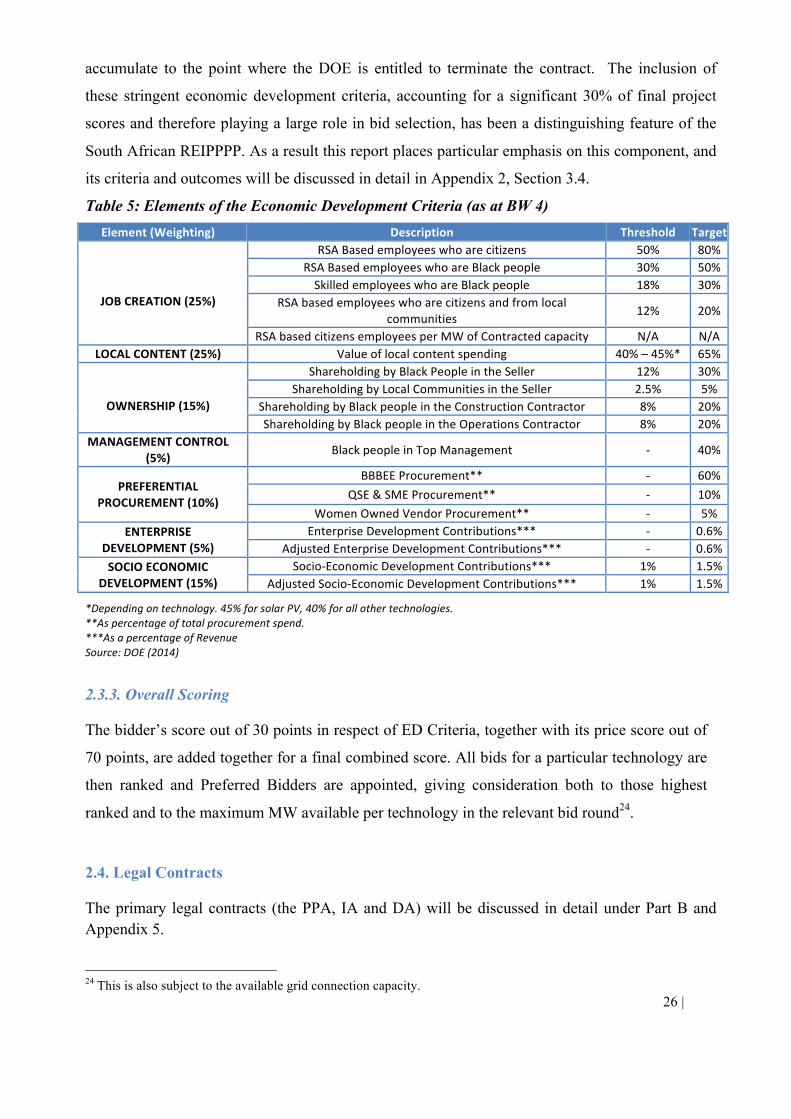
26 | Page
accumulate to the point where the DOE is entitled to terminate the contract. The inclusion of
these stringent economic development criteria, accounting for a significant 30% of final project
scores and therefore playing a large role in bid selection, has been a distinguishing feature of the
South African REIPPPP. As a result this report places particular emphasis on this component, and
its criteria and outcomes will be discussed in detail in Appendix 2, Section 3.4.
Table 5: Elements of the Economic Development Criteria (as at BW 4)
*Dependingontechnology.45%forsolarPV,40%forallothertechnologies.**Aspercentageoftotalprocurementspend.***AsapercentageofRevenueSource:DOE(2014)
2.3.3. Overall Scoring
The bidder’s score out of 30 points in respect of ED Criteria, together with its price score out of
70 points, are added together for a final combined score. All bids for a particular technology are
then ranked and Preferred Bidders are appointed, giving consideration both to those highest
ranked and to the maximum MW available per technology in the relevant bid round24.
2.4. Legal Contracts
The primary legal contracts (the PPA, IA and DA) will be discussed in detail under Part B and Appendix 5.
24 This is also subject to the available grid connection capacity.
Element(Weighting) Description Threshold Target
JOBCREATION(25%)
RSABasedemployeeswhoarecitizens 50% 80%RSABasedemployeeswhoareBlackpeople 30% 50%SkilledemployeeswhoareBlackpeople 18% 30%
RSAbasedemployeeswhoarecitizensandfromlocalcommunities 12% 20%
RSAbasedcitizensemployeesperMWofContractedcapacity N/A N/ALOCALCONTENT(25%) Valueoflocalcontentspending 40%–45%* 65%
OWNERSHIP(15%)
ShareholdingbyBlackPeopleintheSeller 12% 30%ShareholdingbyLocalCommunitiesintheSeller 2.5% 5%
ShareholdingbyBlackpeopleintheConstructionContractor 8% 20%ShareholdingbyBlackpeopleintheOperationsContractor 8% 20%
MANAGEMENTCONTROL(5%) BlackpeopleinTopManagement - 40%
PREFERENTIALPROCUREMENT(10%)
BBBEEProcurement** - 60%QSE&SMEProcurement** - 10%
WomenOwnedVendorProcurement** - 5%ENTERPRISE
DEVELOPMENT(5%)EnterpriseDevelopmentContributions*** - 0.6%
AdjustedEnterpriseDevelopmentContributions*** - 0.6%SOCIOECONOMIC
DEVELOPMENT(15%)Socio-EconomicDevelopmentContributions*** 1% 1.5%
AdjustedSocio-EconomicDevelopmentContributions*** 1% 1.5%
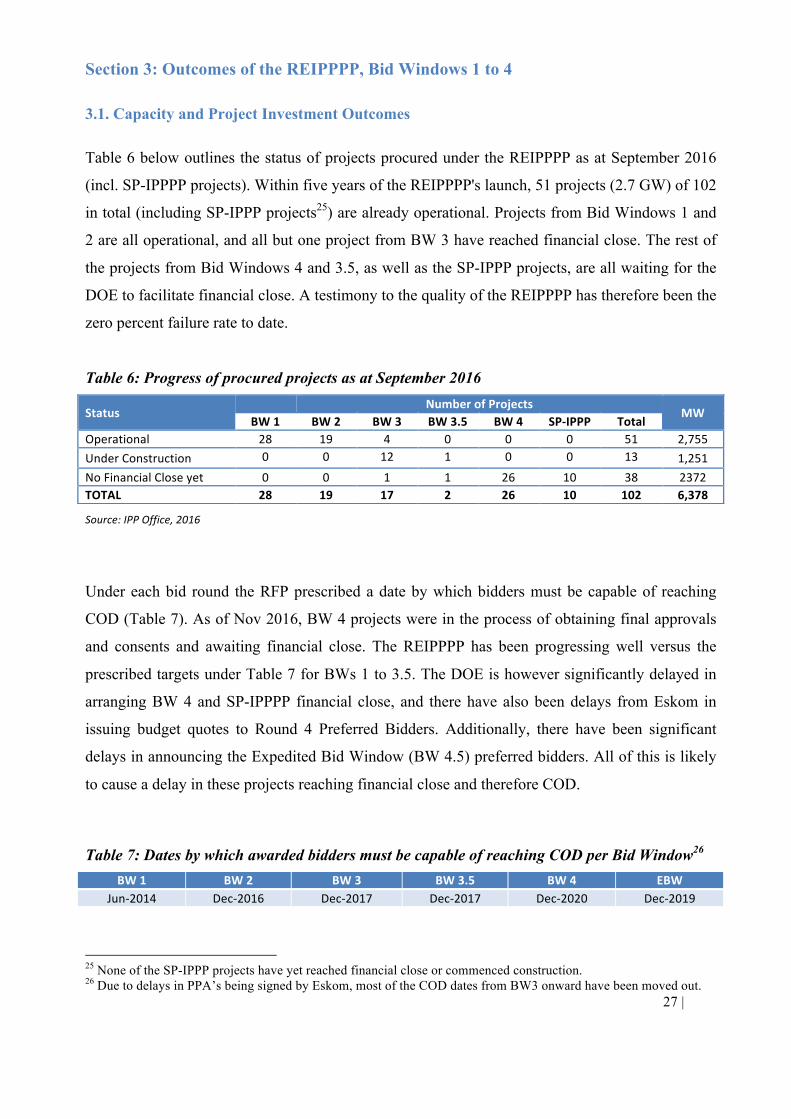
27 | Page
Section 3: Outcomes of the REIPPPP, Bid Windows 1 to 4
3.1. Capacity and Project Investment Outcomes
Table 6 below outlines the status of projects procured under the REIPPPP as at September 2016
(incl. SP-IPPPP projects). Within five years of the REIPPPP's launch, 51 projects (2.7 GW) of 102
in total (including SP-IPPP projects25) are already operational. Projects from Bid Windows 1 and
2 are all operational, and all but one project from BW 3 have reached financial close. The rest of
the projects from Bid Windows 4 and 3.5, as well as the SP-IPPP projects, are all waiting for the
DOE to facilitate financial close. A testimony to the quality of the REIPPPP has therefore been the
zero percent failure rate to date.
Table 6: Progress of procured projects as at September 2016
Source:IPPOffice,2016
Under each bid round the RFP prescribed a date by which bidders must be capable of reaching
COD (Table 7). As of Nov 2016, BW 4 projects were in the process of obtaining final approvals
and consents and awaiting financial close. The REIPPPP has been progressing well versus the
prescribed targets under Table 7 for BWs 1 to 3.5. The DOE is however significantly delayed in
arranging BW 4 and SP-IPPPP financial close, and there have also been delays from Eskom in
issuing budget quotes to Round 4 Preferred Bidders. Additionally, there have been significant
delays in announcing the Expedited Bid Window (BW 4.5) preferred bidders. All of this is likely
to cause a delay in these projects reaching financial close and therefore COD.
Table 7: Dates by which awarded bidders must be capable of reaching COD per Bid Window26
25 None of the SP-IPPP projects have yet reached financial close or commenced construction. 26 Due to delays in PPA’s being signed by Eskom, most of the COD dates from BW3 onward have been moved out.
Status NumberofProjects
MWBW1 BW2 BW3 BW3.5 BW4 SP-IPPP Total
Operational 28 19 4 0 0 0 51 2,755UnderConstruction 0 0 12 1 0 0 13 1,251NoFinancialCloseyet 0 0 1 1 26 10 38 2372TOTAL 28 19 17 2 26 10 102 6,378
BW1 BW2 BW3 BW3.5 BW4 EBWJun-2014 Dec-2016 Dec-2017 Dec-2017 Dec-2020 Dec-2019
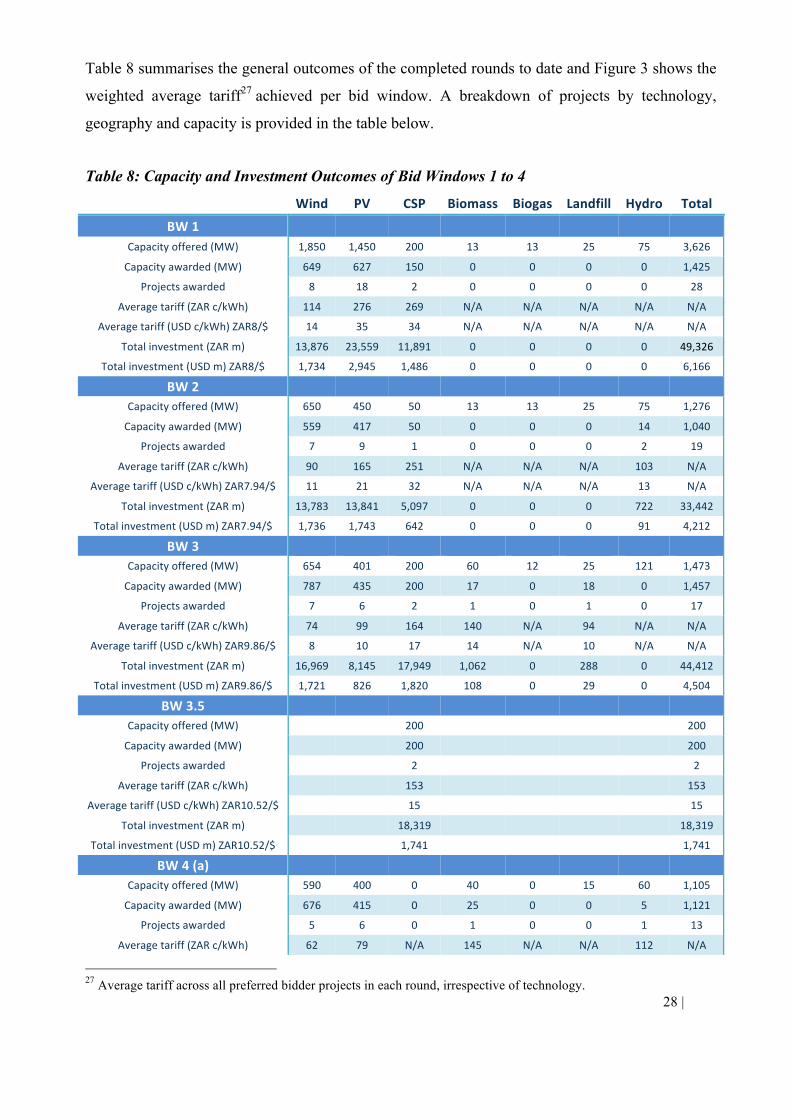
28 | Page
Table 8 summarises the general outcomes of the completed rounds to date and Figure 3 shows the
weighted average tariff27 achieved per bid window. A breakdown of projects by technology,
geography and capacity is provided in the table below.
Table 8: Capacity and Investment Outcomes of Bid Windows 1 to 4
27 Average tariff across all preferred bidder projects in each round, irrespective of technology.
Wind PV CSP Biomass Biogas Landfill Hydro Total
BW1 Capacityoffered(MW) 1,850 1,450 200 13 13 25 75 3,626
Capacityawarded(MW) 649 627 150 0 0 0 0 1,425
Projectsawarded 8 18 2 0 0 0 0 28
Averagetariff(ZARc/kWh) 114 276 269 N/A N/A N/A N/A N/A
Averagetariff(USDc/kWh)ZAR8/$ 14 35 34 N/A N/A N/A N/A N/A
Totalinvestment(ZARm) 13,876 23,559 11,891 0 0 0 0 49,326
Totalinvestment(USDm)ZAR8/$ 1,734 2,945 1,486 0 0 0 0 6,166
BW2 Capacityoffered(MW) 650 450 50 13 13 25 75 1,276
Capacityawarded(MW) 559 417 50 0 0 0 14 1,040
Projectsawarded 7 9 1 0 0 0 2 19
Averagetariff(ZARc/kWh) 90 165 251 N/A N/A N/A 103 N/A
Averagetariff(USDc/kWh)ZAR7.94/$ 11 21 32 N/A N/A N/A 13 N/A
Totalinvestment(ZARm) 13,783 13,841 5,097 0 0 0 722 33,442
Totalinvestment(USDm)ZAR7.94/$ 1,736 1,743 642 0 0 0 91 4,212
BW3 Capacityoffered(MW) 654 401 200 60 12 25 121 1,473
Capacityawarded(MW) 787 435 200 17 0 18 0 1,457
Projectsawarded 7 6 2 1 0 1 0 17
Averagetariff(ZARc/kWh) 74 99 164 140 N/A 94 N/A N/A
Averagetariff(USDc/kWh)ZAR9.86/$ 8 10 17 14 N/A 10 N/A N/A
Totalinvestment(ZARm) 16,969 8,145 17,949 1,062 0 288 0 44,412
Totalinvestment(USDm)ZAR9.86/$ 1,721 826 1,820 108 0 29 0 4,504
BW3.5 Capacityoffered(MW)
200
200
Capacityawarded(MW) 200 200
Projectsawarded 2 2
Averagetariff(ZARc/kWh)
153
153
Averagetariff(USDc/kWh)ZAR10.52/$
15
15
Totalinvestment(ZARm)
18,319 18,319
Totalinvestment(USDm)ZAR10.52/$
1,741
1,741
BW4(a) Capacityoffered(MW) 590 400 0 40 0 15 60 1,105
Capacityawarded(MW) 676 415 0 25 0 0 5 1,121
Projectsawarded 5 6 0 1 0 0 1 13
Averagetariff(ZARc/kWh) 62 79 N/A 145 N/A N/A 112 N/A
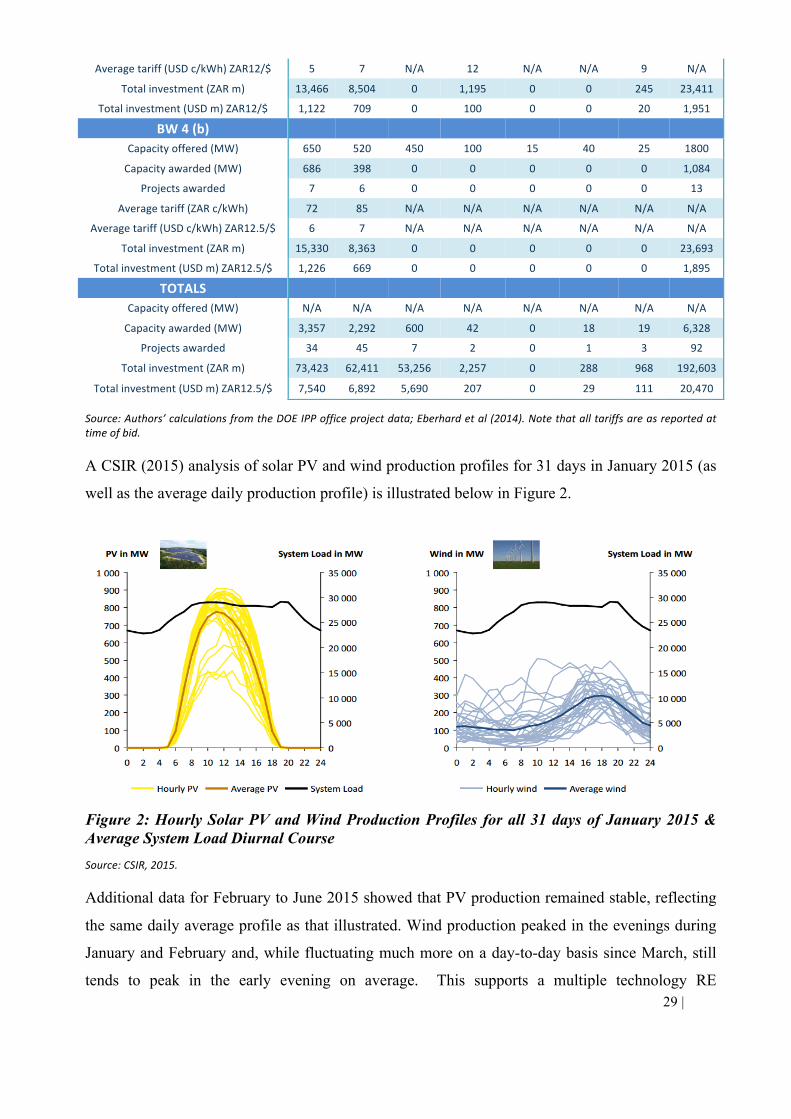
29 | Page
Source:Authors’calculationsfromtheDOEIPPofficeprojectdata;Eberhardetal(2014).Notethatalltariffsareasreportedattimeofbid.
A CSIR (2015) analysis of solar PV and wind production profiles for 31 days in January 2015 (as
well as the average daily production profile) is illustrated below in Figure 2.
Figure 2: Hourly Solar PV and Wind Production Profiles for all 31 days of January 2015 & Average System Load Diurnal Course Source:CSIR,2015.
Additional data for February to June 2015 showed that PV production remained stable, reflecting
the same daily average profile as that illustrated. Wind production peaked in the evenings during
January and February and, while fluctuating much more on a day-to-day basis since March, still
tends to peak in the early evening on average. This supports a multiple technology RE
Averagetariff(USDc/kWh)ZAR12/$ 5 7 N/A 12 N/A N/A 9 N/A
Totalinvestment(ZARm) 13,466 8,504 0 1,195 0 0 245 23,411
Totalinvestment(USDm)ZAR12/$ 1,122 709 0 100 0 0 20 1,951
BW4(b) Capacityoffered(MW) 650 520 450 100 15 40 25 1800Capacityawarded(MW) 686 398 0 0 0 0 0 1,084
Projectsawarded 7 6 0 0 0 0 0 13
Averagetariff(ZARc/kWh) 72 85 N/A N/A N/A N/A N/A N/A
Averagetariff(USDc/kWh)ZAR12.5/$ 6 7 N/A N/A N/A N/A N/A N/A
Totalinvestment(ZARm) 15,330 8,363 0 0 0 0 0 23,693
Totalinvestment(USDm)ZAR12.5/$ 1,226 669 0 0 0 0 0 1,895
TOTALS Capacityoffered(MW) N/A N/A N/A N/A N/A N/A N/A N/A
Capacityawarded(MW) 3,357 2,292 600 42 0 18 19 6,328
Projectsawarded 34 45 7 2 0 1 3 92
Totalinvestment(ZARm) 73,423 62,411 53,256 2,257 0 288 968 192,603
Totalinvestment(USDm)ZAR12.5/$ 7,540 6,892 5,690 207 0 29 111 20,470
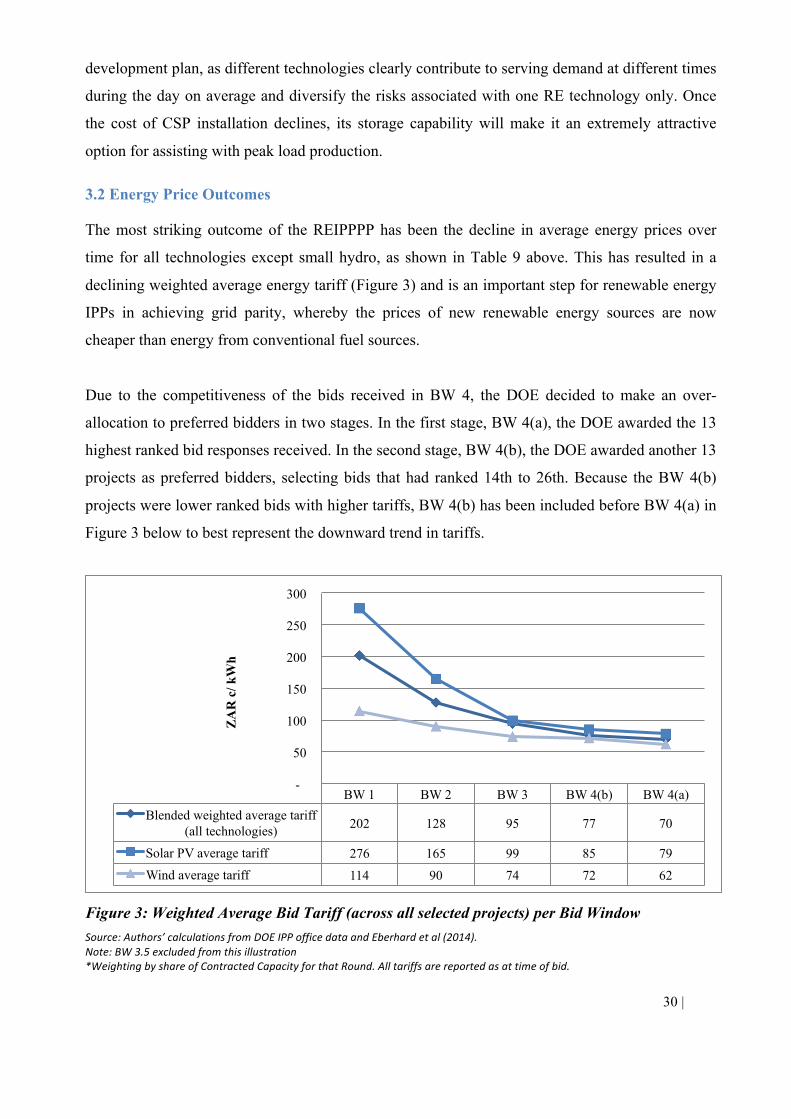
30 | Page
development plan, as different technologies clearly contribute to serving demand at different times
during the day on average and diversify the risks associated with one RE technology only. Once
the cost of CSP installation declines, its storage capability will make it an extremely attractive
option for assisting with peak load production.
3.2 Energy Price Outcomes
The most striking outcome of the REIPPPP has been the decline in average energy prices over
time for all technologies except small hydro, as shown in Table 9 above. This has resulted in a
declining weighted average energy tariff (Figure 3) and is an important step for renewable energy
IPPs in achieving grid parity, whereby the prices of new renewable energy sources are now
cheaper than energy from conventional fuel sources.
Due to the competitiveness of the bids received in BW 4, the DOE decided to make an over-
allocation to preferred bidders in two stages. In the first stage, BW 4(a), the DOE awarded the 13
highest ranked bid responses received. In the second stage, BW 4(b), the DOE awarded another 13
projects as preferred bidders, selecting bids that had ranked 14th to 26th. Because the BW 4(b)
projects were lower ranked bids with higher tariffs, BW 4(b) has been included before BW 4(a) in
Figure 3 below to best represent the downward trend in tariffs.
Figure 3: Weighted Average Bid Tariff (across all selected projects) per Bid Window Source:Authors’calculationsfromDOEIPPofficedataandEberhardetal(2014).Note:BW3.5excludedfromthisillustration*WeightingbyshareofContractedCapacityforthatRound.Alltariffsarereportedasattimeofbid.
BW 1 BW 2 BW 3 BW 4(b) BW 4(a) Blended weighted average tariff
(all technologies) 202 128 95 77 70
Solar PV average tariff 276 165 99 85 79 Wind average tariff 114 90 74 72 62
-
50
100
150
200
250
300
ZA
R c
/ kW
h
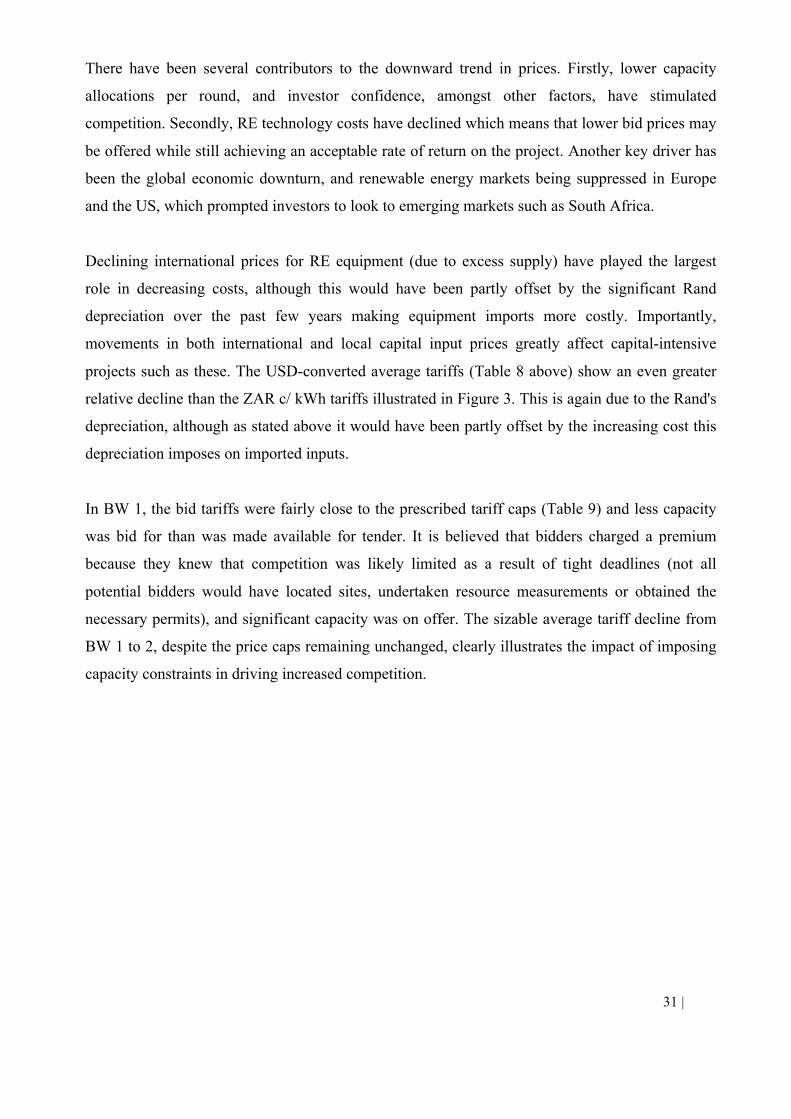
31 | Page
There have been several contributors to the downward trend in prices. Firstly, lower capacity
allocations per round, and investor confidence, amongst other factors, have stimulated
competition. Secondly, RE technology costs have declined which means that lower bid prices may
be offered while still achieving an acceptable rate of return on the project. Another key driver has
been the global economic downturn, and renewable energy markets being suppressed in Europe
and the US, which prompted investors to look to emerging markets such as South Africa.
Declining international prices for RE equipment (due to excess supply) have played the largest
role in decreasing costs, although this would have been partly offset by the significant Rand
depreciation over the past few years making equipment imports more costly. Importantly,
movements in both international and local capital input prices greatly affect capital-intensive
projects such as these. The USD-converted average tariffs (Table 8 above) show an even greater
relative decline than the ZAR c/ kWh tariffs illustrated in Figure 3. This is again due to the Rand's
depreciation, although as stated above it would have been partly offset by the increasing cost this
depreciation imposes on imported inputs.
In BW 1, the bid tariffs were fairly close to the prescribed tariff caps (Table 9) and less capacity
was bid for than was made available for tender. It is believed that bidders charged a premium
because they knew that competition was likely limited as a result of tight deadlines (not all
potential bidders would have located sites, undertaken resource measurements or obtained the
necessary permits), and significant capacity was on offer. The sizable average tariff decline from
BW 1 to 2, despite the price caps remaining unchanged, clearly illustrates the impact of imposing
capacity constraints in driving increased competition.
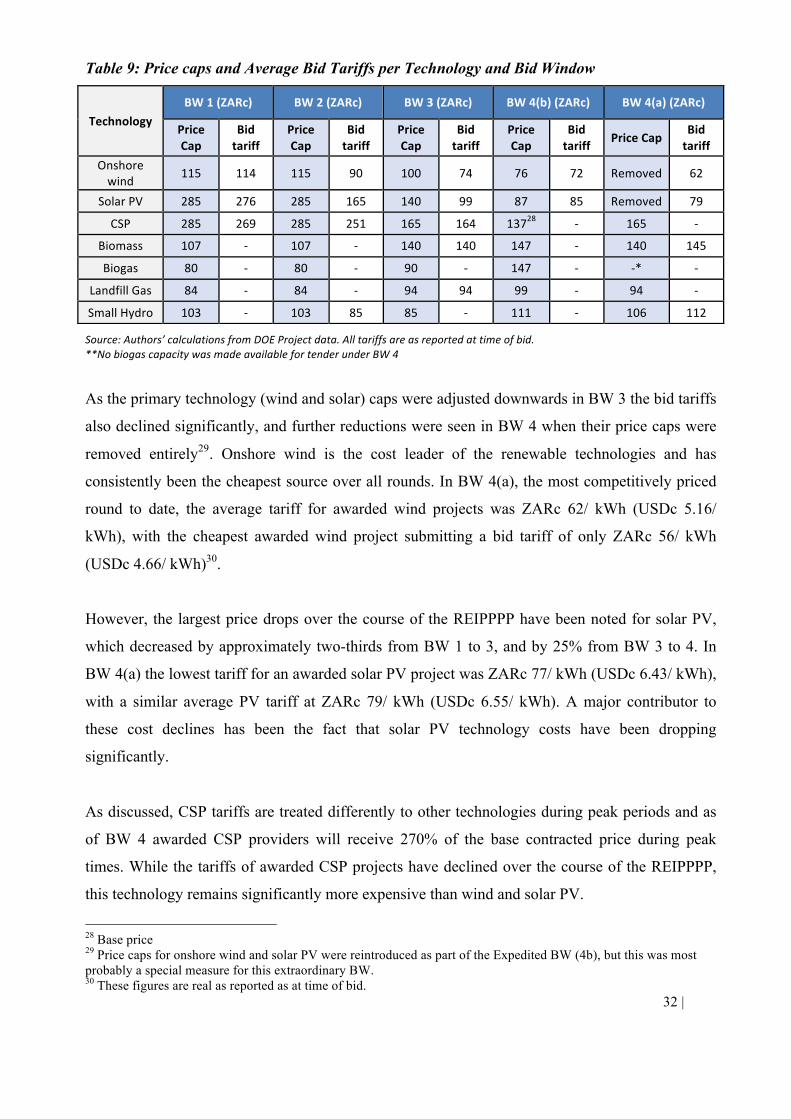
32 | Page
Table 9: Price caps and Average Bid Tariffs per Technology and Bid Window
Source:Authors’calculationsfromDOEProjectdata.Alltariffsareasreportedattimeofbid.**NobiogascapacitywasmadeavailablefortenderunderBW4
As the primary technology (wind and solar) caps were adjusted downwards in BW 3 the bid tariffs
also declined significantly, and further reductions were seen in BW 4 when their price caps were
removed entirely29. Onshore wind is the cost leader of the renewable technologies and has
consistently been the cheapest source over all rounds. In BW 4(a), the most competitively priced
round to date, the average tariff for awarded wind projects was ZARc 62/ kWh (USDc 5.16/
kWh), with the cheapest awarded wind project submitting a bid tariff of only ZARc 56/ kWh
(USDc 4.66/ kWh)30.
However, the largest price drops over the course of the REIPPPP have been noted for solar PV,
which decreased by approximately two-thirds from BW 1 to 3, and by 25% from BW 3 to 4. In
BW 4(a) the lowest tariff for an awarded solar PV project was ZARc 77/ kWh (USDc 6.43/ kWh),
with a similar average PV tariff at ZARc 79/ kWh (USDc 6.55/ kWh). A major contributor to
these cost declines has been the fact that solar PV technology costs have been dropping
significantly.
As discussed, CSP tariffs are treated differently to other technologies during peak periods and as
of BW 4 awarded CSP providers will receive 270% of the base contracted price during peak
times. While the tariffs of awarded CSP projects have declined over the course of the REIPPPP,
this technology remains significantly more expensive than wind and solar PV.
28 Base price 29 Price caps for onshore wind and solar PV were reintroduced as part of the Expedited BW (4b), but this was most probably a special measure for this extraordinary BW. 30 These figures are real as reported as at time of bid.
TechnologyBW1(ZARc) BW2(ZARc) BW3(ZARc) BW4(b)(ZARc) BW4(a)(ZARc)
PriceCap
Bidtariff
PriceCap
Bidtariff
PriceCap
Bidtariff
PriceCap
Bidtariff PriceCap
Bidtariff
Onshorewind 115 114 115 90 100 74 76 72 Removed 62
SolarPV 285 276 285 165 140 99 87 85 Removed 79
CSP 285 269 285 251 165 164 13728 - 165 -
Biomass 107 - 107 - 140 140 147 - 140 145
Biogas 80 - 80 - 90 - 147 - -* -
LandfillGas 84 - 84 - 94 94 99 - 94 -
SmallHydro 103 - 103 85 85 - 111 - 106 112
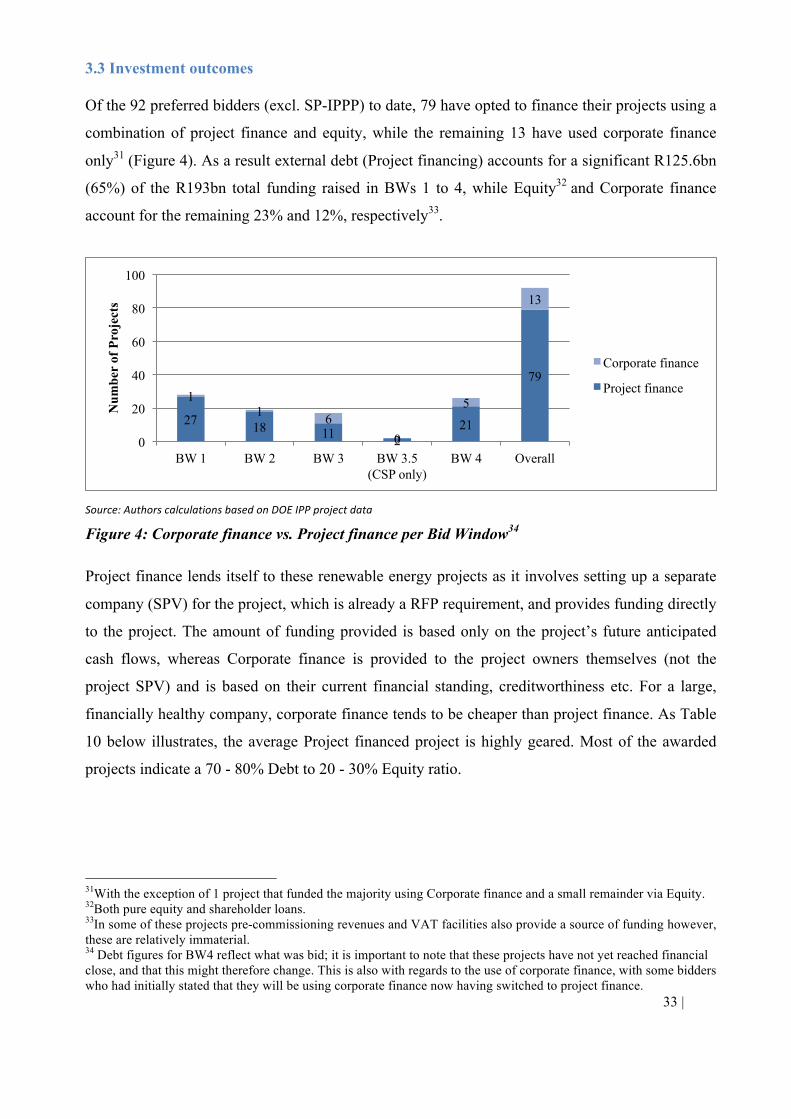
33 | Page
3.3 Investment outcomes
Of the 92 preferred bidders (excl. SP-IPPP) to date, 79 have opted to finance their projects using a
combination of project finance and equity, while the remaining 13 have used corporate finance
only31 (Figure 4). As a result external debt (Project financing) accounts for a significant R125.6bn
(65%) of the R193bn total funding raised in BWs 1 to 4, while Equity32 and Corporate finance
account for the remaining 23% and 12%, respectively33.
Source:AuthorscalculationsbasedonDOEIPPprojectdata
Figure 4: Corporate finance vs. Project finance per Bid Window34
Project finance lends itself to these renewable energy projects as it involves setting up a separate
company (SPV) for the project, which is already a RFP requirement, and provides funding directly
to the project. The amount of funding provided is based only on the project’s future anticipated
cash flows, whereas Corporate finance is provided to the project owners themselves (not the
project SPV) and is based on their current financial standing, creditworthiness etc. For a large,
financially healthy company, corporate finance tends to be cheaper than project finance. As Table
10 below illustrates, the average Project financed project is highly geared. Most of the awarded
projects indicate a 70 - 80% Debt to 20 - 30% Equity ratio.
31With the exception of 1 project that funded the majority using Corporate finance and a small remainder via Equity. 32Both pure equity and shareholder loans. 33In some of these projects pre-commissioning revenues and VAT facilities also provide a source of funding however, these are relatively immaterial. 34 Debt figures for BW4 reflect what was bid; it is important to note that these projects have not yet reached financial close, and that this might therefore change. This is also with regards to the use of corporate finance, with some bidders who had initially stated that they will be using corporate finance now having switched to project finance.
27 18 11 2 21
79 1
1 6 0
5
13
0
20
40
60
80
100
BW 1 BW 2 BW 3 BW 3.5 (CSP only)
BW 4 Overall
Num
ber
of P
roje
cts
Corporate finance
Project finance
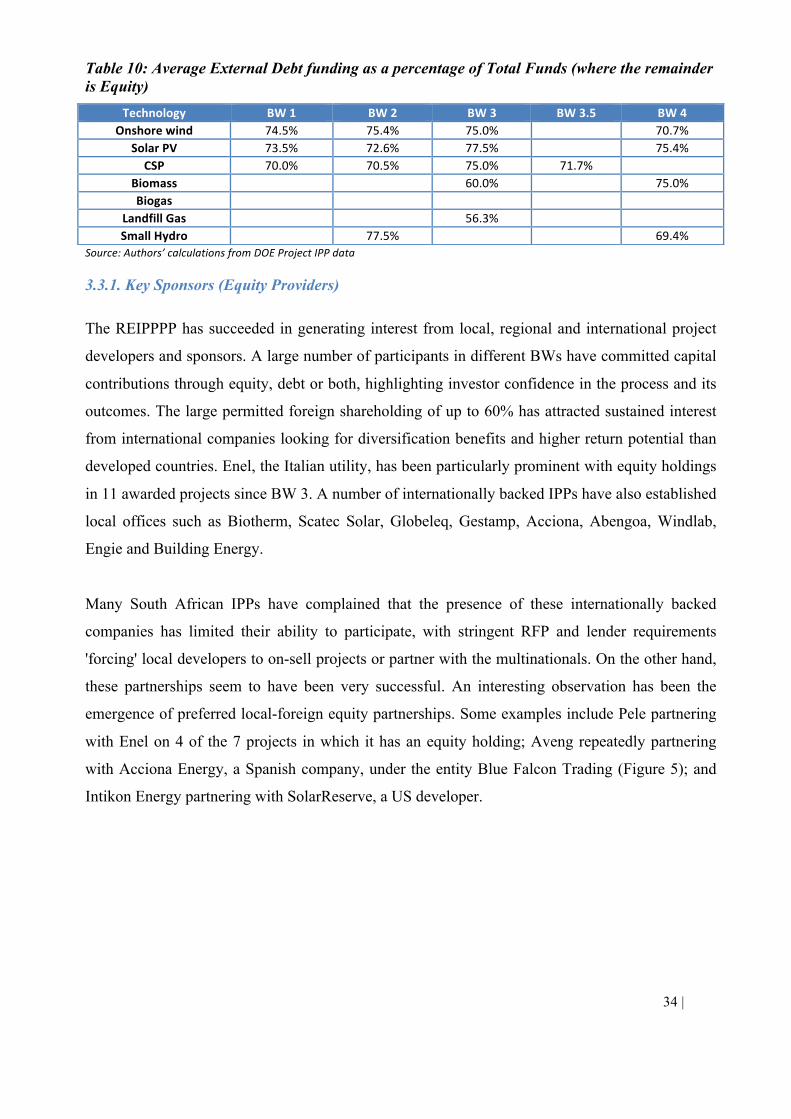
34 | Page
Table 10: Average External Debt funding as a percentage of Total Funds (where the remainder is Equity)
Source:Authors’calculationsfromDOEProjectIPPdata
3.3.1. Key Sponsors (Equity Providers)
The REIPPPP has succeeded in generating interest from local, regional and international project
developers and sponsors. A large number of participants in different BWs have committed capital
contributions through equity, debt or both, highlighting investor confidence in the process and its
outcomes. The large permitted foreign shareholding of up to 60% has attracted sustained interest
from international companies looking for diversification benefits and higher return potential than
developed countries. Enel, the Italian utility, has been particularly prominent with equity holdings
in 11 awarded projects since BW 3. A number of internationally backed IPPs have also established
local offices such as Biotherm, Scatec Solar, Globeleq, Gestamp, Acciona, Abengoa, Windlab,
Engie and Building Energy.
Many South African IPPs have complained that the presence of these internationally backed
companies has limited their ability to participate, with stringent RFP and lender requirements
'forcing' local developers to on-sell projects or partner with the multinationals. On the other hand,
these partnerships seem to have been very successful. An interesting observation has been the
emergence of preferred local-foreign equity partnerships. Some examples include Pele partnering
with Enel on 4 of the 7 projects in which it has an equity holding; Aveng repeatedly partnering
with Acciona Energy, a Spanish company, under the entity Blue Falcon Trading (Figure 5); and
Intikon Energy partnering with SolarReserve, a US developer.
Technology BW1 BW2 BW3 BW3.5 BW4Onshorewind 74.5% 75.4% 75.0%
70.7%
SolarPV 73.5% 72.6% 77.5%
75.4%CSP 70.0% 70.5% 75.0% 71.7%
Biomass
60.0%
75.0%
Biogas
LandfillGas
56.3%
SmallHydro
77.5%
69.4%
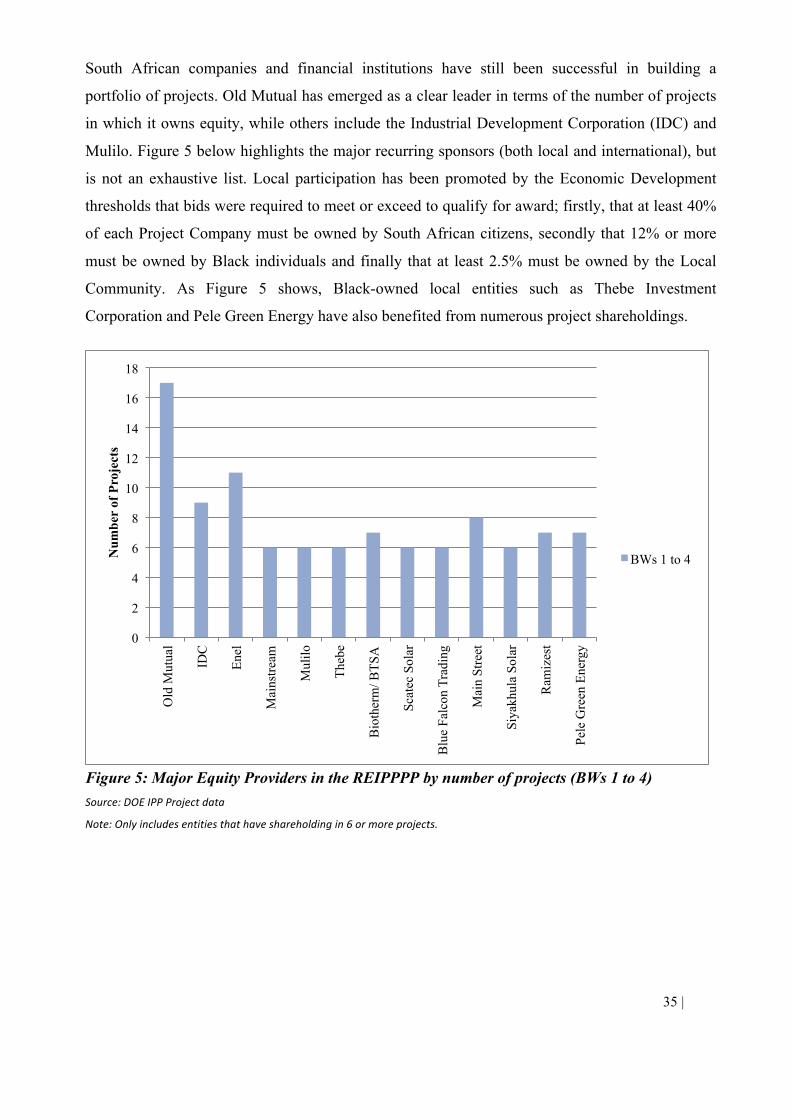
35 | Page
South African companies and financial institutions have still been successful in building a
portfolio of projects. Old Mutual has emerged as a clear leader in terms of the number of projects
in which it owns equity, while others include the Industrial Development Corporation (IDC) and
Mulilo. Figure 5 below highlights the major recurring sponsors (both local and international), but
is not an exhaustive list. Local participation has been promoted by the Economic Development
thresholds that bids were required to meet or exceed to qualify for award; firstly, that at least 40%
of each Project Company must be owned by South African citizens, secondly that 12% or more
must be owned by Black individuals and finally that at least 2.5% must be owned by the Local
Community. As Figure 5 shows, Black-owned local entities such as Thebe Investment
Corporation and Pele Green Energy have also benefited from numerous project shareholdings.
Figure 5: Major Equity Providers in the REIPPPP by number of projects (BWs 1 to 4) Source:DOEIPPProjectdata
Note:Onlyincludesentitiesthathaveshareholdingin6ormoreprojects.
0
2
4
6
8
10
12
14
16
18
Old
Mut
ual
IDC
Enel
Mai
nstre
am
Mul
ilo
Theb
e
Bio
ther
m/ B
TSA
Scat
ec S
olar
Blu
e Fa
lcon
Tra
ding
Mai
n St
reet
Siya
khul
a So
lar
Ram
izes
t
Pele
Gre
en E
nerg
y
Num
ber
of P
roje
cts
BWs 1 to 4
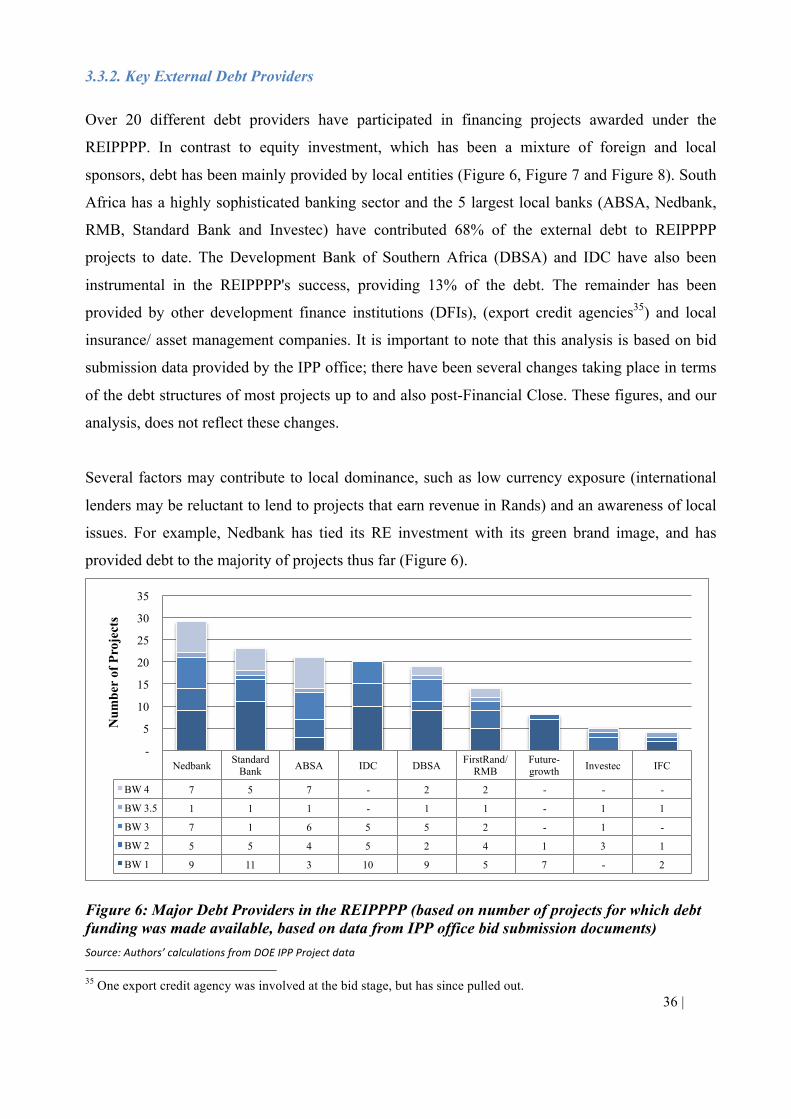
36 | Page
3.3.2. Key External Debt Providers
Over 20 different debt providers have participated in financing projects awarded under the
REIPPPP. In contrast to equity investment, which has been a mixture of foreign and local
sponsors, debt has been mainly provided by local entities (Figure 6, Figure 7 and Figure 8). South
Africa has a highly sophisticated banking sector and the 5 largest local banks (ABSA, Nedbank,
RMB, Standard Bank and Investec) have contributed 68% of the external debt to REIPPPP
projects to date. The Development Bank of Southern Africa (DBSA) and IDC have also been
instrumental in the REIPPPP's success, providing 13% of the debt. The remainder has been
provided by other development finance institutions (DFIs), (export credit agencies35) and local
insurance/ asset management companies. It is important to note that this analysis is based on bid
submission data provided by the IPP office; there have been several changes taking place in terms
of the debt structures of most projects up to and also post-Financial Close. These figures, and our
analysis, does not reflect these changes.
Several factors may contribute to local dominance, such as low currency exposure (international
lenders may be reluctant to lend to projects that earn revenue in Rands) and an awareness of local
issues. For example, Nedbank has tied its RE investment with its green brand image, and has
provided debt to the majority of projects thus far (Figure 6).
Figure 6: Major Debt Providers in the REIPPPP (based on number of projects for which debt funding was made available, based on data from IPP office bid submission documents) Source:Authors’calculationsfromDOEIPPProjectdata 35 One export credit agency was involved at the bid stage, but has since pulled out.
Nedbank Standard Bank ABSA IDC DBSA FirstRand/
RMB Future-growth Investec IFC
BW 4 7 5 7 - 2 2 - - -
BW 3.5 1 1 1 - 1 1 - 1 1
BW 3 7 1 6 5 5 2 - 1 -
BW 2 5 5 4 5 2 4 1 3 1
BW 1 9 11 3 10 9 5 7 - 2
-
5
10
15
20
25
30
35
Num
ber
of P
roje
cts
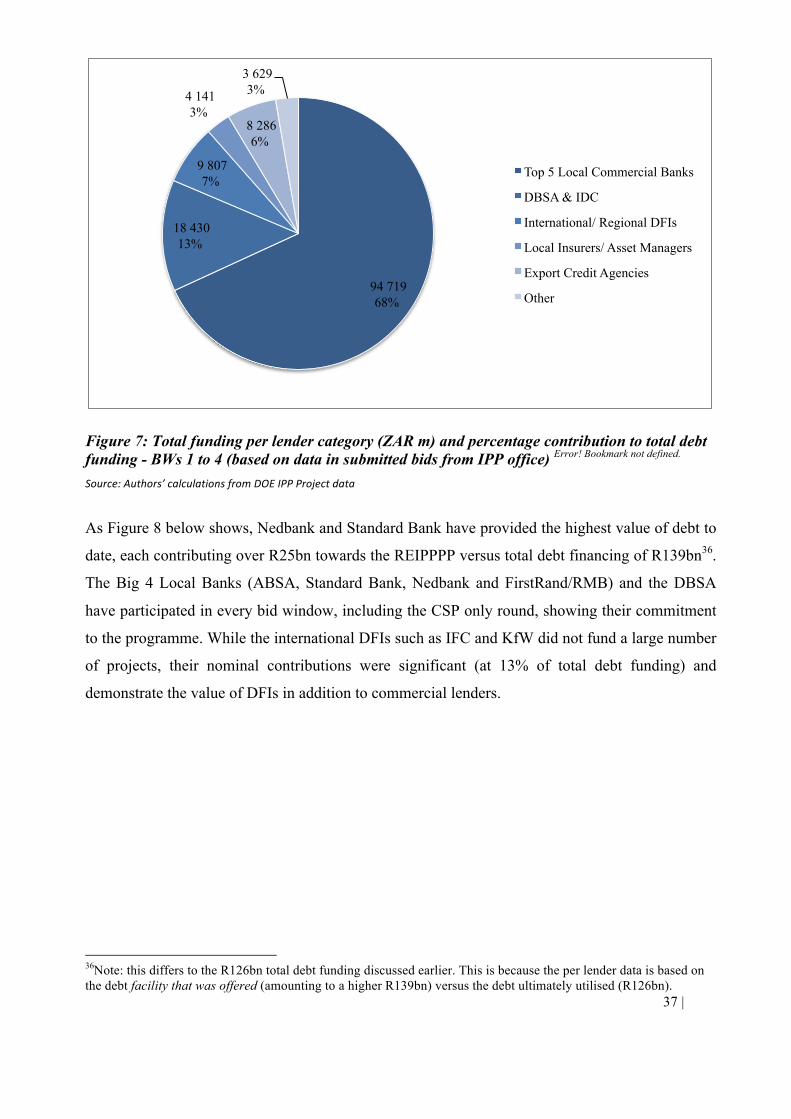
37 | Page
Figure 7: Total funding per lender category (ZAR m) and percentage contribution to total debt funding - BWs 1 to 4 (based on data in submitted bids from IPP office) Error! Bookmark not defined. Source:Authors’calculationsfromDOEIPPProjectdata
As Figure 8 below shows, Nedbank and Standard Bank have provided the highest value of debt to
date, each contributing over R25bn towards the REIPPPP versus total debt financing of R139bn36.
The Big 4 Local Banks (ABSA, Standard Bank, Nedbank and FirstRand/RMB) and the DBSA
have participated in every bid window, including the CSP only round, showing their commitment
to the programme. While the international DFIs such as IFC and KfW did not fund a large number
of projects, their nominal contributions were significant (at 13% of total debt funding) and
demonstrate the value of DFIs in addition to commercial lenders.
36Note: this differs to the R126bn total debt funding discussed earlier. This is because the per lender data is based on the debt facility that was offered (amounting to a higher R139bn) versus the debt ultimately utilised (R126bn).
94 719 68%
18 430 13%
9 807 7%
4 141 3%
8 286 6%
3 629 3%
Top 5 Local Commercial Banks
DBSA & IDC
International/ Regional DFIs
Local Insurers/ Asset Managers
Export Credit Agencies
Other
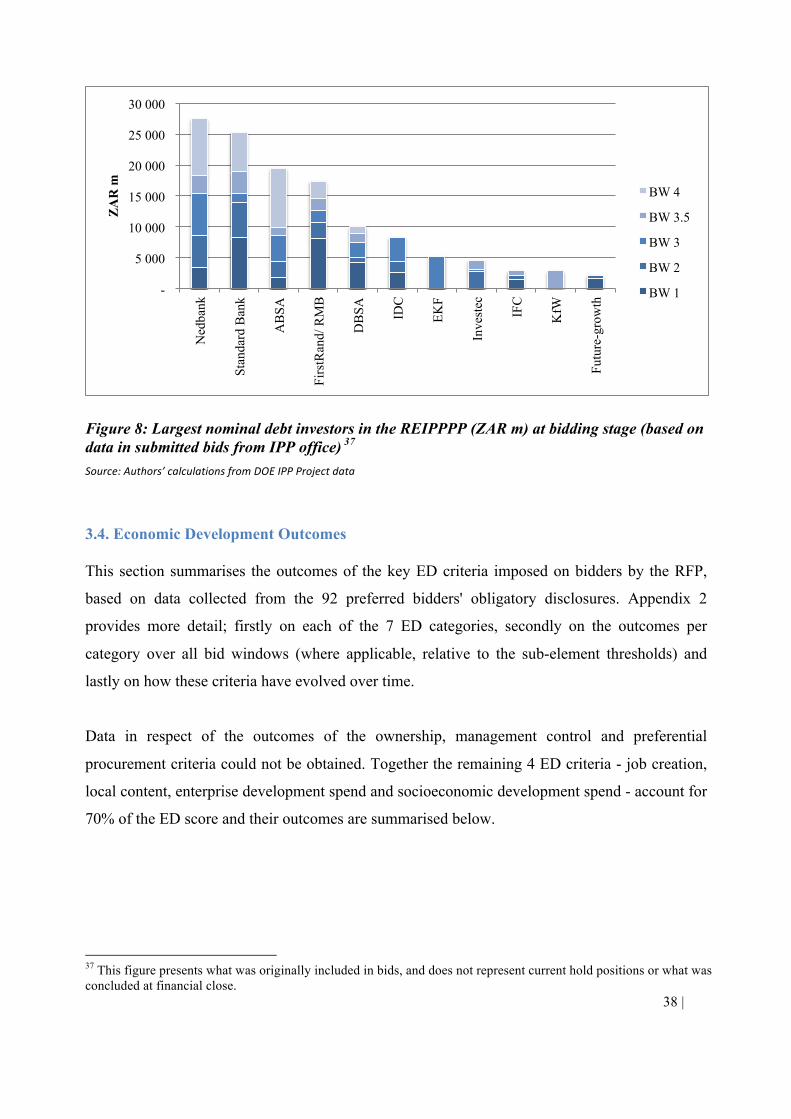
38 | Page
Figure 8: Largest nominal debt investors in the REIPPPP (ZAR m) at bidding stage (based on data in submitted bids from IPP office) 37 Source:Authors’calculationsfromDOEIPPProjectdata
3.4. Economic Development Outcomes
This section summarises the outcomes of the key ED criteria imposed on bidders by the RFP,
based on data collected from the 92 preferred bidders' obligatory disclosures. Appendix 2
provides more detail; firstly on each of the 7 ED categories, secondly on the outcomes per
category over all bid windows (where applicable, relative to the sub-element thresholds) and
lastly on how these criteria have evolved over time.
Data in respect of the outcomes of the ownership, management control and preferential
procurement criteria could not be obtained. Together the remaining 4 ED criteria - job creation,
local content, enterprise development spend and socioeconomic development spend - account for
70% of the ED score and their outcomes are summarised below.
37 This figure presents what was originally included in bids, and does not represent current hold positions or what was concluded at financial close.
-
5 000
10 000
15 000
20 000
25 000
30 000
Ned
bank
Stan
dard
Ban
k
AB
SA
Firs
tRan
d/ R
MB
DB
SA
IDC
EKF
Inve
stec
IFC
KfW
Futu
re-g
row
th
ZA
R m
BW 4
BW 3.5
BW 3
BW 2
BW 1
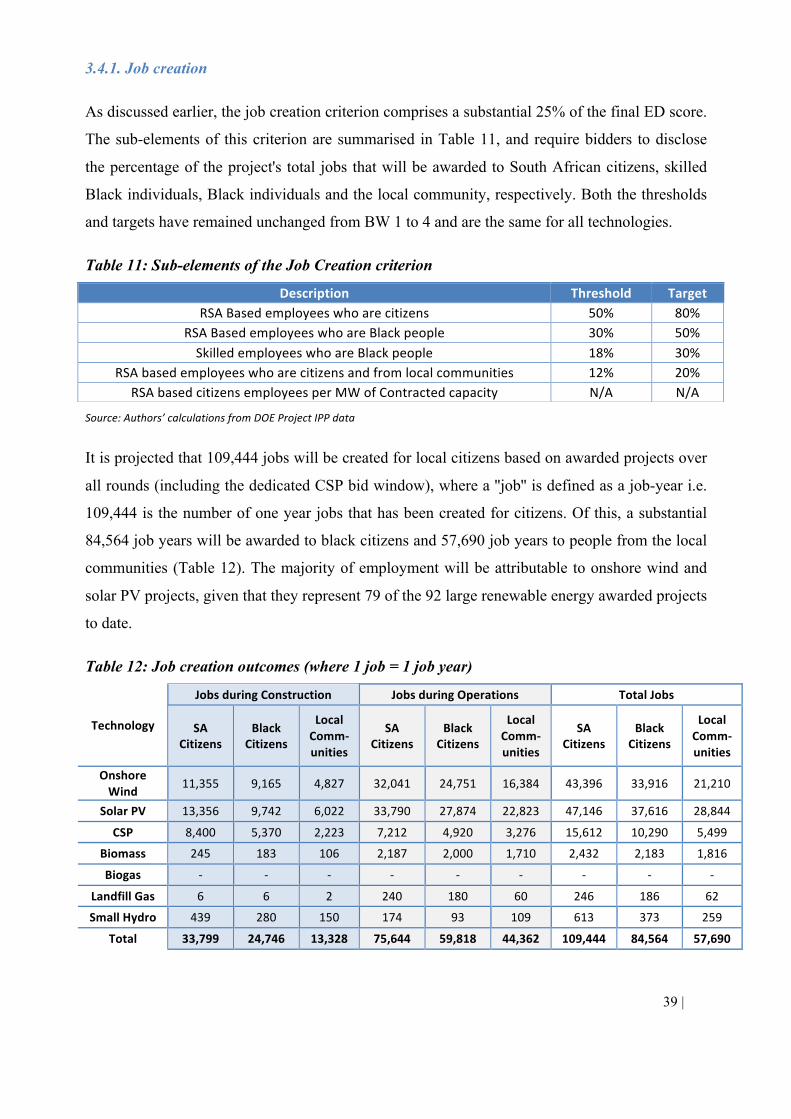
39 | Page
3.4.1. Job creation
As discussed earlier, the job creation criterion comprises a substantial 25% of the final ED score.
The sub-elements of this criterion are summarised in Table 11, and require bidders to disclose
the percentage of the project's total jobs that will be awarded to South African citizens, skilled
Black individuals, Black individuals and the local community, respectively. Both the thresholds
and targets have remained unchanged from BW 1 to 4 and are the same for all technologies.
Table 11: Sub-elements of the Job Creation criterion
Source:Authors’calculationsfromDOEProjectIPPdata
It is projected that 109,444 jobs will be created for local citizens based on awarded projects over
all rounds (including the dedicated CSP bid window), where a ''job'' is defined as a job-year i.e.
109,444 is the number of one year jobs that has been created for citizens. Of this, a substantial
84,564 job years will be awarded to black citizens and 57,690 job years to people from the local
communities (Table 12). The majority of employment will be attributable to onshore wind and
solar PV projects, given that they represent 79 of the 92 large renewable energy awarded projects
to date.
Table 12: Job creation outcomes (where 1 job = 1 job year)
Description Threshold TargetRSABasedemployeeswhoarecitizens 50% 80%
RSABasedemployeeswhoareBlackpeople 30% 50%SkilledemployeeswhoareBlackpeople 18% 30%
RSAbasedemployeeswhoarecitizensandfromlocalcommunities 12% 20%RSAbasedcitizensemployeesperMWofContractedcapacity N/A N/A
Technology
JobsduringConstruction JobsduringOperations TotalJobs
SACitizens
BlackCitizens
LocalComm-unities
SACitizens
BlackCitizens
LocalComm-unities
SACitizens
BlackCitizens
LocalComm-unities
OnshoreWind 11,355 9,165 4,827 32,041 24,751 16,384 43,396 33,916 21,210
SolarPV 13,356 9,742 6,022 33,790 27,874 22,823 47,146 37,616 28,844
CSP 8,400 5,370 2,223 7,212 4,920 3,276 15,612 10,290 5,499
Biomass 245 183 106 2,187 2,000 1,710 2,432 2,183 1,816
Biogas - - - - - - - - -
LandfillGas 6 6 2 240 180 60 246 186 62
SmallHydro 439 280 150 174 93 109 613 373 259
Total 33,799 24,746 13,328 75,644 59,818 44,362 109,444 84,564 57,690
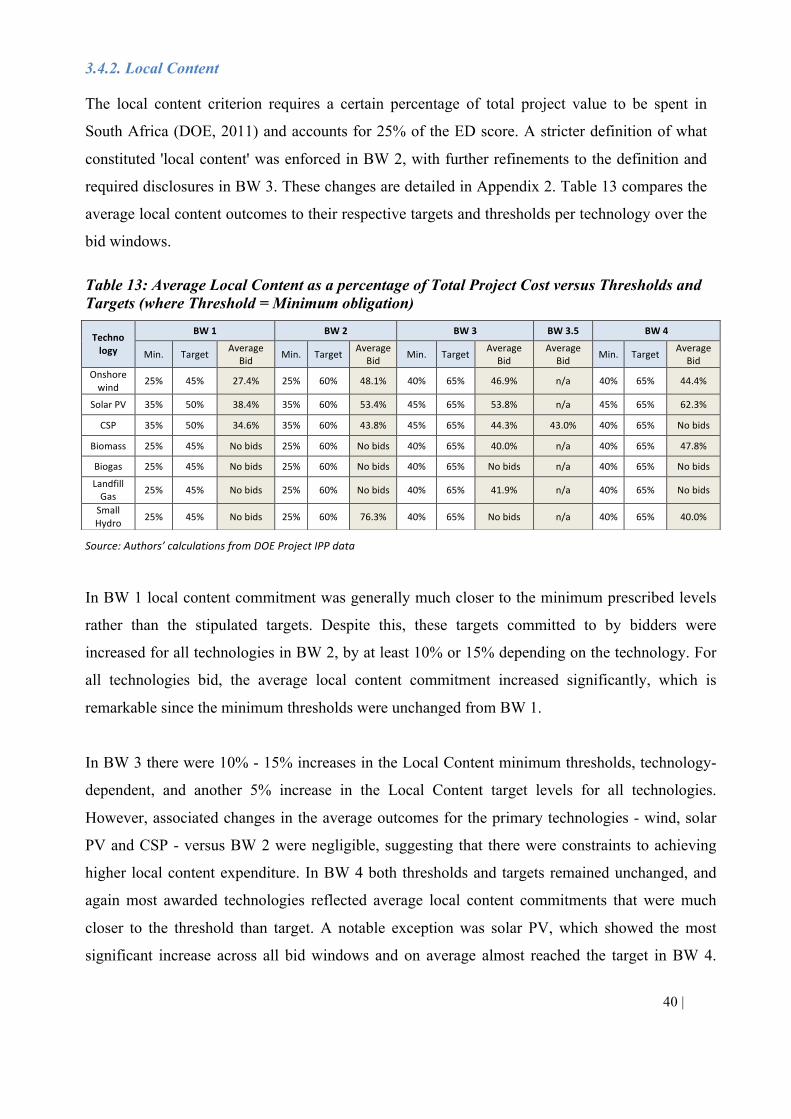
40 | Page
3.4.2. Local Content
The local content criterion requires a certain percentage of total project value to be spent in
South Africa (DOE, 2011) and accounts for 25% of the ED score. A stricter definition of what
constituted 'local content' was enforced in BW 2, with further refinements to the definition and
required disclosures in BW 3. These changes are detailed in Appendix 2. Table 13 compares the
average local content outcomes to their respective targets and thresholds per technology over the
bid windows.
Table 13: Average Local Content as a percentage of Total Project Cost versus Thresholds and Targets (where Threshold = Minimum obligation)
Source:Authors’calculationsfromDOEProjectIPPdata
In BW 1 local content commitment was generally much closer to the minimum prescribed levels
rather than the stipulated targets. Despite this, these targets committed to by bidders were
increased for all technologies in BW 2, by at least 10% or 15% depending on the technology. For
all technologies bid, the average local content commitment increased significantly, which is
remarkable since the minimum thresholds were unchanged from BW 1.
In BW 3 there were 10% - 15% increases in the Local Content minimum thresholds, technology-
dependent, and another 5% increase in the Local Content target levels for all technologies.
However, associated changes in the average outcomes for the primary technologies - wind, solar
PV and CSP - versus BW 2 were negligible, suggesting that there were constraints to achieving
higher local content expenditure. In BW 4 both thresholds and targets remained unchanged, and
again most awarded technologies reflected average local content commitments that were much
closer to the threshold than target. A notable exception was solar PV, which showed the most
significant increase across all bid windows and on average almost reached the target in BW 4.
Technology
BW1 BW2 BW3 BW3.5 BW4
Min. Target AverageBid Min. Target Average
Bid Min. Target AverageBid
AverageBid Min. Target Average
BidOnshorewind
25% 45% 27.4% 25% 60% 48.1% 40% 65% 46.9% n/a 40% 65% 44.4%
SolarPV 35% 50% 38.4% 35% 60% 53.4% 45% 65% 53.8% n/a 45% 65% 62.3%
CSP 35% 50% 34.6% 35% 60% 43.8% 45% 65% 44.3% 43.0% 40% 65% Nobids
Biomass 25% 45% Nobids 25% 60% Nobids 40% 65% 40.0% n/a 40% 65% 47.8%
Biogas 25% 45% Nobids 25% 60% Nobids 40% 65% Nobids n/a 40% 65% Nobids
LandfillGas 25% 45% Nobids 25% 60% Nobids 40% 65% 41.9% n/a 40% 65% Nobids
SmallHydro 25% 45% Nobids 25% 60% 76.3% 40% 65% Nobids n/a 40% 65% 40.0%
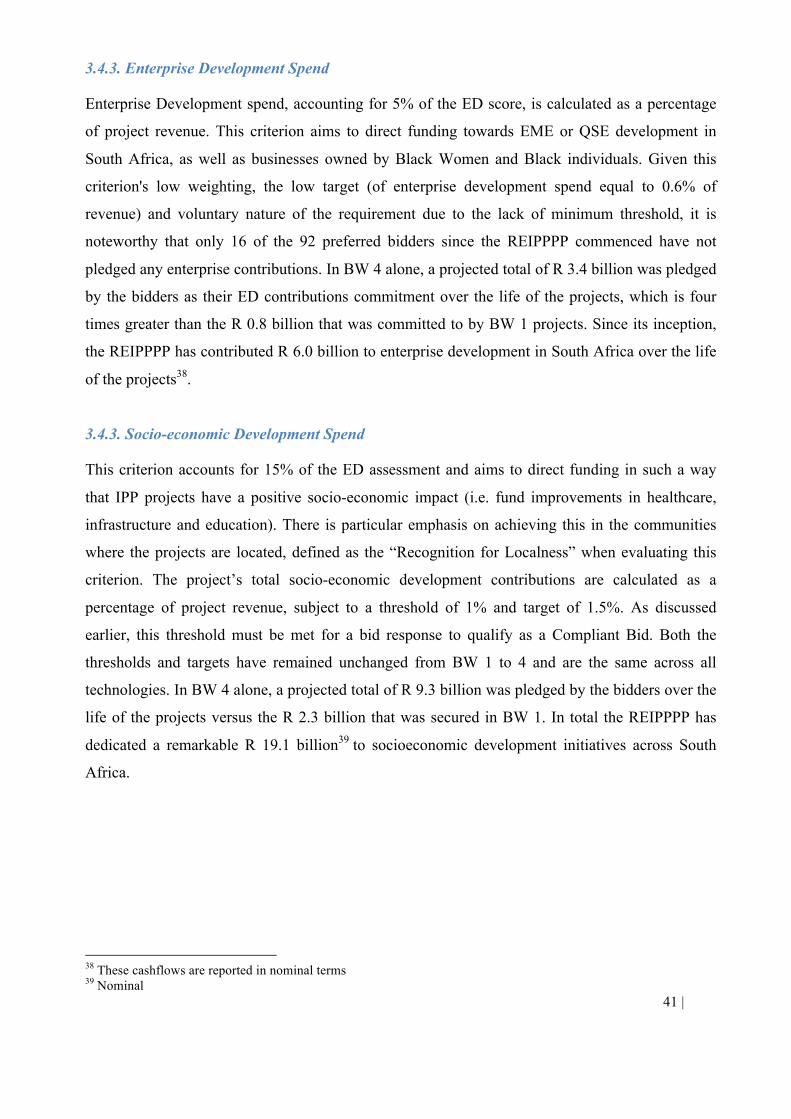
41 | Page
3.4.3. Enterprise Development Spend
Enterprise Development spend, accounting for 5% of the ED score, is calculated as a percentage
of project revenue. This criterion aims to direct funding towards EME or QSE development in
South Africa, as well as businesses owned by Black Women and Black individuals. Given this
criterion's low weighting, the low target (of enterprise development spend equal to 0.6% of
revenue) and voluntary nature of the requirement due to the lack of minimum threshold, it is
noteworthy that only 16 of the 92 preferred bidders since the REIPPPP commenced have not
pledged any enterprise contributions. In BW 4 alone, a projected total of R 3.4 billion was pledged
by the bidders as their ED contributions commitment over the life of the projects, which is four
times greater than the R 0.8 billion that was committed to by BW 1 projects. Since its inception,
the REIPPPP has contributed R 6.0 billion to enterprise development in South Africa over the life
of the projects38.
3.4.3. Socio-economic Development Spend
This criterion accounts for 15% of the ED assessment and aims to direct funding in such a way
that IPP projects have a positive socio-economic impact (i.e. fund improvements in healthcare,
infrastructure and education). There is particular emphasis on achieving this in the communities
where the projects are located, defined as the “Recognition for Localness” when evaluating this
criterion. The project’s total socio-economic development contributions are calculated as a
percentage of project revenue, subject to a threshold of 1% and target of 1.5%. As discussed
earlier, this threshold must be met for a bid response to qualify as a Compliant Bid. Both the
thresholds and targets have remained unchanged from BW 1 to 4 and are the same across all
technologies. In BW 4 alone, a projected total of R 9.3 billion was pledged by the bidders over the
life of the projects versus the R 2.3 billion that was secured in BW 1. In total the REIPPPP has
dedicated a remarkable R 19.1 billion39 to socioeconomic development initiatives across South
Africa.
38 These cashflows are reported in nominal terms 39 Nominal
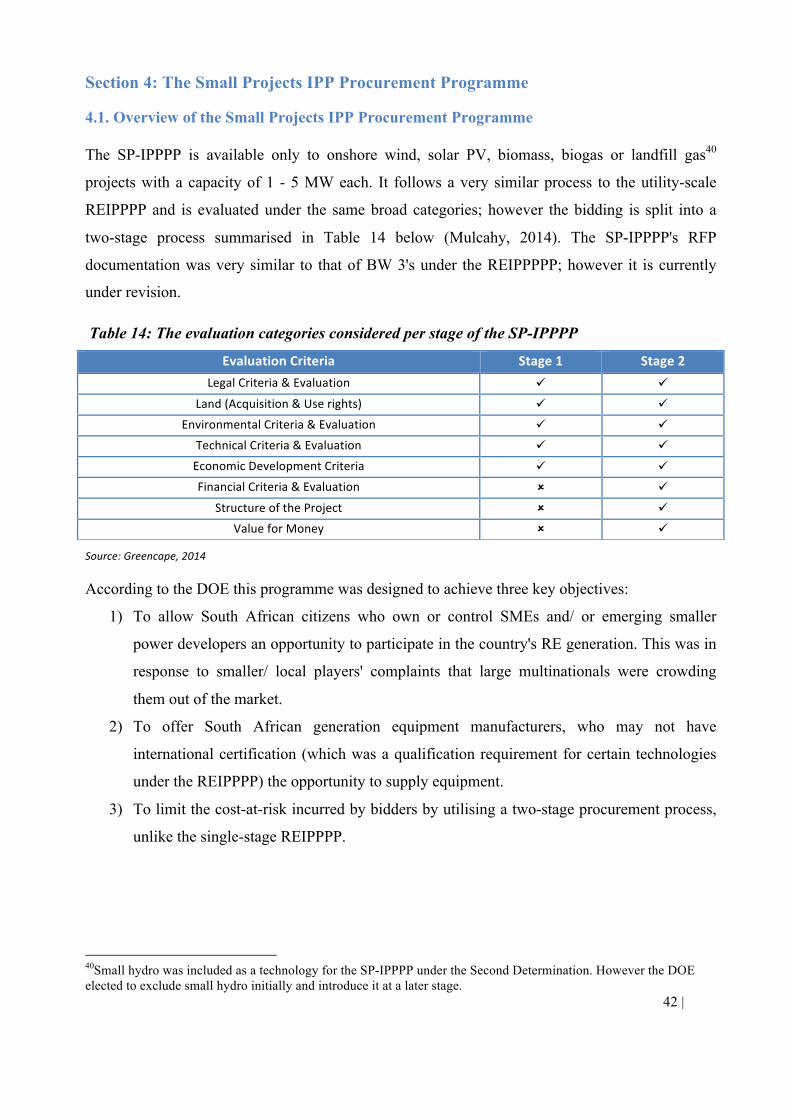
42 | Page
Section 4: The Small Projects IPP Procurement Programme
4.1. Overview of the Small Projects IPP Procurement Programme
The SP-IPPPP is available only to onshore wind, solar PV, biomass, biogas or landfill gas40
projects with a capacity of 1 - 5 MW each. It follows a very similar process to the utility-scale
REIPPPP and is evaluated under the same broad categories; however the bidding is split into a
two-stage process summarised in Table 14 below (Mulcahy, 2014). The SP-IPPPP's RFP
documentation was very similar to that of BW 3's under the REIPPPPP; however it is currently
under revision.
Table 14: The evaluation categories considered per stage of the SP-IPPPP
Source:Greencape,2014
According to the DOE this programme was designed to achieve three key objectives:
1) To allow South African citizens who own or control SMEs and/ or emerging smaller
power developers an opportunity to participate in the country's RE generation. This was in
response to smaller/ local players' complaints that large multinationals were crowding
them out of the market.
2) To offer South African generation equipment manufacturers, who may not have
international certification (which was a qualification requirement for certain technologies
under the REIPPPP) the opportunity to supply equipment.
3) To limit the cost-at-risk incurred by bidders by utilising a two-stage procurement process,
unlike the single-stage REIPPPP.
40Small hydro was included as a technology for the SP-IPPPP under the Second Determination. However the DOE elected to exclude small hydro initially and introduce it at a later stage.
EvaluationCriteria Stage1 Stage2LegalCriteria&Evaluation ü ü
Land(Acquisition&Userights) ü ü
EnvironmentalCriteria&Evaluation ü ü
TechnicalCriteria&Evaluation ü ü
EconomicDevelopmentCriteria ü ü
FinancialCriteria&Evaluation û ü
StructureoftheProject û ü
ValueforMoney û ü
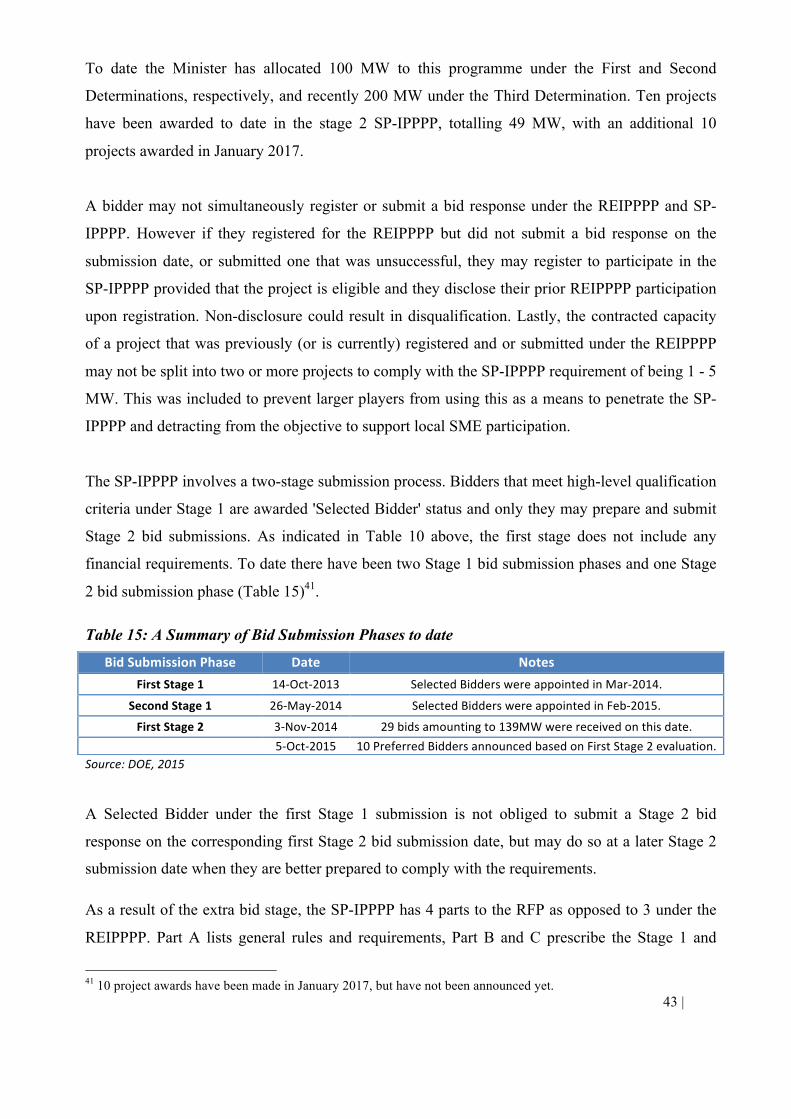
43 | Page
To date the Minister has allocated 100 MW to this programme under the First and Second
Determinations, respectively, and recently 200 MW under the Third Determination. Ten projects
have been awarded to date in the stage 2 SP-IPPPP, totalling 49 MW, with an additional 10
projects awarded in January 2017.
A bidder may not simultaneously register or submit a bid response under the REIPPPP and SP-
IPPPP. However if they registered for the REIPPPP but did not submit a bid response on the
submission date, or submitted one that was unsuccessful, they may register to participate in the
SP-IPPPP provided that the project is eligible and they disclose their prior REIPPPP participation
upon registration. Non-disclosure could result in disqualification. Lastly, the contracted capacity
of a project that was previously (or is currently) registered and or submitted under the REIPPPP
may not be split into two or more projects to comply with the SP-IPPPP requirement of being 1 - 5
MW. This was included to prevent larger players from using this as a means to penetrate the SP-
IPPPP and detracting from the objective to support local SME participation.
The SP-IPPPP involves a two-stage submission process. Bidders that meet high-level qualification
criteria under Stage 1 are awarded 'Selected Bidder' status and only they may prepare and submit
Stage 2 bid submissions. As indicated in Table 10 above, the first stage does not include any
financial requirements. To date there have been two Stage 1 bid submission phases and one Stage
2 bid submission phase (Table 15)41.
Table 15: A Summary of Bid Submission Phases to date
Source:DOE,2015
A Selected Bidder under the first Stage 1 submission is not obliged to submit a Stage 2 bid
response on the corresponding first Stage 2 bid submission date, but may do so at a later Stage 2
submission date when they are better prepared to comply with the requirements.
As a result of the extra bid stage, the SP-IPPPP has 4 parts to the RFP as opposed to 3 under the
REIPPPP. Part A lists general rules and requirements, Part B and C prescribe the Stage 1 and
41 10 project awards have been made in January 2017, but have not been announced yet.
BidSubmissionPhase Date NotesFirstStage1 14-Oct-2013 SelectedBidderswereappointedinMar-2014.
SecondStage1 26-May-2014 SelectedBidderswereappointedinFeb-2015.
FirstStage2 3-Nov-2014 29bidsamountingto139MWwerereceivedonthisdate.
5-Oct-2015 10PreferredBiddersannouncedbasedonFirstStage2evaluation.
44 | Page
Stage 2 Qualification Criteria, respectively, and Part D lists the Evaluation Criteria for all bid
responses that are found compliant under Part C (with the same broad 70% price: 30% economic
development weighting).
The Department decided to follow the two stage process to eliminate underprepared or under-
resourced bids early, thereby mitigating the risk of numerous new and inexperienced developers
incurring significant bid preparation costs on projects that may have little or no chance of success
(DOE, 2015). However in practice it has not been effective in achieving this, with many bidders
complaining that the transaction costs are still too high and due diligence is similar regardless of
the project size, therefore making small projects expensive and difficult to finance (Mulcahy,
2014).
4.2. Key features of the SP-IPPPP
4.2.1. General Requirements, Rules and Provisions (Part A of the RFP)
Unlike the REIPPPP, which prescribes that projects across technologies must sign a 20-year PPA,
projects under the Smalls programme may propose a Scheduled Operating Period between 5 and
20 years. This was allowed to acknowledge the different structuring of projects. For example, a
project that is financed by external debt will most likely require a longer operating period to repay
the loan than one that is funded by a related party or corporate financed. On the other hand, a
project without a dependable fuel source that may not last 20 years is able to match the operating
period with anticipated available supply.
Price caps per technology were the same as those in BW 3 above, with the exception of biogas,
which was capped at R0.90/ kWh versus R0.80/ kWh in the REIPPPP.
4.2.2. Stage 1 Qualification Criteria (Part B of the RFP)
4.2.2.1. Legal Criteria and Evaluation
Bidders must comply with 3 key criteria to pass this Stage 1 legal qualification. Firstly, they must
complete all returnable schedules contained in Volume 1, Part 2 to the RFP in the required form.
Secondly, when a bidder is a consortium, the consortium agreement or founding agreement must
45 | Page
be submitted and lastly, bidders must provide detailed information about the bidder, its members,
potential EPC Contractors and Operations Contractors, as well as Legal Advisors.
4.2.2.2. Land Acquisition and Land Use Criteria and Evaluation
The bidder must provide the registered address and co-ordinates of the Project Site, as well as
details of the registered owner. If the bidder is not the owner, they must submit information on
which rights they intend to acquire over the Site and a signed letter from the owner confirming he
is prepared to engage in such negotiations.
In addition a report from the bidders' legal advisors must be submitted detailing whether or not the
bidder will be required to undertake a land use change, subdivision, zoning applications and so
forth in respect of the Site.
Where landfill gas or municipal land will be used for the Project Site, a signed letter from the
relevant municipality stating that it has already engaged with the bidder, and is willing engage
further, must be submitted. Terms of how the two parties propose to enter into the land and
resource use arrangements must be clearly stated.
4.2.2.3. Environmental Criteria and Evaluation
The bidder must appoint an Independent Environmental Assessment Practitioner (EAP) and
submit the EAP's detailed CV. The EAP is responsible for assessing whether the proposed project
requires an environmental authorisation under the 2010 EIA Regulations, together with the 2010
Listing Notices. If the proposed project triggers any activity listed in the 2010 Listing Notices, the
EAP must prepare a signed report that includes the following:
- Activity Description of the proposed project (technology, size, height) and a description of the
activity/ies listed in the 2010 Listing Notices which are expected to be triggered.
- Locality or Sensitivity Map depicting the Project Site and containing all prescribed
information under this RFP.
46 | Page
- Draft Site Layout Plan of the Proposed Project.
- Identification and description of any reasonable alternatives considered to the above.
- Planning documents, including the identification of all environmental policies and plan that
are applicable to the proposed project.
- Information on the legislative context, including the identification of all relevant
environmental legislative requirements as well as the anticipated process and timeframe for
obtaining any required Environmental Consents.
- A Screening Report based on a Screening Process to identify potential environmental fatal
flaws, which assessment must adhere to all RFP requirements.
- Generate an initial stakeholder database through general discussions, which must at least
include details of landowners adjacent to the proposed Site.
In cases where the EAP does not believe that the proposed project triggers any of the above
Listing activities, they must prepare a signed statement substantiating this.
4.2.2.4. Technical Criteria and Evaluation
Each project must pass all the threshold criteria set out per technology. These requirements take
largely the same form as those in Part B of the REIPPPP (Section 2.2.6) and as such, only key
differences will be highlighted here.
- Under the REIPPPP, wind turbines used for proposed wind projects had to be internationally
certified42 and the submission of this certificate as proof was a threshold requirement. The SP-
IPPPP, however, does not require equipment to be internationally certified in an attempt to
encourage local manufacturing. Equipment is still required to comply with standards imposed
by the South African Bureau of Standards (SABS) and the Grid Codes. In cases where the
equipment is not internationally certified, the DOE recommends that bidders engage with
prospective lenders as early as possible in the procurement process to obtain their approval to
lend to such equipment.
42However this requirement of an international certification (in terms of the wind turbine's design) was not meant to exclude the local manufacturing of the turbine.
47 | Page
- For some technologies, requirements in respect of Forecast Energy Sales are less stringent
under the SP-IPPPP. For example, only 6 months of wind data is required versus the
REIPPPP's requirement of at least 365 days, and the wind assessment expert is only required
to have 3 years of relevant experience versus 5 years under the REIPPPP, respectively. Wind
data must still be collected in accordance with international (IEC) standards and (IEA)
recommended practices.
- Across technologies, instead of one resource assessment expert performing the forecast energy
sales report and another independent expert reviewing this as in the REIPPPP, the SP-IPPPP
expert is simply required to be independent of the bidder and no review is prescribed.
- All First Stage 1 projects must be capable of reaching COD by 2017.
- The SP-IPPPP does not prescribe that certain technologies used must be ''proven'' through a
particular track record, as is the case in the REIPPPP.
4.2.2.5. Economic Development Criteria and Evaluation
Under the REIPPPP, the ED qualification criteria related to South African Entity Participation and
B-BBEE Contributor Status Level (CSL). The SP-IPPPP adds three further requirements, namely
Shareholding by SMEs in the Project Company, Track Record and Local Content.
Firstly, bidders are required to tabulate the anticipated extent of South African Entity Participation
in the Project Company. Secondly, they must tabulate the anticipated shareholdings of SMEs in
this Company. This was done in an attempt to involve new developers and SMEs in the SP-IPPPP,
due to complaints that the large multinationals were crowding out smaller players in the REIPPPP.
They are also required to indicate the CSL in respect of each of the members, as well as the
Project Company itself, where available. Proof of the CSL is required through the provision of a
valid verification certificate (as is the case under the REIPPPP); however members with an annual
turnover of less than R1m may submit a certificate provided by a Chartered Accountant registered
with a professional board.
48 | Page
The "track record" requirement stipulates that bidders must provide the experience of each
member in planning and carrying out programmes in relation to preferential procurement,
enterprise development and socio-economic development. Lastly, bidders must indicate the
anticipated value of local content spend that they expect to achieve in their project and provide
details thereof. In respect of all above criteria, the DOE has the right to request further
information, based on which they can conduct a due diligence. In respect of this Part B
Qualification Criteria, the bidder will only 'pass' the qualification if the DOE determines that it has
responded satisfactorily to all required sub-clauses.
4.2.3. Stage 2 Qualification Criteria (Part C of the RFP)
Most criteria under this Part C are identical to Part B of the REIPPPP RFP in BW 3. Therefore
only noteworthy differences and key features will be discussed.
4.2.3.1. Financial Criteria and Evaluation
Part B (the Stage 1 Qualification) of the SP-IPPPP does not include any financial criteria. In Stage
2, two such criteria are assessed versus four under the REIPPPP. The first criterion is price and is
similar to the REIPPPP with the exception that only 30% of the price may be index-linked under
the partial indexation method, versus 20 - 50% for the REIPPPP.
The second criterion is the robustness and deliverability of the funding proposal, which only lists
requirements in respect of equity finance as well as senior and mezzanine debt funding, versus
equity finance, corporate finance and external debt requirements under the REIPPPP. Under this
requirement bidders are still required to provide a letter of support from each equity member
confirming that it has completed its due diligence of the project. Senior and mezzanine debt
financiers, however, are simply required to provide a letter in support of preliminary credit
approved term sheets, as well as a detailed plan for obtaining final credit approval. This differs to
the REIPPPP.
Finally, a noteworthy difference to the REIPPPP is that success payments are limited to 2.5% of
total project costs for projects to be developed under the SP-IPPPP. A schedule declaring all
success payments must be submitted. This is an important restriction to manage costs, considering
49 | Page
that the average success payment per awarded project under the REIPPPP was 2.9% and the
highest success payment on an individual project was11% of its total project cost.
4.2.3.2. Technical Criteria and Evaluation
These requirements are largely comparable to the BW 3 RFP Part B of the REIPPPP, introducing
more detailed requirements than in the previously discussed Stage 1 qualification.
4.2.3.3. Economic Development Criteria and Evaluation
A key objective of the SP-IPPPP was to ensure that the majority of participation came from South
Africans who are emerging, small power developers. As a result bidders are required to have a
40% South African Entity Participation at bid submission (as under the REIPPPP), thereafter
increasing to 60% within no more than one third of the Scheduled Operating Period.
Another notable difference to the REIPPPP is that SMEs are required to have a shareholding of at
least 10% in the Project Company at SP-IPPP bid submission, which must increase to 30% within
one third of the Scheduled Operating Period. In demonstrating compliance with the above two
increases over time, the bidders must submit a plan of how the increase in these respective
shareholdings will be achieved within the required period.
Finally, bidders must have a CSL of 5 and meet or exceed the minimum thresholds indicated in an
Economic Development Scorecard, as under the REIPPPP. Proof of compliance must be provided
through supporting documentation.
4.2.4. Stage 2 Evaluation Criteria (Part D of the RFP)
The evaluation weighting of 70% price/ 30% economic development criteria is the same as that of
the REIPPPP. However within the 30 points allocated to ED, the basket of criteria is weighted
slightly differently to the REIPPPP - as indicated in red text (Table 16).
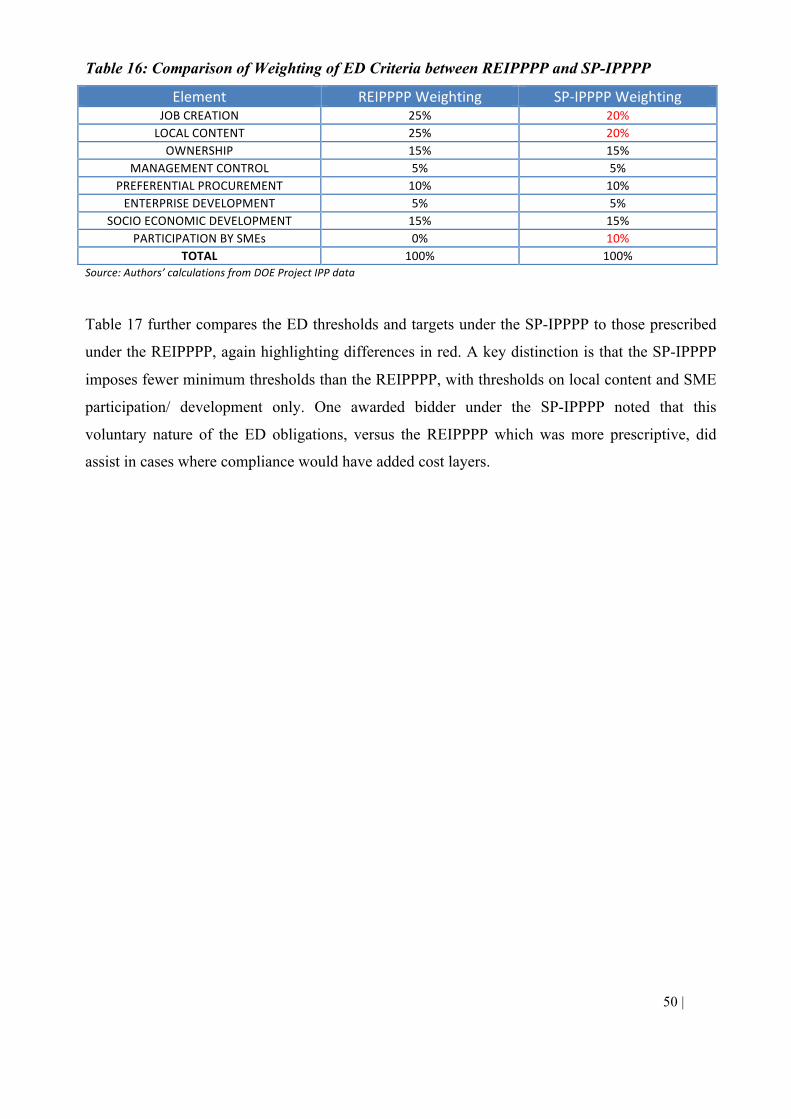
50 | Page
Table 16: Comparison of Weighting of ED Criteria between REIPPPP and SP-IPPPP
Source:Authors’calculationsfromDOEProjectIPPdata
Table 17 further compares the ED thresholds and targets under the SP-IPPPP to those prescribed
under the REIPPPP, again highlighting differences in red. A key distinction is that the SP-IPPPP
imposes fewer minimum thresholds than the REIPPPP, with thresholds on local content and SME
participation/ development only. One awarded bidder under the SP-IPPPP noted that this
voluntary nature of the ED obligations, versus the REIPPPP which was more prescriptive, did
assist in cases where compliance would have added cost layers.
Element REIPPPPWeighting SP-IPPPPWeightingJOBCREATION 25% 20%LOCALCONTENT 25% 20%OWNERSHIP 15% 15%
MANAGEMENTCONTROL 5% 5%PREFERENTIALPROCUREMENT 10% 10%ENTERPRISEDEVELOPMENT 5% 5%
SOCIOECONOMICDEVELOPMENT 15% 15%PARTICIPATIONBYSMEs 0% 10%
TOTAL 100% 100%
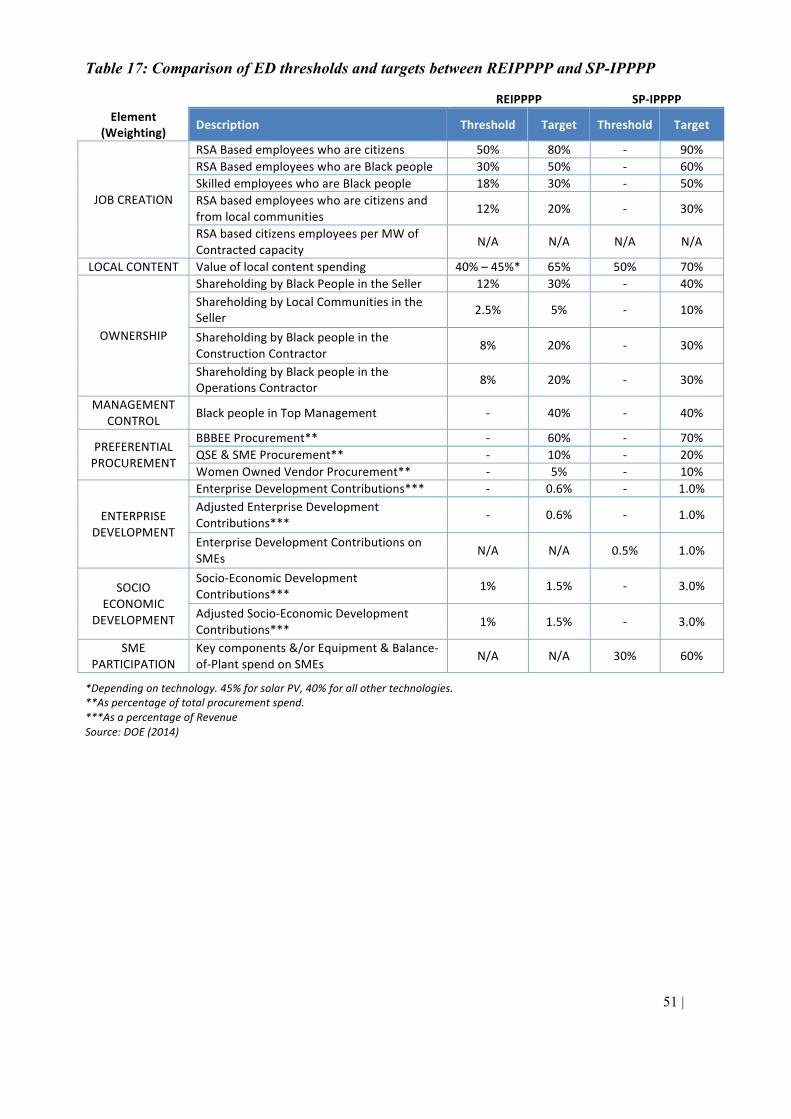
51 | Page
Table 17: Comparison of ED thresholds and targets between REIPPPP and SP-IPPPP
*Dependingontechnology.45%forsolarPV,40%forallothertechnologies.**Aspercentageoftotalprocurementspend.***AsapercentageofRevenueSource:DOE(2014)
REIPPPP SP-IPPPP
Element(Weighting) Description Threshold Target Threshold Target
JOBCREATION
RSABasedemployeeswhoarecitizens 50% 80% - 90%RSABasedemployeeswhoareBlackpeople 30% 50% - 60%SkilledemployeeswhoareBlackpeople 18% 30% - 50%RSAbasedemployeeswhoarecitizensandfromlocalcommunities 12% 20% - 30%
RSAbasedcitizensemployeesperMWofContractedcapacity
N/A N/A N/A N/A
LOCALCONTENT Valueoflocalcontentspending 40%–45%* 65% 50% 70%
OWNERSHIP
ShareholdingbyBlackPeopleintheSeller 12% 30% - 40%ShareholdingbyLocalCommunitiesintheSeller 2.5% 5% - 10%
ShareholdingbyBlackpeopleintheConstructionContractor
8% 20% - 30%
ShareholdingbyBlackpeopleintheOperationsContractor 8% 20% - 30%
MANAGEMENTCONTROL BlackpeopleinTopManagement - 40% - 40%
PREFERENTIALPROCUREMENT
BBBEEProcurement** - 60% - 70%QSE&SMEProcurement** - 10% - 20%WomenOwnedVendorProcurement** - 5% - 10%
ENTERPRISEDEVELOPMENT
EnterpriseDevelopmentContributions*** - 0.6% - 1.0%AdjustedEnterpriseDevelopmentContributions***
- 0.6% - 1.0%
EnterpriseDevelopmentContributionsonSMEs N/A N/A 0.5% 1.0%
SOCIOECONOMIC
DEVELOPMENT
Socio-EconomicDevelopmentContributions***
1% 1.5% - 3.0%
AdjustedSocio-EconomicDevelopmentContributions*** 1% 1.5% - 3.0%
SMEPARTICIPATION
Keycomponents&/orEquipment&Balance-of-PlantspendonSMEs
N/A N/A 30% 60%
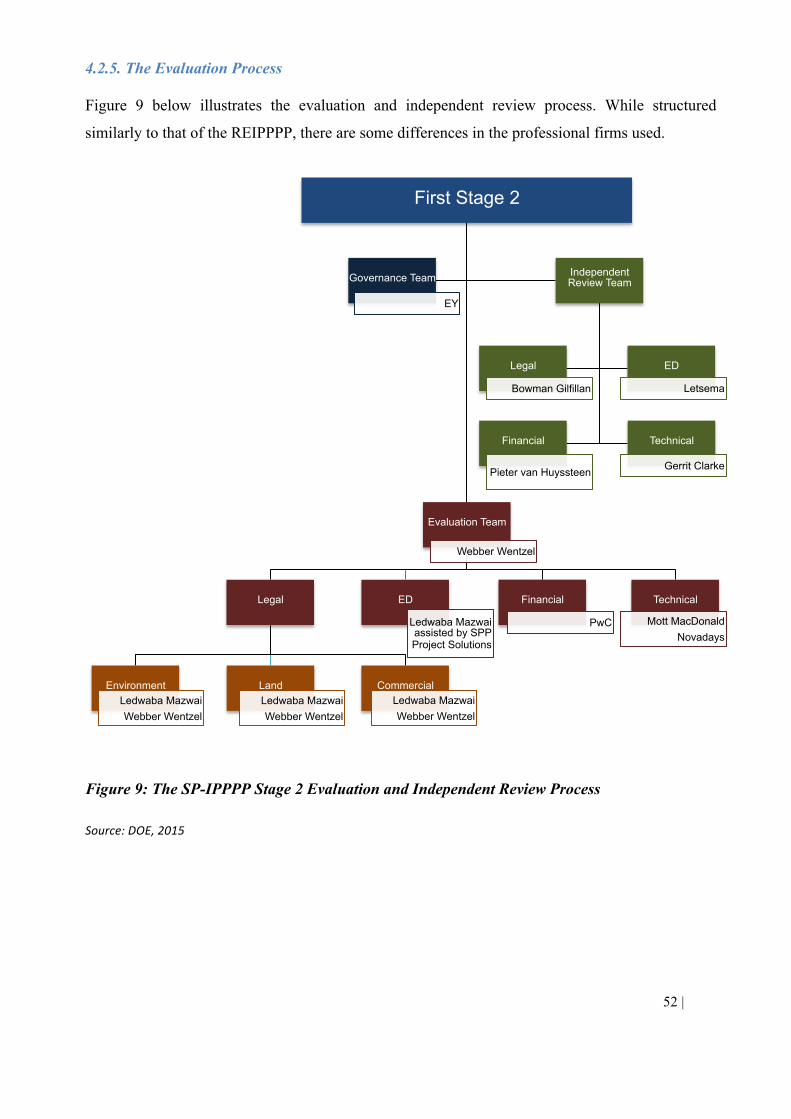
52 | Page
4.2.5. The Evaluation Process
Figure 9 below illustrates the evaluation and independent review process. While structured
similarly to that of the REIPPPP, there are some differences in the professional firms used.
Figure 9: The SP-IPPPP Stage 2 Evaluation and Independent Review Process
Source:DOE,2015
First Stage 2
Evaluation Team
Webber Wentzel
Legal
Environment Ledwaba Mazwai Webber Wentzel
Land Ledwaba Mazwai Webber Wentzel
Commercial Ledwaba Mazwai Webber Wentzel
ED
Ledwaba Mazwai assisted by SPP Project Solutions
Financial
PwC
Technical
Mott MacDonald Novadays
Governance Team
EY
Independent Review Team
Legal
Bowman Gilfillan
ED
Letsema
Financial
Pieter van Huyssteen
Technical
Gerrit Clarke
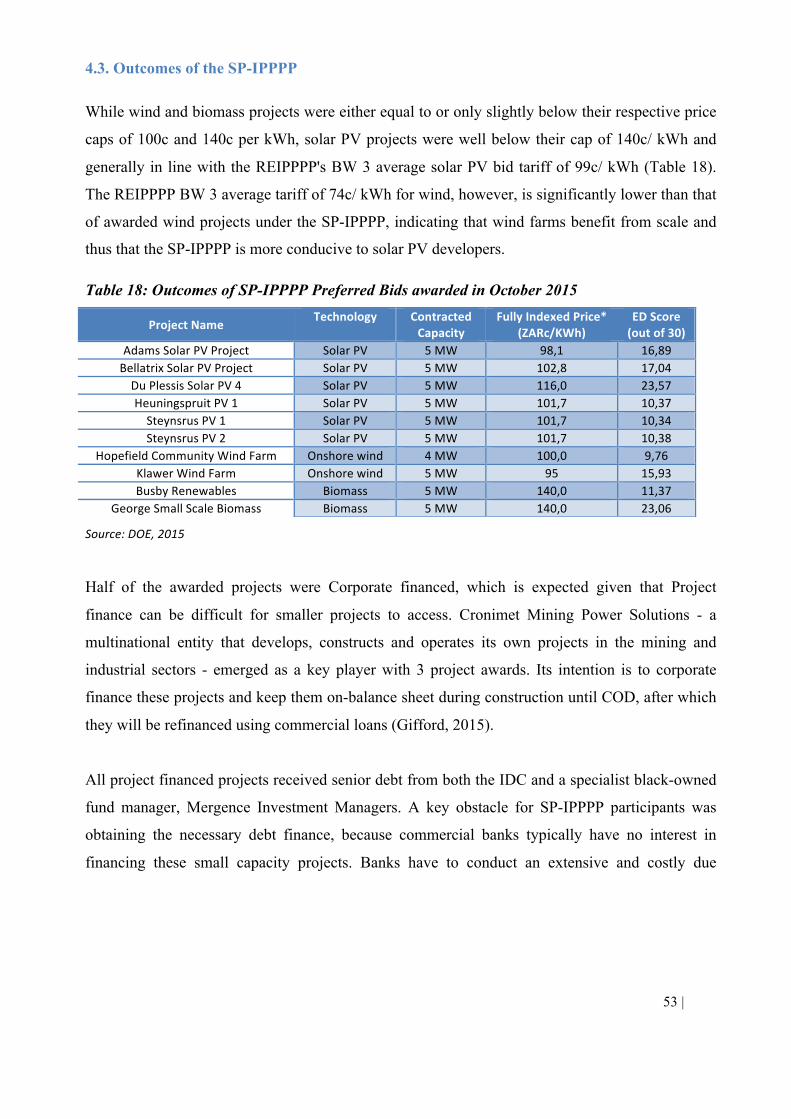
53 | Page
4.3. Outcomes of the SP-IPPPP
While wind and biomass projects were either equal to or only slightly below their respective price
caps of 100c and 140c per kWh, solar PV projects were well below their cap of 140c/ kWh and
generally in line with the REIPPPP's BW 3 average solar PV bid tariff of 99c/ kWh (Table 18).
The REIPPPP BW 3 average tariff of 74c/ kWh for wind, however, is significantly lower than that
of awarded wind projects under the SP-IPPPP, indicating that wind farms benefit from scale and
thus that the SP-IPPPP is more conducive to solar PV developers.
Table 18: Outcomes of SP-IPPPP Preferred Bids awarded in October 2015
Source:DOE,2015
Half of the awarded projects were Corporate financed, which is expected given that Project
finance can be difficult for smaller projects to access. Cronimet Mining Power Solutions - a
multinational entity that develops, constructs and operates its own projects in the mining and
industrial sectors - emerged as a key player with 3 project awards. Its intention is to corporate
finance these projects and keep them on-balance sheet during construction until COD, after which
they will be refinanced using commercial loans (Gifford, 2015).
All project financed projects received senior debt from both the IDC and a specialist black-owned
fund manager, Mergence Investment Managers. A key obstacle for SP-IPPPP participants was
obtaining the necessary debt finance, because commercial banks typically have no interest in
financing these small capacity projects. Banks have to conduct an extensive and costly due
ProjectNameTechnology Contracted
CapacityFullyIndexedPrice*
(ZARc/KWh)EDScore(outof30)
AdamsSolarPVProject SolarPV 5MW 98,1 16,89BellatrixSolarPVProject SolarPV 5MW 102,8 17,04DuPlessisSolarPV4 SolarPV 5MW 116,0 23,57HeuningspruitPV1 SolarPV 5MW 101,7 10,37SteynsrusPV1 SolarPV 5MW 101,7 10,34SteynsrusPV2 SolarPV 5MW 101,7 10,38
HopefieldCommunityWindFarm Onshorewind 4MW 100,0 9,76KlawerWindFarm Onshorewind 5MW 95 15,93BusbyRenewables Biomass 5MW 140,0 11,37
GeorgeSmallScaleBiomass Biomass 5MW 140,0 23,06
54 | Page
diligence of any project proposal to determine whether the project is bankable, and a similar
amount of due diligence is required regardless of project size. As a result, their return margins on
smaller capacity, lower value projects are too low relative to the cost and time incurred to make
lending to them worthwhile. In such programmes, corporate finance as well as DFIs become a
valuable source of funding. The South African developer Aurora Power Solutions (via its
subsidiary SOLA Future Energy) was a prominent equity sponsor, winning 2 projects versus
Cronimet's 3 awards. Varying consortiums, with some well-known equity holders including
Building Energy and Pele in partnership, as well as Old Mutual, sponsored the remaining projects.
One could argue that Cronimet's dominance in the SP-IPPPP, as well as the continued presence of
multinational EPC contractors such as Vestas, Goldwind and Juwi amongst awarded projects,
suggests that the SP-IPPPP is not achieving its objectives of shielding local players from
multinationals and promoting the use of South African generation equipment manufacturers. Also,
several project sponsors such as Aurora, Building Energy, Pele and Old Mutual have participated
as equity holders in the REIPPPP as well, leading one to question whether the SP-IPPPP is truly
affording "smaller", "emerging" power developers/ consortiums an opportunity for project award
or simply awarding smaller projects to entrenched players. On the other hand, the award of
Aurora's projects has demonstrated the SP-IPPPP's ability to facilitate local players competing at a
higher level. Aurora only had minor shareholdings in its REIPPPP projects whereas it now owns a
significant 80% of both of its SP-IPPPP projects and will serve as the EPC and O&M contractor,
thereby deriving much greater economic benefit.
Finally, the SP-IPPP was meant to reduce cost-at-risk for bidders by reducing transaction costs for
unsuccessful bidders through a two-stage tender. This risk is a serious deterrent to small players
who lack the cash flow and financial strength, firstly to incur such costs, and secondly to absorb
the losses, in the event that their bids are unsuccessful. In practice this objective has not been
achieved, with the SP-IPPPP requirements still being far too onerous and expensive for projects of
this size, and qualifying bidders complaining that the two-stage process actually exacerbates their
costs by prolonging the tender period and preparation intensity.
55 | Page
PART B: Lessons learned from the South African REIPPPP
Section 1: Overview of the REIPPPP’s success to date
The South African REIPPPP has achieved worldwide recognition for its success. Since 2011,
the DOE has awarded 6,327MW43 of capacity to 92 IPPs (excluding the SP-IPPPP projects),
with another 1,800MW to be awarded shortly.
The programme has been highly beneficial for South Africa. One of the most important benefits
has been the reduction in tariffs achieved over the bid windows. The most recent wind energy
and solar PV bids are cheaper than Eskom’s average tariff and certainly below the cost of its
new coal power plants. The REIPPPP projects have already produced significant net cost
savings for Eskom in 2015, both through fuel savings and partially mitigating load shedding
which would have led to unserved energy (CSIR, 2015). They have diversified the energy mix
and have provided environmental benefits of importance in reducing our reliance on fossil
fuels. The REIPPPP’s dual consideration of economic development objectives has also led to
the creation of a significant number of jobs, as well as contributed to B-BBEE and preferential
procurement objectives. A further key benefit of the programme has been the promotion of
foreign direct investment and private sector investment into the South African energy sector.
Because it has proved so innovative and effective, the REIPPPP provides valuable lessons for
other developing countries. While it would be necessary to tailor the design for country-specific
factors, it could be used as a springboard for expedited tender rollouts whilst still achieving
certain broader development objectives. Below we discuss the REIPPPP’s key successes and
lessons, after which we highlight some of the lessons learnt through the challenges experienced
and risks identified during implementation of the programme.
43 6327MW was awarded but 6322MW was signed at Financial Close. Landfill Gas project reached Financial Close with 13MW instead of the Bid Submission capacity of 18MW.
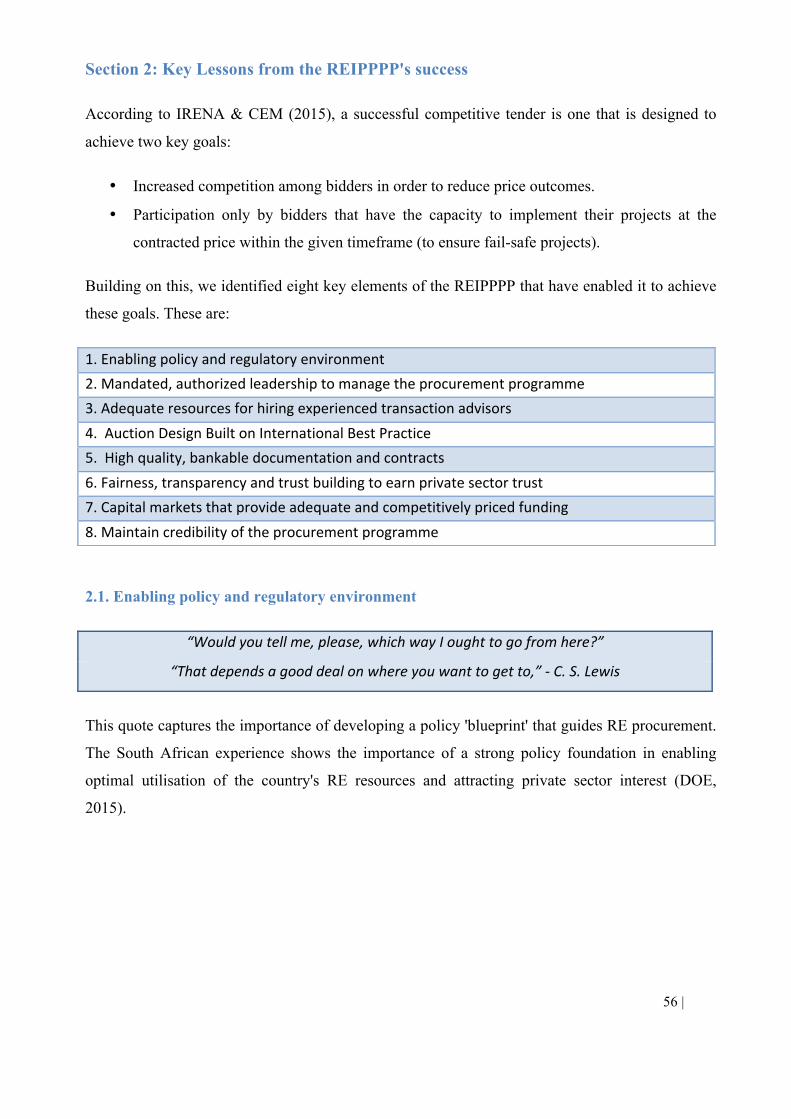
56 | Page
Section 2: Key Lessons from the REIPPPP's success
According to IRENA & CEM (2015), a successful competitive tender is one that is designed to
achieve two key goals:
• Increased competition among bidders in order to reduce price outcomes.
• Participation only by bidders that have the capacity to implement their projects at the
contracted price within the given timeframe (to ensure fail-safe projects).
Building on this, we identified eight key elements of the REIPPPP that have enabled it to achieve
these goals. These are:
2.1. Enabling policy and regulatory environment
This quote captures the importance of developing a policy 'blueprint' that guides RE procurement.
The South African experience shows the importance of a strong policy foundation in enabling
optimal utilisation of the country's RE resources and attracting private sector interest (DOE,
2015).
1.Enablingpolicyandregulatoryenvironment2.Mandated,authorizedleadershiptomanagetheprocurementprogramme3.Adequateresourcesforhiringexperiencedtransactionadvisors4.AuctionDesignBuiltonInternationalBestPractice5.Highquality,bankabledocumentationandcontracts6.Fairness,transparencyandtrustbuildingtoearnprivatesectortrust7.Capitalmarketsthatprovideadequateandcompetitivelypricedfunding8.Maintaincredibilityoftheprocurementprogramme
“Wouldyoutellme,please,whichwayIoughttogofromhere?”
“Thatdependsagooddealonwhereyouwanttogetto,”-C.S.Lewis
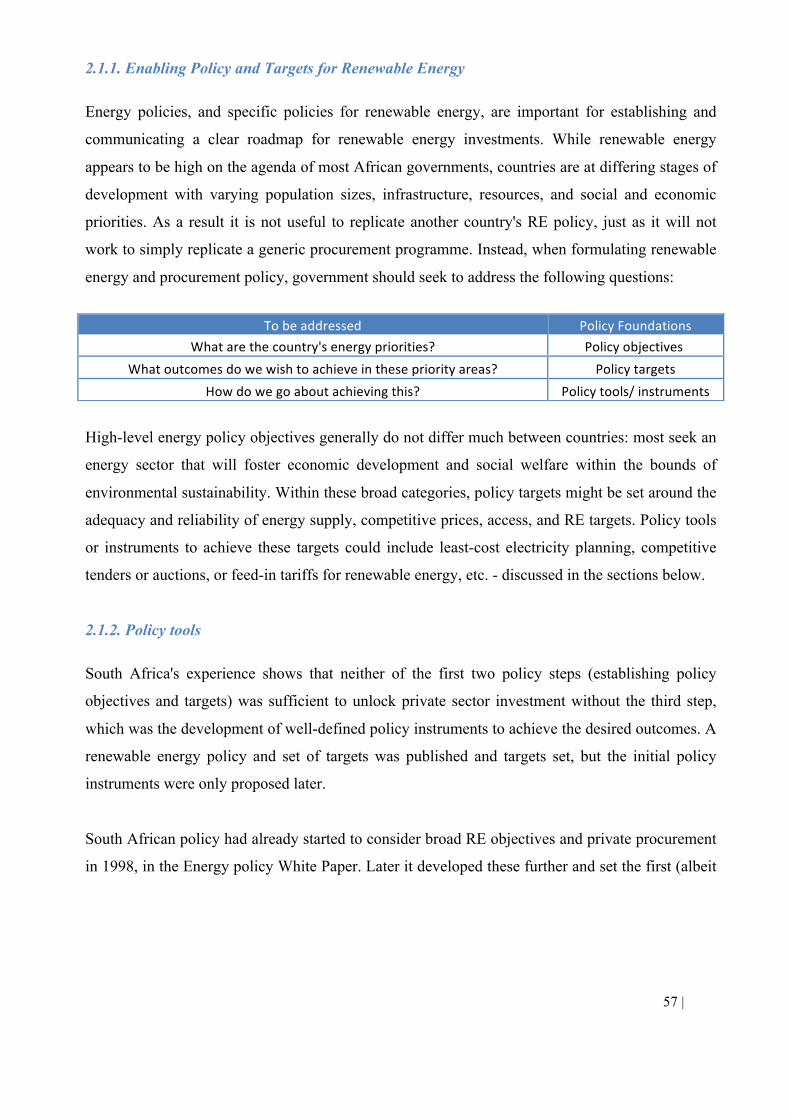
57 | Page
2.1.1. Enabling Policy and Targets for Renewable Energy
Energy policies, and specific policies for renewable energy, are important for establishing and
communicating a clear roadmap for renewable energy investments. While renewable energy
appears to be high on the agenda of most African governments, countries are at differing stages of
development with varying population sizes, infrastructure, resources, and social and economic
priorities. As a result it is not useful to replicate another country's RE policy, just as it will not
work to simply replicate a generic procurement programme. Instead, when formulating renewable
energy and procurement policy, government should seek to address the following questions:
High-level energy policy objectives generally do not differ much between countries: most seek an
energy sector that will foster economic development and social welfare within the bounds of
environmental sustainability. Within these broad categories, policy targets might be set around the
adequacy and reliability of energy supply, competitive prices, access, and RE targets. Policy tools
or instruments to achieve these targets could include least-cost electricity planning, competitive
tenders or auctions, or feed-in tariffs for renewable energy, etc. - discussed in the sections below.
2.1.2. Policy tools
South Africa's experience shows that neither of the first two policy steps (establishing policy
objectives and targets) was sufficient to unlock private sector investment without the third step,
which was the development of well-defined policy instruments to achieve the desired outcomes. A
renewable energy policy and set of targets was published and targets set, but the initial policy
instruments were only proposed later.
South African policy had already started to consider broad RE objectives and private procurement
in 1998, in the Energy policy White Paper. Later it developed these further and set the first (albeit
Tobeaddressed PolicyFoundationsWhatarethecountry'senergypriorities? Policyobjectives
Whatoutcomesdowewishtoachieveinthesepriorityareas? PolicytargetsHowdowegoaboutachievingthis? Policytools/instruments
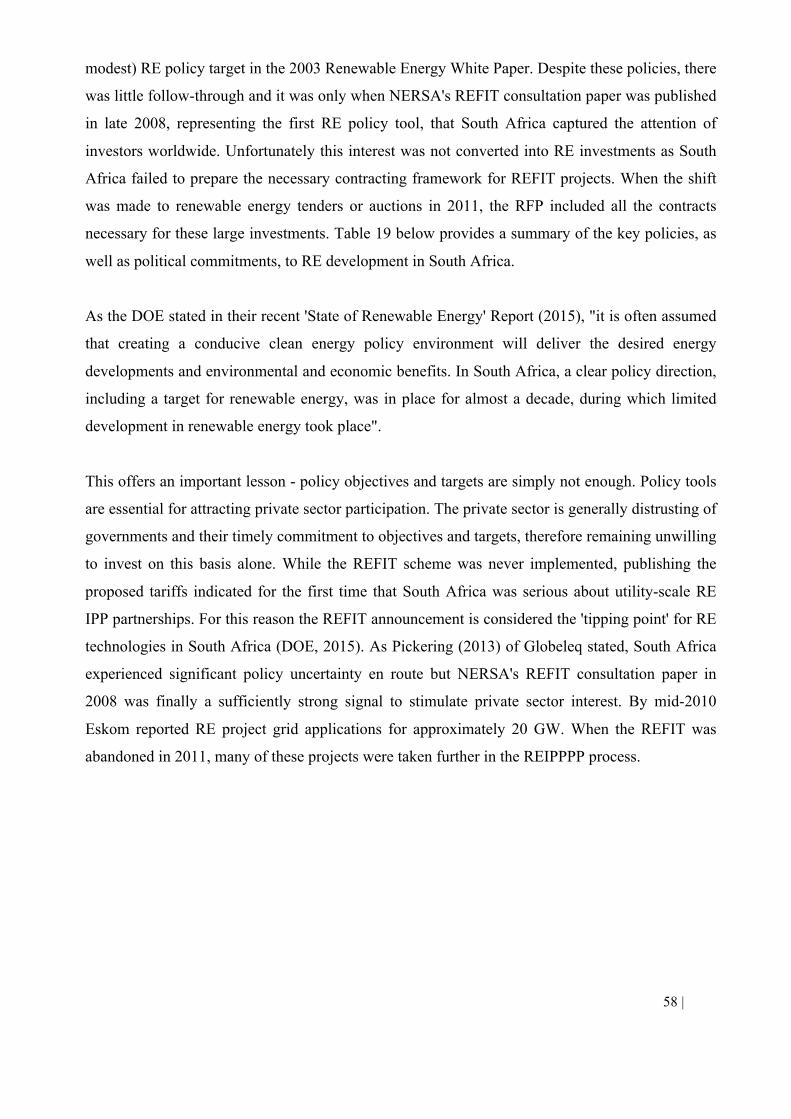
58 | Page
modest) RE policy target in the 2003 Renewable Energy White Paper. Despite these policies, there
was little follow-through and it was only when NERSA's REFIT consultation paper was published
in late 2008, representing the first RE policy tool, that South Africa captured the attention of
investors worldwide. Unfortunately this interest was not converted into RE investments as South
Africa failed to prepare the necessary contracting framework for REFIT projects. When the shift
was made to renewable energy tenders or auctions in 2011, the RFP included all the contracts
necessary for these large investments. Table 19 below provides a summary of the key policies, as
well as political commitments, to RE development in South Africa.
As the DOE stated in their recent 'State of Renewable Energy' Report (2015), "it is often assumed
that creating a conducive clean energy policy environment will deliver the desired energy
developments and environmental and economic benefits. In South Africa, a clear policy direction,
including a target for renewable energy, was in place for almost a decade, during which limited
development in renewable energy took place".
This offers an important lesson - policy objectives and targets are simply not enough. Policy tools
are essential for attracting private sector participation. The private sector is generally distrusting of
governments and their timely commitment to objectives and targets, therefore remaining unwilling
to invest on this basis alone. While the REFIT scheme was never implemented, publishing the
proposed tariffs indicated for the first time that South Africa was serious about utility-scale RE
IPP partnerships. For this reason the REFIT announcement is considered the 'tipping point' for RE
technologies in South Africa (DOE, 2015). As Pickering (2013) of Globeleq stated, South Africa
experienced significant policy uncertainty en route but NERSA's REFIT consultation paper in
2008 was finally a sufficiently strong signal to stimulate private sector interest. By mid-2010
Eskom reported RE project grid applications for approximately 20 GW. When the REFIT was
abandoned in 2011, many of these projects were taken further in the REIPPPP process.
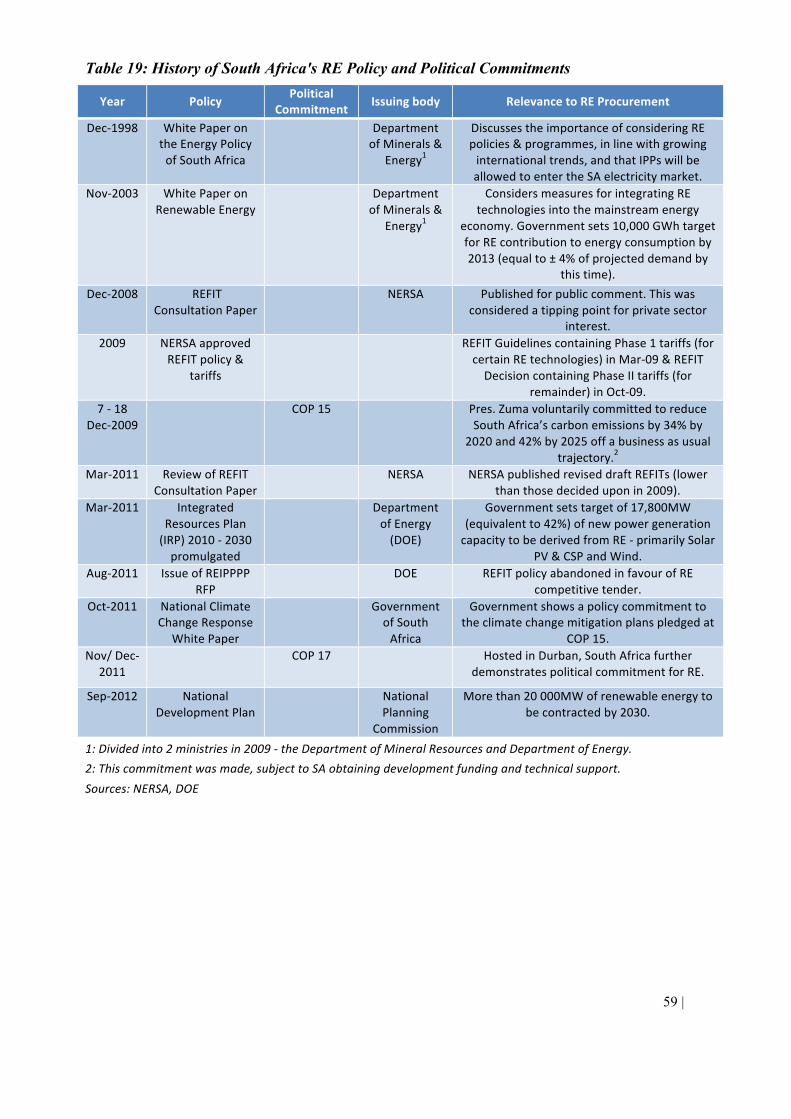
59 | Page
Table 19: History of South Africa's RE Policy and Political Commitments
Year Policy PoliticalCommitment Issuingbody RelevancetoREProcurement
Dec-1998 WhitePaperontheEnergyPolicyofSouthAfrica
DepartmentofMinerals&
Energy1
DiscussestheimportanceofconsideringREpolicies&programmes,inlinewithgrowinginternationaltrends,andthatIPPswillbeallowedtoentertheSAelectricitymarket.
Nov-2003 WhitePaperonRenewableEnergy
DepartmentofMinerals&
Energy1
ConsidersmeasuresforintegratingREtechnologiesintothemainstreamenergy
economy.Governmentsets10,000GWhtargetforREcontributiontoenergyconsumptionby2013(equalto±4%ofprojecteddemandby
thistime).Dec-2008 REFIT
ConsultationPaper NERSA Publishedforpubliccomment.Thiswas
consideredatippingpointforprivatesectorinterest.
2009 NERSAapprovedREFITpolicy&
tariffs
REFITGuidelinescontainingPhase1tariffs(forcertainREtechnologies)inMar-09&REFITDecisioncontainingPhaseIItariffs(for
remainder)inOct-09.7-18
Dec-2009 COP15 Pres.Zumavoluntarilycommittedtoreduce
SouthAfrica’scarbonemissionsby34%by2020and42%by2025offabusinessasusual
trajectory.2Mar-2011 ReviewofREFIT
ConsultationPaper NERSA NERSApublishedreviseddraftREFITs(lower
thanthosedecideduponin2009).Mar-2011 Integrated
ResourcesPlan(IRP)2010-2030promulgated
DepartmentofEnergy(DOE)
Governmentsetstargetof17,800MW(equivalentto42%)ofnewpowergenerationcapacitytobederivedfromRE-primarilySolar
PV&CSPandWind.Aug-2011 IssueofREIPPPP
RFP DOE REFITpolicyabandonedinfavourofRE
competitivetender.Oct-2011 NationalClimate
ChangeResponseWhitePaper
GovernmentofSouthAfrica
Governmentshowsapolicycommitmenttotheclimatechangemitigationplanspledgedat
COP15.Nov/Dec-
2011 COP17 HostedinDurban,SouthAfricafurther
demonstratespoliticalcommitmentforRE.
Sep-2012 NationalDevelopmentPlan
NationalPlanning
Commission
Morethan20000MWofrenewableenergytobecontractedby2030.
1:Dividedinto2ministriesin2009-theDepartmentofMineralResourcesandDepartmentofEnergy.2:Thiscommitmentwasmade,subjecttoSAobtainingdevelopmentfundingandtechnicalsupport.Sources:NERSA,DOE
60 | Page
2.1.3. Linking RE policy, targets, power planning and procurement initiatives
It was possible to initiate the REIPPPP because South Africa’s electricity plan had set ambitious
targets for procuring renewable energy. All previous plans had been based on least-cost supply
options, viz. mostly coal power stations. But, for the first time, the Integrated Resource Plan (IRP)
for electricity, 2010, included renewable energy options. The plan was formalized in a
Government Gazette published in terms of the Electricity Regulation Act. The IRP 2010 estimated
that electricity demand by 2030 would require additional generation capacity of 52 GW, of which
a significant 17.8 GW would be derived from RE sources. This marked a conscious policy
adjustment, considering that at the time of the IRP's development less than 0.5%44 of South
Africa's generation capacity was RE-based (DOE, 2015).
However, as discussed above, broad policy targets (or plans) do not provide investors with
sufficient certainty to enter the market. Firstly, they need to know how governments will reach the
targets (i.e. the proposed policy tool(s)). Secondly, it is difficult to plan business activities when
the only target is that 17.8 GW will be procured over a 20 year period, with no certainty on which
years and how this will be procured.
South Africa’s Electricity Regulation Act, 2006, and New Generation Regulations published in
terms of the Act, give the Energy Minister powers to translate the electricity plan into procurement
by making Ministerial Determinations specifying how much power should be procured from
which sources by when and by whom (Eskom or IPPs). The private sector thus has an indication
of available investment opportunities over the short and medium term. The REIPPPP's ultimate
replacement of the REFIT policy in 2011 finally brought clarity to exactly how planned renewable
energy capacity would be procured.
44Excluding large-scale hydro capacity of 2.1GW.
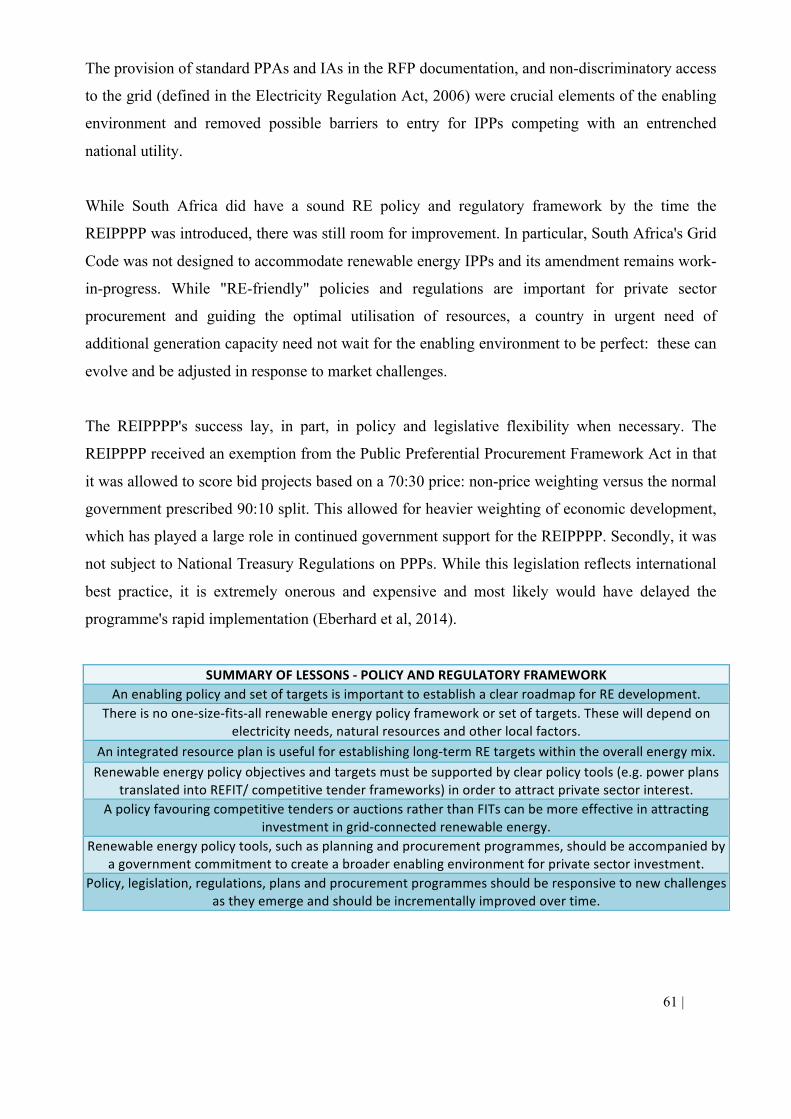
61 | Page
The provision of standard PPAs and IAs in the RFP documentation, and non-discriminatory access
to the grid (defined in the Electricity Regulation Act, 2006) were crucial elements of the enabling
environment and removed possible barriers to entry for IPPs competing with an entrenched
national utility.
While South Africa did have a sound RE policy and regulatory framework by the time the
REIPPPP was introduced, there was still room for improvement. In particular, South Africa's Grid
Code was not designed to accommodate renewable energy IPPs and its amendment remains work-
in-progress. While "RE-friendly" policies and regulations are important for private sector
procurement and guiding the optimal utilisation of resources, a country in urgent need of
additional generation capacity need not wait for the enabling environment to be perfect: these can
evolve and be adjusted in response to market challenges.
The REIPPPP's success lay, in part, in policy and legislative flexibility when necessary. The
REIPPPP received an exemption from the Public Preferential Procurement Framework Act in that
it was allowed to score bid projects based on a 70:30 price: non-price weighting versus the normal
government prescribed 90:10 split. This allowed for heavier weighting of economic development,
which has played a large role in continued government support for the REIPPPP. Secondly, it was
not subject to National Treasury Regulations on PPPs. While this legislation reflects international
best practice, it is extremely onerous and expensive and most likely would have delayed the
programme's rapid implementation (Eberhard et al, 2014).
SUMMARYOFLESSONS-POLICYANDREGULATORYFRAMEWORKAnenablingpolicyandsetoftargetsisimportanttoestablishaclearroadmapforREdevelopment.
Thereisnoone-size-fits-allrenewableenergypolicyframeworkorsetoftargets.Thesewilldependonelectricityneeds,naturalresourcesandotherlocalfactors.
Anintegratedresourceplanisusefulforestablishinglong-termREtargetswithintheoverallenergymix.Renewableenergypolicyobjectivesandtargetsmustbesupportedbyclearpolicytools(e.g.powerplans
translatedintoREFIT/competitivetenderframeworks)inordertoattractprivatesectorinterest.ApolicyfavouringcompetitivetendersorauctionsratherthanFITscanbemoreeffectiveinattracting
investmentingrid-connectedrenewableenergy.Renewableenergypolicytools,suchasplanningandprocurementprogrammes,shouldbeaccompaniedby
agovernmentcommitmenttocreateabroaderenablingenvironmentforprivatesectorinvestment.Policy,legislation,regulations,plansandprocurementprogrammesshouldberesponsivetonewchallenges
astheyemergeandshouldbeincrementallyimprovedovertime.
62 | Page
2.2. Mandated, authorized and coordinated leadership
2.2.1. Political support
The REIPPPP undoubtedly benefited from high-level political support. A defining moment was at
the 15th Conference of the Parties (COP15) of the United Nations Framework Convention on
Climate Change in 2009, when President Jacob Zuma pledged that South Africa would follow a
"peak, plateau and decline" trajectory 45 for future greenhouse gas emissions. Under this
commitment national emissions would be limited to 34% below a “business as usual” trajectory by
2020 to peak at 42% below business as usual by 2025. Thereafter they would remain flat for
approximately a decade before declining in absolute terms through a gradual shift to non-fossil
fuel sources, all on condition that South Africa would receive finance, technology and capacity-
building support from the international community (Department of Environmental Affairs, 2011).
Despite international financial assistance not materialising as planned, South Africa proceeded to
transform its electricity planning in the wake of COP15 (Eberhard et al, 2014), evidenced by the
publications of the IRP 2010 and the National Climate Change Response White Paper . The
government further demonstrated this commitment by hosting COP17 and signing a Green
Accord46 with business and other stakeholders in 2011 (Eberhard et al, 2014). It is clear that South
Africa hosting COP17 in Durban played a profound role in adding pressure to fast-track the roll-
out of the REIPPPP: the RFP for BW1 was announced in August 2011, first submissions were due
by Nov 2011 and preferred bidders were announced in December 2011 at COP17.
While there has been some debate as to the depth of commitment (EarthLife Africa, 2014), there is
no doubt that South Africa’s voluntary UNFCCC carbon reduction pledges have had a profound
impact on electricity planning and the launch of the REIPPPP. A second factor, that led to an
accelerated procurement programme for renewable energy, was power shortages and power cuts
that emerged at that time and the need to get more capacity on the grid in the shortest possible
time. Renewable energy projects such as wind, solar and biomass offered this possibility.
45 This pledge was based on the culmination of research, known as the Long-Term Mitigation Scenario (LTMS) formulation, led by the Department of Environmental Affairs in South Africa between 2005 and 2008. The DEA submitted four possible strategic options to mitigate climate change to Cabinet, which chose to adopt a peak, plateau and decline trajectory in mid-2008 (DOE, 2015). 46This brought together a coalition of interests to shift South Africa towards a lower-carbon intensive economy, as well as promote job creation and industrial development. It contains commitments in twelve areas (Mulcahy, 2014).
63 | Page
Political support has also been vital to sustaining the REIPPPP. The REIPPPP process has been
extraordinarily transparent and there have been no opportunities for rent-seeking or corruption.
The fact that the REIPPPP has, indeed, delivered broader social and economic benefits has served
to blunt criticisms and strengthen overall political support, although this remains an on-going
battle.
2.2.2. Mandated and authorised champion and team to drive the procurement programme
The REIPPPP was unique in that it was controlled by the DOE, with the support of National
Treasury, rather than the national utility, Eskom, who was historically responsible for IPP
procurement efforts but had made little progress. There was also a shift of responsibility from
NERSA, who had previously designed the REFIT scheme but are now only involved in a
secondary role of licensing Preferred Bidders.
When the DOE took over responsibility for procuring renewable energy, it acknowledged that it
had little institutional capacity to run a programme of the size and complexity envisaged for the
REIPPPP and approached the National Treasury’s Public Private Partnership Unit (PPP) for
assistance (Eberhard et al, 2014). A small number of technical staff from the DOE and PPP Units,
respectively, established a combined team known as the DOE IPP office and were given full
authority to run the programme. The largely ad hoc institutional status of the DOE IPP unit,
acting at arm's length from the DOE as a kind of dedicated project office, allows and, to some
extent, encourages an operating approach that emphasises problem solving to make the
programme successful, rather than automatically following governmental operational policies and
procedures that emphasised enforcement of rules.
2.2.3. Respected, credible and capacitated "Tender Agent"
The PPP Unit and the DOE-IPP office team leader, has extensive experience working with the
private sector, managing consultants and working with PPP contracts (Eberhard et al, 2014).
64 | Page
Because of its background and skills, the DOE IPP unit exhibited none of the kind of mistrust of
private businesses that sometimes characterises other government agencies in South Arica.
South Africa's lack of experience in RE deployment prompted the DOE-IPP office to tender for a
large suite of transaction advisers, many of whom were from abroad and had international
experience. In the initial stages of designing the programme there were over 50 advisers around
the table (and the number of advisers increased over the course of the programme). The PPP Unit's
prior experience with managing consultants provided the competency to manage the numerous
transaction advisers.
It was important, at the outset, to be "brave". In other words, the DOE-IPP office had to be willing
to assume the risk of trying new design options rather than simply replicating international
frameworks that may not necessarily have suited the country's unique requirements. For example,
in international RE tenders governments had typically chosen the sites, borne the cost of
connection and generally assumed more of the risk. The team leader knew this would place
unacceptable pressure on the South African government and the decision was made to transfer the
responsibility for locating suitable sites to the bidders. She required the transaction advisers to be
in-country and constantly challenged them to change their thinking rather than applying the
''norms''.
Private sector stakeholders have consistently noted that the DOE-IPP leadership team were
integral to the programme's success. It may not be possible in other country contexts to appoint a
team leader with extensive experience of PPPs and working with the private sector. Neither may it
be possible to replicate the independent institutional format. However, the South African
experience highlights the importance of carefully mandating a programme champion who is able
to manage transaction advisors within an institutional environment where they have sufficient
authority, and ambition, to steer the procurement programme.
2.2.4. Co-ordination of government departments
Figure 10 below illustrates the complexity of the programme and the extent of cooperation
required from authorities who had to provide IPPs with necessary consents/ approvals. In the SA
REIPPPP the DOE had to coordinate closely with the Department of Environmental Affairs
65 | Page
(DEA), Department of Water Affairs (DWA), the Department of Agriculture, Forestry and
Fisheries (DAFF), and provincial and municipal departments, amongst others.
This placed enormous pressure on affiliated government departments. For example, by 2013 more
than 1,500 environmental authorisation applications had been made to the DEA in respect of RE
projects (Mulcahy, 2014). Eskom, although not a government department, is a government-owned
entity and was arguably placed under the most pressure of all. It was required to issue cost
estimate letters to all projects submitting bids regarding the feasibility and approximate cost of
their connection to the grid, which became increasingly onerous with the rapidly growing number
of bidders in each bid round.
An important lesson is that government departments and related authorities (at all levels - national,
provincial and municipal) should be involved from the early stages of the programme to facilitate
coordination and allow them to prepare, particularly where additional resources may be needed to
fulfil their commitments and avoid delays in implementation. The programme should also be
structured in a way that minimises unnecessary burden on these affiliated departments. For
example, in the REIPPPP the DWA would only consider water use licence applications for
preferred bidders, otherwise application volumes would have been too great.
A key lesson from the REIPPPP is that the IPP office has not worked closely enough with
strategic interests within Eskom; we need to see closer collaboration and alignment to obtain buy-
in for the programme early enough. The failure to do this is partly why the programme is currently
facing an impasse due to Eskom’s unwillingness to sign any more PPAs.
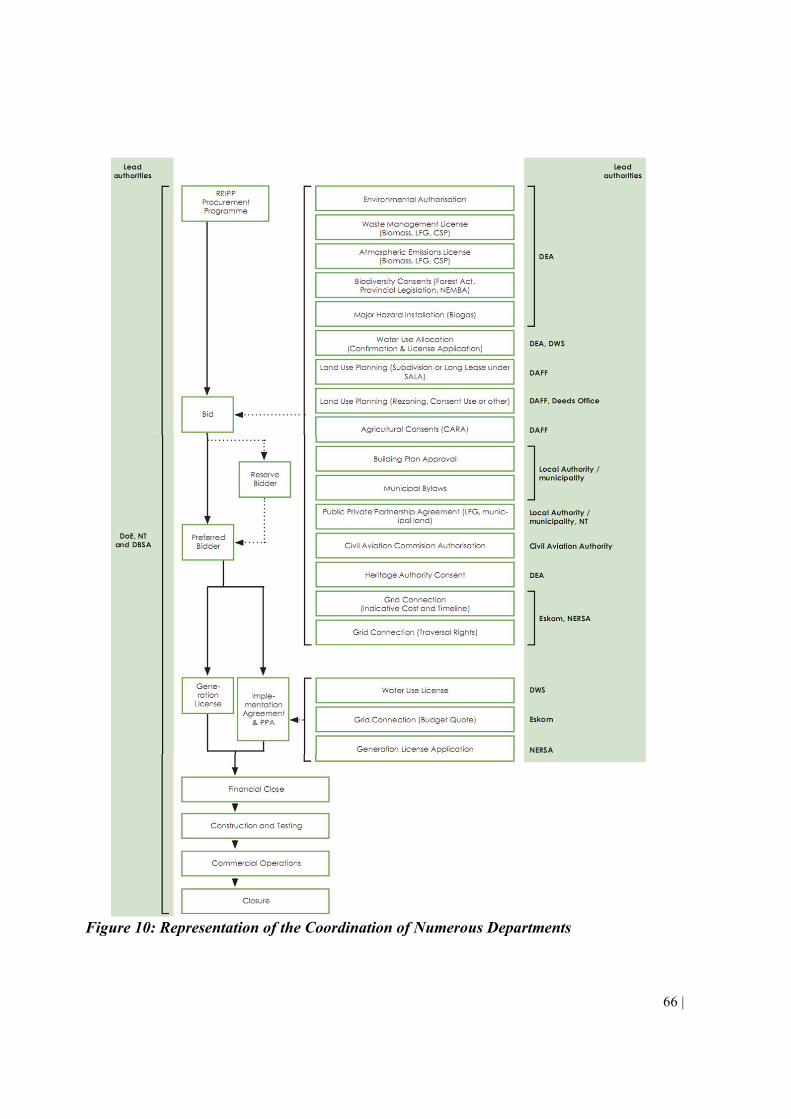
66 | Page
Figure 10: Representation of the Coordination of Numerous Departments
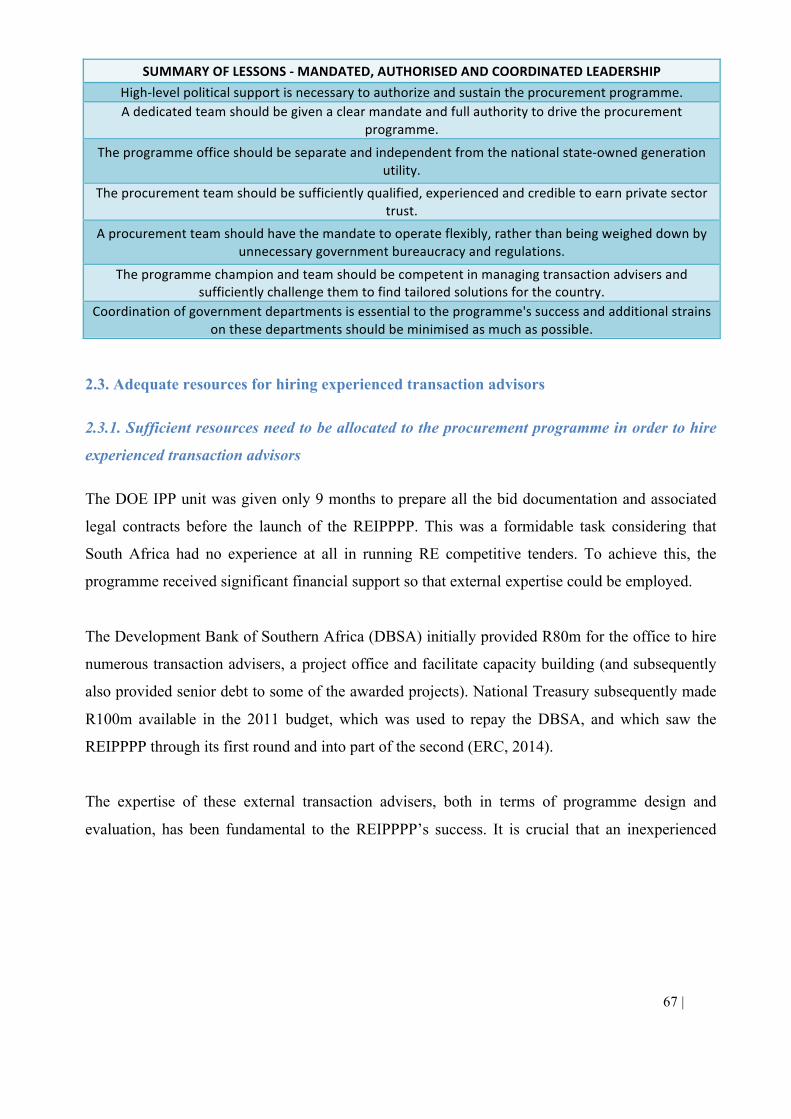
67 | Page
2.3. Adequate resources for hiring experienced transaction advisors
2.3.1. Sufficient resources need to be allocated to the procurement programme in order to hire
experienced transaction advisors
The DOE IPP unit was given only 9 months to prepare all the bid documentation and associated
legal contracts before the launch of the REIPPPP. This was a formidable task considering that
South Africa had no experience at all in running RE competitive tenders. To achieve this, the
programme received significant financial support so that external expertise could be employed.
The Development Bank of Southern Africa (DBSA) initially provided R80m for the office to hire
numerous transaction advisers, a project office and facilitate capacity building (and subsequently
also provided senior debt to some of the awarded projects). National Treasury subsequently made
R100m available in the 2011 budget, which was used to repay the DBSA, and which saw the
REIPPPP through its first round and into part of the second (ERC, 2014).
The expertise of these external transaction advisers, both in terms of programme design and
evaluation, has been fundamental to the REIPPPP’s success. It is crucial that an inexperienced
SUMMARYOFLESSONS-MANDATED,AUTHORISEDANDCOORDINATEDLEADERSHIPHigh-levelpoliticalsupportisnecessarytoauthorizeandsustaintheprocurementprogramme.Adedicatedteamshouldbegivenaclearmandateandfullauthoritytodrivetheprocurement
programme.
Theprogrammeofficeshouldbeseparateandindependentfromthenationalstate-ownedgenerationutility.
Theprocurementteamshouldbesufficientlyqualified,experiencedandcredibletoearnprivatesectortrust.
Aprocurementteamshouldhavethemandatetooperateflexibly,ratherthanbeingweigheddownbyunnecessarygovernmentbureaucracyandregulations.
Theprogrammechampionandteamshouldbecompetentinmanagingtransactionadvisersandsufficientlychallengethemtofindtailoredsolutionsforthecountry.
Coordinationofgovernmentdepartmentsisessentialtotheprogramme'ssuccessandadditionalstrainsonthesedepartmentsshouldbeminimisedasmuchaspossible.
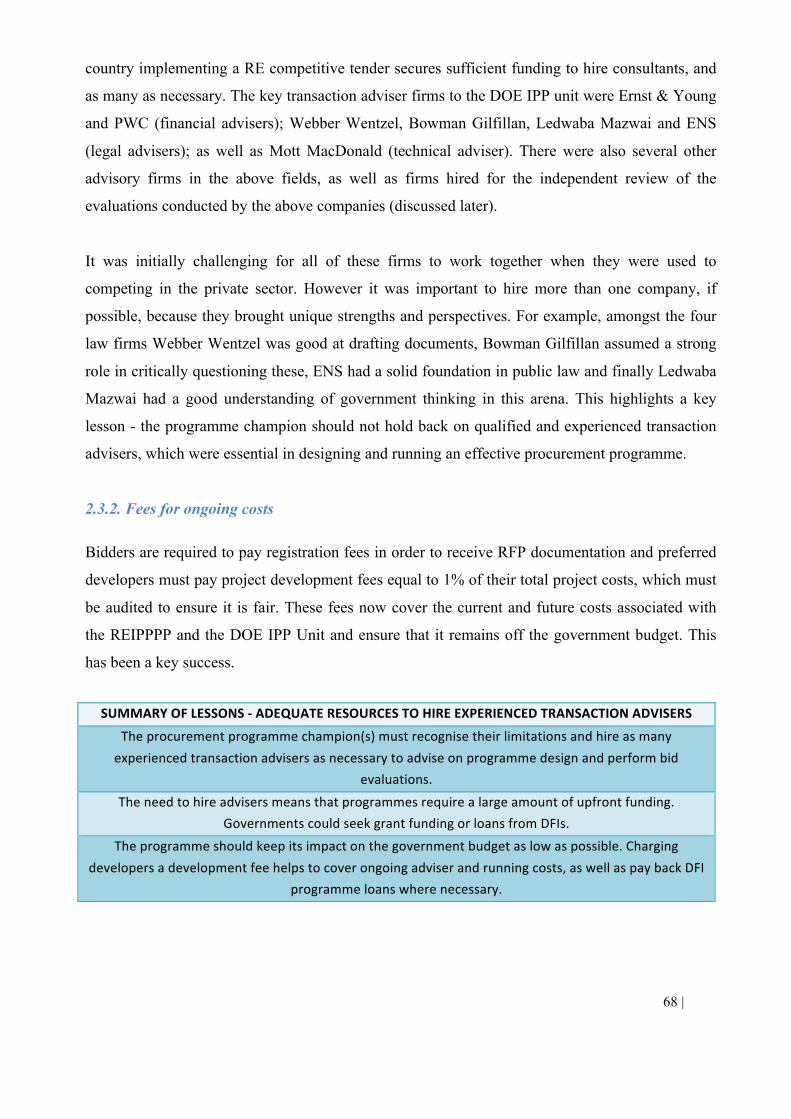
68 | Page
country implementing a RE competitive tender secures sufficient funding to hire consultants, and
as many as necessary. The key transaction adviser firms to the DOE IPP unit were Ernst & Young
and PWC (financial advisers); Webber Wentzel, Bowman Gilfillan, Ledwaba Mazwai and ENS
(legal advisers); as well as Mott MacDonald (technical adviser). There were also several other
advisory firms in the above fields, as well as firms hired for the independent review of the
evaluations conducted by the above companies (discussed later).
It was initially challenging for all of these firms to work together when they were used to
competing in the private sector. However it was important to hire more than one company, if
possible, because they brought unique strengths and perspectives. For example, amongst the four
law firms Webber Wentzel was good at drafting documents, Bowman Gilfillan assumed a strong
role in critically questioning these, ENS had a solid foundation in public law and finally Ledwaba
Mazwai had a good understanding of government thinking in this arena. This highlights a key
lesson - the programme champion should not hold back on qualified and experienced transaction
advisers, which were essential in designing and running an effective procurement programme.
2.3.2. Fees for ongoing costs
Bidders are required to pay registration fees in order to receive RFP documentation and preferred
developers must pay project development fees equal to 1% of their total project costs, which must
be audited to ensure it is fair. These fees now cover the current and future costs associated with
the REIPPPP and the DOE IPP Unit and ensure that it remains off the government budget. This
has been a key success.
SUMMARYOFLESSONS-ADEQUATERESOURCESTOHIREEXPERIENCEDTRANSACTIONADVISERS
Theprocurementprogrammechampion(s)mustrecognisetheirlimitationsandhireasmanyexperiencedtransactionadvisersasnecessarytoadviseonprogrammedesignandperformbid
evaluations.Theneedtohireadvisersmeansthatprogrammesrequirealargeamountofupfrontfunding.
GovernmentscouldseekgrantfundingorloansfromDFIs.Theprogrammeshouldkeepitsimpactonthegovernmentbudgetaslowaspossible.Charging
developersadevelopmentfeehelpstocoverongoingadviserandrunningcosts,aswellaspaybackDFIprogrammeloanswherenecessary.
69 | Page
2.4. Auction Design Built on International Best Practice
2.4.1. Wide consultation
The DOE IPP unit engaged extensively with the private sector during the design stages of the
programme, attempting to determine market readiness and which factors the private sector deemed
essential in order to invest.
The Programme Leader (Head of the IPP office), in particular, invested a lot of time in 'courting'
and consulting with the banks, pension funds and life insurance companies to stimulate interest
and ensure that the programme addressed the needs of lenders. Without legal contracts that the
primary lenders considered bankable, the programme would not get off the ground. It is
recommended that governments wishing to introduce RE utility-scale tenders engage similarly
with the private sector beforehand and conduct road shows to court potential financiers and
discuss their bankability requirements.
2.4.2. Benchmarking
The DOE IPP unit and advisers also studied international experience and best practice. For
example, the team studied PPAs that had been used for RE programmes in Spain, India, California
& the UK. While not all international experience could be replicated, it provided a framework off
which South Africa could benchmark and adjust according to country-specific needs.
2.4.3. Procurement Model – Competitive Tender versus REFIT and Directly Negotiated
In 2009 NERSA's approved REFIT policy was initially designed to cover generation costs plus a
real after-tax return on equity of 17%, and would be fully indexed for inflation. In 2011 NERSA
published a proposed tariff reduction out of concern that they had originally been set too high
(Eberhard et al, 2014).
The DOE and National Treasury, already concerned about the high REFITs, finally obtained a
legal opinion that the FIT scheme constituted non-competitive procurement and was therefore
70 | Page
prohibited by the Constitution and government’s public finance and procurement regulations. The
REFIT was abandoned in 2011, without any projects having been contracted, and the DOE
implemented the REIPPPP in its place.
Competitive tenders undoubtedly produce better price outcomes than REFIT programmes. Their
key strength is that they provide a highly effective mechanism for real price discovery (IRENA &
CEM, 2015), particularly in countries that lack RE experience which makes it difficult for the
government/ regulator to establish a market related tariff. The risk is that the FIT is set too low to
attract investment or developers contract at this low tariff and later struggle to achieve an
acceptable return, thereby stalling the project’s development. Alternatively the FIT is set too high,
as would have been the case in South Africa, and the buyer is locked into 20 year overpriced
contracts.
As Table 20 below shows, the price caps set for the REIPPPP Round 1 were set between the 2009
and 2011 REFITs designated by NERSA, but closer to the higher end. Resulting average bid
tariffs in BW 1 were close to these price caps, and it is believed that IPPs charged a premium
because they knew that the capacity allocation (3,625MW) was high and competition was still
limited due to the programme’s infancy and the shortage of bid-ready projects. This REFIT-like
price cap shows the potential danger of the REFIT scheme. Despite price caps remaining the same
in BW 2, the reduced capacity on offer (1,275 MW) stimulated more competition and resulted in
the average bid tariff dropping by 21% for wind and a remarkable 40% for solar PV. Ongoing
competition resulted in further falls in prices in subsequent rounds.
It is unlikely that consecutive REFITs would have resulted in such a fall in renewable energy
prices. Updated REFITs would first require debate and policy approval, and it is unlikely that
NERSA would have accurately predicted the market well enough to sufficiently reduce the
REFITs.
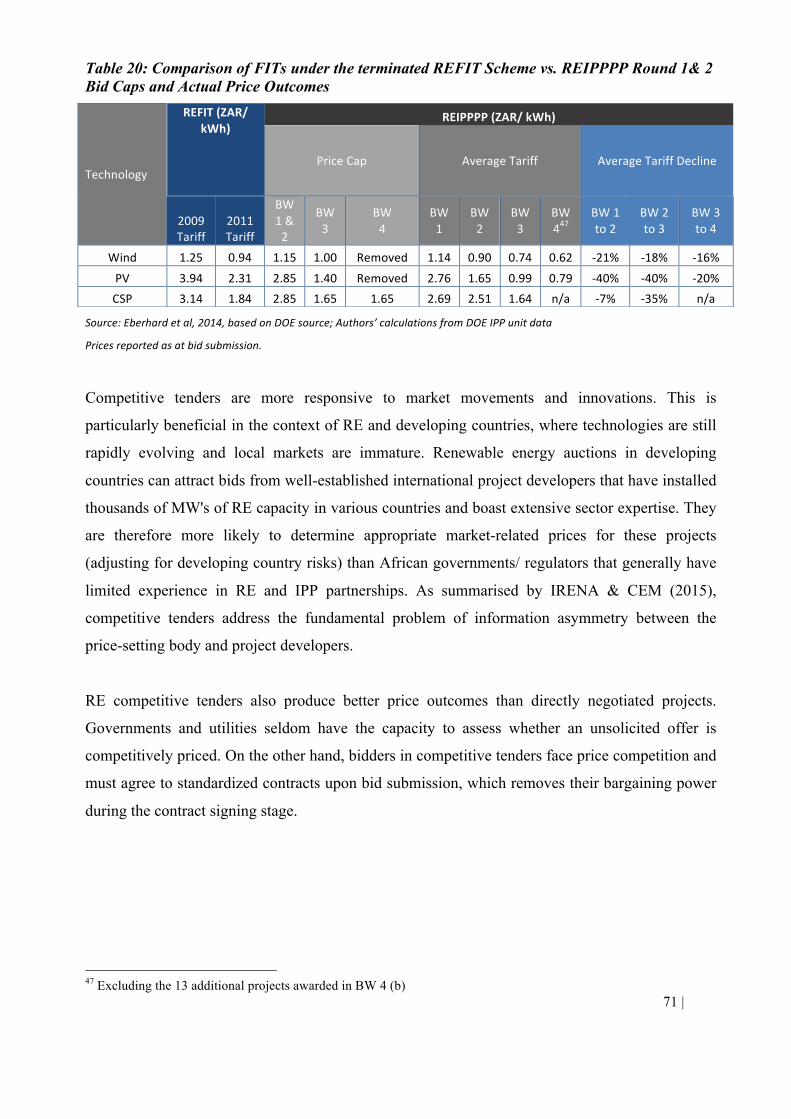
71 | Page
Table 20: Comparison of FITs under the terminated REFIT Scheme vs. REIPPPP Round 1& 2 Bid Caps and Actual Price Outcomes
Source:Eberhardetal,2014,basedonDOEsource;Authors’calculationsfromDOEIPPunitdata
Pricesreportedasatbidsubmission.
Competitive tenders are more responsive to market movements and innovations. This is
particularly beneficial in the context of RE and developing countries, where technologies are still
rapidly evolving and local markets are immature. Renewable energy auctions in developing
countries can attract bids from well-established international project developers that have installed
thousands of MW's of RE capacity in various countries and boast extensive sector expertise. They
are therefore more likely to determine appropriate market-related prices for these projects
(adjusting for developing country risks) than African governments/ regulators that generally have
limited experience in RE and IPP partnerships. As summarised by IRENA & CEM (2015),
competitive tenders address the fundamental problem of information asymmetry between the
price-setting body and project developers.
RE competitive tenders also produce better price outcomes than directly negotiated projects.
Governments and utilities seldom have the capacity to assess whether an unsolicited offer is
competitively priced. On the other hand, bidders in competitive tenders face price competition and
must agree to standardized contracts upon bid submission, which removes their bargaining power
during the contract signing stage.
47 Excluding the 13 additional projects awarded in BW 4 (b)
Technology
REFIT(ZAR/kWh)
REIPPPP(ZAR/kWh)
PriceCap AverageTariff AverageTariffDecline
2009Tariff
2011Tariff
BW1&2
BW3
BW4
BW1
BW2
BW3
BW447
BW1to2
BW2to3
BW3to4
Wind 1.25 0.94 1.15 1.00 Removed 1.14 0.90 0.74 0.62 -21% -18% -16%
PV 3.94 2.31 2.85 1.40 Removed 2.76 1.65 0.99 0.79 -40% -40% -20%CSP 3.14 1.84 2.85 1.65 1.65 2.69 2.51 1.64 n/a -7% -35% n/a
72 | Page
Finally, if a competitive tender or auction attracts market interest then a pipeline of bankable
projects quickly develops (the REIPPPP has awarded 92 projects in less than 4 years) as opposed
to an ad hoc series of unsolicited offers, often from dubious project developers. Up-to-date power
plans linked to timely initiation of competitive tenders is a much more effective way of dealing
with power shortages than direct negotiations with unsolicited offers.
A downside to competitive tenders is that the additional complexity (extensive qualification and
evaluation criteria) significantly increases the costs, both for government in terms of designing
and running the programme, and for bidders to meet all the criteria. High transaction costs have
been a recurring complaint of bidders that have participated in the programme. On the other hand,
directly negotiated, unsolicited offers also need serious scrutiny and evaluation, and resources
need to be made available for this.
The adoption of the RE competitive tender model has increased worldwide from 6 countries in
2005 to over 60 today (IRENA, 2012), suggesting that it is increasingly recognized as ‘best
practice’. However, it needs to be recognized that auctions only work if there is sufficient
competition (World Bank, 2014). To attract a large number of (experienced) bidders, the
programme must be structured in a way that stimulates competition. The REIPPPP achieved this
through the following design features.
2.4.4. Two-stage or One-stage Tender Process
The DOE IPP unit decided against a prequalification phase because of the additional time it would
add to the procurement process, choosing instead to follow a one-stage combined Request for
Qualifications and Proposals that allowed only 3 months for bid preparation. They also believed
that a one-stage process was better from a government cost perspective, as a prequalification
round would involve additional documents and evaluation, both of which would require costly
advisers.
73 | Page
An expedited process was particularly important in South Africa's case, as the country was facing
a critical power supply shortage and needed additional generation capacity to come online rapidly.
The 2014 Uganda GET FiT Solar competitive tender provides an example of a two-stage tender
process. The Expression of Interest (EOI) notice was issued in January, EOIs were submitted in
March under the Prequalification Stage and final bids were submitted in August. The bid
preparation period was a total of 6.5 months versus South Africa's 3-month period, thereby
illustrating the time advantage of a one-stage tender.
The DOE compensated for the lack of prequalification phase by implementing extremely stringent
RFP requirements and non-negotiable contracts that would ensure that bidders were serious and
adequately resourced to complete their proposed projects. While this has been successful, it has
imposed a significant cost burden on bidders, many of whom absorb these costs without being
awarded any projects.
2.4.5. Sealed-Bid versus Open-Bid Tenders
The REIPPPP is a sealed bid tender in which all bidders are required to submit proposals by a
predetermined date and do not know what others have bid, due to strict confidentiality
undertakings. Because they may only bid once, they are unable to adjust their proposal based on
competing bids. An alternative method is the descending clock auction such as that used in Brazil,
where the auctioneer would offer a price and developers would propose the quantity they would
be willing to provide at that price. The auctioneer would then progressively lower the price in
multiple phases until the total quantity bid matches, or marginally exceeds, the quantity available
for procurement. In Brazil’s case, the descending clock phase is followed by a final sealed bid,
which has seen prices fall up to 20% below the last of descending clock bids.
Open, descending clock auctions have the advantage of producing more competitive price
outcomes and are perceived to be more transparent than sealed bid auctions. This is a future
possibility for SA now that the RE sector is entrenched. However, this model may be too complex
to introduce in other developing countries at the current time, particularly since most of their
74 | Page
electricity sectors are less developed and will initially be limited to much smaller capacity
procurements than that awarded under the REIPPPP or, for example, in Brazil.
The REIPPPP has shown that a sealed bid tender is relatively straight forward to implement and
can achieve substantial competition, with price reductions. Bidders are also required to submit a
signed undertaking at bid submission that they have not discussed their bids with competitors.
2.4.6. Single Bid Round versus a Series of Bid Rounds
The REIPPPP's multiple bid round programme has offered several valuable lessons. Firstly, the
rolling bid window format has attracted continued market interest and stimulated competition. As
per IRENA &CEM (2015) and World Bank (2014), discussed above, stimulating competition to
reduce price outcomes is key to a successful competitive tender.
Under the REIPPPP, bidders have comfort in the knowledge that if their project fails to meet the
requirements by a specific bid window they are able to improve the project for the next auction.
The perceived ‘higher chance’ of being awarded a project at some point, knowing that there will
be several rounds of capacity on offer, encourages more investors to participate. In addition,
investor confidence in the off-taker and the country’s commitment to RE, builds with each
successfully completed round, thereby increasing the number of interested private sector players.
Secondly, a series of bid rounds allows for lessons to be learned and improvements to be made in
RfP documentation and contracts in each subsequent round (DOE, 2015; ERC, 2014). This
flexibility is important to streamline the process, reduce transaction costs and make participation
more attractive, which again increases the number of interested bidders. For example, the
introduction of “Returning Compliant Bidder” provisions as of BW 4 makes it less onerous for
previously unsuccessful bidders to resubmit bids. During this round the environmental and land
use consent requirements were also reduced so that only the NEMA environmental, and one or
two consents specific to each technology, were required upon submission. The remaining consents
were only required after the award of preferred bidder status, provided they would not delay FC.
75 | Page
This learning curve also applies to developers; they become familiar with the auction process and
are able to reduce costs and bid more competitively (IRENA & CEM, 2015). For example, in BW
1 none of the 53 bids submitted were fully compliant in terms of Part B to the RFP. The 'failures'
were largely due to non-material omissions and inconsistencies that were believed to be as a result
of the tight preparation timeframe (DOE, 2012).
Lastly, the REIPPPP benefited from growing public support as prices reduced, RE plants came
operational and economic development benefits began to emerge. For example, a CSIR Report
(2015) determined Eskom’s net savings to be approximately R4bn as a result of the contribution
from operational wind and solar plants in the first half of 2015.
2.4.7. Influencing the level of competition through the volume auctioned
It is believed that the size and readiness of the South African renewable energy market were
initially overestimated by the DOE (Eberhard, 2013); the capacity on offer in BW 1 significantly
exceeded that available from bid-ready projects. As a result competition was limited and BW 1
price outcomes were close to price caps.
In addition the programme's size and complexity placed significant strains on available legal and
financial advisory firms. Given the shortage of experienced advisory capacity, the DOE allowed
these firms to advise both government and bidders, provided that ring fencing mechanisms were
put in place as discussed in Part A Section 2 above. Even so, some bidders complained that legal
and financial firms were offering a "one size fits all" service due to their time and resource
constraints, which was not always appropriate to the project's unique characteristics (Eberhard,
2013).
Based on the above two points, it may have been more prudent to start smaller and then gradually
ramp up the program through larger capacity offerings in later rounds (Eberhard, 2013). An initial
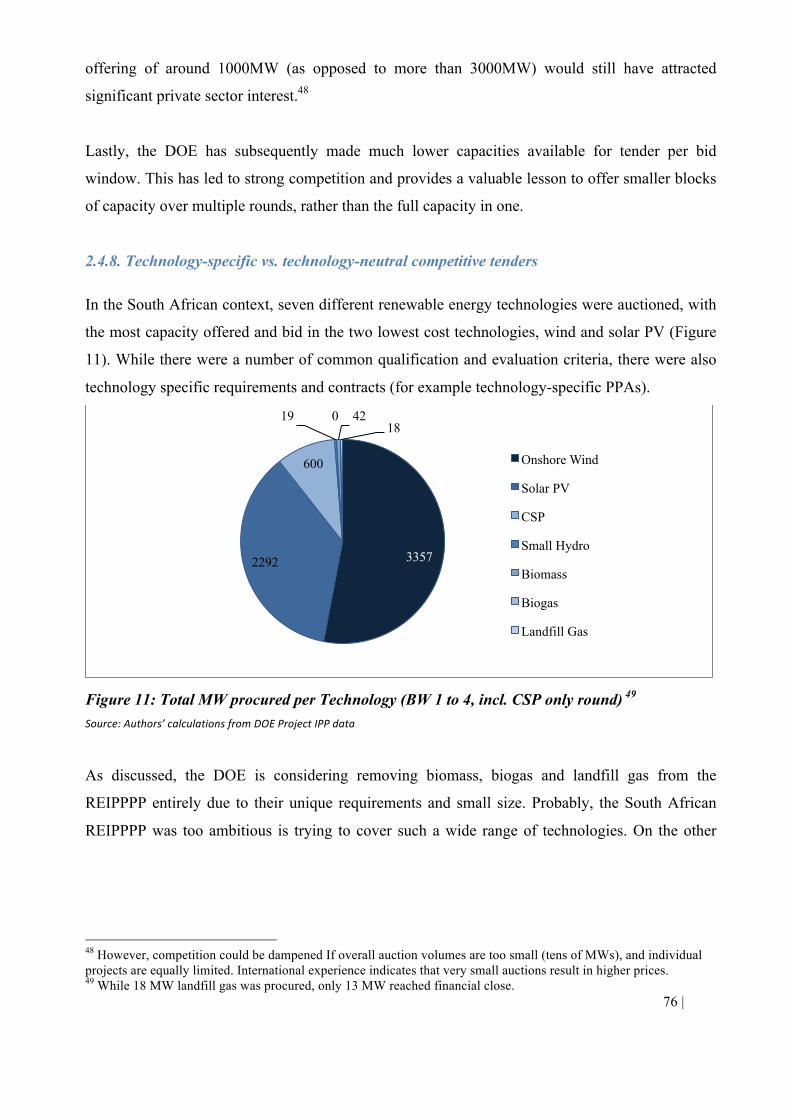
76 | Page
offering of around 1000MW (as opposed to more than 3000MW) would still have attracted
significant private sector interest.48
Lastly, the DOE has subsequently made much lower capacities available for tender per bid
window. This has led to strong competition and provides a valuable lesson to offer smaller blocks
of capacity over multiple rounds, rather than the full capacity in one.
2.4.8. Technology-specific vs. technology-neutral competitive tenders
In the South African context, seven different renewable energy technologies were auctioned, with
the most capacity offered and bid in the two lowest cost technologies, wind and solar PV (Figure
11). While there were a number of common qualification and evaluation criteria, there were also
technology specific requirements and contracts (for example technology-specific PPAs).
Figure 11: Total MW procured per Technology (BW 1 to 4, incl. CSP only round) 49 Source:Authors’calculationsfromDOEProjectIPPdata
As discussed, the DOE is considering removing biomass, biogas and landfill gas from the
REIPPPP entirely due to their unique requirements and small size. Probably, the South African
REIPPPP was too ambitious is trying to cover such a wide range of technologies. On the other
48 However, competition could be dampened If overall auction volumes are too small (tens of MWs), and individual projects are equally limited. International experience indicates that very small auctions result in higher prices. 49 While 18 MW landfill gas was procured, only 13 MW reached financial close.
3357 2292
600
19 42 0 18
Onshore Wind
Solar PV
CSP
Small Hydro
Biomass
Biogas
Landfill Gas
77 | Page
hand, the auctions were useful in revealing relative market prices and which technologies show
the greatest promise for cost and price reductions.
Whether or not other countries should use technology-neutral or -specific tenders depends on their
renewable energy resource, their power requirement, as well as grid constraints, and there is no
one-size-fits-all solution.
2.4.9. Limitation of individual project size per technology
As discussed, projects under each technology band are subject to maximum capacity limits. For
example, each wind and solar project is subject to a maximum limit of 140 MW and 75 MW,
respectively. Some have argued that these caps prevent greater economies of scale, which could
result in lower bid tariffs (Papapetrou, 2014); however, there are likewise strong arguments
regarding the benefits of capping the maximum size per project. Increasing the number of possible
bidders that may be awarded within each available technology capacity stimulates competition and
ensures that a single IPP cannot win the full capacity available for that technology through one
major project, which also better diversifies the buyer's risk in terms of seller non-performance.
Another consideration when looking at project size is the ability of the market to finance these
projects in terms of liquidity constraints.
Because the range is wide (i.e. wind project sizes may be 1 MW - 140 MW), the REIPPPP allows
smaller players to participate, provided they find innovative ways to reduce costs to be
competitive with larger projects benefiting from scale. However in practice an "uneven playing
field" has emerged where large RE developers with strong balance sheets (often foreign utilities)
are pushing smaller players out of the market (Papetrou, 2014). This has been a big challenge for
the SA REIPPPP and is an important lesson for developing countries that they should attempt to
balance a competitive environment with local, broad-based procurement (Papapetrou, 2014).
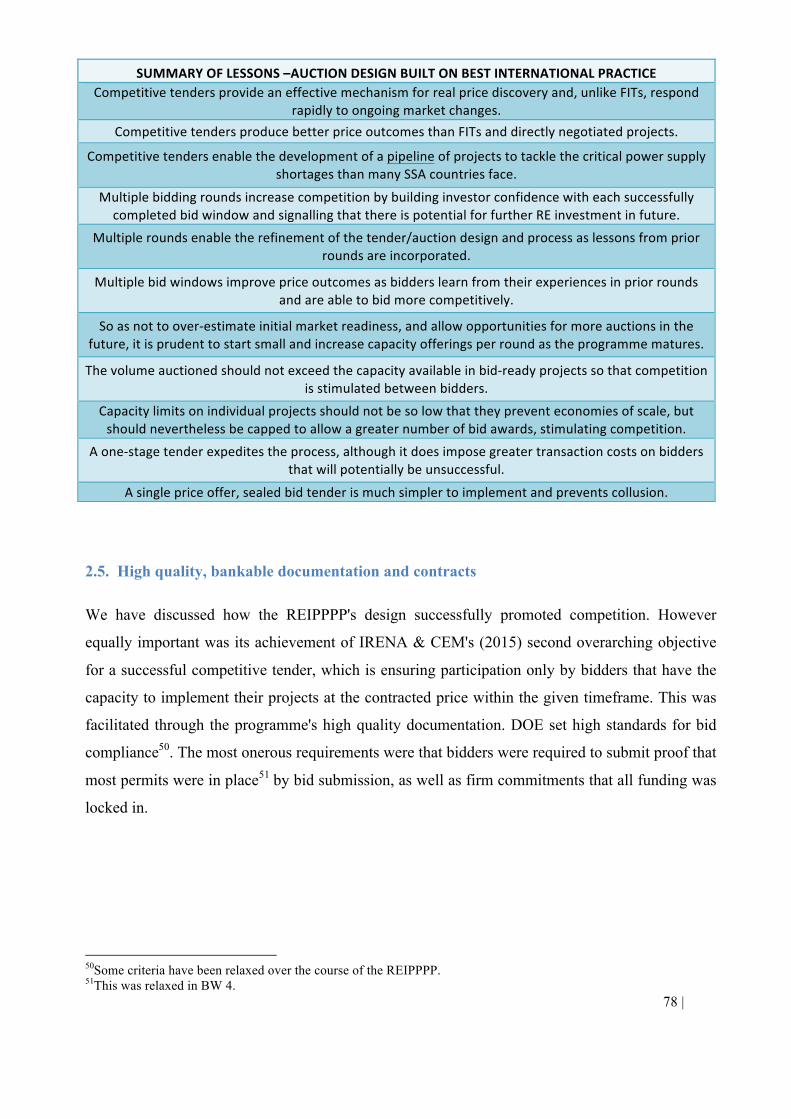
78 | Page
2.5. High quality, bankable documentation and contracts
We have discussed how the REIPPPP's design successfully promoted competition. However
equally important was its achievement of IRENA & CEM's (2015) second overarching objective
for a successful competitive tender, which is ensuring participation only by bidders that have the
capacity to implement their projects at the contracted price within the given timeframe. This was
facilitated through the programme's high quality documentation. DOE set high standards for bid
compliance50. The most onerous requirements were that bidders were required to submit proof that
most permits were in place51 by bid submission, as well as firm commitments that all funding was
locked in.
50Some criteria have been relaxed over the course of the REIPPPP. 51This was relaxed in BW 4.
SUMMARYOFLESSONS–AUCTIONDESIGNBUILTONBESTINTERNATIONALPRACTICECompetitivetendersprovideaneffectivemechanismforrealpricediscoveryand,unlikeFITs,respond
rapidlytoongoingmarketchanges.CompetitivetendersproducebetterpriceoutcomesthanFITsanddirectlynegotiatedprojects.
CompetitivetendersenablethedevelopmentofapipelineofprojectstotacklethecriticalpowersupplyshortagesthanmanySSAcountriesface.
MultiplebiddingroundsincreasecompetitionbybuildinginvestorconfidencewitheachsuccessfullycompletedbidwindowandsignallingthatthereispotentialforfurtherREinvestmentinfuture.
Multipleroundsenabletherefinementofthetender/auctiondesignandprocessaslessonsfrompriorroundsareincorporated.
Multiplebidwindowsimprovepriceoutcomesasbidderslearnfromtheirexperiencesinpriorroundsandareabletobidmorecompetitively.
Soasnottoover-estimateinitialmarketreadiness,andallowopportunitiesformoreauctionsinthefuture,itisprudenttostartsmallandincreasecapacityofferingsperroundastheprogrammematures.
Thevolumeauctionedshouldnotexceedthecapacityavailableinbid-readyprojectssothatcompetitionisstimulatedbetweenbidders.
Capacitylimitsonindividualprojectsshouldnotbesolowthattheypreventeconomiesofscale,butshouldneverthelessbecappedtoallowagreaternumberofbidawards,stimulatingcompetition.
Aone-stagetenderexpeditestheprocess,althoughitdoesimposegreatertransactioncostsonbiddersthatwillpotentiallybeunsuccessful.
Asinglepriceoffer,sealedbidtenderismuchsimplertoimplementandpreventscollusion.
79 | Page
These requirements were carefully designed to filter out bidders that were not financially,
technically or legally capable of implementing the project as promised within the given timeframe.
This would ensure that awarded projects would be as ''fail-safe'' as possible i.e. almost
”guaranteed” to proceed to financial close and construction timeously, and has been an effective
strategy thus far. As discussed in Section 4 earlier, a criticism of international RE competitive
tenders has been a failure to bring procured capacity online as a result of construction delays and
cancellations. In contrast, the REIPPPP's clean record to date indicates that valuable lessons can
be learned from the REIPPPP RFP requirements, and these are outlined below52.
2.5.1. Part A of the RFP: Key Requirements
Establishing general rules and requirements is a careful balancing act of eliminating non-serious
bids without creating barriers to entry for serious projects.
2.5.1.1. Restrictions on available capacity per technology and total capacity being tendered
This was key to stimulating competition. However the clause allowing the reallocation of MWs
between technologies, as well as the increase/ decrease of available MWs per technology and
overall, is important for giving the contracting authority flexibility in the face of unexpected bid
results (either good or bad).
2.5.1.2. Bid Bonds
As per IRENA & CEM (2015), while imposing strict rules on bid projects restricts competition to
those capable of delivering the promised quantity in the timeframe stated, if too stringent these
requirements may act as entry barriers for smaller and/or new players.
Historically high bid bonds have been known to deter investment. For example, in a 2009
Peruvian RE auction bidders were required to deposit several guarantees, including a high bid
52Where such requirements have been discussed as lessons under other categories, they are simply listed without further explanation.
80 | Page
bond of USD 20,000 per MW of capacity to be installed, which significantly deterred investment
(IRENA & CEM, 2015).
As a rough comparison the SA REIPPPP required a bid bond of ZAR 100,000 per MW at BW 4
(equivalent to only USD 8,000 at a ZAR:USD rate of 12.5:1), which bidders were required to
double to roughly USD 16,000 per MW before being officially appointed as preferred bidders.
While this was relatively high, it was necessary because of the lack of prequalification phase,
which normally eliminates bidders chancing their luck.
2.5.1.3. Advisor firms serving the DOE and bidders or lenders must create a "Chinese Wall" to
prevent conflicts of interest.
2.5.1.4. Bidders must pay a Development Fee equal to 1% of total project costs.
2.5.1.5. Strict confidentiality undertakings to prevent collusion.
The bidder may not discuss whether it is participating in any bid window or provide any related
details. All bid responses must be kept confidential.
2.5.2. Part B of the RFP: Key Requirements
2.5.2.1. The RFP must minimise variations in bid responses
A key lesson from the programme is to draft RFP documentation in a way that allows for as little
'qualitative' assessment as possible. The REIPPPP achieved this by ensuring that bid responses
received were as standardised as possible. Firstly Volume 1, Part 2 to the RFP contained the Form
of Bid and Returnable Schedules, which provided numerous standardised undertakings required
from bidders upon bid submission.
The RFP also included numerous Appendices (under various Volumes to the RFP) to the Part B
Qualification Criteria that provided templates for declarations and submissions required. A prime
81 | Page
example is Appendix R of Volume 4 (Financial Requirements), which provides template Letters
of Support from each category of funder, along with the RFP requirement that bidders must
submit their Letters of Support in substantially the same form as the template provided. The result
is that the evaluation teams do not have to consider in detail the terms of every individually
drafted Letter of Support submitted and ensure they are declaring what is required.
On the downside, this adds to bidders' preparation costs and as a result some requirements were
softened over time.
2.5.2.2. Refining the RFP over the course of the Programme
While the REIPPPP has maintained its thorough qualification criteria to date, requirements that
emerged as being excessively stringent as the programme progressed were relaxed in later rounds
to reduce unnecessary bidder burden and cost.
The most noteworthy example is the BW 4 RFP relaxation of land use criteria. As discussed
earlier, bidders were no longer required to prove by bid submission that all necessary applications
relating to land use change, subdivision, removal of restrictive conditions and zoning applications
had been made by the Project Company to secure the right to lawfully use the Project Site for the
intended project purpose. Instead proof would only be required post-appointment, if they were
selected as a preferred bidder.
Land use consents are extremely time consuming and expensive. The Sub-division of Agricultural
Land Act (SALA) requirements, with which a bidder must comply when a project is going to be
developed on "agricultural land" as defined under SALA by means of a 10+ year lease agreement,
are particularly onerous. The amendment highlights another key success factor of the REIPPPP -
the flexibility of the bid documentation in response to lessons learned from prior rounds. Non-core
environmental consents have been similarly relaxed, again on condition that these will be provided
post-appointment as a preferred bidder.
82 | Page
Another example of refining the process to reduce unnecessary bidder burden was the introduction
of the "Returning Compliant Bidder" clauses in BW 4, which potentially offer bidders from prior
rounds that are re-submitting their bids an exemption from responding to the extensive land
acquisition and land use criteria and environmental consent requirements under Part B.
This is however subject to certain important conditions. Firstly, it applies only where the
Returning Compliant Bidder submits a bid in respect of a project located on the same project site
that they submitted in an earlier BW response. In addition, this bidder's previous bid response
must have been approved as a Compliant Bid by the DOE under Part B of the RFP, but was
unsuccessful in the Part C Comparative Evaluation.
The REIPPPP was also able to strengthen requirements in later bid rounds, when necessary. For
example, Part B required a minimum of 40% "South African Entity Participation" in the Project
Company across bid windows. However this was initially defined as those entities "based and
registered in the Republic of South Africa, which have legal and beneficial participation in the
Project Company" (DOE RFP, 2011). From BW 3 the definition was narrowed to participation by
South African Citizens53, determined by looking through the Bidder and Member structure to
determine the ultimate natural citizens to whom the shareholding benefits will accrue (DOE RFP,
2013). This was done to prevent international companies from circumventing this requirement by
simply establishing subsidiaries in South Africa, but still taking all shareholding benefits offshore,
and ensured that South Africans would benefit from the programme.
2.5.2.3. Land Acquisition and Land Use Criteria & Evaluation
Land options (for the purchase of land upon award of preferred bidder status) are allowed to be
submitted in the bid response. In contrast the Uganda GET FiT Solar Programme only permitted
submission of the title deeds indicating ownership or a lease agreement, which some developers
cited as a deterrent.
53As direct or indirect shareholders in the Project Company
83 | Page
The removal of the requirements for land use consents at bid submission is another key element.
2.5.2.4. Environmental Consent Criteria & Evaluation
As discussed, some of the non-core environmental consent criteria have been relaxed from BW 4.
2.5.2.5. Financial Criteria & Evaluation
Prevention of “low-balling” through stringent Financial Requirements
The documentation requirements were designed to prevent “low-balling” (Eberhard et al, 2014) - a
common occurrence in RE auctions where bidders under-state their bid prices to win tenders.
They later attempt to increase the bid tariff during contract negotiations which results in deals not
closing, or later stall/ halt the process as construction cost over-runs place the project under
financial strain.
In order to prevent this, the REIPPPP required Letters of Support as opposed to Letters of
Indicative Support from the project’s equity sponsors/ corporate finance providers and their
external debt lenders. Letters of Indicative Support simply confirm that the relevant financier has
held preliminary discussions with the bidder for providing finance. The DOE, however, wished to
ensure that financing was locked in upon bid submission. This requirement was highly unusual for
a RE competitive tender, effectively transferring a greater share of the project development risk to
the debt providers and basically outsourcing the due diligence to them (Eberhard et al, 2014). This
is because finance providers will only sign the required letter upon extensively assessing and
testing the project proposal and its projected cash flows so that any “low-balling” would be
detected before bid submission and save the DOE experts from wasting time evaluating
implausible projects.
Local content requirements supported through forex coverage restrictions
Bidders cannot hedge until FC and therefore require some protection against forex changes
between bid submission and FC. The DOE decided to protect them only in respect of the foreign
84 | Page
currency movement on 60% of capex, because at least 40% should be local content as per the ED
threshold.
2.5.2.6. Economic Development Criteria & Evaluation
Voluntary targets in respect of difficult criteria:
While the REIPPPP’s ED criteria have been ambitious, 3 of these 7 criteria (relating to
preferential procurement, management control and enterprise development contributions) set
targets and not thresholds, which means that their realisation is voluntary and bidders that do not
fulfil them will not be disqualified from progressing to the second stage comparative evaluation
(although they will score zero for those criteria in the comparative evaluation). This ensures that,
where the fulfilment of criteria is challenging, bidders are not discouraged from participating due
to an inability to do so.
2.5.2.7. Value for Money
In order to pass this threshold, the bid project had to demonstrate 'value for money' through the
assessment of numerous factors. The requirement that 'excessive success payments' could result in
failure of this criterion, albeit without a clear definition of what constituted an ‘excessive’ amount,
was essential for ensuring that developers did not inflate these costs. It was taken one step further
in the SP-IPPPP, through the requirement that success payments could not exceed 2.5% of total
project costs.
2.5.3. Part C of the RFP: Key Requirements
2.5.3.1. Inclusion of non-price factors in final evaluation
African countries may also wish to include an ED component, both to sustain political support and
to align the programme with broader development objectives such as poverty alleviation. However
this does create a price trade-off by adding compliance complexity and costs, as was evidenced in
the SA REIPPPP.
85 | Page
Country-specific applicability would have to be considered; however at a basic level we would
recommend that the non-price component includes the requirement for developers to contribute
1% of their future project revenues to SED commitments, which is the minimum requirement
under the SA REIPPPP and must be committed in order to qualify for evaluation. This will benefit
the local community and, if utilized effectively, help to maintain a good relationship with its
members for the duration of the project life.
The principles of nurturing local job creation and local ownership (albeit through small percentage
holdings) are also easily transferable to other countries, although thresholds and targets would
have to be adjusted to present realistic goals in each country’s context. Local content
requirements, on the other hand, are not easily transferable. Local content requirements, on the
other hand, are not easily transferable, given the smaller market sizes and lack of local
manufacturing capacity.
2.5.3.2. Incentives to maximize IPP performance in terms of ED components
As described earlier, bidders were initially allocated a set number of points for passing the
threshold/ target ED requirements. This has been revised in subsequent RFPs so that bidders are
now scored on a relative scale based on where they rank between the maximum bidder
commitment/ target, depending on which is higher, and the threshold level/ zero, depending on
whether or not the criterion is voluntary. This clever design ensures that bidders maximize their
pledged commitments whereas before they simply had to meet the threshold/ target to acquire a
flat score.
2.5.4. Standardised and Non Negotiable Contracts
2.5.4.1. Power Purchase Agreements
The PPA must be considered ''bankable'' by potential lenders
The PPA is key to the viability of any IPP procurement programme. While it is technically an
agreement between the IPP and the off-taker, it is critical that any project financed with external
86 | Page
debt has a PPA that lenders consider ''bankable'' (i.e. satisfactory) in order to access debt. Under
the REIPPPP the PPA was standardised and non-negotiable, so the programme champion
considered international best practice and consulted extensively with potential lenders (i.e. local
financial institutions) prior to the drafting of this PPA to ensure that the contract would address
their needs.
The benefit of standardised, non-negotiable contracts is that FC is reached much quicker than
negotiable contracts under a directly negotiated project for example, where the latter is a lengthy
iterative process. As a result it is important to draft these contracts appropriately in the first place
to ensure that non-bankable contracts do not delay or stall FC entirely.
A PPA must fairly apportion risks
PPAs must sufficiently protect the buyer, in this case Eskom, but also be reasonable in terms of
minimizing revenue risks for IPP sponsors and debt providers over the life of the project. The
REIPPPP's PPA was unique in that Eskom, the buyer, assumed much less risk than had typically
been the case in international PPA's for RE procurement, with two key examples provided below.
Firstly, the DOE decided to take on very limited force majeure risk, in terms of what can cause the
PPA to be terminated, compared to common international experience at the time. Specifically,
they only considered war (including embargoes & sanctions), biological contamination,
environmental contamination and nuclear contamination as typical force majeure. Anything else
was merely a relief event i.e. time would be added to the PPA to compensate the IPP or relief from
its obligation would be allowed, but the single buyer/ government would not pay any amount at
that time and there was no termination of the PPA.
Secondly, PPAs at the time had typically provided compensation for ''unforeseeable conduct'',
broadly covering unforeseen changes in law. The REIPPPP narrowed this definition to include
only the following scenarios:
87 | Page
o Discriminating government action - e.g. NERSA wouldn't issue a license to the IPP for a
trivial reason.
o Changes to the Grid Code -the IPP would be protected against any changes that would impact
on the tariff (e.g. changes to tariff methodology).
The rationale behind this was that all other businesses in the private sector face the risk of changes
in law (such as changes in tax) without being compensated by government; therefore the IPP
should not receive additional protection simply because the other party to the contract was a
governmental organisation.
Developing governments cannot afford to take on as much risk as those in developed countries. In
South Africa's case, termination payments are not allowed for anything other than government
default, thus ensuring that the government balance sheet is not encumbered with contingent
liabilities.
On the other hand, the PPA needs to protect investors. Only predefined 'seller defaults' bring about
termination of the PPA (unless at the request of a lender). A key innovation of the South African
programme is that sellers do not receive termination payments in the event of seller default, which
was a marked difference from most international PPA's.
2.5.4.2. Implementation Agreement
The primary function of the IA is to offer government support in the event of non-payment by the
single buyer, Eskom. In South Africa, it also imposes ED obligations on the IPP and places
limitations on changes in equity ownership post-COD.
Provide credit support to the off-taker
The IA provided that the South African government would stand behind Eskom in the event of
late or non-payment, provided that the IPP followed predefined due process. This is not a
sovereign guarantee in the strict sense of the word, but more a sovereign support because of
Eskom's current poor financial status. To minimise government's liability in this regard, the
88 | Page
government, Eskom and NERSA signed a Government Framework Support Agreement (GFSA),
which prescribes clear rules around this ''sovereign support''. For example, within South Africa’s
electricity tariff allocation is a proportional allocation to cover the payments to IPP's. The GFSA
prohibits Eskom from using this for any purpose (for example, upgrading the grid) other than
paying IPPs, which ensures Eskom will have sufficient funds and should avoid government
having to step in.
Impose consequences for failure to perform ED obligations
The IA did not just serve as a guarantee, but also imposed obligations in terms of meeting certain
criteria (discussed above). The fact that non-compliance with ED criteria can result in termination
points has resulted in lenders being extremely conscious of these obligations and ensuring that
IPPs do not fall behind, which in turn assists the DOE with monitoring and the enforcement of
required obligations. Consequently some IPPs have accumulated termination points, but none to
the extent that the IA has been terminated.
Clauses restricting changes in ownership post-COD
For the entire operating period, the IA prohibits the IPP from affecting a change in control of the
Project Company (or in any company of which it is a subsidiary) without prior written approval
from the DOE. Additionally, for three years after COD the Project Company must not permit any
change in equity54 whatsoever (such as dilution, sale, transfer etc.), whether in part or in whole,
without prior written DOE approval.
The IA also holds the IPP to the Ownership obligations under the ED criteria, requiring that no
sale, assignment, cession, transfer, exchange, renunciation or other disposal of equity may result in
the Seller breaching its undertakings with regard to the Ownership criterion under the ED criteria.
Furthermore no dilution in the aggregate Shareholding by Black People below these obligations is
permitted.
54This also applies to the dilution, sale, assignment, cession, transfer, exchange, renunciation or other disposal of the issued share capital of and/or the shareholder loans in and to a Conduit Shareholder (BW 4 IA, 2014).
89 | Page
These restrictions on changes in ownership ensure that South African citizens, Black individuals
and local communities truly benefit from the project over the duration of its term. This prevents
bidders from treating the ownership criterion as a ''tick box exercise'' to win awards, after which
ownership percentages are changed and economic benefits do not stay within South Africa.
However the restriction on changes in equity for 3 years from COD can be limiting, particularly
considering that the risk profile of these projects reduces significantly from construction to
operation and so they could be refinanced to free up construction finance, which is considered too
risky by the broader equity market.
2.5.4.3. Direct Agreement
This agreement with lenders is fairly standard and was developed after engagement with banks
and developers to determine appropriate risk allocations.
2.6. Fairness, transparency and trust building with the private sector
2.6.1. Evaluations conducted under strict security conditions
The REIPPPP tender evaluation process has been beyond reproach. Despite the large number of
unsuccessful bids, there have been no formal or legal challenges to any of the award decisions.
Careful attention was given to ensuring that evaluations were independent and transparent.
Independent evaluators (being the afore-mentioned professional firms) conducted tender
evaluations in a secure environment and were filmed by CCTV cameras. The process was
therefore trusted by developers (ERC, 2014).
2.6.2. Thorough Review Process
Evaluation reports per project were prepared by each discipline (e.g. technical/ legal/ financial),
after which they had to be reviewed by independent review teams. Linklaters and Blueprint
Consulting performed the legal and technical independent reviews, respectively, while Ernst &
Young and PWC cross-moderated each other's financial evaluation work (Pickering, 2013).
90 | Page
Finally, an independent governance review of the overall process was conducted (ERC, 2014).
Ernst & Young was responsible for this, by observing the receipt and evaluation of bid responses
and identifying any areas of non-compliance with the Evaluation Manual (Pickering, 2013).
2.6.3. Meeting deadlines
In order for a government-run programme to build private sector trust it must effectively meet
deadlines. Despite a few exceptions, the REIPPPP has generally done this and kept the evaluation
periods short (1 – 2 months only per bid window). However, later rounds have seen some
slippages, some due to delays in Eskom issuing budget quotes to preferred bidders.
2.6.4. Strong communication with the private sector
As discussed previously, the National Treasury PPP Unit already had significant expertise in
working with the private sector. There were numerous consultations with banks and project
developers as the bid documentation was developed. In general, the programme has been
characterised by openness of the IPP office (with DoE) to listen to the private sector and funders,
and adapt if necessary. In addition the DOE IPP unit made a concerted effort to communicate with
bidders in order to build trust and receive feedback. For example, a compulsory pre-bid workshop
conference was held in 2011 to take bidders through the process before BW 1 submission, and this
was done again for BW 3 when there were numerous revisions. Any responses to queries during
the bidding process were set out in briefing notes and distributed to all bidders to ensure the
process was fair.
2.7. Capital markets that provide adequate and competitively priced funding
2.7.1. Debt funding for projects
The success of South Africa’s REIPPPP was facilitated by a well developed local financial and
banking sector. This is not necessarily a transferable lesson, considering that certain African
countries have underdeveloped financial markets relative to South Africa. As a result greater
reliance may have to be placed on DFIs for IPP funding. Alternatively, as discussed above, other
African countries could present road shows to incentivise finance from South African banks and
pension funds.
91 | Page
Over time, some of the South African projects will need to be refinanced, thus creating a
secondary market with increased life and pension fund participation, while enabling commercial
banks to continue supporting the development of new projects. This would also be a long-term
consideration for any country planning a significant RE IPP roll out - how to refinance projects
once they are operational so that experienced lenders who are willing to assume construction risk
are freed up to finance future projects as well.
2.7.2. DFI Support
The SA REIPPPP also benefited from DFI support, not only in terms of initial funding to design
the programme but also through their debt support to numerous projects over the bid rounds.
Together the DBSA and IDC have provided total debt financing of R17.5bn to projects under the
REIPPPP (incl. SP-IPPP), which is equivalent to 13.6% of the total debt commitment to date.
International DFIs have also played a role, contributing R9.8bn (7% of total debt pledged). There
are numerous international and regional DFIs willing to offer assistance to Sub-Saharan African
countries so it is expected that other countries will benefit from this support as well.
2.8. Maintain credibility of the procurement programme
To date, Eskom has paid all IPPs as and when due, which sends a positive signal to the private
sector to maintain interest for future bid windows. In addition, all bidders were issued with cost
estimate letters within 90 days although recent statements by Eskom have provided cause for
concern about whether this will continue to be the case.
2.9. Grid connection
Increasingly, South Africa's grid connection constraints have begun to adversely affect the
REIPPPP. This is now that all the 'low hanging fruits' have been picked and future grid
connections will require more ''deep connection works'' i.e. dispersed transmission capacity
upgrades, which Eskom does not have sufficient funds to carry out. Bidders were permitted to
92 | Page
select their own project sites, which was unusual compared to international tenders. Sites were
chosen based on the quality of resource and corresponding energy output level.
In hindsight, it may have been beneficial for the DOE to limit project sites to specific zones where
transmission capacity was in place, or could be strategically upgraded to serve several projects.
For example, in the Uganda GET FiT Solar PV competitive tender, projects located in the
designated "green priority zones" were awarded more points, and all project sites had to be within
3km of an interconnection point to the grid to reduce the shallow connection time and cost burden.
Following a recent Strategic Environmental Assessment, on the 17th February 2016 the South
African Cabinet approved the gazetting of Renewable Energy Development Zones (REDZ). These
REDZ essentially concentrate wind and solar PV development in specific zones, designed to:
- Reduce the negative environmental consequences of these projects.
- Align authorisation and approval processes in a way that will reduce bureaucracy and the
cost of compliance.
- Offer attractive incentives to create a more enabling investment environment.
- Most importantly, allow for the focused expansion of South Africa's grid (Dempster & van
der Merwe, 2016).
This is a positive step towards integrating IPP investments into grid planning and minimising
delays and associated costs.
Lastly, bidders were previously allowed to complete the shallow works on a self-build basis, or
pay Eskom to complete the works. As of the Expedited Bid Window, all projects were explicitly
required to self-build the shallow connection works, which avoids further constraining Eskom's
already limited resources.
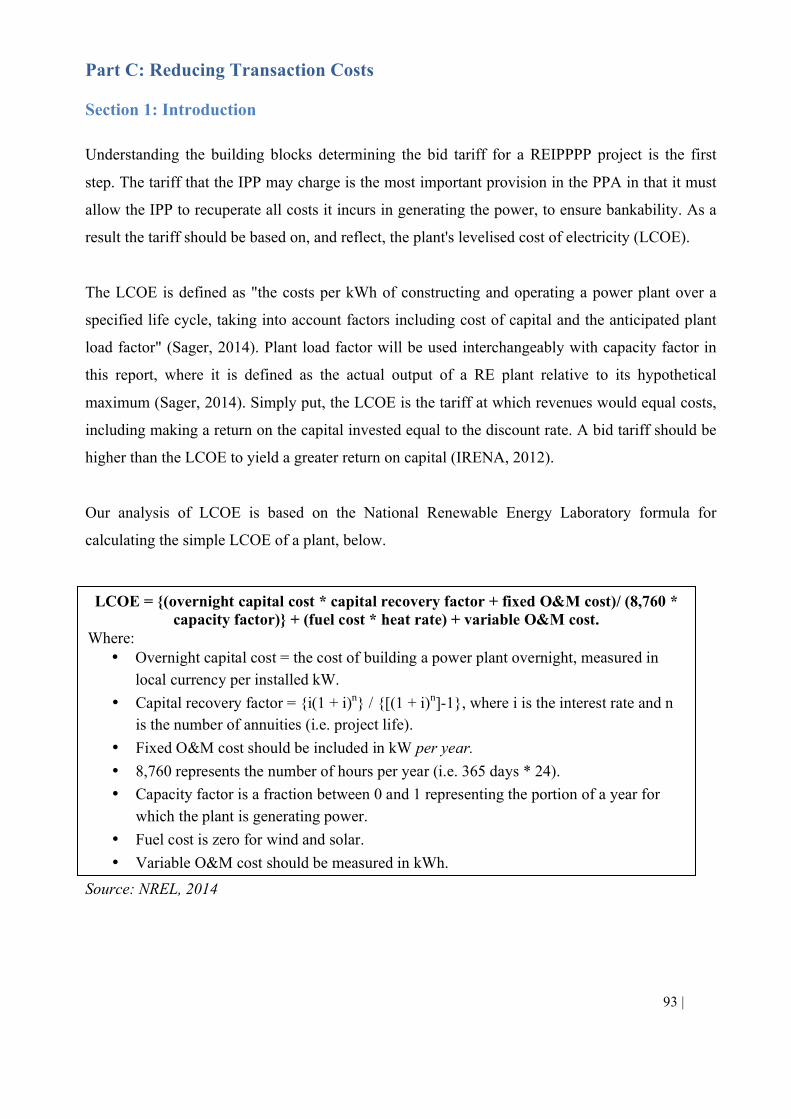
93 | Page
Part C: Reducing Transaction Costs
Section 1: Introduction
Understanding the building blocks determining the bid tariff for a REIPPPP project is the first
step. The tariff that the IPP may charge is the most important provision in the PPA in that it must
allow the IPP to recuperate all costs it incurs in generating the power, to ensure bankability. As a
result the tariff should be based on, and reflect, the plant's levelised cost of electricity (LCOE).
The LCOE is defined as "the costs per kWh of constructing and operating a power plant over a
specified life cycle, taking into account factors including cost of capital and the anticipated plant
load factor" (Sager, 2014). Plant load factor will be used interchangeably with capacity factor in
this report, where it is defined as the actual output of a RE plant relative to its hypothetical
maximum (Sager, 2014). Simply put, the LCOE is the tariff at which revenues would equal costs,
including making a return on the capital invested equal to the discount rate. A bid tariff should be
higher than the LCOE to yield a greater return on capital (IRENA, 2012).
Our analysis of LCOE is based on the National Renewable Energy Laboratory formula for
calculating the simple LCOE of a plant, below.
Source: NREL, 2014
LCOE = {(overnight capital cost * capital recovery factor + fixed O&M cost)/ (8,760 * capacity factor)} + (fuel cost * heat rate) + variable O&M cost.
Where: • Overnight capital cost = the cost of building a power plant overnight, measured in
local currency per installed kW. • Capital recovery factor = {i(1 + i)n} / {[(1 + i)n]-1}, where i is the interest rate and n
is the number of annuities (i.e. project life). • Fixed O&M cost should be included in kW per year. • 8,760 represents the number of hours per year (i.e. 365 days * 24). • Capacity factor is a fraction between 0 and 1 representing the portion of a year for
which the plant is generating power. • Fuel cost is zero for wind and solar. • Variable O&M cost should be measured in kWh.
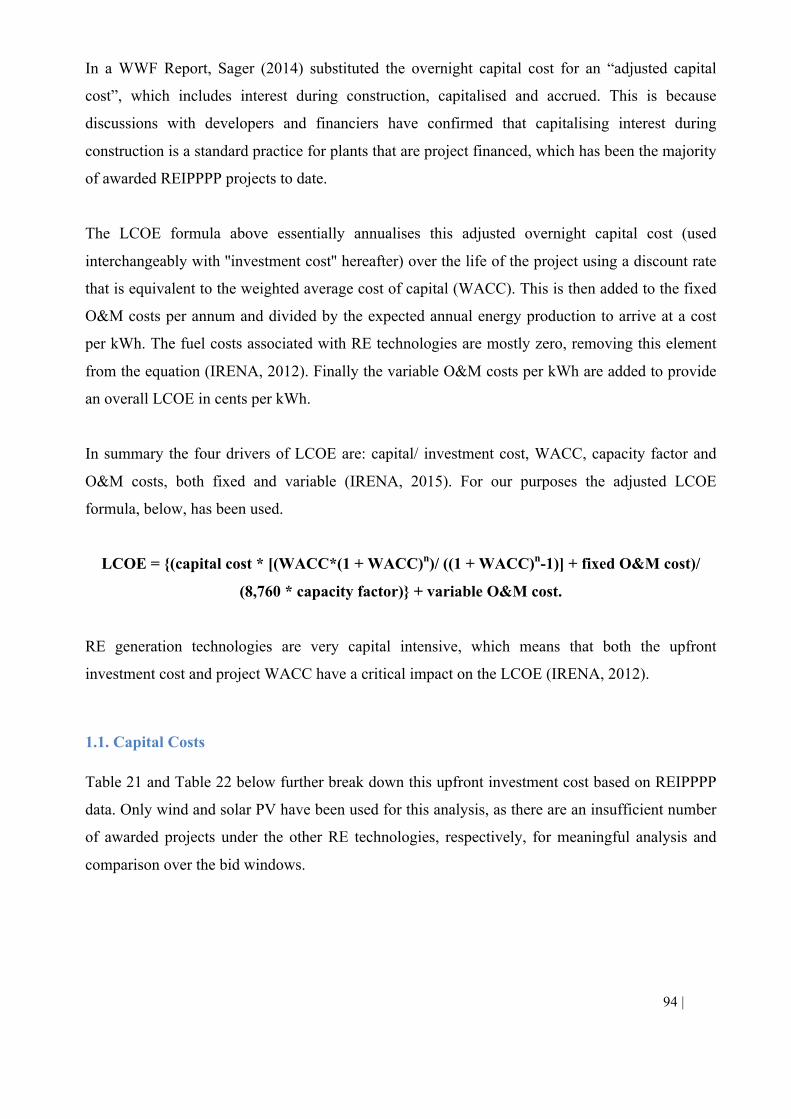
94 | Page
In a WWF Report, Sager (2014) substituted the overnight capital cost for an “adjusted capital
cost”, which includes interest during construction, capitalised and accrued. This is because
discussions with developers and financiers have confirmed that capitalising interest during
construction is a standard practice for plants that are project financed, which has been the majority
of awarded REIPPPP projects to date.
The LCOE formula above essentially annualises this adjusted overnight capital cost (used
interchangeably with ''investment cost'' hereafter) over the life of the project using a discount rate
that is equivalent to the weighted average cost of capital (WACC). This is then added to the fixed
O&M costs per annum and divided by the expected annual energy production to arrive at a cost
per kWh. The fuel costs associated with RE technologies are mostly zero, removing this element
from the equation (IRENA, 2012). Finally the variable O&M costs per kWh are added to provide
an overall LCOE in cents per kWh.
In summary the four drivers of LCOE are: capital/ investment cost, WACC, capacity factor and
O&M costs, both fixed and variable (IRENA, 2015). For our purposes the adjusted LCOE
formula, below, has been used.
LCOE = {(capital cost * [(WACC*(1 + WACC)n)/ ((1 + WACC)n-1)] + fixed O&M cost)/
(8,760 * capacity factor)} + variable O&M cost.
RE generation technologies are very capital intensive, which means that both the upfront
investment cost and project WACC have a critical impact on the LCOE (IRENA, 2012).
1.1. Capital Costs
Table 21 and Table 22 below further break down this upfront investment cost based on REIPPPP
data. Only wind and solar PV have been used for this analysis, as there are an insufficient number
of awarded projects under the other RE technologies, respectively, for meaningful analysis and
comparison over the bid windows.
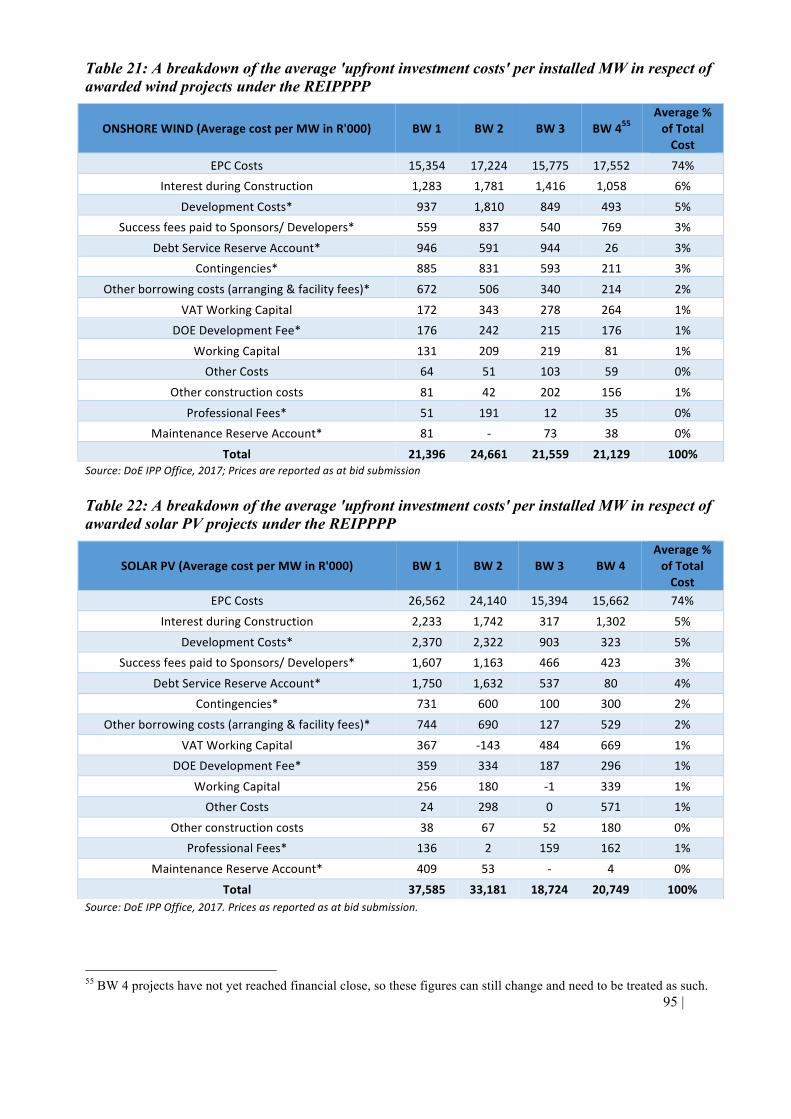
95 | Page
Table 21: A breakdown of the average 'upfront investment costs' per installed MW in respect of awarded wind projects under the REIPPPP
Source:DoEIPPOffice,2017;Pricesarereportedasatbidsubmission
Table 22: A breakdown of the average 'upfront investment costs' per installed MW in respect of awarded solar PV projects under the REIPPPP
Source:DoEIPPOffice,2017.Pricesasreportedasatbidsubmission.
55 BW 4 projects have not yet reached financial close, so these figures can still change and need to be treated as such.
ONSHOREWIND(AveragecostperMWinR'000) BW1 BW2 BW3 BW455Average%ofTotalCost
EPCCosts 15,354 17,224 15,775 17,552 74%InterestduringConstruction 1,283 1,781 1,416 1,058 6%
DevelopmentCosts* 937 1,810 849 493 5%SuccessfeespaidtoSponsors/Developers* 559 837 540 769 3%
DebtServiceReserveAccount* 946 591 944 26 3%Contingencies* 885 831 593 211 3%
Otherborrowingcosts(arranging&facilityfees)* 672 506 340 214 2%
VATWorkingCapital 172 343 278 264 1%DOEDevelopmentFee* 176 242 215 176 1%
WorkingCapital 131 209 219 81 1%OtherCosts 64 51 103 59 0%
Otherconstructioncosts 81 42 202 156 1%
ProfessionalFees* 51 191 12 35 0%MaintenanceReserveAccount* 81 - 73 38 0%
Total 21,396 24,661 21,559 21,129 100%
SOLARPV(AveragecostperMWinR'000) BW1 BW2 BW3 BW4Average%ofTotalCost
EPCCosts 26,562 24,140 15,394 15,662 74%
InterestduringConstruction 2,233 1,742 317 1,302 5%
DevelopmentCosts* 2,370 2,322 903 323 5%SuccessfeespaidtoSponsors/Developers* 1,607 1,163 466 423 3%
DebtServiceReserveAccount* 1,750 1,632 537 80 4%Contingencies* 731 600 100 300 2%
Otherborrowingcosts(arranging&facilityfees)* 744 690 127 529 2%
VATWorkingCapital 367 -143 484 669 1%DOEDevelopmentFee* 359 334 187 296 1%
WorkingCapital 256 180 -1 339 1%OtherCosts 24 298 0 571 1%
Otherconstructioncosts 38 67 52 180 0%ProfessionalFees* 136 2 159 162 1%
MaintenanceReserveAccount* 409 53 - 4 0%
Total 37,585 33,181 18,724 20,749 100%
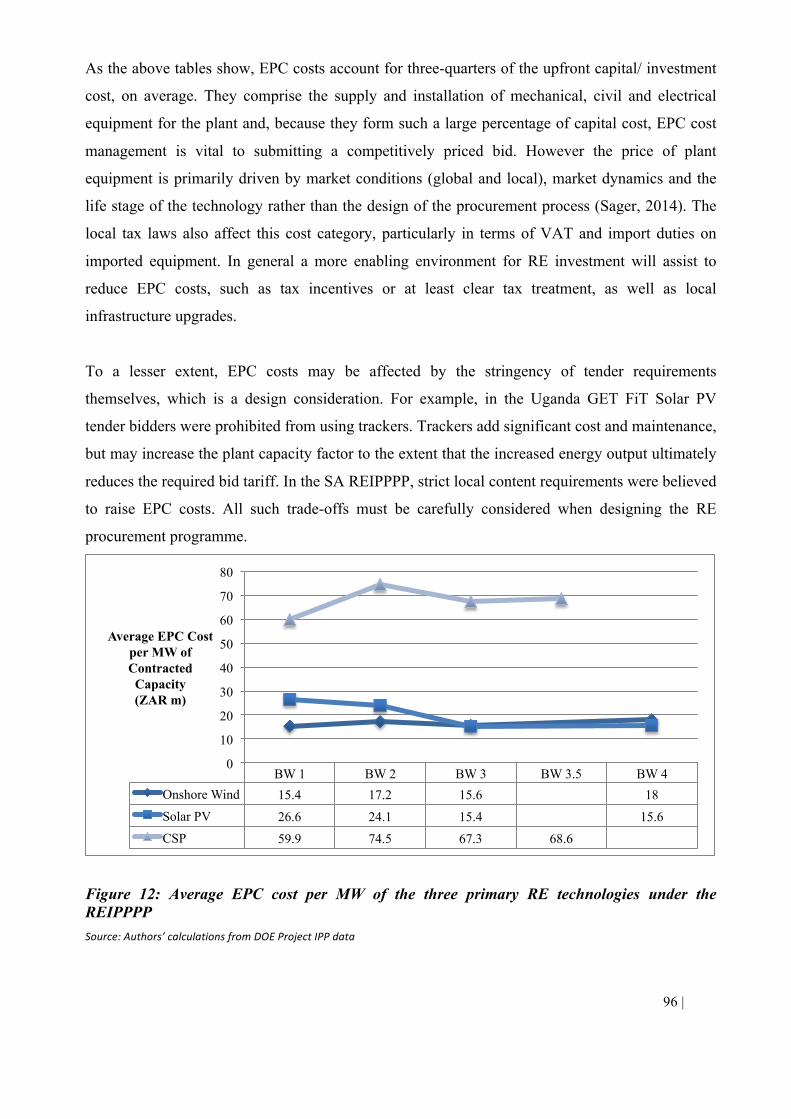
96 | Page
As the above tables show, EPC costs account for three-quarters of the upfront capital/ investment
cost, on average. They comprise the supply and installation of mechanical, civil and electrical
equipment for the plant and, because they form such a large percentage of capital cost, EPC cost
management is vital to submitting a competitively priced bid. However the price of plant
equipment is primarily driven by market conditions (global and local), market dynamics and the
life stage of the technology rather than the design of the procurement process (Sager, 2014). The
local tax laws also affect this cost category, particularly in terms of VAT and import duties on
imported equipment. In general a more enabling environment for RE investment will assist to
reduce EPC costs, such as tax incentives or at least clear tax treatment, as well as local
infrastructure upgrades.
To a lesser extent, EPC costs may be affected by the stringency of tender requirements
themselves, which is a design consideration. For example, in the Uganda GET FiT Solar PV
tender bidders were prohibited from using trackers. Trackers add significant cost and maintenance,
but may increase the plant capacity factor to the extent that the increased energy output ultimately
reduces the required bid tariff. In the SA REIPPPP, strict local content requirements were believed
to raise EPC costs. All such trade-offs must be carefully considered when designing the RE
procurement programme.
Figure 12: Average EPC cost per MW of the three primary RE technologies under the REIPPPP Source:Authors’calculationsfromDOEProjectIPPdata
BW 1 BW 2 BW 3 BW 3.5 BW 4 Onshore Wind 15.4 17.2 15.6 18 Solar PV 26.6 24.1 15.4 15.6 CSP 59.9 74.5 67.3 68.6
0
10
20
30
40
50
60
70
80
Average EPC Cost per MW of Contracted Capacity (ZAR m)
97 | Page
Debt-associated costs are the second largest investment cost category, with capitalised interest
during construction, other borrowing costs (facility and arranging fees) and the debt service
reserve account (DSRA) together constituting 9 - 11% of the upfront project cost. Both the
arranging fee and DSRA are considered transaction costs, and will be discussed in Section 2
below.
All other major cost categories marked with a star in Table 21 and Table 22, including
development costs, success fees, contingencies and professional fees, are considered transaction
costs and will be analysed under Section 2 of this Part C. While these costs have a lesser impact
on the LCOE than factors such as the cost of equipment and the WACC, the latter which will be
discussed below, to be competitive bidders need to shave all cost items and margins to the
minimum. Because transaction costs are largely driven by tender design and requirements, they
will form the focus of our analysis.
1.2. Cost of Capital (Discount Rate)
The WACC is determined by the availability and cost of equity and debt, as well as the capital
structure i.e. the portion of project cost funded by equity and debt, respectively. Both the required
return on equity and cost of debt vary between countries and projects. On a country level, policy
and regulatory settings should be used to minimise the perceived risks of RE investment, thereby
reducing the WACC and LCOE in turn (IRENA, 2015).
According to Sager (2014), the deal structure presents the most variability in the financing cost
and therefore provides the greatest opportunity for cost reductions. This was shown by the use of
corporate financing by Enel in BW 3, which gave the company a significant cost advantage over
project-financed projects due to the lower interest rate associated with balance sheet financing56.
The WWF compared the impact on WACC and LCOE of a hypothetical project- versus corporate-
financed deal in BW 3 and determined that corporate financing would have reduced the WACC by
1.1%, in turn reducing the bid tariff by 7 - 8% (Sager, 2014). These types of deals are expected to
increase in popularity. On the other hand, many project-financed projects have increased their
gearing from the conventional 70:30 debt:equity ratio to 80:20, in order to access cheaper debt
capital and reduce the WACC (Sager, 2014).
56 ENEL is apparently considering re-financing some of their corporate finance positions using project finance, although nothing has been concluded yet.
98 | Page
Not only has competition increased between bidders from BW 1 - 4, but also between lenders to
win bidders and partner with Tier 1 sponsors, in particular. This is because Tier 1 sponsors have
proven themselves to be highly competent and trustworthy in prior rounds, reducing the perceived
risk of lending to them and meaning that lenders need to compete for their business through
offering more competitive rates. It is estimated that this competition has led to a 100 basis points
(bps) drop in interest rates on project financing since BW 1 and as of 2014 the estimated pre-tax
nominal cost of debt ranged from JIBAR + 270 - 390 bps i.e. approximately 11.3%. Future
reductions are uncertain, as syndicated debt buyers such as asset managers show little appetite
below JIBAR + 300 basis points (Sager, 2014).
Discussions with developers have revealed that the required return on equity has reduced
significantly over the bid windows, with some global utilities such as Enel able to accept post-tax
nominal unleveraged equity returns as low as 8 - 10%. On average it is estimated that the post-tax
nominal equity return as at 2014 was 18% (Sager, 2014). In other African countries the WACC
could be reduced by permitting foreign equity investment, as was the case in the REIPPPP (up to
60% foreign equity ownership), as these global investors are generally willing to accept lower
returns.
1.3. Operations & Maintenance Costs
Annual O&M costs over the project life, both fixed and variable, are significant and typically
account for 20 - 25% or more of the LCOE (IRENA, 2015). They include equipment maintenance
and refurbishment costs, operating staff, site running costs and insurance, amongst others. A
manager at an operational PV plant informed us that security costs for this site account for a
sizeable 30- 40% of annual O&M costs, due to initial problems with theft. Most operational
REIPPPP sites appear to have strict security measures, which may not be necessary in other
countries and could assist to reduce this driver of LCOE.
1.4. Capacity factor
The capacity factor is technology- and site-specific, and beyond the scope of this report.
99 | Page
Section 2: Tender Design and Reducing Transaction Costs
It is important to distinguish between transaction costs that affect bidder cash flow and cost/
expense, respectively. For example, paying for the EIA is a cash outflow that forms part of the bid
development cost, and can later be recovered through inclusion in the bid tariff. A contingency, on
the other hand, is factored into the proposed bid tariff as a buffer for cost overruns during
construction, but does not actually involve any cash outflow for the bidder prior to bid submission.
While reducing the cash outflow for bidders prior to submission may assist in increasing
competition through minimising irrecoverable losses in the event of bid rejection, shaving all costs
that add to the bid tariff reduces the ultimate cost of RE to the host government and consumer. As
a result all costs, and not cash-costs only, have been considered.
From a government perspective, transaction costs are those incurred in designing and running the
competitive tender. For bidders, however, they relate to the preparation of bids, project
development costs, reaching financial close, construction and reaching COD.
In the above tables ''development costs'' are broadly defined, and a significant amount of the cost
pertains to grid connection costs, thus accounting for a large 4 - 5% of the upfront investment cost.
Strictly speaking, ''bid development costs'' - being costs for legal, financial and technical advice,
permits and consents, SPV establishment and so forth - are much less than this broader definition,
with IPPs generally estimating them at R5 - R15 million for REIPPPP projects.
Multiple tender rounds/ bid windows
Several interviews with REIPPPP and SP-IPPPP participants revealed that, above all else, a series
of bid windows is the most effective design feature for reducing transaction costs. This is because
IPPs, lenders and professional advisors learn as the process evolves and this acquired expertise
translates into better cost management, lower advisory fees and a general comfort in the
programme, which reduces the need for ''buffers'' to be built into the bid tariff.
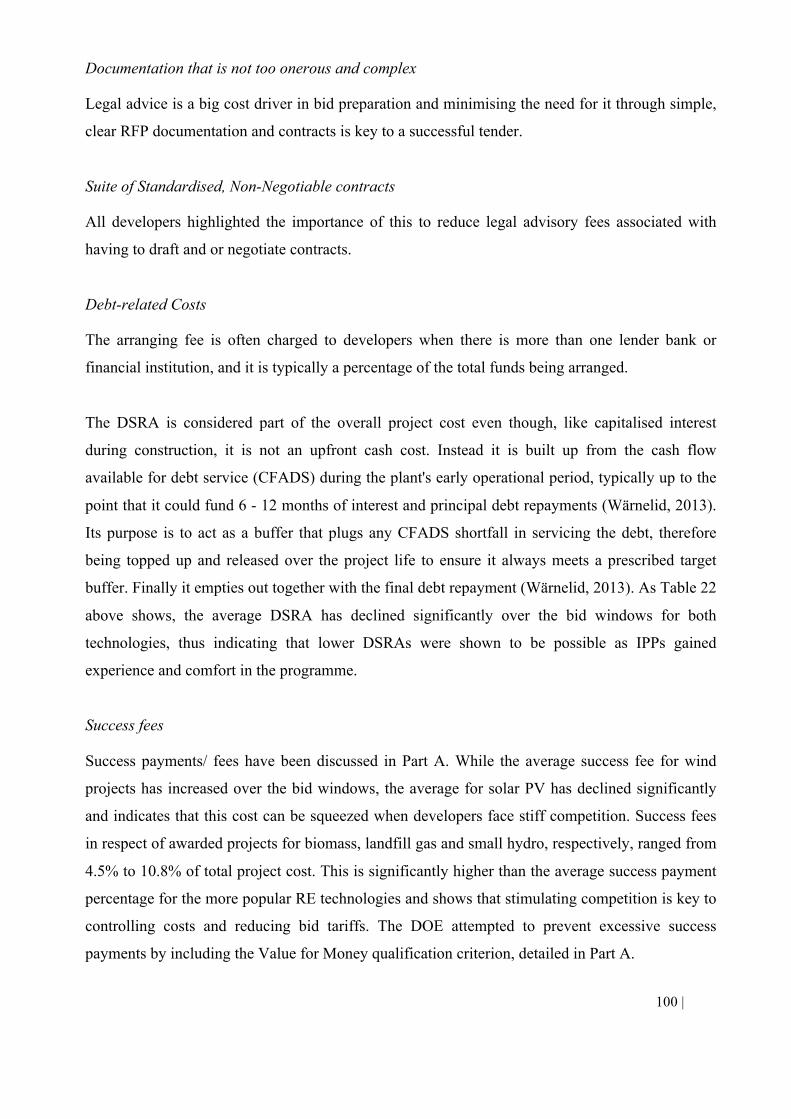
100 | Page
Documentation that is not too onerous and complex
Legal advice is a big cost driver in bid preparation and minimising the need for it through simple,
clear RFP documentation and contracts is key to a successful tender.
Suite of Standardised, Non-Negotiable contracts
All developers highlighted the importance of this to reduce legal advisory fees associated with
having to draft and or negotiate contracts.
Debt-related Costs
The arranging fee is often charged to developers when there is more than one lender bank or
financial institution, and it is typically a percentage of the total funds being arranged.
The DSRA is considered part of the overall project cost even though, like capitalised interest
during construction, it is not an upfront cash cost. Instead it is built up from the cash flow
available for debt service (CFADS) during the plant's early operational period, typically up to the
point that it could fund 6 - 12 months of interest and principal debt repayments (Wärnelid, 2013).
Its purpose is to act as a buffer that plugs any CFADS shortfall in servicing the debt, therefore
being topped up and released over the project life to ensure it always meets a prescribed target
buffer. Finally it empties out together with the final debt repayment (Wärnelid, 2013). As Table 22
above shows, the average DSRA has declined significantly over the bid windows for both
technologies, thus indicating that lower DSRAs were shown to be possible as IPPs gained
experience and comfort in the programme.
Success fees
Success payments/ fees have been discussed in Part A. While the average success fee for wind
projects has increased over the bid windows, the average for solar PV has declined significantly
and indicates that this cost can be squeezed when developers face stiff competition. Success fees
in respect of awarded projects for biomass, landfill gas and small hydro, respectively, ranged from
4.5% to 10.8% of total project cost. This is significantly higher than the average success payment
percentage for the more popular RE technologies and shows that stimulating competition is key to
controlling costs and reducing bid tariffs. The DOE attempted to prevent excessive success
payments by including the Value for Money qualification criterion, detailed in Part A.
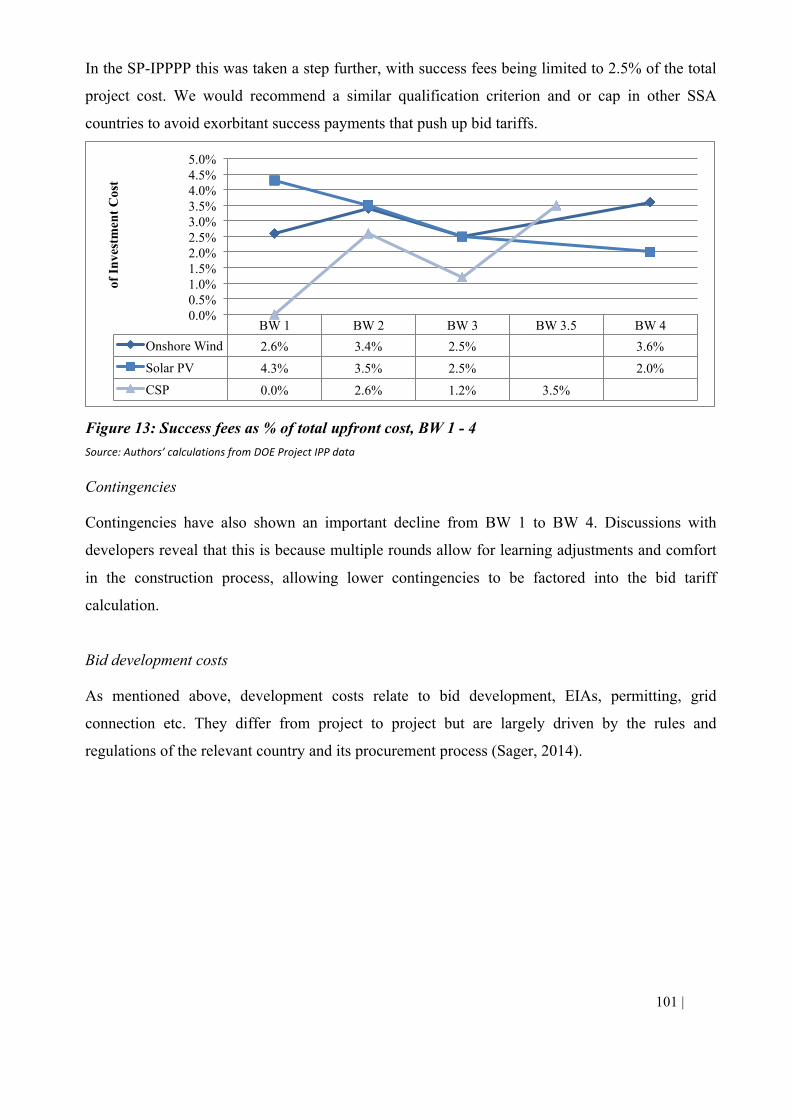
101 | Page
In the SP-IPPPP this was taken a step further, with success fees being limited to 2.5% of the total
project cost. We would recommend a similar qualification criterion and or cap in other SSA
countries to avoid exorbitant success payments that push up bid tariffs.
Figure 13: Success fees as % of total upfront cost, BW 1 - 4 Source:Authors’calculationsfromDOEProjectIPPdata
Contingencies
Contingencies have also shown an important decline from BW 1 to BW 4. Discussions with
developers reveal that this is because multiple rounds allow for learning adjustments and comfort
in the construction process, allowing lower contingencies to be factored into the bid tariff
calculation.
Bid development costs
As mentioned above, development costs relate to bid development, EIAs, permitting, grid
connection etc. They differ from project to project but are largely driven by the rules and
regulations of the relevant country and its procurement process (Sager, 2014).
BW 1 BW 2 BW 3 BW 3.5 BW 4 Onshore Wind 2.6% 3.4% 2.5% 3.6% Solar PV 4.3% 3.5% 2.5% 2.0% CSP 0.0% 2.6% 1.2% 3.5%
0.0% 0.5% 1.0% 1.5% 2.0% 2.5% 3.0% 3.5% 4.0% 4.5% 5.0%
of I
nves
tmen
t Cos
t
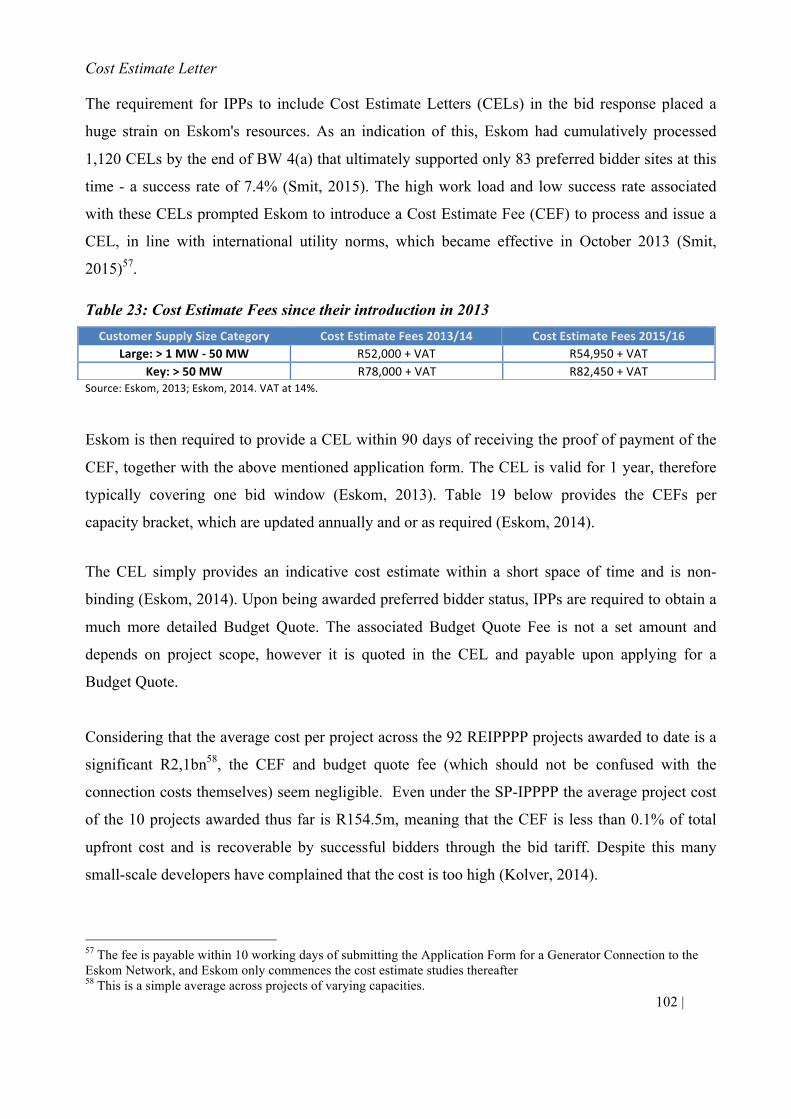
102 | Page
Cost Estimate Letter
The requirement for IPPs to include Cost Estimate Letters (CELs) in the bid response placed a
huge strain on Eskom's resources. As an indication of this, Eskom had cumulatively processed
1,120 CELs by the end of BW 4(a) that ultimately supported only 83 preferred bidder sites at this
time - a success rate of 7.4% (Smit, 2015). The high work load and low success rate associated
with these CELs prompted Eskom to introduce a Cost Estimate Fee (CEF) to process and issue a
CEL, in line with international utility norms, which became effective in October 2013 (Smit,
2015)57.
Table 23: Cost Estimate Fees since their introduction in 2013
Source:Eskom,2013;Eskom,2014.VATat14%.
Eskom is then required to provide a CEL within 90 days of receiving the proof of payment of the
CEF, together with the above mentioned application form. The CEL is valid for 1 year, therefore
typically covering one bid window (Eskom, 2013). Table 19 below provides the CEFs per
capacity bracket, which are updated annually and or as required (Eskom, 2014).
The CEL simply provides an indicative cost estimate within a short space of time and is non-
binding (Eskom, 2014). Upon being awarded preferred bidder status, IPPs are required to obtain a
much more detailed Budget Quote. The associated Budget Quote Fee is not a set amount and
depends on project scope, however it is quoted in the CEL and payable upon applying for a
Budget Quote.
Considering that the average cost per project across the 92 REIPPPP projects awarded to date is a
significant R2,1bn58, the CEF and budget quote fee (which should not be confused with the
connection costs themselves) seem negligible. Even under the SP-IPPPP the average project cost
of the 10 projects awarded thus far is R154.5m, meaning that the CEF is less than 0.1% of total
upfront cost and is recoverable by successful bidders through the bid tariff. Despite this many
small-scale developers have complained that the cost is too high (Kolver, 2014).
57 The fee is payable within 10 working days of submitting the Application Form for a Generator Connection to the Eskom Network, and Eskom only commences the cost estimate studies thereafter 58 This is a simple average across projects of varying capacities.
CustomerSupplySizeCategory CostEstimateFees2013/14 CostEstimateFees2015/16Large:>1MW-50MW R52,000+VAT R54,950+VAT
Key:>50MW R78,000+VAT R82,450+VAT
103 | Page
Incorporation of an SPV
Legal incorporation of an SPV takes time and is costly. In the SA REIPPPP the SPV could be
established post-bid submission, provided certain commitments were made by the project
company to be established within the bid response. Developers who had also participated in the
Uganda GET FiT Solar PV tender cited this as an advantage of the REIPPPP, as in Uganda the
SPV was required to be established prior to submission and this meant that all unsuccessful
bidders had to absorb an unnecessary cost.
Environmental Impact Assessment
The EIA is one of the largest single cost items of bid preparation, costing R2 - 6m. With that said,
a proper EIA is essential and an unavoidable cost. A positive is that bidders only had to comply
with the local laws, NEMA, whereas other countries such as Uganda require compliance with the
IFC Environmental and Social Performance Standards, which are even more onerous. Where
possible, local environmental law should be followed to allow local firms with the necessary
knowledge to conduct the EIAs. If the requirements are foreign and too onerous, local firms will
first have to master these, which will require additional resources and therefore cost.
Land Use Consents
As discussed in Part B the number of permits and consents required by bid submission was
reduced from BW 4. This was a positive move to reduce unnecessary cost burden for unsuccessful
bidders. Only essential permits should be required by bid submission i.e. those that could
compromise the success of the project.
Locked-in Finance by Bid Submission
This requirement was considered very stringent and adds a significant cost to the bidder, who must
pay for an expensive lender due diligence prior to submission59. Despite this cost burden we
would recommend it to other countries, as it reduces project failures after award.
59 The Letters of Support to be provided by funders were “softened” in terms of their commitment requirements from BW4. This included the provisions that lenders could add conditions to the letters, and that they did not need to go to final credit approval pre-bid.
104 | Page
Land Options
Acquiring land or signing a 20-year lease agreement before receiving certainty on the outcome is a
costly exercise. The REIPPPP allows land options to be used, which reduces the loss for
unsuccessful bidders but still sufficiently locks in the site for those that are successful. A recurrent
developer complaint regarding the Uganda GET FiT Solar PV tender was that KfW did not permit
land options. We would recommend that they be permitted in other SSA countries.
Delays
Delays in the RE procurement process result in more costs being incurred by bidders. For
example, according to the South African Photovoltaic Industry Association (SAPVIA) vice-
chairperson, Mike Levington, the delay in announcing the dates of the bid windows for the SP-
IPPPP, placed financial strain on companies and particularly on SMMEs, who have less capacity
to absorb transaction costs (Kolver, 2014). Another example is that bidders may pay developers a
monthly retainer until FC. Where FC is unexpectedly delayed relative to indicated timelines, this
cost, amongst others, will be higher than necessary.
The programme champion should ensure that, as much as possible, they comply with prescribed
deadlines. Grid connection is a key consideration here. For example, in BW 3 of the REIPPPP the
FC was delayed as a result of connection issues stemming from concerns around future grid
capacity. FC was initially scheduled for July 2014 but was subsequently staggered until 11
December 2014, which negatively impacted the costs of the affected preferred bidders.
Connection issues have become a key risk for the continuity of the South African programme.
How can such delays, and associated higher transaction costs, be avoided? As stated by Chown in
2014, “The procurement process should ensure that Eskom is mandated and incentivised to ensure
connections are available and made in time. Eskom must allow bidders to go the self-build or
own-build routes as a matter of course, not as a matter of exception to the current rule" (as cited in
Pombo-van Zyl, 2014).
105 | Page
Where the country's grid and or grid provider's financial wellbeing are constrained, self build and
own build options should be the norm rather than the exception, as was originally the case under
the REIPPPP.
Designing legal contracts that adequately address political risk
Bhengu (2014) noted that, despite attractive rates of return in Africa, investors remain
''preoccupied'' with the political risks such as expropriation, currency inconvertibility, tariff
changes and lastly regulatory or tax regime changes.
Within the PPA, political risks are dealt with under the Force Majeure clause. It is essential that
the PPA appropriately allocates these risks between the off-taker and IPP, because this will also
ultimately affect the price that is charged by the IPP. For example, this clause must clarify the
extent to which the off-taker remains liable to pay for contracted capacity as opposed to actual
power generated, or must compensate the IPP for lost revenue, in circumstances where the IPP is
affected by a Force Majeure event (Bhengu, 2012).
This is an important part of tender design, firstly because it can be a make or break consideration
for investors, and secondly because political risk insurance is often extremely expensive and so
increases the LCOE and bid tariff (Bhengu, 2012). For example, in the Uganda GET FiT Solar PV
competitive tender in 2014 all IPPs were offered a partial risk guarantee (PRG) by the World
Bank. In broad terms, PRGs may cover political force majeure risks such as expropriation,
currency inconvertibility or non-transferability, government contractual payment obligations (for
example, in the event of termination payments), regulatory risk and or other uninsurable force
majeure risks (World Bank, n.d.).
No bidders made use of this facility, citing the fact that it was far too costly and onerous to take on
relative to the size of the projects (5 MWp each). The government signed an IA with each awarded
IPP to mitigate off-taker risk, and beyond this the country's relatively stable political and
investment climate was deemed acceptable in terms of investor risk appetite. However this will
not be the case with many other African countries, and therefore affordable products to mitigate or
insure against political risk will be an important consideration.
106 | Page
When the off-taker or government is in a strong bargaining position, political risks are usually
mostly assumed by the IPPs under the Force Majeure clause. However where the IPPs have more
bargaining power, these risks must be addressed through government guarantees or indemnities
against any losses that the IPP may suffer as a result of politically motivated interventions.
In addition, governmental involvement in the programme may also lead to the conclusion of a
direct contract between government and the IPP, usually referred to as Implementation
Agreements (IAs) in Africa. These IAs appear to be exclusive to Africa.
107 | Page
Conclusion
Arguments against competitive tenders - that they are too complicated, carry a high associated
cost and take too long versus other mechanisms - can mostly be countered by experience. As
demonstrated in the South African REIPPPP, competitive tenders are able to deliver a pipeline of
projects within a short time, and any resources devoted to designing and running these tenders are
easily justified due to the lower electricity tariffs obtained. They also result in more transparency
and minimize corruption.
Increasingly, global experience is demonstrating that competitive tenders or auctions are highly
successful in procuring renewable energy. From 2011 to 2015, the number of countries with RE
competitive tender policies in place increased substantially from 36 to at least 60. This is in
contrast to a slowed growth in the adoption of FIT policies, which increased from 70 to only 79
over the same period (REN21, 2015).
Since the implementation of REIPPPP in 2012, South Africa has achieved more investment in
IPPs than in the rest of Sub-Saharan Africa over the past two decades. It offers valuable lessons
for other developing countries in terms of designing and running competitive tenders for grid-
connected RE IPPs. In identifying the lessons that it offers other countries, we have been mindful
of the different contexts in various African countries and the need to reduce the high transaction
costs currently incurred by bidders.
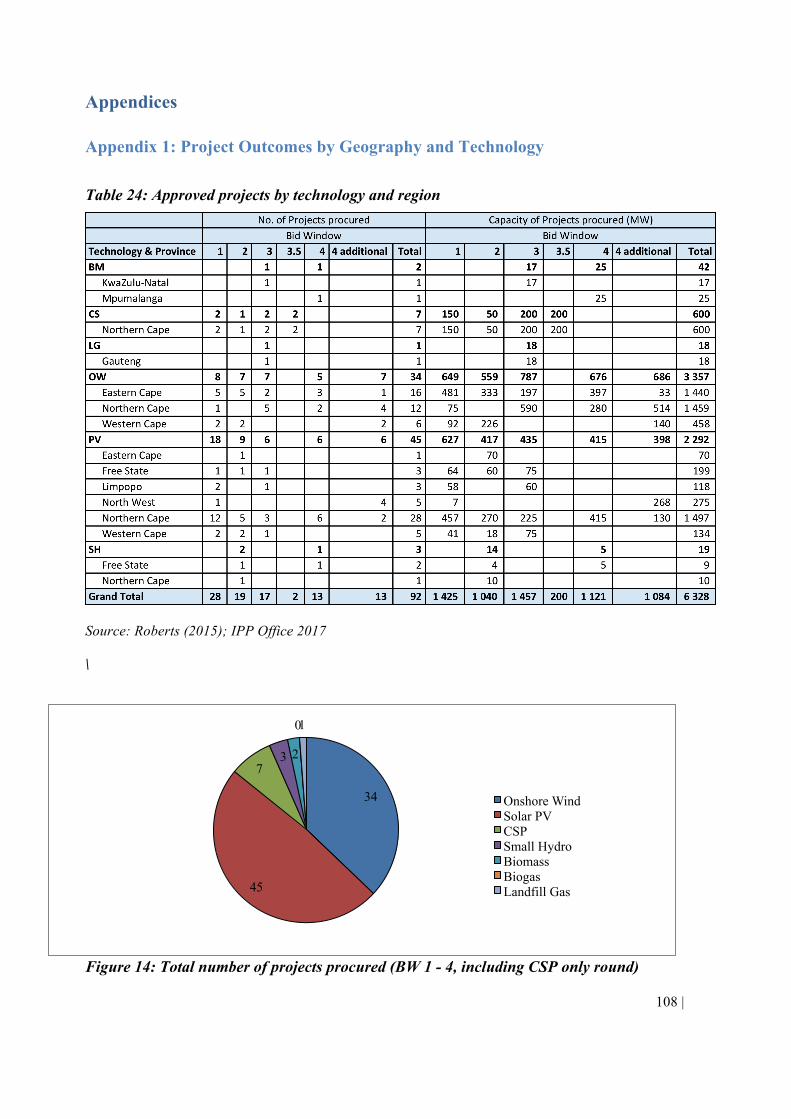
108 | Page
Appendices
Appendix 1: Project Outcomes by Geography and Technology
Table 24: Approved projects by technology and region
Source: Roberts (2015); IPP Office 2017
\
Figure 14: Total number of projects procured (BW 1 - 4, including CSP only round)
34
45
7 3 2
0 1
Onshore Wind Solar PV CSP Small Hydro Biomass Biogas Landfill Gas
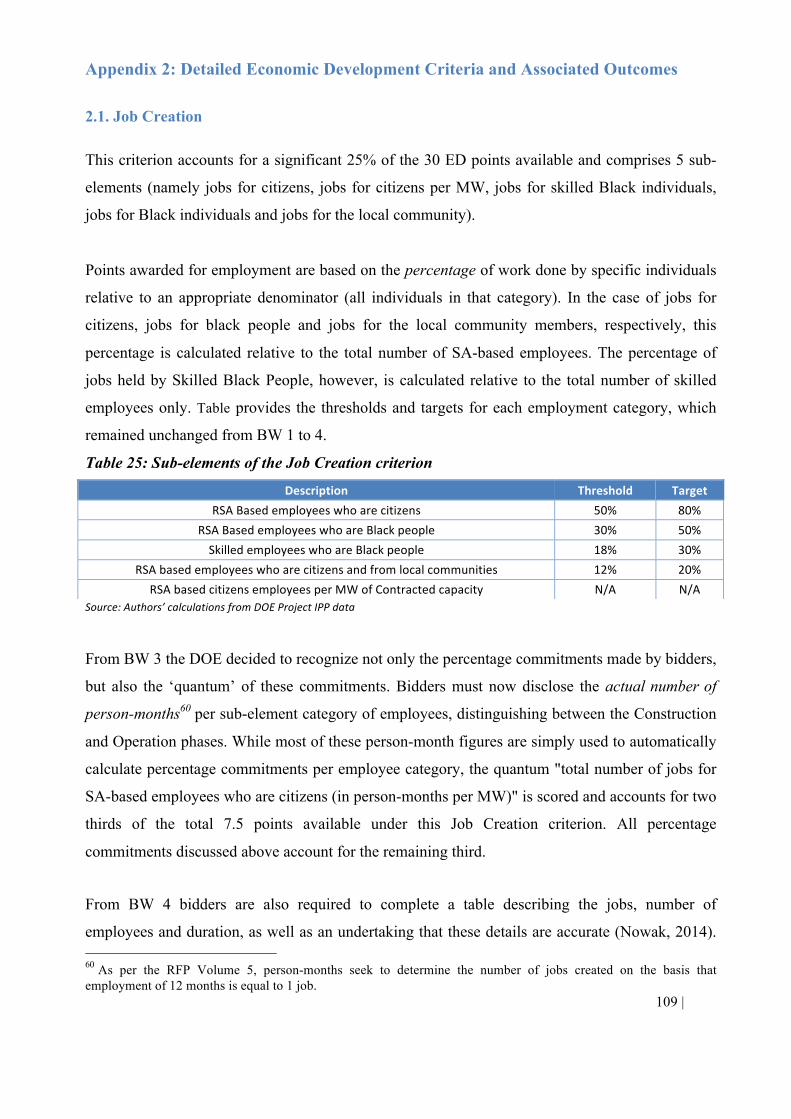
109 | Page
Appendix 2: Detailed Economic Development Criteria and Associated Outcomes
2.1. Job Creation
This criterion accounts for a significant 25% of the 30 ED points available and comprises 5 sub-
elements (namely jobs for citizens, jobs for citizens per MW, jobs for skilled Black individuals,
jobs for Black individuals and jobs for the local community).
Points awarded for employment are based on the percentage of work done by specific individuals
relative to an appropriate denominator (all individuals in that category). In the case of jobs for
citizens, jobs for black people and jobs for the local community members, respectively, this
percentage is calculated relative to the total number of SA-based employees. The percentage of
jobs held by Skilled Black People, however, is calculated relative to the total number of skilled
employees only. Table provides the thresholds and targets for each employment category, which
remained unchanged from BW 1 to 4.
Table 25: Sub-elements of the Job Creation criterion
Source:Authors’calculationsfromDOEProjectIPPdata
From BW 3 the DOE decided to recognize not only the percentage commitments made by bidders,
but also the ‘quantum’ of these commitments. Bidders must now disclose the actual number of
person-months60 per sub-element category of employees, distinguishing between the Construction
and Operation phases. While most of these person-month figures are simply used to automatically
calculate percentage commitments per employee category, the quantum "total number of jobs for
SA-based employees who are citizens (in person-months per MW)" is scored and accounts for two
thirds of the total 7.5 points available under this Job Creation criterion. All percentage
commitments discussed above account for the remaining third.
From BW 4 bidders are also required to complete a table describing the jobs, number of
employees and duration, as well as an undertaking that these details are accurate (Nowak, 2014). 60 As per the RFP Volume 5, person-months seek to determine the number of jobs created on the basis that employment of 12 months is equal to 1 job.
Description Threshold TargetRSABasedemployeeswhoarecitizens 50% 80%
RSABasedemployeeswhoareBlackpeople 30% 50%SkilledemployeeswhoareBlackpeople 18% 30%
RSAbasedemployeeswhoarecitizensandfromlocalcommunities 12% 20%RSAbasedcitizensemployeesperMWofContractedcapacity N/A N/A
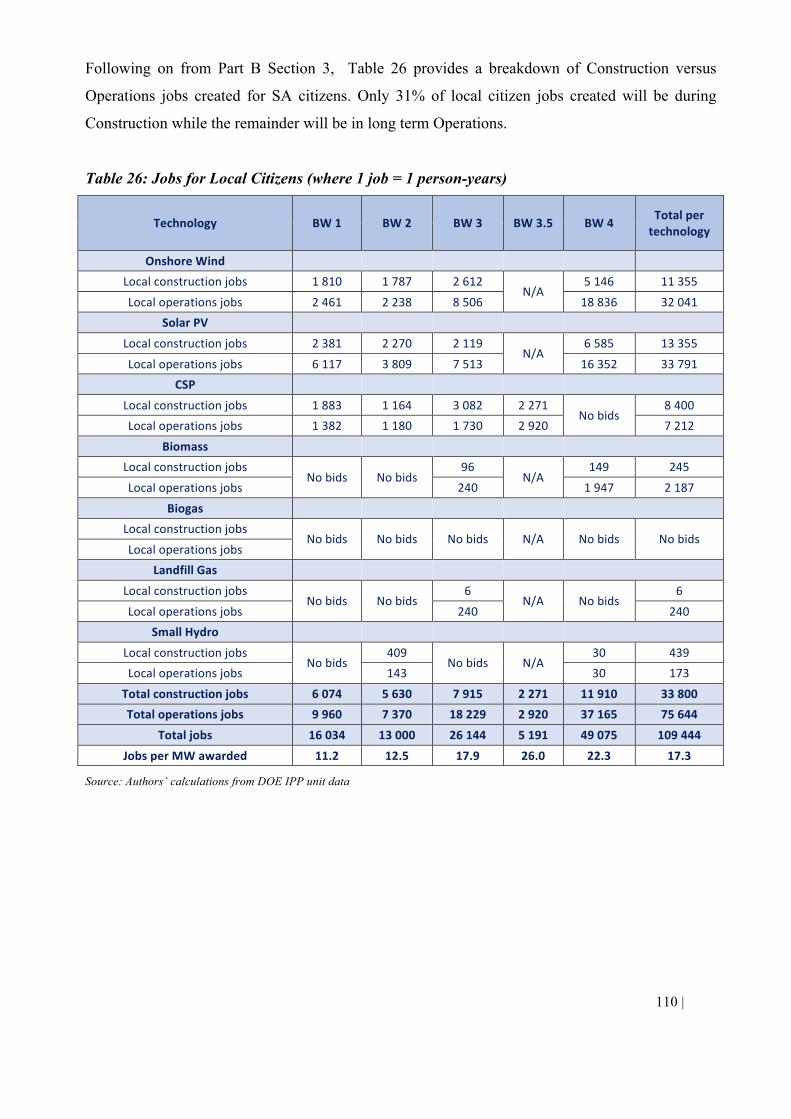
110 | Page
Following on from Part B Section 3, Table 26 provides a breakdown of Construction versus
Operations jobs created for SA citizens. Only 31% of local citizen jobs created will be during
Construction while the remainder will be in long term Operations.
Table 26: Jobs for Local Citizens (where 1 job = 1 person-years)
Source: Authors’ calculations from DOE IPP unit data
Technology BW1 BW2 BW3 BW3.5 BW4 Totalpertechnology
OnshoreWind Localconstructionjobs 1810 1787 2612
N/A5146 11355
Localoperationsjobs 2461 2238 8506 18836 32041SolarPV
Localconstructionjobs 2381 2270 2119N/A
6585 13355
Localoperationsjobs 6117 3809 7513 16352 33791CSP
Localconstructionjobs 1883 1164 3082 2271Nobids
8400Localoperationsjobs 1382 1180 1730 2920 7212
Biomass Localconstructionjobs
Nobids Nobids96
N/A149 245
Localoperationsjobs 240 1947 2187
Biogas Localconstructionjobs
Nobids Nobids Nobids N/A Nobids NobidsLocaloperationsjobs
LandfillGas
LocalconstructionjobsNobids Nobids
6N/A Nobids
6
Localoperationsjobs 240 240SmallHydro
LocalconstructionjobsNobids
409Nobids N/A
30 439Localoperationsjobs 143 30 173
Totalconstructionjobs 6074 5630 7915 2271 11910 33800Totaloperationsjobs 9960 7370 18229 2920 37165 75644
Totaljobs 16034 13000 26144 5191 49075 109444
JobsperMWawarded 11.2 12.5 17.9 26.0 22.3 17.3
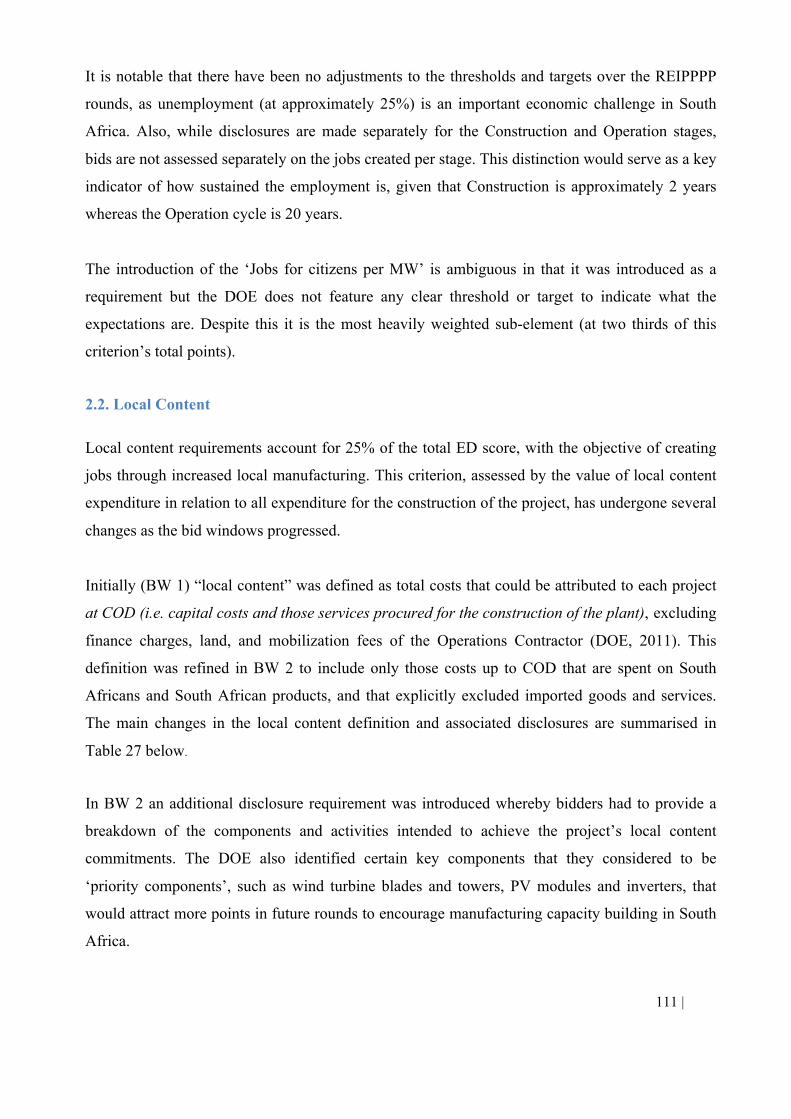
111 | Page
It is notable that there have been no adjustments to the thresholds and targets over the REIPPPP
rounds, as unemployment (at approximately 25%) is an important economic challenge in South
Africa. Also, while disclosures are made separately for the Construction and Operation stages,
bids are not assessed separately on the jobs created per stage. This distinction would serve as a key
indicator of how sustained the employment is, given that Construction is approximately 2 years
whereas the Operation cycle is 20 years.
The introduction of the ‘Jobs for citizens per MW’ is ambiguous in that it was introduced as a
requirement but the DOE does not feature any clear threshold or target to indicate what the
expectations are. Despite this it is the most heavily weighted sub-element (at two thirds of this
criterion’s total points).
2.2. Local Content
Local content requirements account for 25% of the total ED score, with the objective of creating
jobs through increased local manufacturing. This criterion, assessed by the value of local content
expenditure in relation to all expenditure for the construction of the project, has undergone several
changes as the bid windows progressed.
Initially (BW 1) “local content” was defined as total costs that could be attributed to each project
at COD (i.e. capital costs and those services procured for the construction of the plant), excluding
finance charges, land, and mobilization fees of the Operations Contractor (DOE, 2011). This
definition was refined in BW 2 to include only those costs up to COD that are spent on South
Africans and South African products, and that explicitly excluded imported goods and services.
The main changes in the local content definition and associated disclosures are summarised in
Table 27 below.
In BW 2 an additional disclosure requirement was introduced whereby bidders had to provide a
breakdown of the components and activities intended to achieve the project’s local content
commitments. The DOE also identified certain key components that they considered to be
‘priority components’, such as wind turbine blades and towers, PV modules and inverters, that
would attract more points in future rounds to encourage manufacturing capacity building in South
Africa.
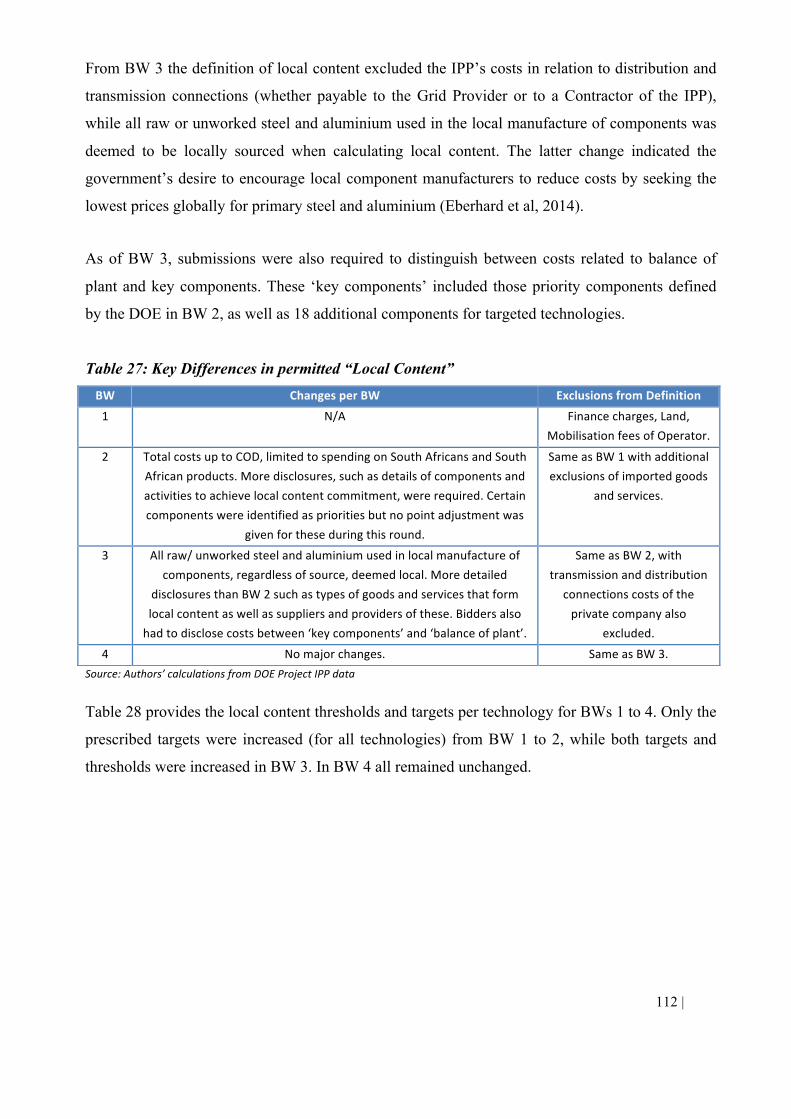
112 | Page
From BW 3 the definition of local content excluded the IPP’s costs in relation to distribution and
transmission connections (whether payable to the Grid Provider or to a Contractor of the IPP),
while all raw or unworked steel and aluminium used in the local manufacture of components was
deemed to be locally sourced when calculating local content. The latter change indicated the
government’s desire to encourage local component manufacturers to reduce costs by seeking the
lowest prices globally for primary steel and aluminium (Eberhard et al, 2014).
As of BW 3, submissions were also required to distinguish between costs related to balance of
plant and key components. These ‘key components’ included those priority components defined
by the DOE in BW 2, as well as 18 additional components for targeted technologies.
Table 27: Key Differences in permitted “Local Content”
Source:Authors’calculationsfromDOEProjectIPPdata Table 28 provides the local content thresholds and targets per technology for BWs 1 to 4. Only the
prescribed targets were increased (for all technologies) from BW 1 to 2, while both targets and
thresholds were increased in BW 3. In BW 4 all remained unchanged.
BW ChangesperBW ExclusionsfromDefinition
1 N/A Financecharges,Land,MobilisationfeesofOperator.
2 TotalcostsuptoCOD,limitedtospendingonSouthAfricansandSouthAfricanproducts.Moredisclosures,suchasdetailsofcomponentsandactivitiestoachievelocalcontentcommitment,wererequired.Certaincomponentswereidentifiedasprioritiesbutnopointadjustmentwas
givenfortheseduringthisround.
SameasBW1withadditionalexclusionsofimportedgoods
andservices.
3 Allraw/unworkedsteelandaluminiumusedinlocalmanufactureofcomponents,regardlessofsource,deemedlocal.Moredetailed
disclosuresthanBW2suchastypesofgoodsandservicesthatformlocalcontentaswellassuppliersandprovidersofthese.Biddersalsohadtodisclosecostsbetween‘keycomponents’and‘balanceofplant’.
SameasBW2,withtransmissionanddistribution
connectionscostsoftheprivatecompanyalso
excluded.
4 Nomajorchanges. SameasBW3.
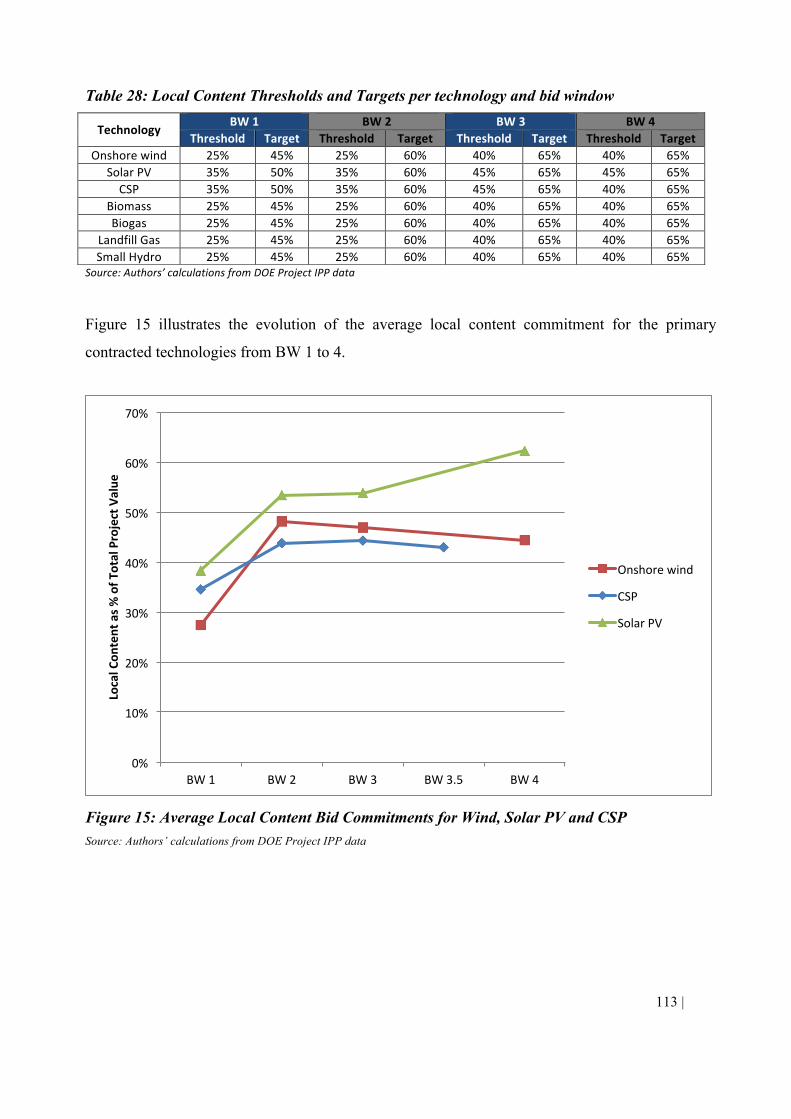
113 | Page
Table 28: Local Content Thresholds and Targets per technology and bid window
Source:Authors’calculationsfromDOEProjectIPPdata
Figure 15 illustrates the evolution of the average local content commitment for the primary
contracted technologies from BW 1 to 4.
Figure 15: Average Local Content Bid Commitments for Wind, Solar PV and CSP Source: Authors’ calculations from DOE Project IPP data
0%
10%
20%
30%
40%
50%
60%
70%
BW1 BW2 BW3 BW3.5 BW4
LocalCon
tentas%
ofT
otalProjectValue
Onshorewind
CSP
SolarPV
TechnologyBW1 BW2 BW3 BW4
Threshold Target Threshold Target Threshold Target Threshold TargetOnshorewind 25% 45% 25% 60% 40% 65% 40% 65%
SolarPV 35% 50% 35% 60% 45% 65% 45% 65%CSP 35% 50% 35% 60% 45% 65% 40% 65%
Biomass 25% 45% 25% 60% 40% 65% 40% 65%Biogas 25% 45% 25% 60% 40% 65% 40% 65%
LandfillGas 25% 45% 25% 60% 40% 65% 40% 65%SmallHydro 25% 45% 25% 60% 40% 65% 40% 65%
114 | Page
The following aggregate outcomes have been achieved for local content:
BW 1: Local content commitment was generally much closer to minimum prescribed levels than
ambitious targets. Onshore wind preferred bidders achieved an average of 27.4% local content,
therefore only 2.4% above the threshold and well short of the 45% target. Similarly solar PV
projects achieved 38.4%, only 3.4% above the minimum and far below the even higher target of
50%.
BW 2: Target levels were adjusted upward by 10% or 15% depending on the technology, while
thresholds remained unchanged from BW 1. For all technologies bid (wind, solar PV, CSP and
small hydro), the average local content commitment increased significantly. Onshore wind
(48.1%) and solar PV (53.4%) averages were closer to the target levels (60% for each) than their
thresholds (25% and 35%, respectively). For small hydro, there was only one bid and the
commitment of 76.3% was even in excess of the 60% target level.
BW 3: There were 10% - 15% increases in the thresholds and a 5% increase in the target levels
for all technologies. Associated changes in the average outcomes for wind, solar PV and CSP
versus BW 2 were negligible. Landfill gas and biomass technologies were each awarded a project
for BW 3, both for the first time in the REIPPPP, with a local content commitment of 41.9% and
40% respectively.
BW 4: The thresholds and targets were not adjusted from BW 3. Awarded bids included wind,
solar PV, biomass (one project) and small hydro (one project). There was a notable difference
between local content achievement in wind and solar PV bids, with the former average
commitment only 4.6% above the threshold at 44.6% versus solar PV’s average commitment of
64.7% nearly meeting the ambitious 65% target61. The Solar PV average showed the most
significant increases over the course of the REIPPPP.
2.3. Ownership
The REIPPPP aims to direct development to previously marginalised and disadvantaged groups,
and communities. Ownership is intended to provide a flow of economic benefits as well as provide
61 These figures are only for the 13 preferred bidders. Including the additional 13 preferred bidders, OW is at 44,4% and PV is at 62,3%.
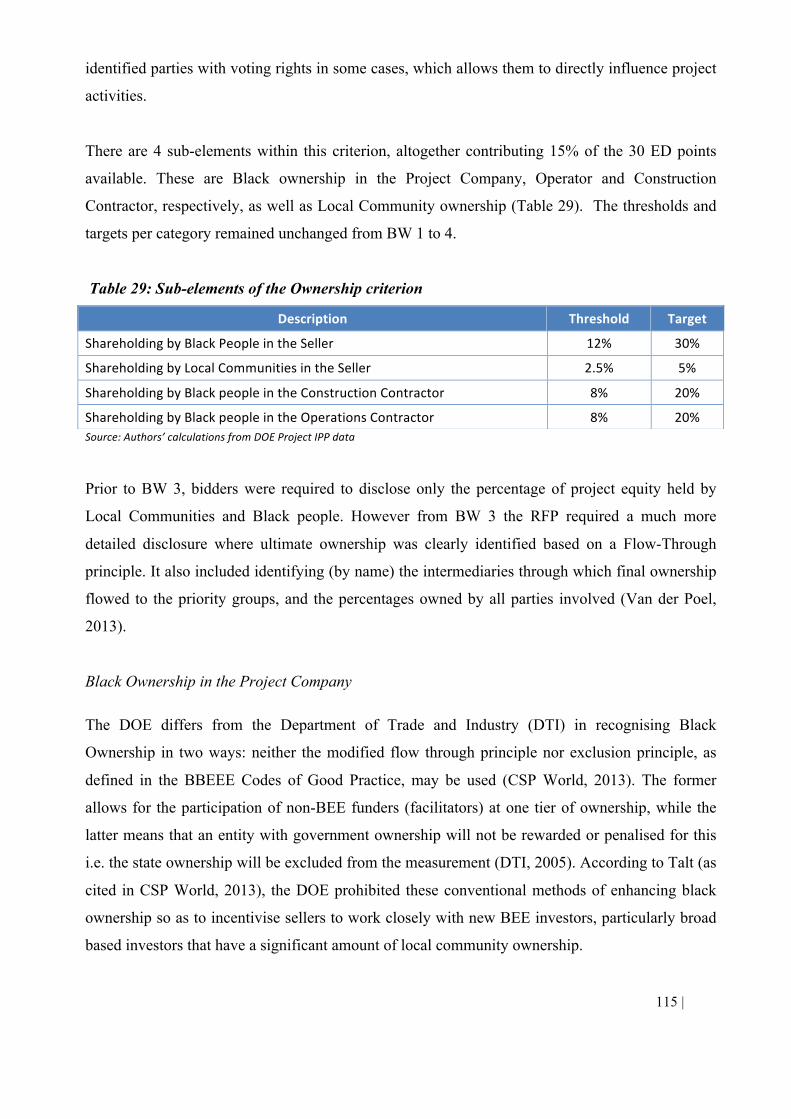
115 | Page
identified parties with voting rights in some cases, which allows them to directly influence project
activities.
There are 4 sub-elements within this criterion, altogether contributing 15% of the 30 ED points
available. These are Black ownership in the Project Company, Operator and Construction
Contractor, respectively, as well as Local Community ownership (Table 29). The thresholds and
targets per category remained unchanged from BW 1 to 4.
Table 29: Sub-elements of the Ownership criterion
Source:Authors’calculationsfromDOEProjectIPPdata
Prior to BW 3, bidders were required to disclose only the percentage of project equity held by
Local Communities and Black people. However from BW 3 the RFP required a much more
detailed disclosure where ultimate ownership was clearly identified based on a Flow-Through
principle. It also included identifying (by name) the intermediaries through which final ownership
flowed to the priority groups, and the percentages owned by all parties involved (Van der Poel,
2013).
Black Ownership in the Project Company
The DOE differs from the Department of Trade and Industry (DTI) in recognising Black
Ownership in two ways: neither the modified flow through principle nor exclusion principle, as
defined in the BBEEE Codes of Good Practice, may be used (CSP World, 2013). The former
allows for the participation of non-BEE funders (facilitators) at one tier of ownership, while the
latter means that an entity with government ownership will not be rewarded or penalised for this
i.e. the state ownership will be excluded from the measurement (DTI, 2005). According to Talt (as
cited in CSP World, 2013), the DOE prohibited these conventional methods of enhancing black
ownership so as to incentivise sellers to work closely with new BEE investors, particularly broad
based investors that have a significant amount of local community ownership.
Description Threshold Target
ShareholdingbyBlackPeopleintheSeller 12% 30%
ShareholdingbyLocalCommunitiesintheSeller 2.5% 5%
ShareholdingbyBlackpeopleintheConstructionContractor 8% 20%
ShareholdingbyBlackpeopleintheOperationsContractor 8% 20%
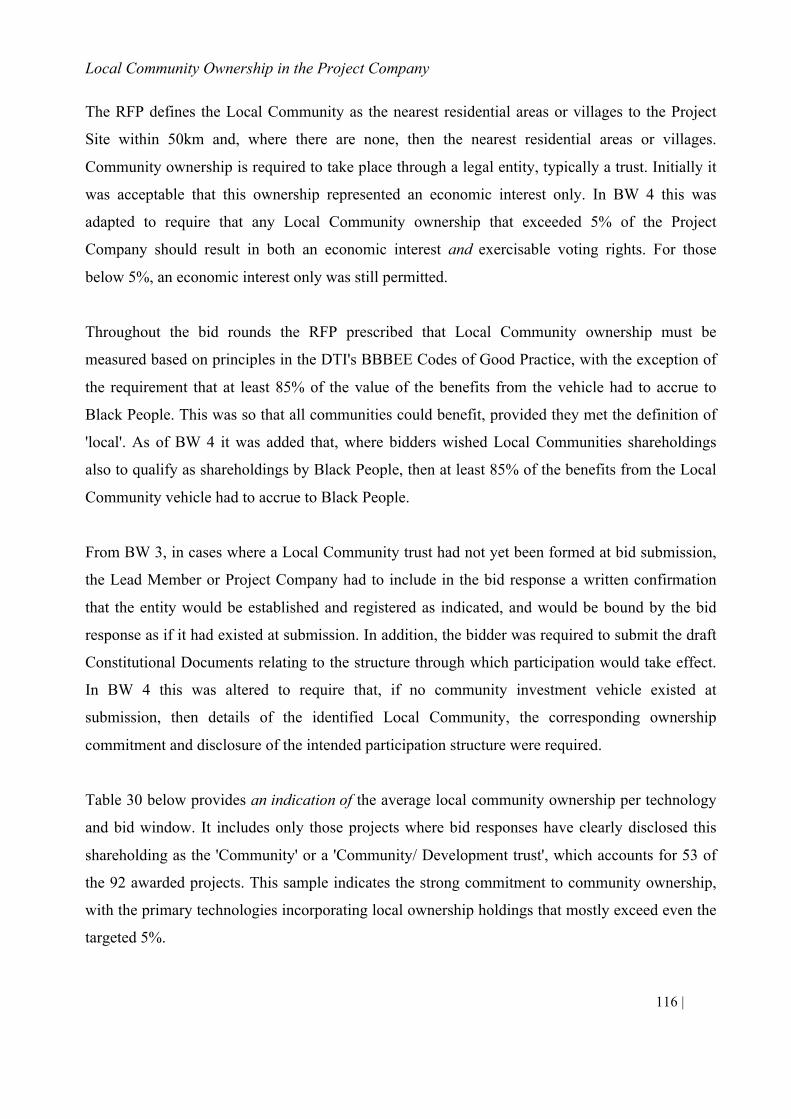
116 | Page
Local Community Ownership in the Project Company
The RFP defines the Local Community as the nearest residential areas or villages to the Project
Site within 50km and, where there are none, then the nearest residential areas or villages.
Community ownership is required to take place through a legal entity, typically a trust. Initially it
was acceptable that this ownership represented an economic interest only. In BW 4 this was
adapted to require that any Local Community ownership that exceeded 5% of the Project
Company should result in both an economic interest and exercisable voting rights. For those
below 5%, an economic interest only was still permitted.
Throughout the bid rounds the RFP prescribed that Local Community ownership must be
measured based on principles in the DTI's BBBEE Codes of Good Practice, with the exception of
the requirement that at least 85% of the value of the benefits from the vehicle had to accrue to
Black People. This was so that all communities could benefit, provided they met the definition of
'local'. As of BW 4 it was added that, where bidders wished Local Communities shareholdings
also to qualify as shareholdings by Black People, then at least 85% of the benefits from the Local
Community vehicle had to accrue to Black People.
From BW 3, in cases where a Local Community trust had not yet been formed at bid submission,
the Lead Member or Project Company had to include in the bid response a written confirmation
that the entity would be established and registered as indicated, and would be bound by the bid
response as if it had existed at submission. In addition, the bidder was required to submit the draft
Constitutional Documents relating to the structure through which participation would take effect.
In BW 4 this was altered to require that, if no community investment vehicle existed at
submission, then details of the identified Local Community, the corresponding ownership
commitment and disclosure of the intended participation structure were required.
Table 30 below provides an indication of the average local community ownership per technology
and bid window. It includes only those projects where bid responses have clearly disclosed this
shareholding as the 'Community' or a 'Community/ Development trust', which accounts for 53 of
the 92 awarded projects. This sample indicates the strong commitment to community ownership,
with the primary technologies incorporating local ownership holdings that mostly exceed even the
targeted 5%.
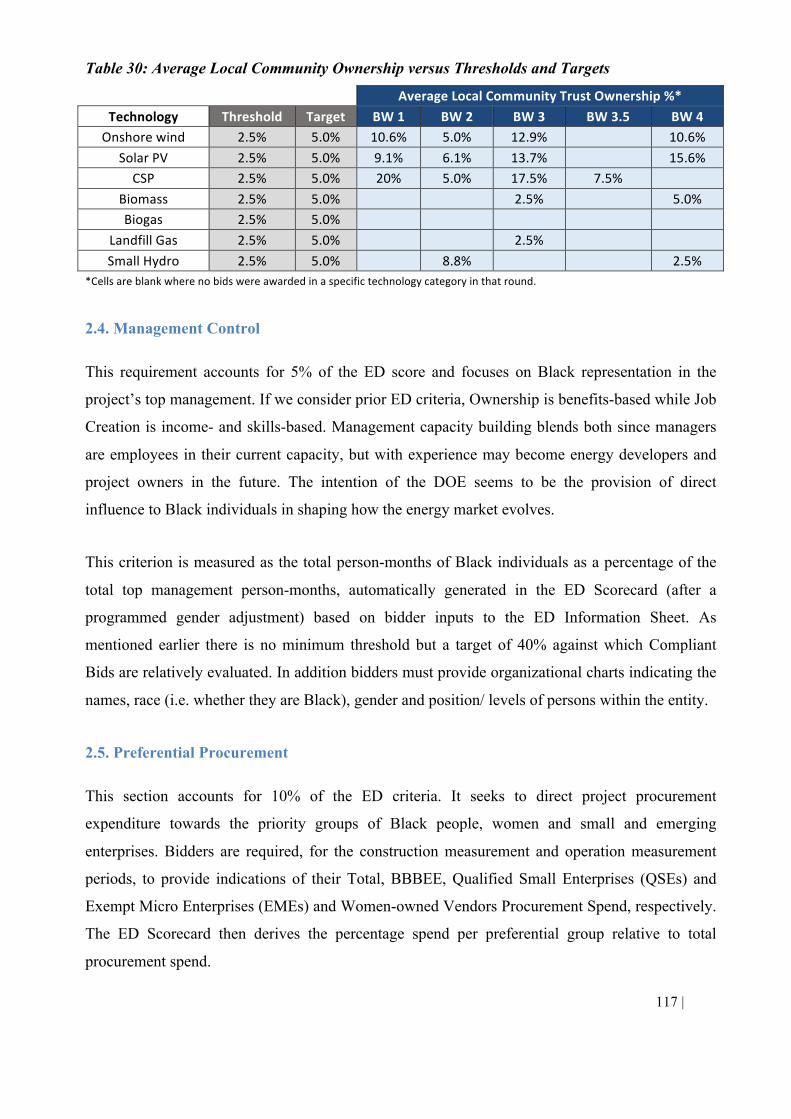
117 | Page
Table 30: Average Local Community Ownership versus Thresholds and Targets
2.4. Management Control
This requirement accounts for 5% of the ED score and focuses on Black representation in the
project’s top management. If we consider prior ED criteria, Ownership is benefits-based while Job
Creation is income- and skills-based. Management capacity building blends both since managers
are employees in their current capacity, but with experience may become energy developers and
project owners in the future. The intention of the DOE seems to be the provision of direct
influence to Black individuals in shaping how the energy market evolves.
This criterion is measured as the total person-months of Black individuals as a percentage of the
total top management person-months, automatically generated in the ED Scorecard (after a
programmed gender adjustment) based on bidder inputs to the ED Information Sheet. As
mentioned earlier there is no minimum threshold but a target of 40% against which Compliant
Bids are relatively evaluated. In addition bidders must provide organizational charts indicating the
names, race (i.e. whether they are Black), gender and position/ levels of persons within the entity.
2.5. Preferential Procurement
This section accounts for 10% of the ED criteria. It seeks to direct project procurement
expenditure towards the priority groups of Black people, women and small and emerging
enterprises. Bidders are required, for the construction measurement and operation measurement
periods, to provide indications of their Total, BBBEE, Qualified Small Enterprises (QSEs) and
Exempt Micro Enterprises (EMEs) and Women-owned Vendors Procurement Spend, respectively.
The ED Scorecard then derives the percentage spend per preferential group relative to total
procurement spend.
AverageLocalCommunityTrustOwnership%*Technology Threshold Target BW1 BW2 BW3 BW3.5 BW4Onshorewind 2.5% 5.0% 10.6% 5.0% 12.9% 10.6%
SolarPV 2.5% 5.0% 9.1% 6.1% 13.7% 15.6%CSP 2.5% 5.0% 20% 5.0% 17.5% 7.5%
Biomass 2.5% 5.0% 2.5% 5.0%Biogas 2.5% 5.0%
LandfillGas 2.5% 5.0% 2.5% SmallHydro 2.5% 5.0% 8.8% 2.5%
*Cellsareblankwherenobidswereawardedinaspecifictechnologycategoryinthatround.
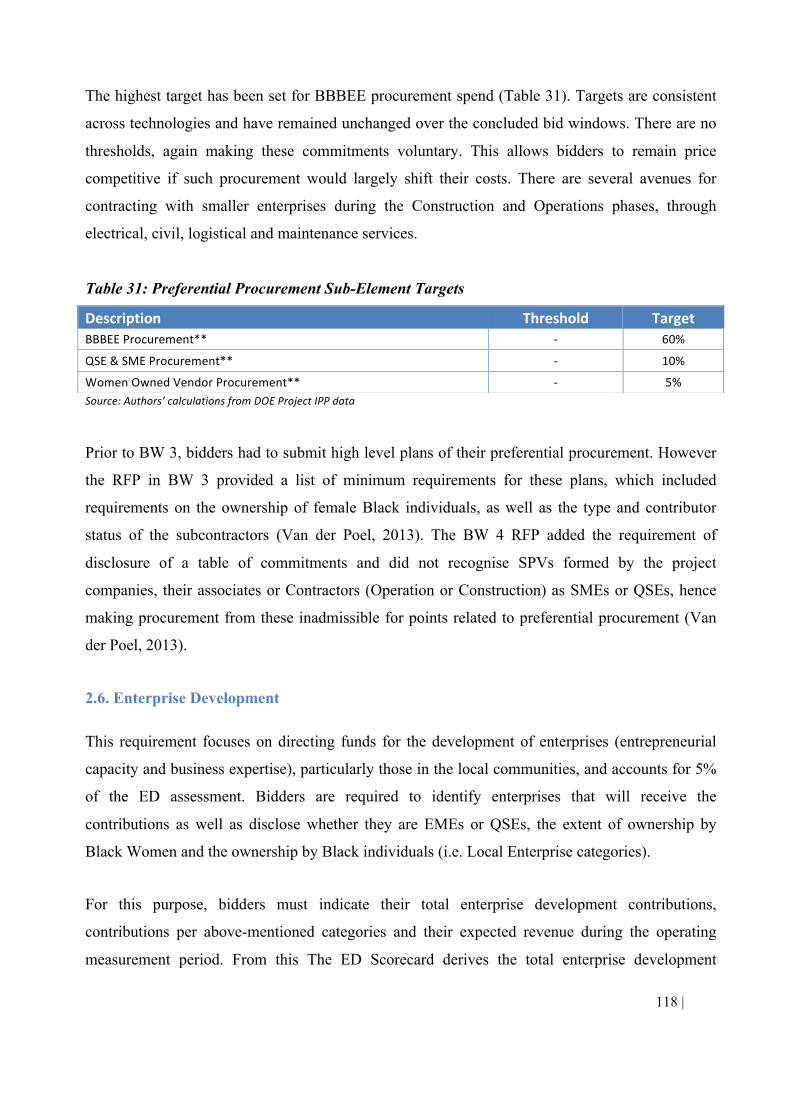
118 | Page
The highest target has been set for BBBEE procurement spend (Table 31). Targets are consistent
across technologies and have remained unchanged over the concluded bid windows. There are no
thresholds, again making these commitments voluntary. This allows bidders to remain price
competitive if such procurement would largely shift their costs. There are several avenues for
contracting with smaller enterprises during the Construction and Operations phases, through
electrical, civil, logistical and maintenance services.
Table 31: Preferential Procurement Sub-Element Targets
Source:Authors’calculationsfromDOEProjectIPPdata
Prior to BW 3, bidders had to submit high level plans of their preferential procurement. However
the RFP in BW 3 provided a list of minimum requirements for these plans, which included
requirements on the ownership of female Black individuals, as well as the type and contributor
status of the subcontractors (Van der Poel, 2013). The BW 4 RFP added the requirement of
disclosure of a table of commitments and did not recognise SPVs formed by the project
companies, their associates or Contractors (Operation or Construction) as SMEs or QSEs, hence
making procurement from these inadmissible for points related to preferential procurement (Van
der Poel, 2013).
2.6. Enterprise Development
This requirement focuses on directing funds for the development of enterprises (entrepreneurial
capacity and business expertise), particularly those in the local communities, and accounts for 5%
of the ED assessment. Bidders are required to identify enterprises that will receive the
contributions as well as disclose whether they are EMEs or QSEs, the extent of ownership by
Black Women and the ownership by Black individuals (i.e. Local Enterprise categories).
For this purpose, bidders must indicate their total enterprise development contributions,
contributions per above-mentioned categories and their expected revenue during the operating
measurement period. From this The ED Scorecard derives the total enterprise development
Description Threshold TargetBBBEEProcurement** - 60%
QSE&SMEProcurement** - 10%
WomenOwnedVendorProcurement** - 5%
119 | Page
contributions during the operating period as a percentage of revenue, as well as an adjusted
percentage accounting for Local Enterprises. There are no minimum requirements for the
percentage commitment or adjusted commitment, respectively, making this another voluntary
developmental area. The conservative target of 0.6% for each sub-element has remained
unchanged throughout the rounds and is the same across all technologies.
In practice, however, other factors are important for the success of small enterprises besides
funding, and lack of experience may hinder development. Training and advisory contribution from
projects may contribute to building local business capacity. Table 32 provides a summary of the
commitment to enterprise development spend for each technology over the course of the
REIPPPP.
Table 32: Enterprise Development Commitments per technology (ZAR m)
Source: Authors’ calculations from DOE IPP Project data
2.7. Socio-Economic Development
This section accounts for 15% of the ED assessment and aims to direct funding towards projects
that have a positive socio-economic impact. There is particular emphasis on achieving this in the
communities where they are located, defined as the “Recognition for Localness” when evaluating
this criterion. Bidders are required to identify the needs of the surrounding communities and
strategize how these needs could be met using their Socio-Economic Contributions. These needs
and strategy must be submitted on a high-level basis. Table 33 shows the evolution of the
commitment for each technology over the four rounds.
Bidders are required to develop plans very early, which may be premature and limits sufficient
time for due diligence. A possible improvement in future is that these plans should only be
required at financial close. In practice, many of the plans are very basic while some show more
EnterpriseDevelopmentContributions(ZARm) BW1 BW2 BW3 BW3.5 BW4 Total
OnshoreWind 216 319 715 - 2593 3841SolarPV 516 373 295 - 694 1878SolarCSP 27 118 2 25 - 171Biomass - - - - 78 78Biogas - - - - - -
LandfillGas - - - - - -SmallHydro - 15 - - - 15
Total 758 825 1012 25 3365 5984
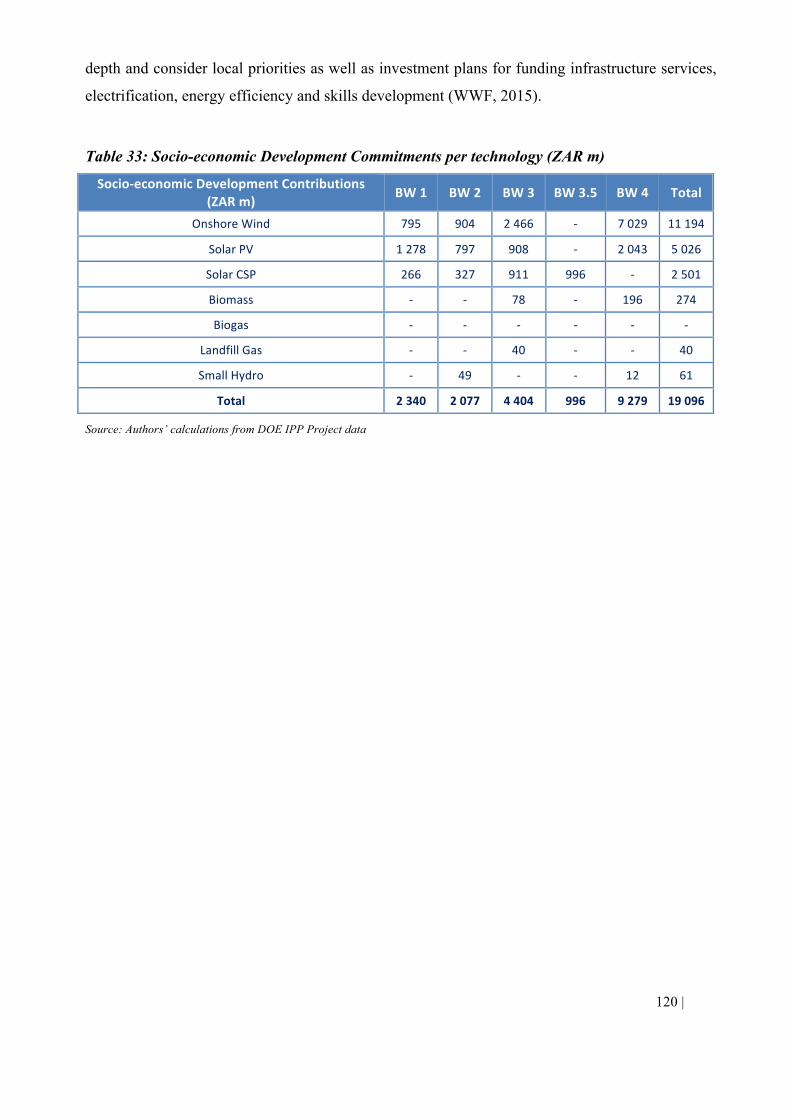
120 | Page
depth and consider local priorities as well as investment plans for funding infrastructure services,
electrification, energy efficiency and skills development (WWF, 2015).
Table 33: Socio-economic Development Commitments per technology (ZAR m)
Source: Authors’ calculations from DOE IPP Project data
Socio-economicDevelopmentContributions(ZARm) BW1 BW2 BW3 BW3.5 BW4 Total
OnshoreWind 795 904 2466 - 7029 11194
SolarPV 1278 797 908 - 2043 5026
SolarCSP 266 327 911 996 - 2501
Biomass - - 78 - 196 274
Biogas - - - - - -
LandfillGas - - 40 - - 40
SmallHydro - 49 - - 12 61
Total 2340 2077 4404 996 9279 19096
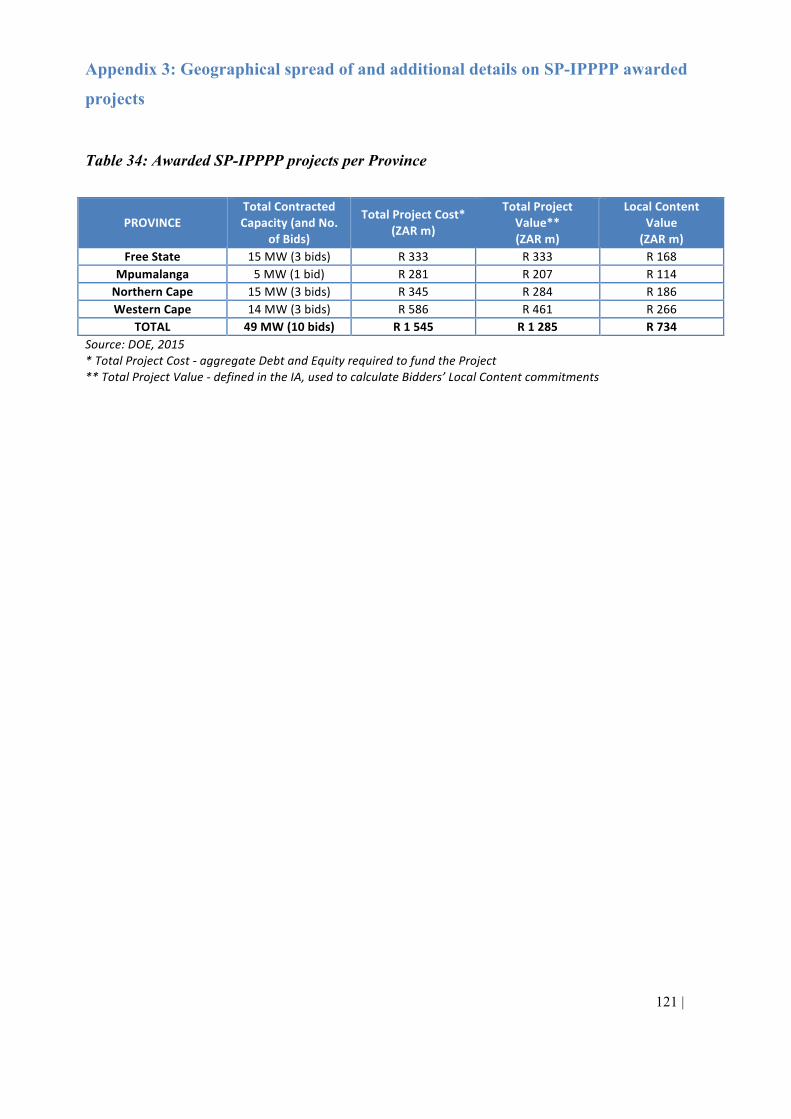
121 | Page
Appendix 3: Geographical spread of and additional details on SP-IPPPP awarded
projects
Table 34: Awarded SP-IPPPP projects per Province
Source:DOE,2015*TotalProjectCost-aggregateDebtandEquityrequiredtofundtheProject**TotalProjectValue-definedintheIA,usedtocalculateBidders’LocalContentcommitments
PROVINCETotalContractedCapacity(andNo.
ofBids)
TotalProjectCost*(ZARm)
TotalProjectValue**(ZARm)
LocalContentValue(ZARm)
FreeState 15MW(3bids) R333 R333 R168Mpumalanga 5MW(1bid) R281 R207 R114NorthernCape 15MW(3bids) R345 R284 R186WesternCape 14MW(3bids) R586 R461 R266
TOTAL 49MW(10bids) R1545 R1285 R734
122 | Page
Appendix 4: PPA Key Clauses
1. Capacity to remain as installed at COD
The seller may not make any additions to or expand the facility to increase the installed
capacity beyond that which is installed at COD.
2. Deadline for seller to commence and continue construction
The seller must “commence and continue construction” of the facility within 180 days62 of
effective (signature) date. If the seller fails to do so, the buyer is entitled to terminate the
PPA.
Where there is a dispute between the seller and buyer regarding whether the seller has in
fact commenced and continued construction, the Independent Engineer will have final and
binding judgment.
“Commence and continue construction” means:
- The seller has authorized a contractor to commence works under a binding written contract
directly related to the construction of the facility, and
- Such contractor has begun significant ground works, such as excavations for laying
foundations or cables (or other action that would involve significant cost and effort from
the contractor), or
- The seller has procured plant items that equate to material expenditure in relation to
construction of the facility, and proof has been provided to the buyer and, in all above
cases,
- That construction works are on-going and have not been suspended or abandoned.
3. Connecting to the grid
When signing the PPA, the seller warrants that it has entered into a Distribution or
Transmission Agreement with the Distributor or NTC, respectively, on or before signature
date.
62Not 180 business days.
123 | Page
The seller must give the buyer ≥ 60 days’ advance written notice of the date on which it
anticipates it will require a unit or units (if the facility is being commissioned in phases) or
the facility to be connected to the system.
As per the Distribution/ Transmission Agreement the distributor/ NTC will construct the
Distribution/ Transmission Connection Works, while the seller will construct the Facility
Connection Works to connect the unit(s) or facility to the system.
4. Appointment of Independent Engineer
Within Schedule 5 to the PPA, the parties (seller and buyer) must identify ≤ 5 firms of
independent consulting engineers, all of which would qualify to be the Independent
Engineer that is required to be appointed under the PPA.
In order to qualify, the seller must warrant that:
- Each firm listed has ≥ 7 years of professional experience as an engineer in the RE industry
and
- Has not rendered any services to the seller, its shareholders (direct/ indirect), contractors,
lenders or any affiliate of the project as at the effective date.
Within 20 business days of the effective date, the seller must engage with any (or all) of these
firms with a view to appointing one as the Independent Engineer.
The Independent Engineer will be appointed at the sole cost of the seller, but will act on behalf
of and owe a duty to both the seller and buyer equally.
It is important that the Independent Engineer remains independent. If, after the effective date,
it renders services to the seller or its above-mentioned affiliates, the seller must promptly
notify the buyer and the buyer may elect for the seller to terminate the contract with the
Independent Engineer. In this case, a new Independent Engineer must be appointed from the
Schedule 5 list or as agreed between the buyer and seller.
Schedule 10 to the PPA sets out the terms required for the Independent Engineer Agreement.
5. Facility completion and commissioning
The seller must use all reasonable endeavours to achieve COD by the scheduled COD.
124 | Page
If it becomes aware that COD will not be achieved by the scheduled COD, it should promptly
notify the buyer in writing of this and the measures it will take to mitigate delay, as well as
the impact of these measures.
The seller must use all reasonable endeavours to commission the facility and procure the
Facility Completion Form by the Independent Engineer (at its own cost) to ensure that the
COD falls on or before the scheduled COD.
It must provide the buyer with all relevant information on the associated commissioning and
testing on a weekly basis.
The seller must procure the Facility Completion Form in order to achieve COD.
It may still procure the Facility Completion Form where the resulting Achieved Capacity is
expected to be less than the Contracted Capacity.
Early Operating Period:
- The seller should issue the Notice of Commencement of Unit to the buyer in respect of
each unit (if applicable) at least 10 business days before the seller anticipates that the
relevant unit(s) will begin generation and early delivery of early operating energy to the
delivery point. The first Notice of Commencement of Unit may not be issued more than
180 days before the scheduled COD.
- Until 00:00 on the Unit Commencement Date, the buyer is not obliged to purchase any
early operating energy generated by that unit.
Commercial Operation Date:
- The seller must give the buyer ≥ 60 days advance written notice of its intention to issue the
Notice of Commencement of Facility.
- The seller may not issue the Notice of Commencement of Facility ˃ 1 day before the
scheduled COD.
- Once the Independent Engineer has ascertained the facility completion and the seller has
received the relevant Facility Completion Form, it must issue the Notice of
Commencement of Facility to the buyer within 2 business days of the delivery of this
form.
125 | Page
Achieved Capacity vs. Contracted Capacity:
If the facility has achieved facility completion and the achieved capacity is ≥ contracted
capacity, then for the purposes of the PPA:
- The facility’s power output is limited to the contracted capacity, and
- The seller must deliver the buyer a Notice of Commencement of Facility. COD will begin
at 00:00 following the day upon which the buyer receives this Notice.
Where the facility has achieved completion and the achieved capacity is ≤ contracted
capacity but ≥ the minimum acceptance capacity (where the minimum acceptance capacity
is 50% of the contracted capacity) then the seller may:
- Elect not to effect any repairs or replacements and simply issue a Notice of
Commencement of Facility
- If necessary, at its own expense, effect repairs or replacements to the facility necessary to
achieve its contracted capacity, upon which the Facility Completion shall be re-assessed by
the Independent Engineer and
- If it is now ≥ contracted capacity, then the above clause will apply, or
- If, as re-assessed, it remains ≤ contracted capacity but ≥ the minimum acceptance capacity,
then the seller may deliver the buyer a Notice of Commencement of Facility,
- Provided that, in the case of replacements, they must be completed and the Facility
Completion Form must be completed and submitted to the buyer by the last COD.
If the facility has achieved completion and the achieved capacity is ≤ the minimum
acceptance capacity, then the seller must:
- At its own expense, effect the repairs/ replacements necessary for it to achieve an achieved
capacity ≥ the minimum acceptance capacity, provided that such repairs have been
completed, the Facility Completion Form has been re-assessed and duly completed to
demonstrate an achieved capacity ≥ the minimum acceptance capacity by last COD.
For every day that the COD is delayed beyond the scheduled COD (unless caused by a system/
compensation event), the Operating Period will be reduced by an additional day and the expiry
date will be brought forward by 1 day.
The seller is entitled to declare COD for the facility at any time up to 17:00 on the last COD,
in respect of that achieved capacity for which the Independent Engineer has completed the
126 | Page
Facility Completion Form by no later than 17:00 on the last COD. If the seller does this and
the achieved capacity is ≥ minimum acceptance capacity, the buyer is not entitled to call a
seller default.
If the buyer does not achieve COD by the last COD (being exactly 18 months after scheduled
COD), the buyer is entitled to terminate the PPA.
Where the achieved capacity at COD is ≤ than contracted capacity, then from this COD the
contracted capacity will be reduced to the achieved capacity and the power output will be
limited to the latter for the purposes of the PPA. The seller may not subsequently increase the
achieved capacity beyond that installed at COD.
6. Generation forecasts
The seller must provide the buyer and system operator, in writing for each week in the early
operating period and operating period, by no later than 09:00 on the preceding Wednesday, its
estimate of the forecast level of energy expected to be generated by the facility for each day in
the week.
If the seller fails to do so, the buyer is entitled to do or procure that another person provides it
with this forecast, and can recover the costs of this forecast from the seller.
The seller must provide the buyer and system operator, in writing, for each day in the early
operating and operating period, by no later than 10:00 on the preceding day, its estimate of the
level of energy expected to be generated each hour of the next day.
If the seller fails to do so, the buyer is entitled to do or procure that another person provides it
with this forecast, and can recover the costs of this forecast from the seller.
7. Invoicing
The seller must submit an invoice to the buyer within 2 business days of the end of the billing
period, specifying:
- The early operating energy payment and/ or commercial energy payment
- The deemed energy payment, if any,
- The Use of System charges due to be reimbursed to the seller and
- Any amounts owed by the seller to the buyer (or vice versa).
127 | Page
The invoice shall be prepared based on the billing data obtained from the Facility Metering
Installation.
8. Failure to make payment
The buyer must pay the seller within 30 business days of receipt of the invoice.
If the buyer fails to pay any amount(s) due and payable within 5 business days of the due
date, the seller may serve notice on the buyer specifying the details thereof.
If such failure has not been remedied or rectified within 20 business days of such notice, the
seller may call a compensation event and enforce the Implementation Agreement.
If any amount due and payable is not paid by the due date, interest will accrue on the full
amount due at the agreed interest rate from the due date to (but excluding) the date of
payment.
9. Billing Disputes
A party disputing an invoice must notify the other party in writing before the due date for
payment thereof, provide details on the disputed portion and pay the undisputed portion of the
invoice on the due date.
The dispute must be resolved within 30 days of the notice of dispute. Where this dispute is in
respect of the billing data obtained by the seller from the facility metering installation, the
buyer is entitled to request a test of this metering installation.
If it is agreed/ determined that all or part of a disputed amount which has been paid should not
have been paid, it must refunded within 5 business days of this agreement/ determination,
together with interest at the agreed interest rate from the date of such overpayment to, but
excluding, the date of repayment.
If the parties fail to resolve an invoice dispute within 30 days of the date upon which the
notice was served, either party will be entitled to refer the dispute to an expert for
determination.
128 | Page
10. Reports, records, plans & monitoring
The seller must, within 2 hours, notify the buyer if the facility or ≥ 10% of the contracted
capacity is incapable of generating electricity for any of the following reasons (provided that
its unavailability has not already been notified as part of a Scheduled Outage or pursuant to
the Generation Forecasts required):
- For reasons of any outages or
- Where to do so would not be in accordance with the standards of a Reasonable and Prudent
Operator or
- In circumstances relating to safety (either personnel or the facility apparatus) or
- In circumstances where to do so would be unlawful or
- For reasons of force majeure, a system event, government default or a compensation event,
and (in all the above cases)
- Must deliver the buyer a written report detailing the reasons for such incapacity within 5
business days.
The seller must maintain complete and accurate data and records required to facilitate the
proper administration of the PPA. It must include an accurate and up-to-date log of operations,
updated daily and include:
- For each 10 minute period in each day, the energy output and reactive energy output
- Changes in operating status during the day
- The number of outages in the day, the duration and reason for each as well,
- All resource and climatic data recorded at the project site,
- All data required in terms of Schedule 6 (Deemed Energy Payments)
- Any information required to be recorded and/ or reported in terms of the Consents and
- Any unusual conditions found during Maintenance inspections.