Embed Size (px)
Citation preview

www.elsevier.com/locate/atmos
Atmospheric Research 67–68 (2003) 73–94
The spatial distribution of severe thunderstorm and
tornado environments from global reanalysis data
Harold E. Brooksa,*, James W. Leeb,1, Jeffrey P. Cravenc,2
aNOAA/National Severe Storms Laboratory, 1313 Halley Circle, Norman, OK 73069, USAbUniversity of Oklahoma, Norman, OK, USA
cNOAA/National Weather Service/Storm Prediction Center, Norman, OK, USA
Abstract
Proximity sounding analysis has long been a tool to determine environmental conditions
associated with different kinds of weather events and to discriminate between them. It has been
limited, necessarily, by the spatial and temporal distribution of soundings. The recent development of
reanalysis datasets that cover the globe with spatial grid spacing on the order of 200 km and temporal
spacing every 6 h allows for the possibility of increasing the number of proximity soundings by
creating ‘‘pseudo-soundings.’’ We have used the National Center for Atmospheric Research
(NCAR)/United States National Centers for Environmental Prediction (NCEP) reanalysis system to
create soundings and find environmental conditions associated with significant severe thunderstorms
(hail at least 5 cm in diameter, wind gusts at least 120 km h� 1, or a tornado of at least F2 damage)
and to discriminate between significant tornadic and non-tornadic thunderstorm environments in the
eastern United States for the period 1997–1999. Applying the relationships from that region to
Europe and the rest of the globe, we have made estimates of the frequency of favorable conditions
for significant severe thunderstorms. Southern Europe has the greatest frequency of significant
severe thunderstorm environments, particularly over the Spanish plateau and the region east of the
Adriatic Sea. Favorable significant tornadic environments are found in France and east of the
Adriatic. Worldwide, favorable significant thunderstorm environments are concentrated in equatorial
Africa, the central United States, southern Brazil and northern Argentina, and near the Himalayas.
Tornadic environments are by far the most common in the central United States, with lesser areas in
southern Brazil and northern Argentina.
Published by Elsevier B.V.
Keywords: Spatial distribution; Severe thunderstorm; Tornado
0169-8095/03/$ - see front matter. Published by Elsevier B.V.
doi:10.1016/S0169-8095(03)00045-0
* Corresponding author.
E-mail address: [email protected] (H.E. Brooks).1 Current affiliation: NOAA/National Weather Service, Key West, FL, USA.2 Current affiliation: NOAA/National Weather Service, Jackson, MS, USA.
H.E. Brooks et al. / Atmospheric Research 67–68 (2003) 73–9474
1. Introduction
Severe thunderstorms pose a significant challenge for development of reasonably
accurate climatologies. They are rare events at any particular location and, in general, their
reporting depends upon the presence of a system designed to collect data and an observer
at the location of the event. Brooks and Doswell (2001) discussed some of the problems
with particular regard to the tornado-reporting problem. A lack of uniformity in standards
for data collection between different countries and changes through time in the way data
are collected makes comparisons across space and time very difficult.
A possible solution to some of the problems is to use meteorological covariates
(Brown and Murphy, 1996) to estimate the occurrence of events. Covariates are
variables that are measured consistently in space and time and have some relationship
to the event of interest. In effect, the challenge of estimating occurrence of the weather
event of interest is transformed from solving the poor quality of observations to
developing a reasonable relationship between a well-observed variable and the event
we are actually interested in.
In the severe weather community, there is a long tradition of studies of so-called
‘‘proximity soundings’’, rawinsonde launches taken near to severe weather events in space
and time, to try to determine the relationship between large-scale environmental variables
and severe weather occurrence (e.g., Fawbush and Miller, 1952, 1954; Beebe, 1955, 1958,
1963; Darkow, 1969; Turcotte and Vigneux, 1987; Johns et al., 1993; Brooks et al., 1994;
Rasmussen and Blanchard, 1998; Craven, 2001; Craven et al., 2002a; Brooks and Craven,
2002). A goal on many of these studies was to find a small set of parameters that could
discriminate between different kinds of weather of interest, say between severe and non-
severe thunderstorm environments or tornadic and non-tornadic environments.
Proximity sounding analyses are naturally related to the concept of meteorological
covariates. If a relationship can be established between variables associated with the
soundings and severe weather occurrence in regions where the reporting of severe
weather is reasonably good, it might be possible to apply those relationships to
soundings taken in other locations where the severe weather reporting is not as good
and estimate the likely occurrence of severe weather. For instance, if a particular
combination of convective available potential energy (CAPE) and vertical shear of the
tropospheric horizontal winds is associated with severe thunderstorms more often than
another combination, then the frequent occurrence of the former combination at some
other location would imply that severe thunderstorms are likely to be frequent at the
second location.
Here, we focus on detection of environments associated with ‘‘significant severe
thunderstorms’’, those producing hail of 5 cm or greater in diameter, wind gusts of 120
km h� 1 or greater, or a tornado of F2 intensity or greater, and those producing
significant tornadoes (F2 or greater). In one sense, this is for practical considerations.
Rasmussen and Blanchard (1998) and Craven et al. (2002a) have shown that
discriminating between those events and less-severe events is easier than discriminating
between less-severe storms and non-severe thunderstorms in the United States. Thus,
the task should be easier than for trying to identify all severe thunderstorms. In
addition, these storms will almost always produce significant threats to life and property

H.E. Brooks et al. / Atmospheric Research 67–68 (2003) 73–94 75
no matter where they occur. This is not meant to imply that other storms are not of
importance, but just that they may be more difficult to detect in the large-scale
environmental conditions.
Our primary goal in this paper is to determine if relationships between sounding-
derived parameters and severe weather occurrence, determined in the United States,
where the severe weather reporting system is relatively good, can be applied to other
parts of the globe. Lee (2002) took proximity sounding analysis in a new direction that
is especially useful. He used the reanalysis data producing by the United States
National Centers for Environmental Prediction (NCEP) and National Center for
Atmospheric Research (NCAR) (Kalnay et al., 1996) to produce artificial soundings
for the environmental conditions side of covariate relationship using the region of the
United States east of the Rocky Mountains from 1997 to 1999. The higher horizontal
resolution of the reanalysis compared to the observed sounding network (roughly 200
km spacing vs. 400 km spacing) is attractive for proximity studies, since it increases
the likelihood that any event will be associated with a sounding. We have chosen a
definition of proximity in keeping with Craven (2001) and Craven et al. (2002a,b) with
events required to occur within 3 h of the sounding time and within 100 nautical miles
(185 km) in space. With the reanalysis spacing, all events meet the spatial criterion, so
that the only soundings that would be lost will be because of the temporal constraint.
Since the temporal spacing of the reanalysis is 6 h, it would be possible to have all
events as proximity, if all sounding times were used. In this preliminary study, we have
only looked at the reanalysis time closest to late afternoon and early evening (local
time) since many locations show an apparent peak in significant severe weather
occurrence during that time of day. For the area of the globe between 45jW and
45jE longitude (including the European region), the 1800 UTC time was used. For
135jW to 45jW (including the United States), 0000 UTC was used, on so forth around
the globe.
2. The NCAR/NCEP reanalysis dataset
The reanalysis dataset was created through the cooperative efforts of the United States
National Centers for Environmental Prediction (NCEP) and National Center for Atmo-
spheric Research (NCAR) (Kalnay et al., 1996) to produce relatively high-resolution
global analyses of atmospheric fields over a long time period. The reanalysis data record
has since been extended to include January 1948 through July 2002. The basic concept of
the reanalysis was to:
1. Recover all available observations from each time index and synthesize them with a
static data assimilation system.
2. Use the observational fields to initialize a model for a 6-h forecast. The model used
(hereafter referred to as the reanalysis model) was identical to the NCEP global
operational model, except for the horizontal resolution. The reanalysis model is T62
(equivalent to a horizontal resolution of approximately 210 km), while the operational
model is T126 (approximately 105 km).

H.E. Brooks et al. / Atmospheric Research 67–68 (2003) 73–9476
3. Use the forecast as a first-guess, in conjunction with concurrent observational fields, to
construct the reanalysis output. Reanalysis fields were generated with an optimal
interpolation technique.
4. Repeat the process every 6 h.
Thus, the reanalysis used model forecasts and observations to transport information
from regions of high observational density to those with fewer observations. The state of
the atmosphere could thus be estimated in areas that are relatively devoid of data. The
result of the reanalysis process was a dataset consisting of a global, three-dimensional
picture of the atmosphere at 6-h intervals during a period of more than 50 years.
Output is available from the reanalysis on 28r levels (r = p/p0, where p is pressure and
p0 is surface pressure) in the vertical, and in the form of spectral coefficients in the
horizontal. Approximately 10r levels exist between the near-surface (the lowest having
r = 0.995) and 700 hPa. When the spectral coefficient data are translated onto an equally
spaced (in latitude and longitude) grid, the result is 192� 94 gridpoints. The spatial
resolution is 1.875j in longitude and 1.915j in latitude, equivalent to a grid spacing
slightly finer than 200 km over most of the globe.
The reanalysis data includes six atmospheric fields. Surface height (in terms of
geopotential) is constant over time. The other five fields are available every 6 h. The
natural log of surface pressure is the only one of these five variables not available above
the surface. The other four (virtual temperature, specific humidity, divergence, and
vorticity) are available at 28 vertical levels. Atmospheric parameters necessary for the
construction of a sounding (i.e., temperature, dewpoint, wind speed and direction, heights,
and pressure) were derived from the six initial fields using the Spherepack software
package (Adams and Swarztrauber, 1999).
The soundings were analyzed using a version of the Skew-t/Hodograph Analysis and
Research Program (SHARP) (Hart and Korotky, 1991) to produce a large number of
convectively important parameters. Lee (2002) demonstrated that for most parameters, the
reanalysis produces values that resemble collocated observed soundings. The reanalysis
has the most problems with things involving strong vertical gradients, so that surface-
based parameters may not be reproduced as well, and parameters that attempt to measure a
strong inversion may also not be estimated well.
Brooks et al. (1994) discussed problems with determining if a sounding is appropriate
for use in proximity studies. Although the reanalysis data could have some of the problems
discussed, such as a sounding being taken on the other side of a significant boundary from
the event of interest, or a sounding not sampling important mesoscale variability, it should
have fewer problems with things such as convective contamination of the sounding. For our
purposes, we have carried out no quality control on the soundings. All soundings are
considered ‘good’. Lee (2002) associated all soundings with the most severe weather event
that occurred within 3 h and 185 km of the location. Thus, if a significant tornado occurred
within the space and time constraints, the sounding was considered tornadic. If no
significant tornado occurred, but a significant non-tornadic event occurred, the sounding
was considered significant tornadic. If severe weather occurred, but it was non-significant,
the sounding was considered severe, and if no severe weather occurred, the sounding was
non-severe.

H.E. Brooks et al. / Atmospheric Research 67–68 (2003) 73–94 77
3. Results
3.1. Identification of parameters for discrimination
Previous studies indicated that CAPE and shear over a deep level of the atmosphere are
good parameters to use in combination to discriminate between significant severe
thunderstorms and less severe events (Rasmussen and Blanchard, 1998; Craven et al.,
2002a) The question of which parcel to use in calculating CAPE does not have an obvious
answer. Based on Craven et al. (2002b), we have chosen to use a parcel with
thermodynamic properties mixed over the lowest 100 hPa. For the shear, we have chosen
to use the magnitude of the vector difference between the winds at the surface and 6 km
above ground level. (Since the only time we will compare shear values of different
soundings will be for shear over a constant depth of the atmosphere, we will occasionally
refer to the wind difference as ‘‘shear’’ for simplicity.) A scatterplot of the 0–6 km shear
and CAPE for all soundings with non-zero CAPE associated with severe thunderstorms
from the reanalysis in the United States for 1997 to 1999 illustrates the discrimination
based on the reanalysis (Fig. 1). In general, significant severe thunderstorms are associated
with high CAPE and high shear. (The non-severe soundings are not included in the figure,
but would predominantly be found in the low CAPE region.)
Fig. 1. Magnitude of the vector wind difference between the surface and 6 km (m s� 1) and CAPE (J kg� 1) for all
reanalysis soundings associated with severe thunderstorms in US for 1997–1999, segregated by weather type:
non-significant severe weather (small gray dots), significant, non-tornadic severe weather (large black dots), and
significant tornadoes (open squares). Solid black line is best discriminator between soundings associated with
significant severe thunderstorms of any kind and other soundings. Note that non-severe soundings are not
included in the figure.

H.E. Brooks et al. / Atmospheric Research 67–68 (2003) 73–9478
A ‘‘best’’ discriminator line has been included in Fig. 1. It was computed by using
linear discriminant analysis (Wilks, 1995) for all soundings associated with severe weather
with at least 100 J kg� 1 of CAPE, using logarithms of the CAPE and the 0–6 km shear as
the input parameters. Logarithmic relationships between CAPE and shear have previously
been shown to discriminate between severe and non-severe thunderstorm environments
(Turcotte and Vigneux, 1987). The discrimination line from the analysis is
2:86logðS6Þ þ 1:79logðCAPEÞ ¼ 8:36 ð1Þ
where S6 is the 0–6 km shear (in m s� 1). Above that line, soundings are more likely to be
associated with significant severe thunderstorms.
After looking at the spatial distribution of soundings above the line in Fig. 1 (which will
be discussed later), a second important discriminatory parameter was identified: the lapse
rate of temperature from 2 to 4 km above ground level. This parameter has not been
studied in the observational studies, but shows a strong discriminatory capability between
significant severe thunderstorm environments and less-severe environments (Fig. 2).
Almost 78% of the significant severe soundings have a lapse rate of at least 6.5 K
km� 1, while only 30% of the less severe soundings are that unstable.
Craven (2001) and Craven et al. (2002a,b) found that shear over the lowest 1 km of the
atmosphere and the height of the lifted condensation level provide the best discrimination
between significant tornadic environments and significant non-tornadic environments.
Combining the two with the reanalysis data (Fig. 3) illustrates that the two parameters
Fig. 2. Cumulative distribution functions of 2–4 km AGL lapse rates (K km� 1) for all significant severe
thunderstorm soundings (black line), and other soundings (gray line) for all 1997–1999 US soundings. The lines
show the fraction of the soundings (value on the ordinate) with lapse rates equal to or less than the value on the
abscissa. Lapse rate of 6.5 K km� 1 indicated by vertical line. 22% of significant severe thunderstorm soundings
have a lapse rate less than that, while 70% of the less severe soundings do.

Fig. 3. Magnitude of the vector wind difference between the surface and 1 km (m s� 1) and height of mixed layer
lifted condensation level (in m) for all US reanalysis soundings associated with significant severe thunderstorms,
segregated by weather type: non-tornadic soundings (black dots), tornadic soundings (open squares). Thick black
(gray, thin black) line is line from linear discriminant analysis associated with station elevation of 0 (1500, 3000) m.
H.E. Brooks et al. / Atmospheric Research 67–68 (2003) 73–94 79
work well in the reanalysis also. In comparison with the observational studies (Craven et
al., 2002a,b), the 0–1 km shear is typically lower in the reanalysis. This is consistent with
the notion that strong vertical gradients are not reproduced well by the reanalysis.
Nevertheless, the two parameters show signs of discriminating well between the environ-
ments associated with the two kinds of events. From analysis of the spatial distribution of
the two parameters in the United States, however, it is clear that there are significant
differences in the performance of the discrimination in the Plains region, compared to the
area further to the east. Given that the Plains locations are at higher elevation, a third
parameter, station elevation, was added to the linear discriminant analysis. The resulting
discrimination plane was defined by
2:74S1� 2:99� 10�4LCL� 3:06� 10�4ELV ¼ 1:93 ð2Þ
where S1 is the 0–1 km shear (in m s� 1), LCL is the mean layer lifted condensation level
(in m), and ELV is the station elevation (in m). Lines in the shear/LCL space associated
with various station elevations are shown in Fig. 3, but, in general, low LCL heights and
high shear are associated with tornadic events. The lines move towards higher shear with
increasing station elevation. This implies that at very high elevations, significant tornadoes
should be very rare, an implication supported by lack of observed events at high elevation.
In all, there are five different environments into which the soundings fall, based on the
discrimination lines shown in Figs. 1 and 3, and the CAPE value (Table 1). The first is
those soundings with 0 CAPE, which make up 112,620 of the 197,100 soundings in the
dataset (57.1%). The second is all soundings with positive CAPE, but less than 100 J
kg� 1, which number 35,111 (17.8%). The third is made up of those soundings with at least

Table 1
Five environments into which all soundings are divided, listed in expected order of increasing severity
Environment Description
1 CAPE= 0
2 0 <CAPE< 100 J kg� 1
3 CAPEz 100, but below line on Fig. 1 or 2–4 km AGL lapse
rate < 6.5 K km� 1
4 (Severe) CAPEz 100 and 2–4 km AGL lapse rate >6.5 K km� 1, above
line on Fig. 1, but non-tornadic
5 (Tornadic) Same as 4, but meeting tornadic discriminant analysis threshold
H.E. Brooks et al. / Atmospheric Research 67–68 (2003) 73–9480
100 J kg� 1, but either are below the discrimination line in Fig. 1 or have 2–4 km AGL
lapse rates < 6.5 K km� 1, with a total of 31,489 soundings (16.0%). The fourth category
represents soundings expected to associated with non-tornadic significant severe thunder-
storms, namely those soundings meeting the discriminant analysis criterion for deep
atmospheric variables (i.e, above the line in Fig. 1), but not the discriminant analysis
criterion for shallow atmospheric variables (i.e., below the line in Fig. 3, adjusted for
station elevation), with CAPEz 100 J kg� 1 and 2–4 km AGL lapse ratesz 6.5 K km� 1,
a total of 13,928 soundings (7.1%). For convenience, we will refer to these as ‘‘severe’’
soundings hereafter. The final category contains those soundings that are meet both of the
discrimination criteria with CAPE z 100 J kg� 1 and 2–4 km AGL lapse rates z 6.5 K
km� 1, a total of 3641 soundings (1.8%). These will be referred to as ‘‘tornadic’’ soundings
hereafter.
As the identified environmental conditions become more severe, the probability that the
soundings will be associated with reported significant severe thunderstorms or significant
tornadoes increases monotonically (Fig. 4). Going from the CAPE = 0 environments to the
tornadic environments, the probabilities of severe and tornadic storms increases by two
orders of magnitude or more. The probabilities of significant severe weather of any kind
Fig. 4. Probability of tornadic (black) and any significant severe thunderstorm (gray) given identification of
environment as in Table 1.

H.E. Brooks et al. / Atmospheric Research 67–68 (2003) 73–94 81
goes from 0.06% to 6%, while the probability of a significant tornado increases from
0.004% to 2%. This provides some confidence that the discrimination lines defined here
have some physical relevance. After discussing some of the differences in the distribution
of parameters in the United States and Europe, we will return to these probabilities to
make an estimate of the frequency of significant severe thunderstorm and tornadic events
in Europe.
3.2. Distribution of environmental instability in the United States and Europe
One of the biggest differences in the environmental conditions in the United States east
of the Rocky Mountains and Europe is that European environments tend to have lower
CAPE, as illustrated by a comparison of the cumulative distribution function of CAPE in
the two areas (Fig. 5). The region of Europe under consideration is the land area south of
60jN and has the same number of grid points in the reanalysis as the eastern United
States region for ease of comparison. The years 1997–1999 are considered, as was the
case with the United States, but the sounding time is1800 UTC, in an effort to capture the
late afternoon/early evening environments. While 1000 J kg� 1 of CAPE is not common
in the United States (f 7% of all soundings), it occurs much less often in Europe
(f 1%) and 2000 J kg� 1 is almost unknown in Europe. There are only 32 soundings
out of the almost 200,000 total with that high of a CAPE. Approximately 1% of the
United States soundings have that much CAPE. Most of the United States east of the
Rocky Mountains, with the exception of the Appalachian Mountains, has a CAPE of at
2000 J kg� 1 five days of more per year (Fig. 6). No location in Europe averages as
much as 1 day per year.
Fig. 5. Cumulative distribution function of CAPE (J kg� 1) for soundings from 1997 to 1999 for region of US east
of the Rocky Mountains (black line) and Europe south of 60jN (gray line). Note that scale starts at p= 0.60.

Fig. 6. Days per year with at least CAPE of at least 2000 J kg� 1 from reanalysis soundings in US, based on
1997–1999 period.
H.E. Brooks et al. / Atmospheric Research 67–68 (2003) 73–9482
In a simplistic way, CAPE can be thought of as being a combination of steep lapse rates
in the mid-troposphere and abundant boundary-layer moisture. The spatial distribution of
the number of days per year with the 700–500 hPa lapse rate at least 7 K kg� 1 shows the
Fig. 7. Same as Fig. 6, except for 700–500 hPa lapse rates exceeding 7 K km� 1.

Fig. 8. Same as Fig. 7, except for European region.
H.E. Brooks et al. / Atmospheric Research 67–68 (2003) 73–94 83
importance of the high terrain of the Rocky Mountains for generating steep lapse rates in
the Plains of the United States, east of the mountains (Fig. 7). The peak in lapse rate
occurrence is over the Rockies, with about 250 days per year, but the region of 50 days per
Fig. 9. Same as Fig. 6, except for mean lowest 100 hPa mixing ratio exceeding 10 g kg� 1.

Fig. 10. Same as Fig. 9, except for European region. Note that scale of days is different than in Fig. 9.
H.E. Brooks et al. / Atmospheric Research 67–68 (2003) 73–9484
year extends to roughly the Mississippi River. That is about the maximum frequency over
the continental part of Europe (Fig. 8).
Even though there are substantial differences in lapse rates, the low-level moisture
differences are even larger. Taking 10 g kg� 1 of mean mixing ratio in the lowest 100 hPa
above ground as a threshold for abundant low-level moisture, most of the central and
southeastern United States has at least 90 days of abundant moisture per year, with
values peaking at over 300 days per year in southern Florida (Fig. 9). In contrast,
nowhere over continental Europe has abundant moisture even 60 days per year (Fig. 10).
Some of this difference is due to the latitudinal difference, but the Gulf of Mexico
provides a source of warm water and a long fetch to modify air masses headed towards
Table 2
Estimating the number of significant severe thunderstorms and tornadoes in Europe
Environment p (Severe US) p (Tornadic US) N (US) N
(Europe)
Severe
(Europe)
Tornadic
(Europe)
1 0.000630 0.000036 112,620 114,624 72.3 4.1
2 0.002734 0.000513 35,111 59,350 162.3 30.4
3 0.007964 0.001177 33,149 19,038 151.6 22.4
4 0.038771 0.002513 13,928 6449 250.0 16.2
5 0.060148 0.017303 3641 639 38.4 11.1
Total 1190 (Obs.) 159 (Obs.) 674.6 84.2
Second and third columns give probability of any significant severe thunderstorms and significant tornadoes
associated with the environments as defined in Table 1, with the total number of observed proximity soundings in
the last row. Fourth and fifth columns are number of soundings in each classification for each region. Last two
columns give estimated number of severe and tornadic proximity soundings that would be expected in 3 years in
Europe on the reanalysis grid if probabilities in US apply directly.

H.E. Brooks et al. / Atmospheric Research 67–68 (2003) 73–94 85
North America. In contrast, the Mediterranean is not as warm most of the year and is
relatively small. In particular, surface winds out of the south, that provide a rich moisture
source for the United States, would mean that trajectories approaching Europe would
have started over the Sahara Desert and substantial modification by the Mediterranean
would be difficult.
3.3. Distribution of significant severe thunderstorm and tornado environments
We can use the probabilities shown in Fig. 4 and Table 2 to estimate the frequency of
environments supportive of severe convection in Europe, assuming that the environments
that produce severe convection in the United States would produce severe convection in
Europe as well (Table 2). There are less than half the numbers of severe environments
identified in Europe and only about 20% of the tornadic environments during the 3-year
period. Applying the probabilities from the US to each class of environment in Europe, we
estimate that about 675 significant severe thunderstorm proximity soundings at 1800 UTC
would be taken in Europe on the reanalysis grid in a 3-year period, for an average of 225
per year, with a similar report collection efficiency as in the United States. This compares
to the United States number of 1190 soundings (397 per year). For significant tornadoes,
the results imply 84 soundings (28 per year) in Europe compared to 159 (53 per year) in
the United States. Dotzek (2001) estimates, based on surveys at the 2002 European
Conference on Severe Storms, that a little over 300 tornadoes per year occur in Europe
using the United States definition that excludes waterspouts. In the United States, an
average of approximately 1200 tornadoes per year occur in current reporting conditions
(Bruening et al., 2002), so that the ratio of significant tornado soundings to total tornadoes
Fig. 11. Same as Fig. 6, except for soundings identified as being favorable for significant severe thunderstorms.

H.E. Brooks et al. / Atmospheric Research 67–68 (2003) 73–9486
is about 1:23. The European values imply a ratio of 1:11. Caution must be used in
interpreting the data, given the uncertainties in the reporting and the fact that the
relationships between environments and events are not perfect. In particular, 63 (40%)
of the United States tornadic soundings come from the environments associated with
tornadoes by the discriminant analysis, but only 11 (13%) of the implied European
tornadoes do so. The largest contribution to the tornadic sounding estimate in Europe
comes from the CAPE < 100 J kg environments, with 30 (36%) of the soundings. Thus, the
estimate depends on knowing the values for the low probability events. Nevertheless, it
seems likely to be on the right order.
Just as we constructed maps of the spatial distribution of parameters for the different
regions, we can map the frequency of the environments in the different regions. The
pattern of the distribution of identified significant severe thunderstorm environments (Fig.
11) in the United States bears a strong resemblance to the observed distribution of
significant severe weather reports (Fig. 12). Both show maxima in the Plains dropping off
rapidly towards the northeast. Note that the environmental identifications only imply that
severe convection is favored, not that it necessarily will occur. Nothing in the reanalysis
provides information on the initiation of convection, for example. Nevertheless, the
similarity of the pattern is encouraging.
The similarity between the identified and observed environments for significant
tornadoes is not quite as good (Figs. 13 and 14). The pattern in the identification is
shifted slightly to the east, by a grid point or so on the western side and two grid points
or so on the eastern side of the maximum region in the central United States. The
smaller sample size of the tornadic events makes it harder to evaluate the quality of the
Fig. 12. Same as Fig. 6, except for number of reanalysis soundings associated with significant severe
thunderstorms.
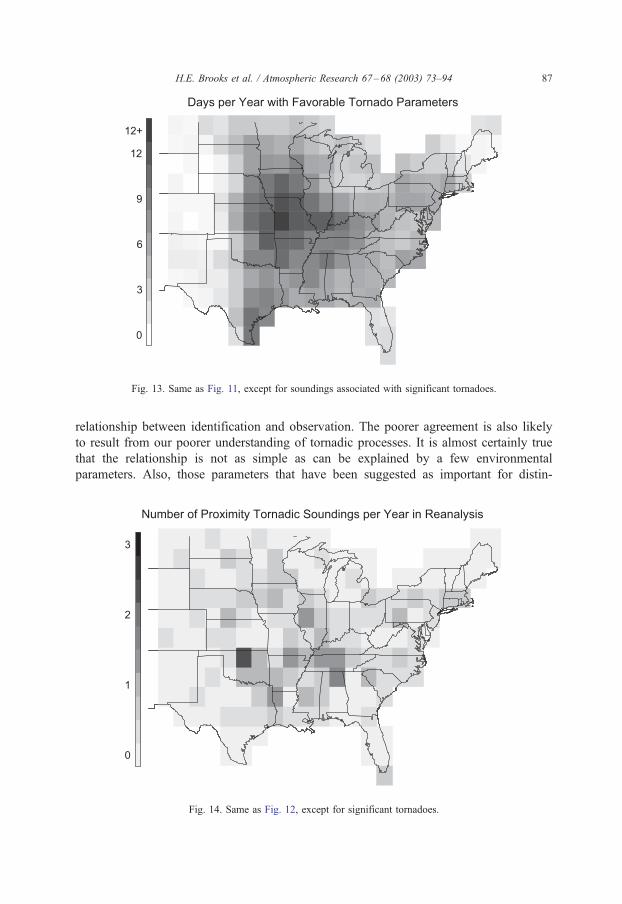
Fig. 13. Same as Fig. 11, except for soundings associated with significant tornadoes.
H.E. Brooks et al. / Atmospheric Research 67–68 (2003) 73–94 87
relationship between identification and observation. The poorer agreement is also likely
to result from our poorer understanding of tornadic processes. It is almost certainly true
that the relationship is not as simple as can be explained by a few environmental
parameters. Also, those parameters that have been suggested as important for distin-
Fig. 14. Same as Fig. 12, except for significant tornadoes.

H.E. Brooks et al. / Atmospheric Research 67–68 (2003) 73–9488
guishing tornadic from non-tornadic environments, such as low-level shear and LCL
height, involve shallow layers of the atmosphere. The cautions about the ability of the
reanalysis to capture strong vertical gradients may be very important here. In addition, in
at least some cases, interactions with boundaries that cannot be sampled by the
reanalysis are important in tornadogenesis (Markowski et al., 1998, Rasmussen et al.,
2000).
With those cautions in mind, application of the relationships derived from the severe
weather reports in the United States to European soundings shows the greatest frequency
of favorable environments for significant severe thunderstorms to be in the south (Fig. 15).
A large area from Spain northeastward through Germany and then southeastward through
the Balkans and along the north shore of the Black Sea is highlighted. Within that area, the
Spanish plateau and the area from northern Italy to Bosnia stand out as the most frequent
locations, although the rates are half of the peaks in the United States. Long-term, detailed
climatologies of severe thunderstorms for these regions do not exist, but there are
suggestions that significant amounts of strong to severe thunderstorms occur there (e.g.,
Costa et al., 2001, Morel and Senesi, 2002).
The distribution of favorable significant tornado environments is somewhat different
(Fig. 16). The region near Bosnia has the highest frequency on the continent, but France
(Paul, 2001), western Germany (Dotzek, 2001) and the Ukraine also have relatively high
numbers of a few days per year with significant tornado potential. These values are
comparable to those in the northern United States (Fig. 13), a region at a similar latitude.
As with the United States, great caution must be taken in interpretation. The period of
study is relatively short and we are hampered by a lack of observational reports of
events.
Fig. 15. Same as Fig. 11, except for European region.

Fig. 16. Same as Fig. 12, except for European region.
H.E. Brooks et al. / Atmospheric Research 67–68 (2003) 73–94 89
The process of producing large number of soundings from the reanalysis takes
considerable time and computer storage space. As a result, we have been somewhat
limited in what we could consider elsewhere. We created soundings for the 3 years for
points with vegetation (DeFries and Townshend, 1994) around the world using every other
gridpoint in longitude and latitude in the reanalysis data. The DeFries and Townshend
dataset contains land-cover characteristics on a 1�1j latitude–longitude grid. Data were
interpolated to the reanalysis grid and, if the point on the reanalysis had vegetation, that
point had soundings created. Soundings were created for the reanalysis time closest to the
late afternoon/early evening time period. Thus, the region from 45jW to 135jW had
soundings at 0000 UTC, the region from 45jE to 45jW had soundings at 1800 UTC, the
region from 135jE to 45jE had soundings from 1200 UTC, and the region from 135jW to
135jE had soundings from 0600 UTC.
Again, it was assumed that the relationships derived from the United States data would
apply. Regions with the greatest frequency of favorable significant severe thunderstorm
conditions are equatorial Africa and the central United States (Fig. 17). Less frequent
regions include the area near the Himalayas and southern Brazil and northern Argentina. In
general, regions downstream of large mountain chains and equatorial Africa are high-
lighted. It is not clear why there is no corresponding maximum over equatorial South
America. The problems with reporting become even more acute outside of North
American and Europe, but Sommeria and Testud (1984) described a field project to study
African squall lines and Altinger de Schwarzkopf and Rosso (1982) showed evidence for
significant tornado activity in northern Argentina.
The regions of significant tornado environments are more limited (Fig. 18). The
central United States, southern Brazil and northern Argentina, and a limited area around
the Himalayas are the most noticeable areas of coverage. Scattered areas exist across the

Fig. 17. Same as Fig. 11, except for world and different scale. Every other reanalysis grid point over land
considered.
H.E. Brooks et al. / Atmospheric Research 67–68 (2003) 73–9490
northern and central parts of Eurasian, but not with as high of peak frequencies. Perhaps
most interesting, in comparison to the significant thunderstorm map, is the almost
complete absence of favorable tornadic environments in equatorial Africa. This is a
result of the near absence of high 0–1 km shear. Of the 2738 soundings identified as
favorable for significant severe thunderstorms in equatorial Africa, only 11 (0.4%) have
a 0–1 km wind difference of at least 10 m s� 1. In contrast, for North America, 208
(12.4%) of the 1678 significant severe thunderstorm soundings have that much shear.
The peak African shear is 11.6 m s� 1, a value exceeded by 7.0% of the North American
soundings.
Fig. 18. Same as Fig. 17, except for tornadic parameters.

H.E. Brooks et al. / Atmospheric Research 67–68 (2003) 73–94 91
4. Discussion
The reanalysis system has shown a great deal of promise as a source of environ-
mental information. Much of what is seen in the results makes intuitive physical sense.
From an ingredients-based approach (Doswell et al., 1996) to severe thunderstorms,
abundant lower-tropospheric moisture, steep mid-tropospheric lapse rates, and strong
tropospheric wind shear are important. The central United States is in an ideal location
for the juxtaposition of those ingredients with the high terrain of the Rocky Mountains
providing a source for high lapse rate air and the Gulf of Mexico providing the moisture.
Winds from the surface from over the Gulf (southerly) and from over the Rockies in the
mid-troposphere results in strong shear at the same time it brings the thermodynamic
ingredients together. Other regions near high terrain with moisture sources on their
equatorward side (east of the Andes and south and east of the Himalayas) show up as
well.
Given that our understanding of tornadic processes is not as good as for severe
thunderstorms, more caution must be taken in interpreting the details. On the coarse
scale, the distribution appears reasonable with the central United States being the most
frequent location for favorable conditions. At the detail level, the United States
distribution is too far east. This implies that we do not understand everything that is
going on. At the simplest level, it is unlikely that the small number of parameters used
here can capture the full physical processes of importance. It is also likely that processes
that are important are not even captured in soundings (e.g., boundaries). In addition, it is
plausible that more than one combination of processes is capable of producing
significant tornadoes. As such, even if our list of ingredients describes the environments
well for one of those processes, it might not describe the environments of other
processes.
While the spatial distribution of environments may (or may not) be correct, the
magnitude of occurrence of events is open to question. The probability that a
favorable environment will actually be associated with an event is unknown. The
number of observed proximity soundings associated with significant severe thunder-
storms in the region studied in the United States is approximately 7% of the
environments identified as ‘‘severe’’ or ‘‘tornadic.’’ The efficiency of the atmosphere
in producing severe thunderstorms in conditions that the sounding analysis identifies as
favorable is unknown, and the strong possibility that it is spatially variable and
involves environmental conditions not included in the reanalysis makes coming up
with quantitative estimates of the global frequency of events challenging, if not
impossible.
This work has been the first step in using reanalysis data to look at environments of
hazardous weather. We have looked globally at only one analysis time for 3 years for a
quarter of the land area outside of Antarctica and Greenland, and for one analysis time
for 3 years over a small part of the planet. As a result, we can say nothing at all about
the diurnal cycle and nothing of significance about interannual variability. While it is
plausible that many severe thunderstorms occur in the late afternoon and early evening
and we carried out our analysis at the nearest time to that part of the day, severe
thunderstorms clearly occur throughout the day. As a result, we hope to look at the

H.E. Brooks et al. / Atmospheric Research 67–68 (2003) 73–9492
entire reanalysis data back through 1957 in order to consider the spatial and temporal
variability.
It may be possible to use the reanalysis to address issues of possible changes in
distribution of severe thunderstorm environments through time and to use it to lay
the groundwork for investigating possible effects of climate change scenarios on
severe thunderstorms (Intergovernmental Panel on Climate Change, 2002). In one
sense, the reanalysis can be thought of as a series of short forecasts and analyses
from a global model. Our results suggest that the reanalysis is capable of providing
useful information on the distribution of severe thunderstorm environments. A
reasonable test of global climate models is whether they are able to reproduce the
current observed distributions of environments. From our results, there is no reason
to doubt that models are capable of reproducing the distribution. Whether they do is
another question. If, however, they do, running the models under different climate
change scenarios might prove instructive in providing an estimate of what could
happen. The observed record of events is not long enough and events are rare
enough that it is difficult to use the observed record in detecting climate change, but
it might be possible to use the observations of environments (Brooks and Doswell,
2001).
At a basic level, our interpretation is limited by the paucity of high-quality
observational records of severe thunderstorm events. Major improvements and testing
of the hypothetical distributions shown here require improvements in our records of
when, where, and what kind of events actually occur. These records will take years to
develop and we urge the international meteorological community to begin the process
now.
Acknowledgements
This work was sponsored, in part, by the NOAA Office of Global Programs (Grant
#GC00-139). We want to thank Kim Elmore of NSSL and the Cooperative Institute for
Mesoscale Meteorological Studies and Matt Wandishin of NSSL and the University of
Arizona for invaluable assistance in creating the maps. Conversations with Chuck Doswell
helped in forming the basic ideas behind the work.
References
Adams, J.C., Swarztrauber, P.N., 1999. SPHEREPACK 3.0: a model development facility. Mon. Weather Rev.
127, 1872–1878.
Altinger de Schwarzkopf, M.L., Rosso, L.C., 1982. Severe storms and tornadoes in Argentina. Preprints, 12th
Conf. Severe Local Storms, San Antonio, Texas, USA, Amer. Meteorol., pp. 59–62.
Beebe, R.G., 1955. Types of airmasses in which tornadoes occur. Bull. Am. Meteorol. Soc. 36, 349–350.
Beebe, R.G., 1958. Tornado proximity soundings. Bull. Am. Meteorol. Soc. 39, 195–201.
Beebe, R.G., 1963. Tornado proximity soundings. Proc. 3rd Conf. on Severe Local Storms, Urbana, Illinois,
USA, Amer. Meteorol., pp. 1–6.
Brooks, H.E., Craven, J.P., 2002. A database of proximity soundings for significant severe thunderstorms,

H.E. Brooks et al. / Atmospheric Research 67–68 (2003) 73–94 93
1957–1993. Preprints, 21st Conference on Severe Local Storms, San Antonio, Texas, Amer. Meteorol.
Soc., pp. 639–642.
Brooks, H.E., Doswell III, C.A., 2001. Some aspects of the international climatology of tornadoes by damage
classification. Atmos. Res. 56, 191–201.
Brooks, H.E., Doswell III, C.A., Cooper, J., 1994. On the environments of tornadic and nontornadic mesocy-
clones. Weather Forecast. 9, 606–618.
Brown, B.G., Murphy, A.H., 1996. Verification of aircraft icing forecasts: the use of standard measures and
meteorological covariates. Preprints, 13th Conf. Probability and Statistics in the Atmospheric Sciences, San
Francisco, California, USA, Amer. Meteorol. Soc., pp. 251–252.
Bruening, S.L., Kay, M.P., Brooks, H.E., 2002. A new perspective on the climatology of tornadoes in the United
States. Preprints, 16th Conference on Probability and Statistics, Orlando, Florida, USA, Amer. Meteorol. Soc.,
pp. J96–J103.
Costa, S., Mezzasalma, P., Levizzani, V., Alberoni, P.P., Nanni, S., 2001. Deep convection over Northern Italy:
synoptic and thermodynamic analysis. Atmos. Res. 56, 73–88.
Craven, J.P., 2001. A baseline climatology of sounding derived parameters associated with deep, moist con-
vection. Unpublished manuscript. 56 pp. [Available from Storm Prediction Center, 1313 Halley Circle Nor-
man, OK 73069 U.S.A.].
Craven, J.P., Brooks, H.E., Hart, J.A., 2002a. Baseline climatology of sounding derived parameters associated
with deep, moist convection. Preprints, 21st Conference on Severe Local Storms, San Antonio, Texas, USA,
Amer. Meteorol. Soc., pp. 643–646.
Craven, J.P., Jewell, R.E., Brooks, H.E., 2002b. Comparison between observed convective cloud-base heights
and lifting condensation level for two different lifted parcels. Weather Forecast. 17, 885–890.
Darkow, G.L., 1969. An analysis of over sixty tornado proximity soundings. Preprints, 6th Conf. on Severe Local
Storms, Chicago, Illinois, USA, Amer. Meteorol., pp. 218–221.
DeFries, R.S., Townshend, J.R.G., 1994. NDVI-derived land cover classification at a global scale. Int. J. Remote
Sens. 15, 3567–3586.
Doswell III, C.A., Brooks, H.E., Maddox, R.A., 1996. Flash-flood forecasting: an ingredients-based method-
ology. Weather Forecast. 11, 360–381.
Dotzek, N., 2001. Tornadoes in Germany. Atmos. Res. 56, 233–252.
Fawbush, E.J., Miller, R.C., 1952. A mean sounding representative of the tornadic airmass environment. Bull.
Am. Meteorol. Soc. 33, 303–307.
Fawbush, E.J., Miller, R.C., 1954. The types of airmasses in which North American tornadoes form. Bull. Am.
Meteorol. Soc. 35, 154–165.
Hart, J.A., Korotky, W.D., 1991. The SHARP workstation—v1.50. A skew-t/hodograph analysis and research
program for the IBM and compatible PC. User’s manual. 62 pp. [Available from NOAA/NWS Forecast Office
Charleston, WV].
Intergovernmental Panel on Climate Change, 2002: Workshop Report, IPCC Workshop on Changes in Extreme
Weather and Climate Events, Beijing, China. 107 pp.
Johns, R.H., Davies, J.M., Leftwich, P.W., 1993. Some wind and instability parameters associated with
strong and violent tornadoes: 2. Variations in the combinations of wind and instability parameters. The
Tornado: Its Structure, Dynamics, Prediction and Hazards. Geophys. Monogr., vol. 79. Amer. Geophys.
Union, pp. 583–590.
Kalnay, E., Kanamitsu, M., Kistler, R., Collins, W., Deaven, D., Gandin, L., Iredell, M., Saha, S., White, G.,
Woollen, J., Zhu, Y., Leetmaa, A., Reynolds, B., Chelliah, M., Ebisuzaki, W., Higgins, W., Janowiak, J., Mo,
K.C., Ropelewski, C., Wang, J., Jenne, R., Joseph, D., 1996. The NCEP/NCAR 40-year reanalysis project.
Bull. Am. Meteorol. Soc. 77, 437–472.
Lee, J.W., 2002. Tornado proximity soundings from the NCEP/NCAR reanalysis data. MS Thesis, University of
Oklahoma. 61 pp.
Markowski, P.M., Rasmussen, E.N., Straka, J.M., 1998. The occurrence of tornadoes in supercells interacting
with boundaries during VORTEX-95. Weather Forecast. 13, 852–859.
Morel, C., Senesi, S., 2002. A climatology of mesoscale convective systems over Europe using satellite infrared
imagery: II. Characteristics of European mesoscale convective complexes. Q. J. R. Meteorol. Soc. 128,
1973–1995.

H.E. Brooks et al. / Atmospheric Research 67–68 (2003) 73–9494
Paul, F., 2001. A developing inventory of tornadoes in France. Atmos. Res. 56, 269–280.
Rasmussen, E.N., Blanchard, D.O., 1998. A baseline climatology of sounding-derived supercell and tornado
forecast parameters. Weather Forecast. 13, 1148–1164.
Rasmussen, E.N., Richardson, S., Straka, J.M., Markowski, P.M., Blanchard, D.O., 2000. The association of
significant tornadoes with a baroclinic boundary on 2 June 1995. Mon. Weather Rev. 128, 174–191.
Sommeria, G., Testud, J., 1984. COPT 81: a field experiment designed for the study of dynamics and electrical
activity of deep convection in continental tropical regions. Bull. Am. Meteorol. Soc. 65, 4–10.
Turcotte, V., Vigneux, D., 1987. Severe thunderstorms and hail forecasting using derived parameters from
standard RAOBS data. Preprints, Second Workshop on operational meteorology. Halifax, Nova Scotia,
Canada, Atmos. Environ. Service/Canadian Meteorol. and Oceanogr., pp. 142–153.
Wilks, D.S., 1995. Statistical Methods in the Atmospheric Sciences, Academic Press, New York. 467 pp.