Embed Size (px)
Citation preview
Audit Outcomes of the 2018/19 financial year : Analysis Document | i
THE STATE OF LOCAL GOVERNMENT FINANCES AND
FINANCIAL MANAGEMENT AS AT 30JUNE 2019
Audit Outcomes of the 2018/19 financial yearAnalysis Document

THE STATE OF LOCAL GOVERNMENT FINANCES AND
FINANCIAL MANAGEMENT AS AT 30JUNE 2019
Audit Outcomes of the 2018/19 financial yearAnalysis Document
CONTACT PERSON:JAN HATTINGH
Chief Director: Local Government Budget Analysis, Intergovernmental Relations (IGR)
Tel: (012) 315-5009 | Fax: (012) 395 6553E-mail: [email protected]
CONTENTS
ABBREVIATIONS ................................................................................................................................ vi
EXECUTIVE SUMMARY ...................................................................................................................... 1
INTRODUCTION ................................................................................................................................. 4
A BROADER PERSPECTIVE ON LOCAL GOVERNMENT PERFORMANCE IN SOUTH AFRICA ................................................................................................ 6
The fiscal framework for local government in South Africa ....................................................................... 6
INTERNATIONAL BENCHMARKS OF NATIONAL GOVERNMENT FINANCE IN SOUTH AFRICA ........................................................... 7
ASSESSMENT OF THE FINANCIAL HEALTH OF MUNICIPALITIES ............................................ 8
Measures of municipal financial health ......................................................................................................... 8
Indicators (cash and cash equivalents and Cash coverage) assessing the vulnerability
of Municipalities’ cash position ......................................................................................................................... 9
OTHER ISSUES IMPACTING ON THE FINANCIAL HEALTH OF A MUNICIPALITY .................27
THE STATE OF LOCAL GOVERNMENT FINANCES AND FINANCIAL MANAGEMENT AS AT 30JUNE 2019
Audit Outcomes of the 2018/19 financial yearAnalysis Document
Audit outcomes: 2018/19 financial year .......................................................................................................27
Governance: Acting Municipal Manager and Chief Financial Officer Positions .................................30
Governance: Suspended Municipal Officials ...............................................................................................33
Significant electricity and water losses .........................................................................................................33
Inadequate budgets for repairs and maintenance and asset management.......................................34
Spending of conditional grants ......................................................................................................................38
Funded Budgets as per the audit outcomes .................................................................................................39
MUNICIPALITIES IN FINANCIAL DISTRESS .................................................................................40
Manifestations of financial distress ...............................................................................................................40
Causes and effects of local government finance failures ..........................................................................41
Support and reforms to municipalities provided by the National Treasury .........................................43
Interventions in municipalities ........................................................................................................................48
CONCLUDING REMARKS ................................................................................................................50
ANNEXURE A1 ..................................................................................................................................52
ABBREVIATIONS
The State Of Local Government Finances and Financial Management - As at 30 June 2019
vi | Audit Outcomes of the 2018/19 financial year : Analysis Document
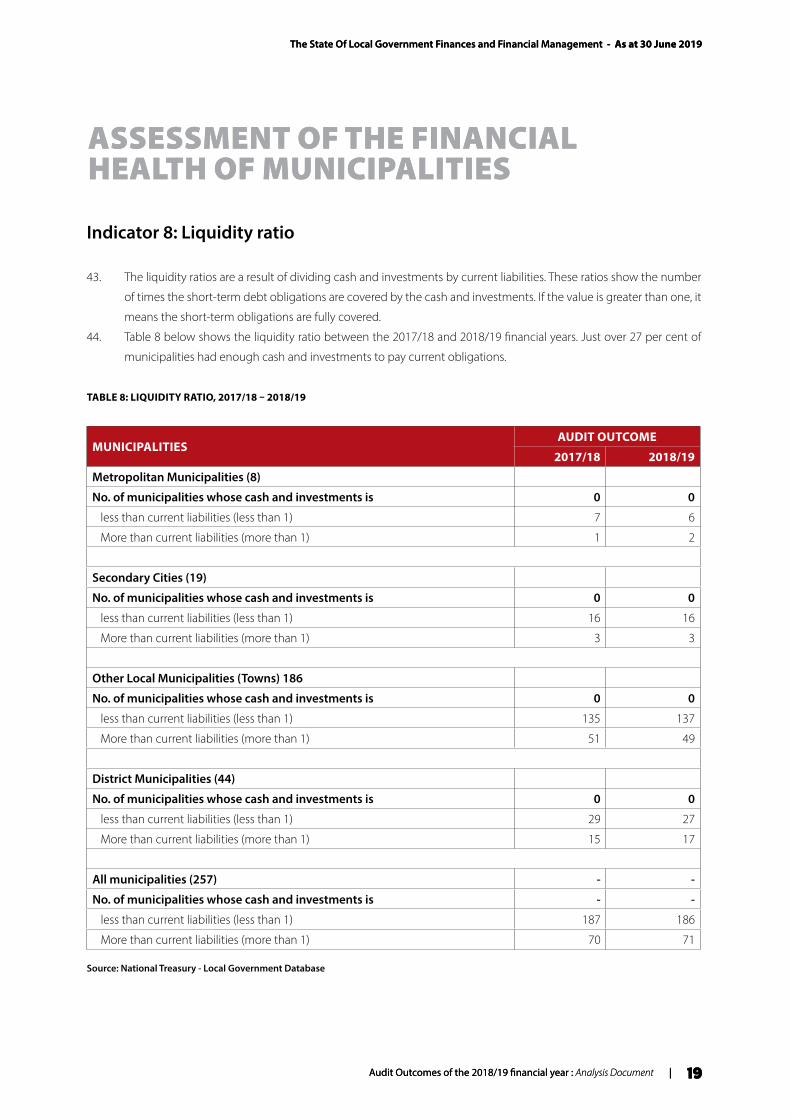
AFS Annual Financial Statements
AG Auditor-General
ASB Accounting Standards Board
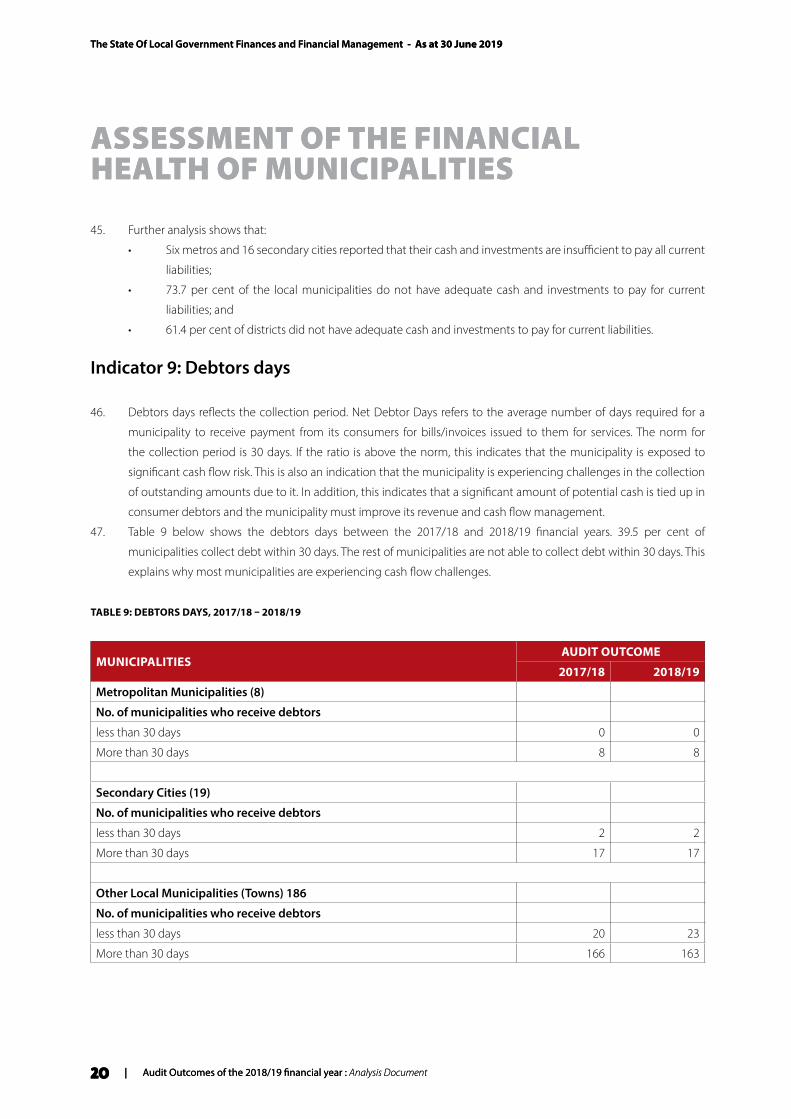
B2B Back to Basics
CEO Chief Executive Officer
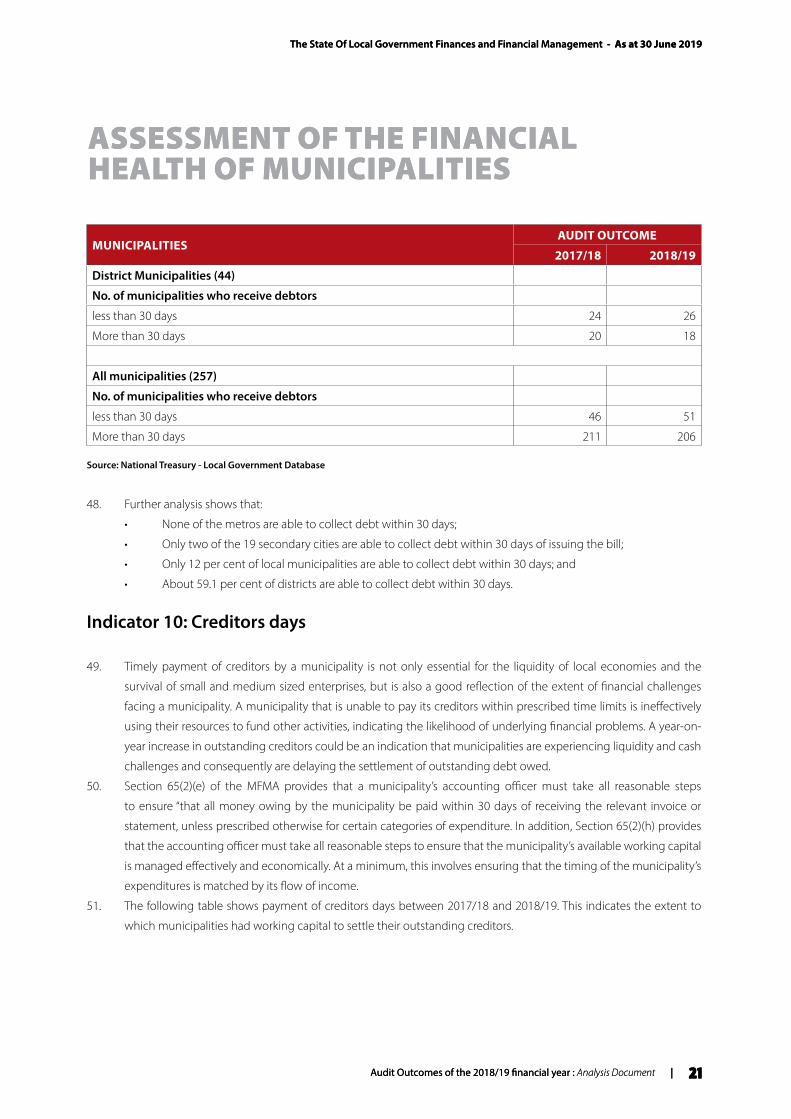
CFO Chief Financial Officer
CIDMSCity Infrastructure Development Management System
CIGFAROChartered Institute of Government, Financial and Risk Officers
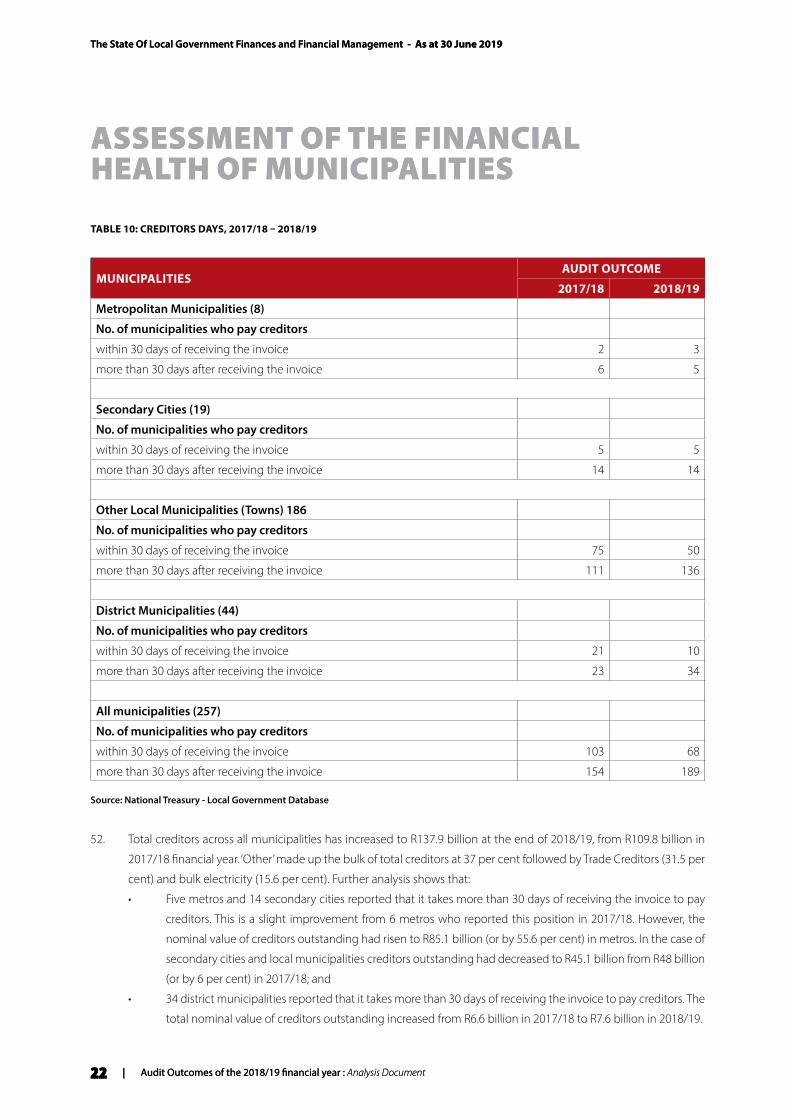
CSIP City Support Implementation Plan
CSP Cities Support Programme
DCoG Department of Cooperative Governance
DoRA Division of Revenue Act
EC Eastern Cape
EU European Union
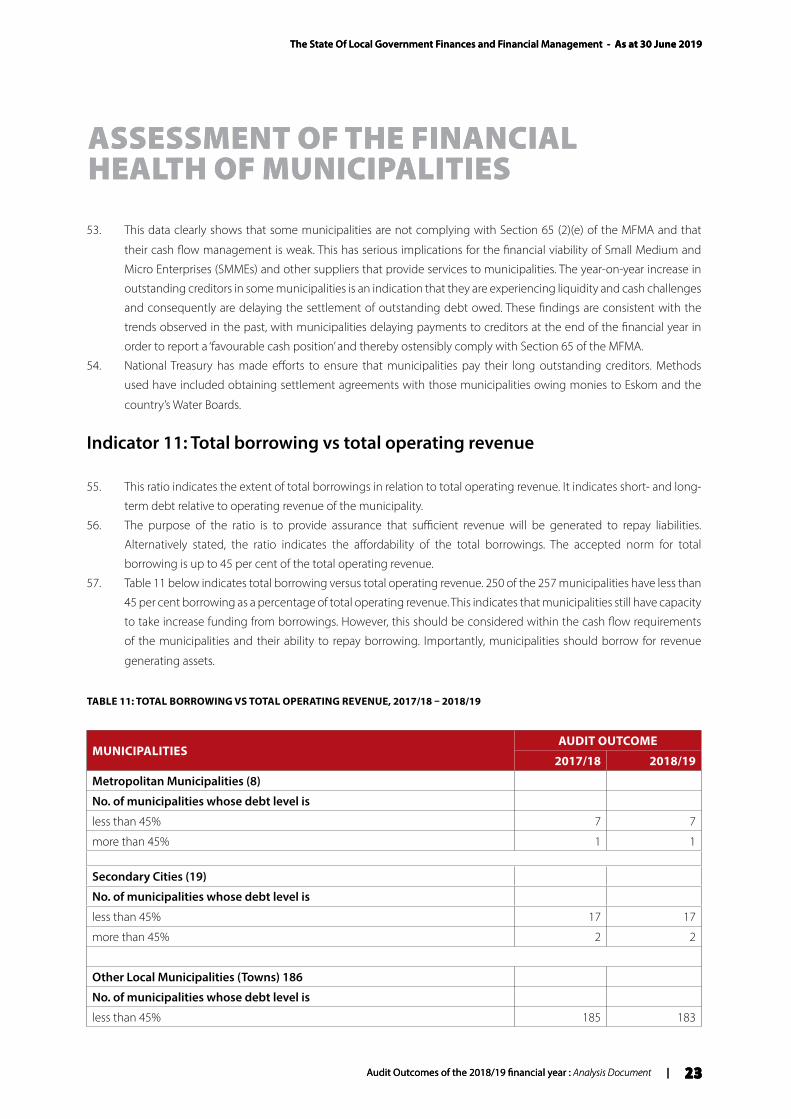
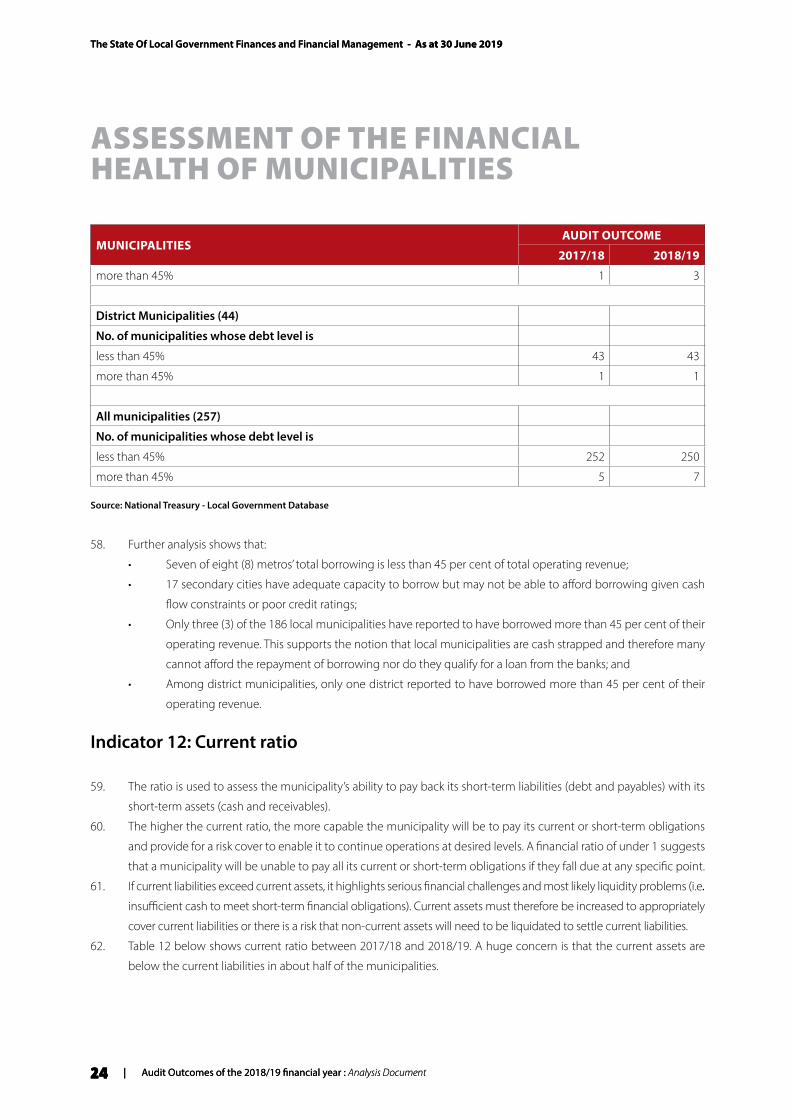
FAQ Frequently asked questions
FM Financial management
FMCMMFinancial Management Capability Maturity Model
FMG Financial Management Grant
FMIPFinancial Management Improvement Programme
FS Free State
GT Gauteng
IDP Integrated Development Plan
IT Information technology
KZN KwaZulu-Natal
LGSETALocal Government Sector and Education Training Authority
LP Limpopo
Metro Metropolitan municipality
MFIPMunicipal Finance Improvement Programme
MFMA Municipal Finance Management Act
MIG Municipal Infrastructure Grant
MinMECMinisters and Members of Executive Councils
MM Municipal Manager
MP Mpumalanga
MSA Municipal Structures Act
mSCOA Municipal Standard Chart of Accounts
MTREFMedium Term Revenue and Expenditure Framework
NC Northern Cape
NW North West
RIPOARapid Integrated Project Options Assessment
SALGASouth African Local Government Association
SAQA South African Qualifications Authority
SARS South African Revenue Service
SCM Supply Chain Management
SoLGF State of Local Government Finances
SOP Standard operating procedure
TCF Technical Committee on Finance
WC Western Cape
ABBREVIATIONS
The State Of Local Government Finances and Financial Management - As at 30 June 2019
Audit Outcomes of the 2018/19 financial year : Analysis Document | 1
The State Of Local Government Finances and Financial Management - As at 30 June 2019
Audit Outcomes of the 2018/19 financial year : Analysis Document | 1
EXECUTIVE SUMMARY
The State of Local Government Finances and Financial Management Report reviews the financial health of all 257 of the
country’s municipalities. The information used in this report is based on the audited Annual Financial Statement information
for the 2018/19 financial year. The National Treasury publishes this report annually in accordance with Section 5 of the
Municipal Finance Management Act, as part of its oversight responsibility with regard to municipal financial management.
It is concerning that approximately 63.4 per cent or 163 municipalities are categorised as being in varying degrees of
financial distress based on the 2018/19 financial results1. This report concludes that a significant number of municipalities
continue to perform poorly and thus remain a cause for concern. This confirms the negative impression that has been
developing with regard to the performance of the municipal system as a whole. At an aggregate level:
• A few municipalities still closed the year with negative cash and cash equivalents balances: Only four (4)
municipalities reported negative cash balances in 2018/19 representing a reduction from eight (8) municipalities
in 2017/18. Negative cash balances are likely to indicate the existence of severe cash flow problems within a
municipality. Audit outcomes of these municipalities are usually qualified, disclaimers or outstanding, which
indicates that in addition to financial challenges, leadership challenges also exist.
• Municipalities continue to have insufficient cash coverage to fund their operations: A total of 132 non-
metropolitan municipalities and two (2) metropolitan municipalities reported cash coverage data, which failed to
meet prudent standards in 2018/19. Only 41 local municipalities and 17 district municipalities had cash coverage of
more than three months of operational expenditure. This indicates that municipalities that are below the ratio of 1-3
months are vulnerable and at a higher risk in the event of financial shocks and their ability to meet their obligations
to provide basic services or their financial commitments are compromised.
• Unfunded operations decreased insignificantly: The total number of municipalities whose operations were not
funded decreased from 140 in 2017/18 to 139 in 2018/19. These municipalities include two (2) metros, 14 secondary
cities, 100 local municipalities and 23 district municipalities. This demonstrates the negative effects of adopting an
unfunded budget by Council, which does not reflect the financial and economic realities facing the municipality as
well as the lack of fiscal discipline in the implementation of the budget during the financial year.
• Municipalities are consistently and grossly underspending on repairs and maintenance of infrastructure:
The 2018/19 audit outcomes reveal that only six (6) out of 257 municipalities have spent adequately on repairs
and maintenance as a percentage of property, plant and equipment (PPE). This explains the generally poor state of
infrastructure that municipalities are battling with.
• Municipalities are spending less than 40 per cent of their capital budget on the renewal of municipal assets
as a percentage of total capital expenditure: The National Treasury recommends that municipalities should not
budget less than 40 per cent of their capital budget on renewal of assets. The 2018/19 audit outcomes reveal that
229 of the 257 municipalities have spent less than 40 per cent of their capital budget on the renewal of infrastructure.
Municipalities tend to focus on new infrastructure rather than on renewal and upgrading of existing infrastructure
(as most new infrastructure is grant funded).
• Under-provision for depreciation remains a challenge: Depreciation allows for existing assets to be written off
during their useful lives. Municipalities should make provision for the replacement of their assets in future. However,
1 Based on 13 indicators namely cash balances, cash plus investments less applications, cash coverage, repairs and maintenance expenditure level, asset rehabilitation expenditure level, asset depreciation level, total capital expenditure as a percentage of total expenditure, liquidity ratio, debtors days, creditor days, total borrowing as a percentage of total operating revenue, current ratio, and solvency ratio.
The State Of Local Government Finances and Financial Management - As at 30 June 2019
2 | Audit Outcomes of the 2018/19 financial year : Analysis Document
EXECUTIVE SUMMARY
The State Of Local Government Finances and Financial Management - As at 30 June 2019
2 | Audit Outcomes of the 2018/19 financial year : Analysis Document
only 14 municipalities provided adequately for the depreciation of assets.
• Less municipalities are spending on capital expenditure as a percentage of total expenditure: 92
municipalities have provided less than 10 per cent of their total expenditure on capital expenditure in 2018/19. This
is an increase of 21 per cent compared to the 2017/18 financial year. It is evident that as municipalities experience
financial difficulties, capital budgets are usually reduced in response.
• Most municipalities do not have sufficient cash and investments to pay for current obligations (liquidity
ratio). Six (6) metros and 16 secondary cities reported that their cash and investments are insufficient to settle
current liabilities. About 73.7 per cent of all local municipalities do not have adequate cash and investments to settle
current liabilities. About 61.4 per cent of districts were also found to have inadequate cash and investment to settle
current liabilities.
• It takes longer than 30 days to collect debt from municipalities after issuing the bill: Only 39.5 per cent of
municipalities collect debt within 30 days. The remaining municipalities are unable to comply with this requirement.
• Outstanding Creditors continues to grow while it takes municipalities more than 30 days of receiving the
invoice to pay creditors: Total creditors across all municipalities has increased to R137.9 billion at the end of the
2018/19 financial year, from R109.8 billion in the 2017/18 financial year. Five metros and 14 secondary cities reported
that it takes more than 30 days of receiving the invoice to pay creditors. 34 District Municipalities reported that it
takes more than 30 days of receiving the invoice to pay creditors.
• Many municipalities are borrowing less given the cash flow challenges: 250 of the 257 municipalities have less
than 45 per cent borrowing as a percentage of total operating revenue.
• There are not enough current assets to pay short term liabilities in about half of the municipalities: Two of
the eight (8) metros have reported that their current assets are less than their current liabilities, which highlights
that there are huge financial challenges in these metros. About half of the local municipalities (93) have insufficient
current assets to settle current obligations, an increase from 89 in 2017/18. 21 of the 44 districts also do not have
enough cash and debtors to settle current obligations.
• In terms of the total liabilities as a percentage of its total assets, only nine (9) or 3.5 per cent of the municipalities
do not have sufficient assets to pay their total liabilities.
• Asset management spending remains inadequate: National aggregate spending on repairs and maintenance
as a percentage of property, plant and equipment averages 2.5 per cent in the period 2016/17 to 2018/19. The
aggregate proportion of capital expenditure on asset renewal decreased from a high of 43.5 per cent in 2016/17
to 32.9 per cent in 2018/19. Significant under investment in asset management continues to be evident. The pace
of asset depreciation continues to outstrip investment in asset renewal by a significant margin, with renewal
investments accounting for only 42.7 per cent of depreciation values in 2018/19.
• Recorded water and electricity losses remain high: On 30 June 2019, metropolitan municipalities recorded water
(average loss of 32.8 per cent) and electricity (average loss of 14.8 per cent) losses amounting to R5.2 billion and R7.3
billion respectively. During the 2018/19 financial year, water losses increased significantly, by R900 million. Electricity
losses increased by R600 million, from R6.9 billion in 2017/18 to R7.5 billion in 2018/19.
• Municipal audit outcomes continue to decline: In the 2018/19 financial year, only 20 municipalities obtained
unqualified opinions without findings. This was a 11 per cent increase compared to 18 municipalities in 2017/18.
The number of unqualified audit opinions with findings decreased from 101 municipalities in 2017/18 to 91
municipalities in 2018/19. According to the Auditor General, the closing amounts for irregular expenditure increased
The State Of Local Government Finances and Financial Management - As at 30 June 2019
Audit Outcomes of the 2018/19 financial year : Analysis Document | 3
EXECUTIVE SUMMARY
The State Of Local Government Finances and Financial Management - As at 30 June 2019
Audit Outcomes of the 2018/19 financial year : Analysis Document | 3
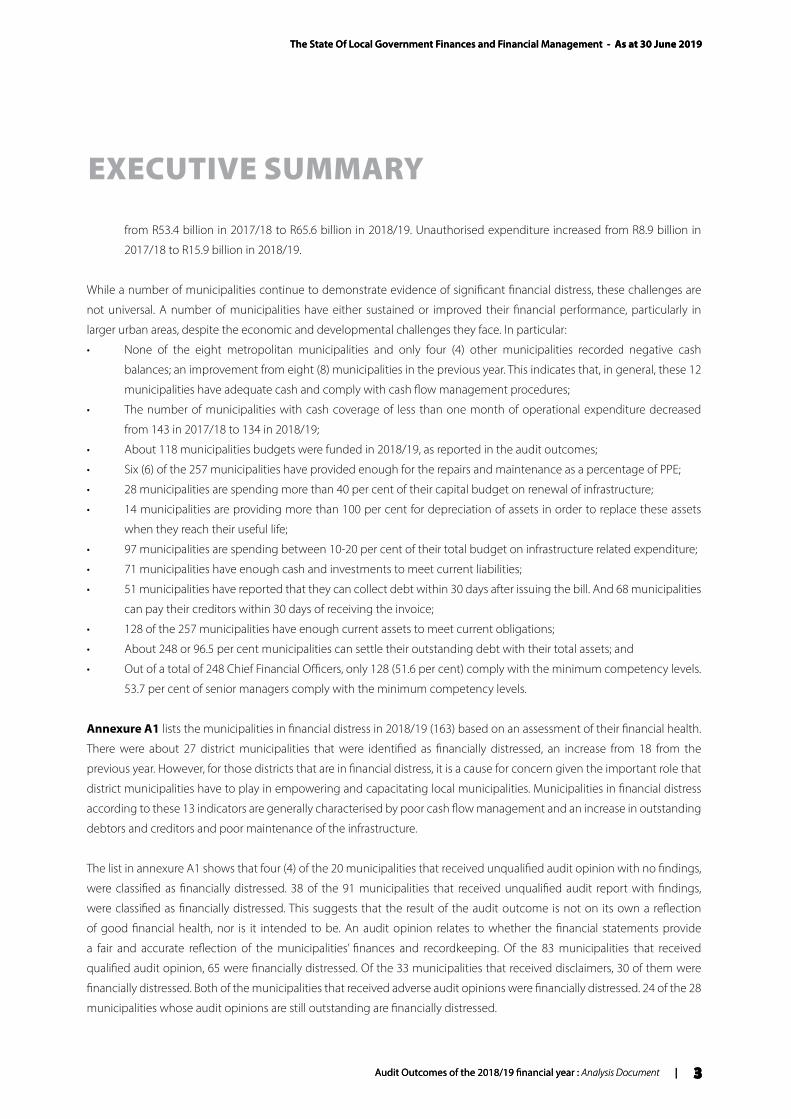
from R53.4 billion in 2017/18 to R65.6 billion in 2018/19. Unauthorised expenditure increased from R8.9 billion in
2017/18 to R15.9 billion in 2018/19.
While a number of municipalities continue to demonstrate evidence of significant financial distress, these challenges are
not universal. A number of municipalities have either sustained or improved their financial performance, particularly in
larger urban areas, despite the economic and developmental challenges they face. In particular:
• None of the eight metropolitan municipalities and only four (4) other municipalities recorded negative cash
balances; an improvement from eight (8) municipalities in the previous year. This indicates that, in general, these 12
municipalities have adequate cash and comply with cash flow management procedures;
• The number of municipalities with cash coverage of less than one month of operational expenditure decreased
from 143 in 2017/18 to 134 in 2018/19;
• About 118 municipalities budgets were funded in 2018/19, as reported in the audit outcomes;
• Six (6) of the 257 municipalities have provided enough for the repairs and maintenance as a percentage of PPE;
• 28 municipalities are spending more than 40 per cent of their capital budget on renewal of infrastructure;
• 14 municipalities are providing more than 100 per cent for depreciation of assets in order to replace these assets
when they reach their useful life;
• 97 municipalities are spending between 10-20 per cent of their total budget on infrastructure related expenditure;
• 71 municipalities have enough cash and investments to meet current liabilities;
• 51 municipalities have reported that they can collect debt within 30 days after issuing the bill. And 68 municipalities
can pay their creditors within 30 days of receiving the invoice;
• 128 of the 257 municipalities have enough current assets to meet current obligations;
• About 248 or 96.5 per cent municipalities can settle their outstanding debt with their total assets; and
• Out of a total of 248 Chief Financial Officers, only 128 (51.6 per cent) comply with the minimum competency levels.
53.7 per cent of senior managers comply with the minimum competency levels.
Annexure A1 lists the municipalities in financial distress in 2018/19 (163) based on an assessment of their financial health.
There were about 27 district municipalities that were identified as financially distressed, an increase from 18 from the
previous year. However, for those districts that are in financial distress, it is a cause for concern given the important role that
district municipalities have to play in empowering and capacitating local municipalities. Municipalities in financial distress
according to these 13 indicators are generally characterised by poor cash flow management and an increase in outstanding
debtors and creditors and poor maintenance of the infrastructure.
The list in annexure A1 shows that four (4) of the 20 municipalities that received unqualified audit opinion with no findings,
were classified as financially distressed. 38 of the 91 municipalities that received unqualified audit report with findings,
were classified as financially distressed. This suggests that the result of the audit outcome is not on its own a reflection
of good financial health, nor is it intended to be. An audit opinion relates to whether the financial statements provide
a fair and accurate reflection of the municipalities’ finances and recordkeeping. Of the 83 municipalities that received
qualified audit opinion, 65 were financially distressed. Of the 33 municipalities that received disclaimers, 30 of them were
financially distressed. Both of the municipalities that received adverse audit opinions were financially distressed. 24 of the 28
municipalities whose audit opinions are still outstanding are financially distressed.
The State Of Local Government Finances and Financial Management - As at 30 June 2019
4 | Audit Outcomes of the 2018/19 financial year : Analysis Document
The State Of Local Government Finances and Financial Management - As at 30 June 2019
4 | Audit Outcomes of the 2018/19 financial year : Analysis Document
INTRODUCTION
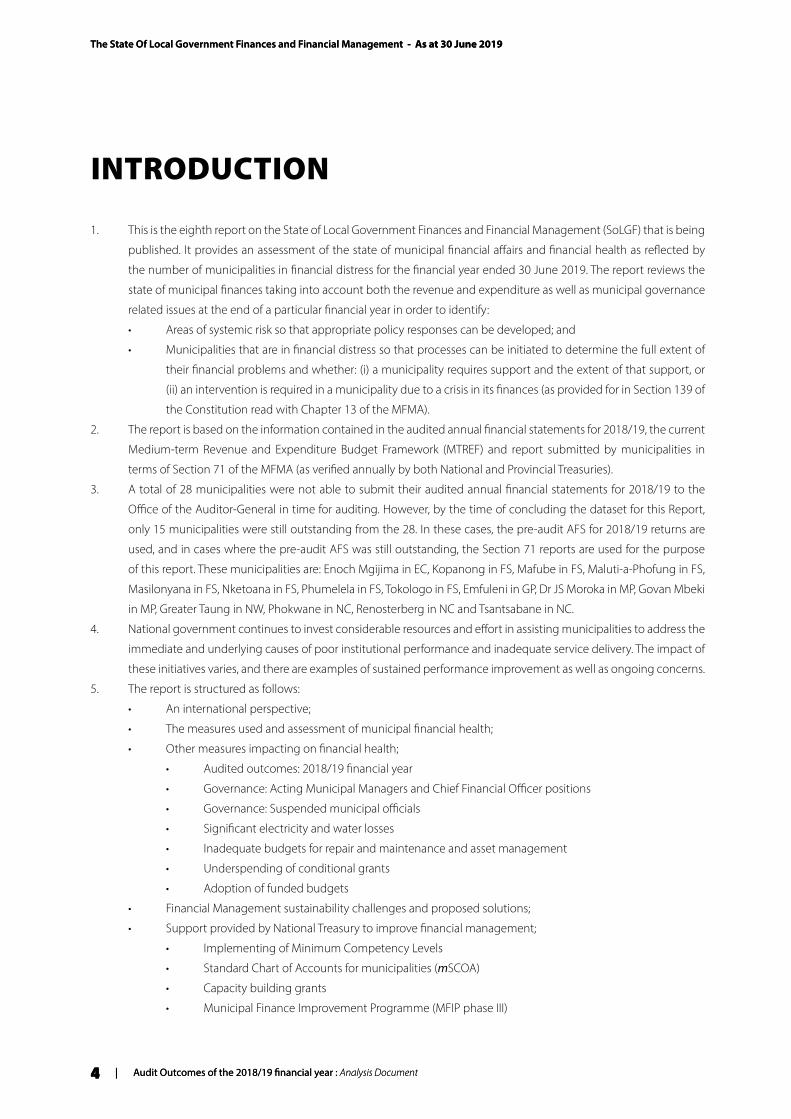
1. This is the eighth report on the State of Local Government Finances and Financial Management (SoLGF) that is being
published. It provides an assessment of the state of municipal financial affairs and financial health as reflected by
the number of municipalities in financial distress for the financial year ended 30 June 2019. The report reviews the
state of municipal finances taking into account both the revenue and expenditure as well as municipal governance
related issues at the end of a particular financial year in order to identify:
• Areas of systemic risk so that appropriate policy responses can be developed; and
• Municipalities that are in financial distress so that processes can be initiated to determine the full extent of
their financial problems and whether: (i) a municipality requires support and the extent of that support, or
(ii) an intervention is required in a municipality due to a crisis in its finances (as provided for in Section 139 of
the Constitution read with Chapter 13 of the MFMA).
2. The report is based on the information contained in the audited annual financial statements for 2018/19, the current
Medium-term Revenue and Expenditure Budget Framework (MTREF) and report submitted by municipalities in
terms of Section 71 of the MFMA (as verified annually by both National and Provincial Treasuries).
3. A total of 28 municipalities were not able to submit their audited annual financial statements for 2018/19 to the
Office of the Auditor-General in time for auditing. However, by the time of concluding the dataset for this Report,
only 15 municipalities were still outstanding from the 28. In these cases, the pre-audit AFS for 2018/19 returns are
used, and in cases where the pre-audit AFS was still outstanding, the Section 71 reports are used for the purpose
of this report. These municipalities are: Enoch Mgijima in EC, Kopanong in FS, Mafube in FS, Maluti-a-Phofung in FS,
Masilonyana in FS, Nketoana in FS, Phumelela in FS, Tokologo in FS, Emfuleni in GP, Dr JS Moroka in MP, Govan Mbeki
in MP, Greater Taung in NW, Phokwane in NC, Renosterberg in NC and Tsantsabane in NC.
4. National government continues to invest considerable resources and effort in assisting municipalities to address the
immediate and underlying causes of poor institutional performance and inadequate service delivery. The impact of
these initiatives varies, and there are examples of sustained performance improvement as well as ongoing concerns.
5. The report is structured as follows:
• An international perspective;
• The measures used and assessment of municipal financial health;
• Other measures impacting on financial health;
• Audited outcomes: 2018/19 financial year
• Governance: Acting Municipal Managers and Chief Financial Officer positions
• Governance: Suspended municipal officials
• Significant electricity and water losses
• Inadequate budgets for repair and maintenance and asset management
• Underspending of conditional grants
• Adoption of funded budgets
• Financial Management sustainability challenges and proposed solutions;
• Support provided by National Treasury to improve financial management;
• Implementing of Minimum Competency Levels
• Standard Chart of Accounts for municipalities (mSCOA)
• Capacity building grants
• Municipal Finance Improvement Programme (MFIP phase III)
The State Of Local Government Finances and Financial Management - As at 30 June 2019
Audit Outcomes of the 2018/19 financial year : Analysis Document | 5
INTRODUCTION
The State Of Local Government Finances and Financial Management - As at 30 June 2019
Audit Outcomes of the 2018/19 financial year : Analysis Document | 5
• Cities Support Programme (CSP)
• Interventions in municipalities facing financial distress;
• Concluding remarks; and
• Annexures providing detailed information and assessment results for municipalities in financial distress
(Annexure A1).
6. As was the case with previous reports, the summarised version of this review will be presented to the Technical
Committee on Finance (TCF), the Budget Forum and the Budget Council in different formats and parts. The full
report will also be circulated to the Presidency, the Department of Cooperative Governance (DCoG), and Provincial
Treasuries.
The State Of Local Government Finances and Financial Management - As at 30 June 2019
6 | Audit Outcomes of the 2018/19 financial year : Analysis Document
The State Of Local Government Finances and Financial Management - As at 30 June 2019
6 | Audit Outcomes of the 2018/19 financial year : Analysis Document
A BROADER PERSPECTIVE ON LOCAL GOVERNMENT PERFORMANCE IN SOUTH AFRICA
THE FISCAL FRAMEWORK FOR LOCAL GOVERNMENT IN SOUTH AFRICA
7. South Africa has an internationally well-regarded fiscal framework for local governance. The fiscal framework is
built on a clear set of functional (expenditure) assignments for basic local infrastructure services delivery such as
water services, electricity distribution, solid waste, and local roads and transport in addition to important regulatory
authority over spatial planning and development control.
8. These functions are financed predominantly through locally controlled revenue sources, such as user fees and
property tax. This is supplemented by a Constitutionally guaranteed, unconditional equitable share of nationally
raised revenues and various conditional transfers to support national development priorities, such as infrastructure
investment and the provision of basic service that benefits poor households. Municipalities also have powers to
borrow money for infrastructure investment without national government approval or guarantees.
9. The distribution of national revenues to local government (the division of revenue) is designed to achieve a
substantial redistribution of revenues raised through national taxes in relatively wealthy (mainly urban) areas to
those areas where the demand for subsidised public services are the highest and own revenue raising potential is
limited. As a result, the most rural municipalities receive around twice the allocation per household that metros do.
10. Notwithstanding its relative efficacy, the local government fiscal framework faces a number of pressures:
• Public housing and transport functions continue to be exercised concurrently between provincial and
local governments, and also with national government in the case of commuter rail services. This weakens
coordination in the management of the built environment, ultimately weakening both accountability for
performance and municipal fiscal sustainability, particularly in larger urban areas; and
• The rapid growth in national transfers during the period between 2007 to 2010 may have had an unintended
consequence of reducing local revenue efforts, accountability at a local level, and incentives for creditworthy
municipalities to borrow to finance long term capital investment programmes. The equitable share, grants
and subsidies allocated to municipalities has increased in the period 2000/01 to 2018/19 from R14.2 billion
to R118.5 billion. The future growth in national transfers is now being constrained as part of the national
programme of fiscal consolidation.
The State Of Local Government Finances and Financial Management - As at 30 June 2019
Audit Outcomes of the 2018/19 financial year : Analysis Document | 7
The State Of Local Government Finances and Financial Management - As at 30 June 2019
Audit Outcomes of the 2018/19 financial year : Analysis Document | 7
INTERNATIONAL BENCHMARKS OF NATIONAL GOVERNMENT FINANCE IN SOUTH AFRICA
11. South Africa performs relatively well against other developing countries in terms of public financial management.
This was confirmed by the findings in 2018 by the Mo Ibrahim Index of African Governance (IIAG) which ranked
South Africa 4th of the 54 countries in Africa. The IIAG is a tool that measures and monitors governance performance
in African countries. The report is released every two years.
12. The World Economic Forum’s Global Competitiveness Report 2019 ranked South Africa 60 out of 141 countries
a climb from 7 places from its previous report. According to the report South Africa is the sub-Saharan regional
financial hub with also advanced transport infrastructure in the region. Security performs poorly, while transparency
and government adaptability to change are below par.
13. National Treasury is committed to assisting communities and businesses to have a better understanding of the
financial position and performance of their municipalities. To assist with the processes of democratic oversight
the National Treasury launched the Municipal Money website (www.municipalmoney.gov.za) in 2016. This portal
provides up to date and comparative information on all municipalities. This has now been complemented by a new
“Vulekamali” portal (www.vulekamali.gov.za), launched on 20 February 2018, that includes data on national and
provincial budgets.
14. South Africa has once again come joint first with New Zealand in the 2019 Open Budget Index (OBI) conducted
by the International Budget Partnership (IBP) through an Open Budget Survey. The win is in recognition of the
country’s commitment to a transparent budget process. This is a repeat of the result from the 2017 OBI.
The State Of Local Government Finances and Financial Management - As at 30 June 2019
8 | Audit Outcomes of the 2018/19 financial year : Analysis Document
The State Of Local Government Finances and Financial Management - As at 30 June 2019
8 | Audit Outcomes of the 2018/19 financial year : Analysis Document
ASSESSMENT OF THE FINANCIAL HEALTH OF MUNICIPALITIES
MEASURES OF MUNICIPAL FINANCIAL HEALTH
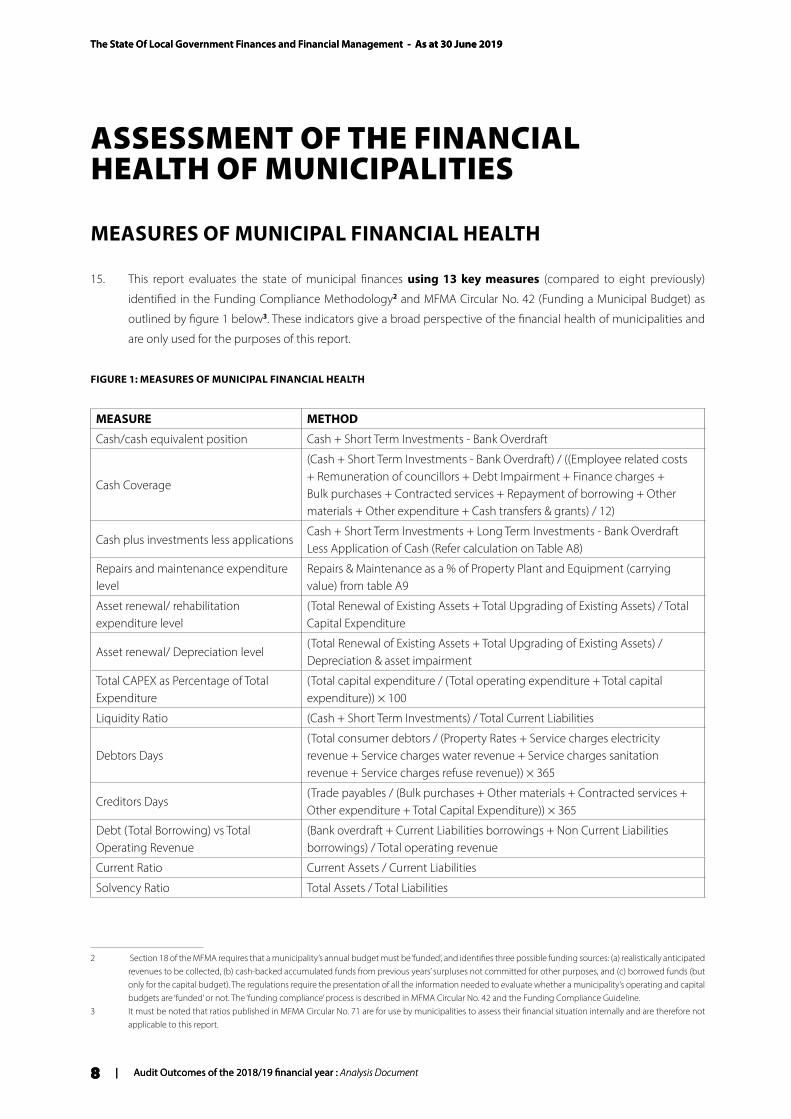
15. This report evaluates the state of municipal finances using 13 key measures (compared to eight previously)
identified in the Funding Compliance Methodology2 and MFMA Circular No. 42 (Funding a Municipal Budget) as
outlined by figure 1 below3. These indicators give a broad perspective of the financial health of municipalities and
are only used for the purposes of this report.
FIGURE 1: MEASURES OF MUNICIPAL FINANCIAL HEALTH
MEASURE METHOD
Cash/cash equivalent position Cash + Short Term Investments - Bank Overdraft
Cash Coverage
(Cash + Short Term Investments - Bank Overdraft) / ((Employee related costs + Remuneration of councillors + Debt Impairment + Finance charges + Bulk purchases + Contracted services + Repayment of borrowing + Other materials + Other expenditure + Cash transfers & grants) / 12)
Cash plus investments less applicationsCash + Short Term Investments + Long Term Investments - Bank Overdraft Less Application of Cash (Refer calculation on Table A8)
Repairs and maintenance expenditure level
Repairs & Maintenance as a % of Property Plant and Equipment (carrying value) from table A9
Asset renewal/ rehabilitation expenditure level
(Total Renewal of Existing Assets + Total Upgrading of Existing Assets) / Total Capital Expenditure
Asset renewal/ Depreciation level(Total Renewal of Existing Assets + Total Upgrading of Existing Assets) / Depreciation & asset impairment
Total CAPEX as Percentage of Total Expenditure
(Total capital expenditure / (Total operating expenditure + Total capital expenditure)) × 100
Liquidity Ratio (Cash + Short Term Investments) / Total Current Liabilities
Debtors Days(Total consumer debtors / (Property Rates + Service charges electricity revenue + Service charges water revenue + Service charges sanitation revenue + Service charges refuse revenue)) × 365
Creditors Days(Trade payables / (Bulk purchases + Other materials + Contracted services + Other expenditure + Total Capital Expenditure)) × 365
Debt (Total Borrowing) vs Total Operating Revenue
(Bank overdraft + Current Liabilities borrowings + Non Current Liabilities borrowings) / Total operating revenue
Current Ratio Current Assets / Current Liabilities
Solvency Ratio Total Assets / Total Liabilities
2 Section 18 of the MFMA requires that a municipality’s annual budget must be ‘funded’, and identifies three possible funding sources: (a) realistically anticipated revenues to be collected, (b) cash-backed accumulated funds from previous years’ surpluses not committed for other purposes, and (c) borrowed funds (but only for the capital budget). The regulations require the presentation of all the information needed to evaluate whether a municipality’s operating and capital budgets are ‘funded’ or not. The ‘funding compliance’ process is described in MFMA Circular No. 42 and the Funding Compliance Guideline.
3 It must be noted that ratios published in MFMA Circular No. 71 are for use by municipalities to assess their financial situation internally and are therefore not applicable to this report.
The State Of Local Government Finances and Financial Management - As at 30 June 2019
Audit Outcomes of the 2018/19 financial year : Analysis Document | 9
ASSESSMENT OF THE FINANCIAL HEALTH OF MUNICIPALITIES
The State Of Local Government Finances and Financial Management - As at 30 June 2019
Audit Outcomes of the 2018/19 financial year : Analysis Document | 9
ASSESSMENT OF THE FINANCIAL HEALTH OF MUNICIPALITIES
INDICATORS (CASH AND CASH EQUIVALENTS AND CASH COVERAGE) ASSESSING THE VULNERABILITY OF MUNICIPALITIES’ CASH POSITION
16. Section 45 of the MFMA prohibits municipalities from closing their financial year with any short-term borrowing or
overdraft. At a minimum, a municipality should maintain a positive cash position. A failure to do this is the first indicator
of financial distress. Three sub-indicators are used to provide a more holistic view of municipalities’ cash position:
• Did the municipality end the financial year with a positive or negative cash balance?
• Are negative cash balances persistent - is the negative cash balance temporary or does it indicate deeper-
rooted financial problems in the municipality?
• Even if a municipality has a positive cash balance, is the revenue base under threat? For how many months
will the municipality be able to continue funding its monthly operational expenditure? In other words, what
is the cash coverage ratio of the municipality?
17. In order to ensure compliance with the law, from 2011/12 the National Treasury has not considered any applications
for the roll-over of grant funds by municipalities who report negative cash balances.
Indicator 1: Negative cash balances
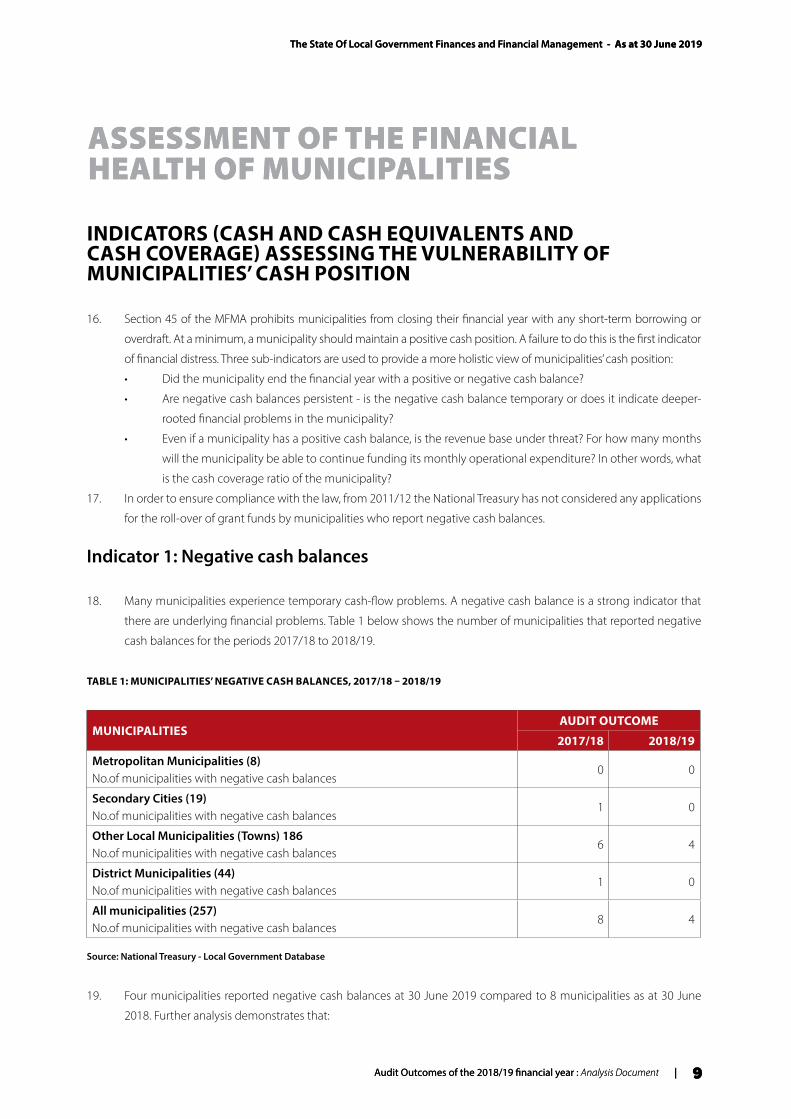
18. Many municipalities experience temporary cash-flow problems. A negative cash balance is a strong indicator that
there are underlying financial problems. Table 1 below shows the number of municipalities that reported negative
cash balances for the periods 2017/18 to 2018/19.
TABLE 1: MUNICIPALITIES’ NEGATIVE CASH BALANCES, 2017/18 – 2018/19
MUNICIPALITIESAUDIT OUTCOME
2017/18 2018/19
Metropolitan Municipalities (8)No.of municipalities with negative cash balances
0 0
Secondary Cities (19)No.of municipalities with negative cash balances
1 0
Other Local Municipalities (Towns) 186No.of municipalities with negative cash balances
6 4
District Municipalities (44)No.of municipalities with negative cash balances
1 0
All municipalities (257)No.of municipalities with negative cash balances
8 4
Source: National Treasury - Local Government Database
19. Four municipalities reported negative cash balances at 30 June 2019 compared to 8 municipalities as at 30 June
2018. Further analysis demonstrates that:
The State Of Local Government Finances and Financial Management - As at 30 June 2019
10 | Audit Outcomes of the 2018/19 financial year : Analysis Document
ASSESSMENT OF THE FINANCIAL HEALTH OF MUNICIPALITIES
The State Of Local Government Finances and Financial Management - As at 30 June 2019
10 | Audit Outcomes of the 2018/19 financial year : Analysis Document
ASSESSMENT OF THE FINANCIAL HEALTH OF MUNICIPALITIES
• No metropolitan municipality (metros) recorded a negative cash balance at the end of 2018/19. This is a
strong indication that, in general, the metros have adequate cash and comply with cash flow management
procedures;
• No secondary cities4 reported negative balance in 2018/19 financial year, while there was one secondary City
that reported negative cash balance in 2017/18;
• Four local municipalities (2.2 per cent of all local municipalities) reported negative cash balances in 2018/19,
down from six local municipalities (3.2 per cent) in 2017/18; and
• No district municipalities reported negative cash balances in 2018/19, while there was one district that had
reported a negative cash balance in 2017/18.
Indicator 2: Cash coverage position of municipalities
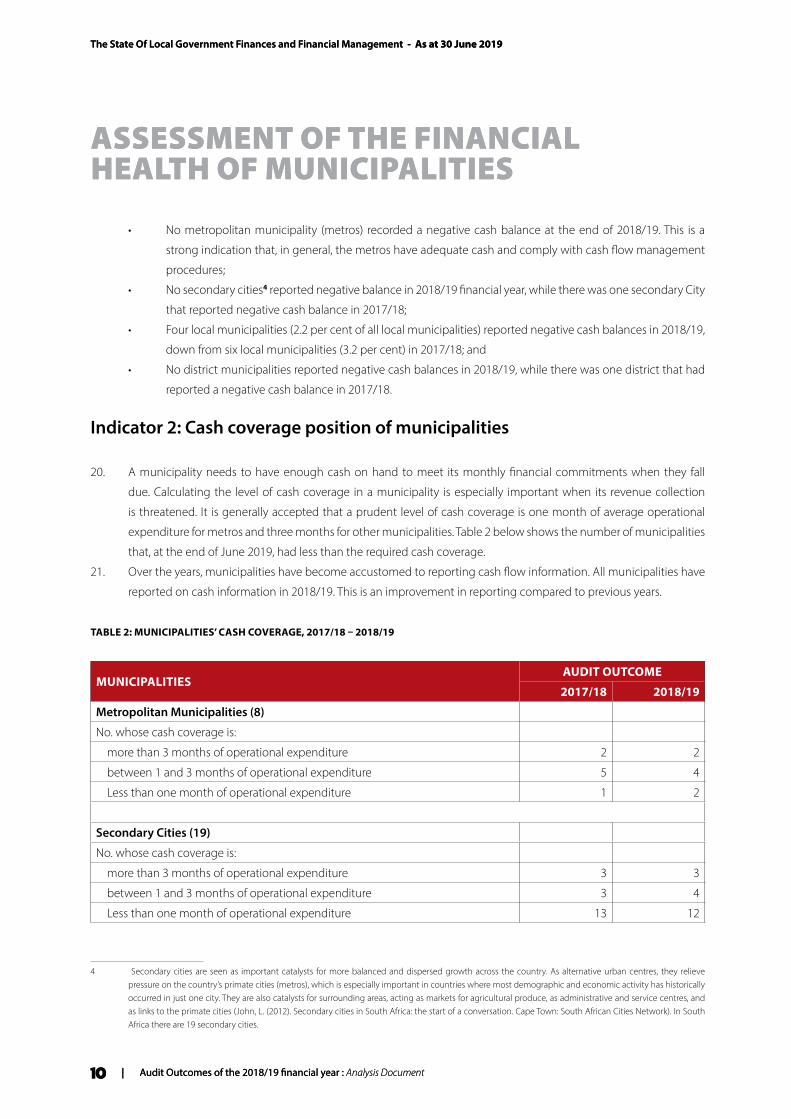
20. A municipality needs to have enough cash on hand to meet its monthly financial commitments when they fall
due. Calculating the level of cash coverage in a municipality is especially important when its revenue collection
is threatened. It is generally accepted that a prudent level of cash coverage is one month of average operational
expenditure for metros and three months for other municipalities. Table 2 below shows the number of municipalities
that, at the end of June 2019, had less than the required cash coverage.
21. Over the years, municipalities have become accustomed to reporting cash flow information. All municipalities have
reported on cash information in 2018/19. This is an improvement in reporting compared to previous years.
TABLE 2: MUNICIPALITIES’ CASH COVERAGE, 2017/18 – 2018/19
MUNICIPALITIESAUDIT OUTCOME
2017/18 2018/19
Metropolitan Municipalities (8)
No. whose cash coverage is:
more than 3 months of operational expenditure 2 2
between 1 and 3 months of operational expenditure 5 4
Less than one month of operational expenditure 1 2
Secondary Cities (19)
No. whose cash coverage is:
more than 3 months of operational expenditure 3 3
between 1 and 3 months of operational expenditure 3 4
Less than one month of operational expenditure 13 12
4 Secondary cities are seen as important catalysts for more balanced and dispersed growth across the country. As alternative urban centres, they relieve pressure on the country’s primate cities (metros), which is especially important in countries where most demographic and economic activity has historically occurred in just one city. They are also catalysts for surrounding areas, acting as markets for agricultural produce, as administrative and service centres, and as links to the primate cities (John, L. (2012). Secondary cities in South Africa: the start of a conversation. Cape Town: South African Cities Network). In South Africa there are 19 secondary cities.
The State Of Local Government Finances and Financial Management - As at 30 June 2019
Audit Outcomes of the 2018/19 financial year : Analysis Document | 11
ASSESSMENT OF THE FINANCIAL HEALTH OF MUNICIPALITIES
The State Of Local Government Finances and Financial Management - As at 30 June 2019
Audit Outcomes of the 2018/19 financial year : Analysis Document | 11
ASSESSMENT OF THE FINANCIAL HEALTH OF MUNICIPALITIES
MUNICIPALITIESAUDIT OUTCOME
2017/18 2018/19
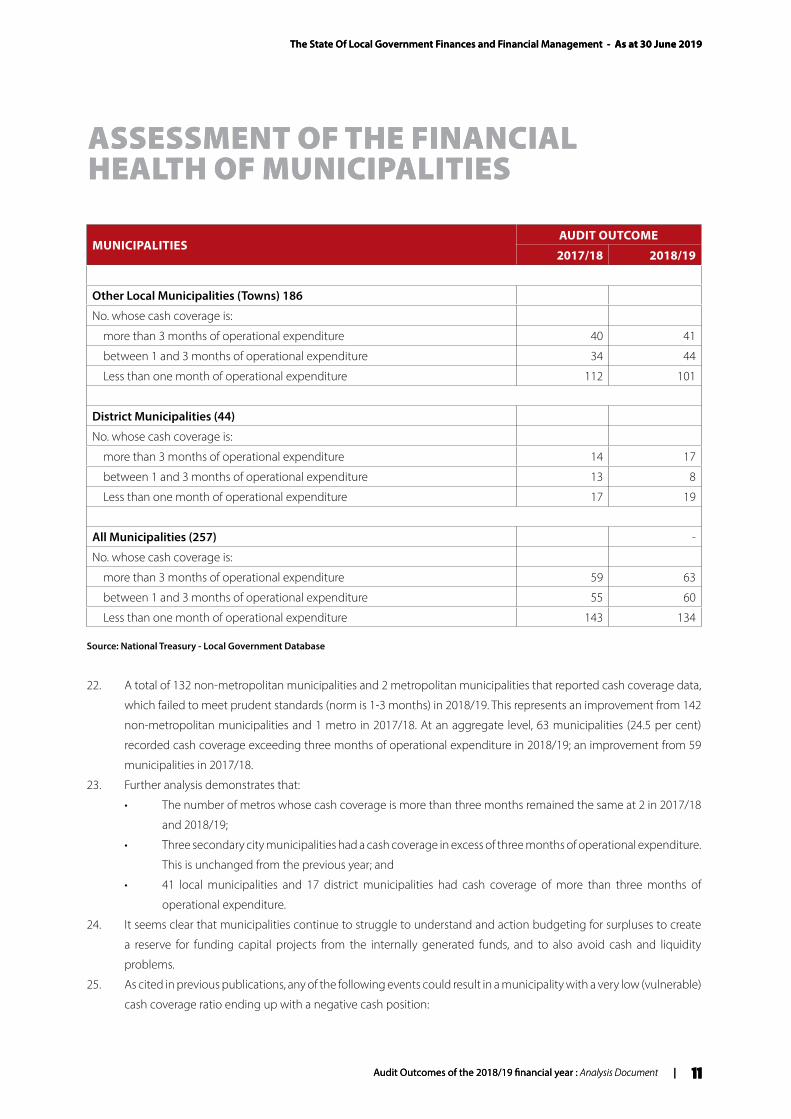
Other Local Municipalities (Towns) 186
No. whose cash coverage is:
more than 3 months of operational expenditure 40 41
between 1 and 3 months of operational expenditure 34 44
Less than one month of operational expenditure 112 101
District Municipalities (44)
No. whose cash coverage is:
more than 3 months of operational expenditure 14 17
between 1 and 3 months of operational expenditure 13 8
Less than one month of operational expenditure 17 19
All Municipalities (257) -
No. whose cash coverage is:
more than 3 months of operational expenditure 59 63
between 1 and 3 months of operational expenditure 55 60
Less than one month of operational expenditure 143 134
Source: National Treasury - Local Government Database
22. A total of 132 non-metropolitan municipalities and 2 metropolitan municipalities that reported cash coverage data,
which failed to meet prudent standards (norm is 1-3 months) in 2018/19. This represents an improvement from 142
non-metropolitan municipalities and 1 metro in 2017/18. At an aggregate level, 63 municipalities (24.5 per cent)
recorded cash coverage exceeding three months of operational expenditure in 2018/19; an improvement from 59
municipalities in 2017/18.
23. Further analysis demonstrates that:
• The number of metros whose cash coverage is more than three months remained the same at 2 in 2017/18
and 2018/19;
• Three secondary city municipalities had a cash coverage in excess of three months of operational expenditure.
This is unchanged from the previous year; and
• 41 local municipalities and 17 district municipalities had cash coverage of more than three months of
operational expenditure.
24. It seems clear that municipalities continue to struggle to understand and action budgeting for surpluses to create
a reserve for funding capital projects from the internally generated funds, and to also avoid cash and liquidity
problems.
25. As cited in previous publications, any of the following events could result in a municipality with a very low (vulnerable)
cash coverage ratio ending up with a negative cash position:
The State Of Local Government Finances and Financial Management - As at 30 June 2019
12 | Audit Outcomes of the 2018/19 financial year : Analysis Document
ASSESSMENT OF THE FINANCIAL HEALTH OF MUNICIPALITIES
The State Of Local Government Finances and Financial Management - As at 30 June 2019
12 | Audit Outcomes of the 2018/19 financial year : Analysis Document
ASSESSMENT OF THE FINANCIAL HEALTH OF MUNICIPALITIES
• A deterioration in revenue collection due to the impact of the economic slowdown and the increasing rates
and tariffs year-on-year which affect household budgets and affordability levels;
• Emergencies and natural disasters such as floods, drought and fire;
• The cash flow time difference between paying for the increased cost of bulk electricity/water and the
collection of revenues from customers;
• Any major breakdown in service delivery resulting in non-supply (especially of water and electricity) and
therefore loss of revenue;
• A rate-payers/consumers boycott;
• Illegal connection of electricity and water, including tempering of water and electricity meters;
• Ineffective cash flow management on a monthly basis; and
• Non-implementation of debt collection and credit control policies.
26. Sustained effort is required to address these weak cash positions. National and provincial treasuries will continue
to engage with municipalities on improving their cash flows during the mid-year performance and annual budget
benchmark engagements in January/February and April/May each year. These two annual strategic engagements
have been institutionalised by National Treasury to improve and strengthen the quality and oversight of municipal
performance.
Indicator 3: Cash plus investments less applications
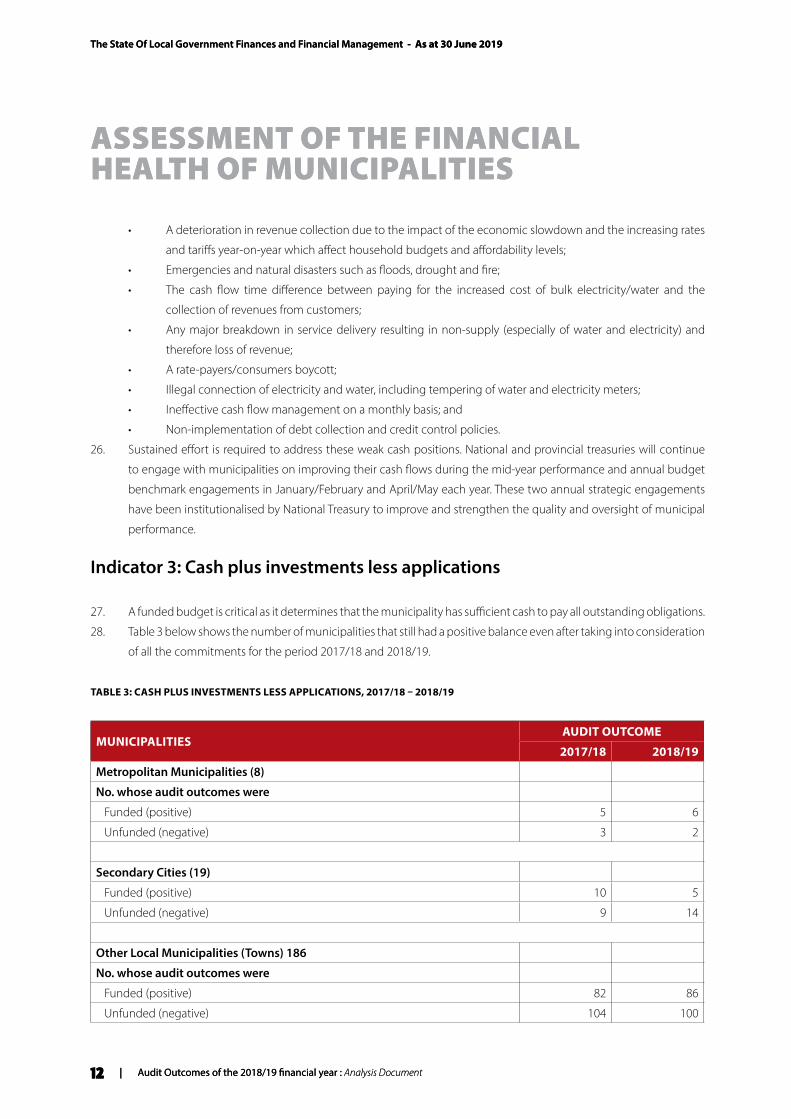
27. A funded budget is critical as it determines that the municipality has sufficient cash to pay all outstanding obligations.
28. Table 3 below shows the number of municipalities that still had a positive balance even after taking into consideration
of all the commitments for the period 2017/18 and 2018/19.
TABLE 3: CASH PLUS INVESTMENTS LESS APPLICATIONS, 2017/18 – 2018/19
MUNICIPALITIESAUDIT OUTCOME
2017/18 2018/19
Metropolitan Municipalities (8)
No. whose audit outcomes were
Funded (positive) 5 6
Unfunded (negative) 3 2
Secondary Cities (19)
Funded (positive) 10 5
Unfunded (negative) 9 14
Other Local Municipalities (Towns) 186
No. whose audit outcomes were
Funded (positive) 82 86
Unfunded (negative) 104 100
The State Of Local Government Finances and Financial Management - As at 30 June 2019
Audit Outcomes of the 2018/19 financial year : Analysis Document | 13
ASSESSMENT OF THE FINANCIAL HEALTH OF MUNICIPALITIES
The State Of Local Government Finances and Financial Management - As at 30 June 2019
Audit Outcomes of the 2018/19 financial year : Analysis Document | 13
ASSESSMENT OF THE FINANCIAL HEALTH OF MUNICIPALITIES
MUNICIPALITIESAUDIT OUTCOME
2017/18 2018/19
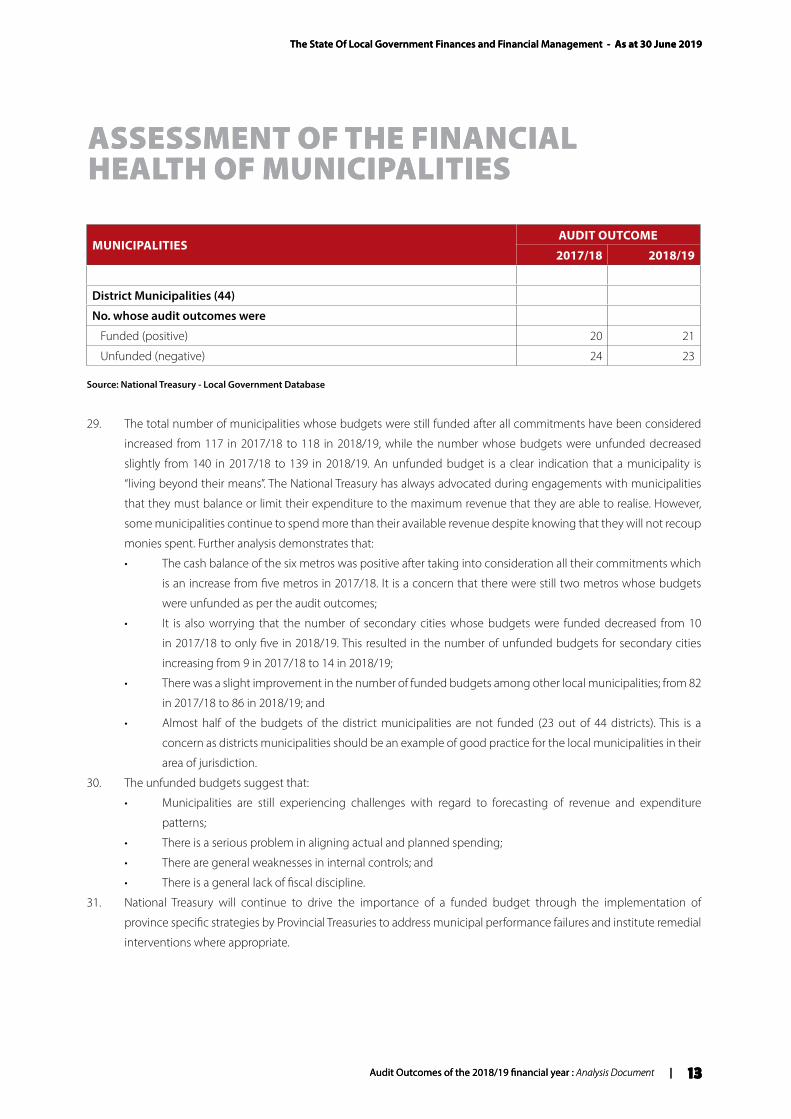
District Municipalities (44)
No. whose audit outcomes were
Funded (positive) 20 21
Unfunded (negative) 24 23
Source: National Treasury - Local Government Database
29. The total number of municipalities whose budgets were still funded after all commitments have been considered
increased from 117 in 2017/18 to 118 in 2018/19, while the number whose budgets were unfunded decreased
slightly from 140 in 2017/18 to 139 in 2018/19. An unfunded budget is a clear indication that a municipality is
“living beyond their means”. The National Treasury has always advocated during engagements with municipalities
that they must balance or limit their expenditure to the maximum revenue that they are able to realise. However,
some municipalities continue to spend more than their available revenue despite knowing that they will not recoup
monies spent. Further analysis demonstrates that:
• The cash balance of the six metros was positive after taking into consideration all their commitments which
is an increase from five metros in 2017/18. It is a concern that there were still two metros whose budgets
were unfunded as per the audit outcomes;
• It is also worrying that the number of secondary cities whose budgets were funded decreased from 10
in 2017/18 to only five in 2018/19. This resulted in the number of unfunded budgets for secondary cities
increasing from 9 in 2017/18 to 14 in 2018/19;
• There was a slight improvement in the number of funded budgets among other local municipalities; from 82
in 2017/18 to 86 in 2018/19; and
• Almost half of the budgets of the district municipalities are not funded (23 out of 44 districts). This is a
concern as districts municipalities should be an example of good practice for the local municipalities in their
area of jurisdiction.
30. The unfunded budgets suggest that:
• Municipalities are still experiencing challenges with regard to forecasting of revenue and expenditure
patterns;
• There is a serious problem in aligning actual and planned spending;
• There are general weaknesses in internal controls; and
• There is a general lack of fiscal discipline.
31. National Treasury will continue to drive the importance of a funded budget through the implementation of
province specific strategies by Provincial Treasuries to address municipal performance failures and institute remedial
interventions where appropriate.
The State Of Local Government Finances and Financial Management - As at 30 June 2019
14 | Audit Outcomes of the 2018/19 financial year : Analysis Document
ASSESSMENT OF THE FINANCIAL HEALTH OF MUNICIPALITIES
The State Of Local Government Finances and Financial Management - As at 30 June 2019
14 | Audit Outcomes of the 2018/19 financial year : Analysis Document
ASSESSMENT OF THE FINANCIAL HEALTH OF MUNICIPALITIES
Indicator 4: Repairs and maintenance as a percentage of property, plant and equipment
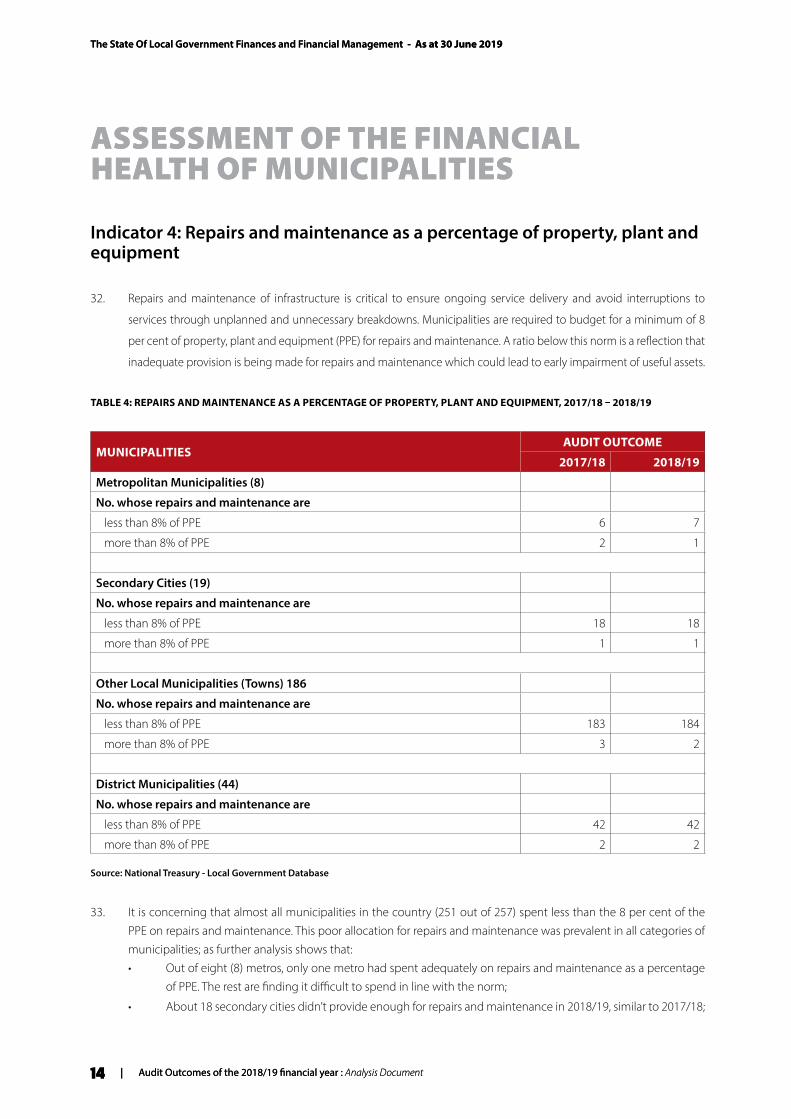
32. Repairs and maintenance of infrastructure is critical to ensure ongoing service delivery and avoid interruptions to
services through unplanned and unnecessary breakdowns. Municipalities are required to budget for a minimum of 8
per cent of property, plant and equipment (PPE) for repairs and maintenance. A ratio below this norm is a reflection that
inadequate provision is being made for repairs and maintenance which could lead to early impairment of useful assets.
TABLE 4: REPAIRS AND MAINTENANCE AS A PERCENTAGE OF PROPERTY, PLANT AND EQUIPMENT, 2017/18 – 2018/19
MUNICIPALITIESAUDIT OUTCOME
2017/18 2018/19
Metropolitan Municipalities (8)
No. whose repairs and maintenance are
less than 8% of PPE 6 7
more than 8% of PPE 2 1
Secondary Cities (19)
No. whose repairs and maintenance are
less than 8% of PPE 18 18
more than 8% of PPE 1 1
Other Local Municipalities (Towns) 186
No. whose repairs and maintenance are
less than 8% of PPE 183 184
more than 8% of PPE 3 2
District Municipalities (44)
No. whose repairs and maintenance are
less than 8% of PPE 42 42
more than 8% of PPE 2 2
Source: National Treasury - Local Government Database
33. It is concerning that almost all municipalities in the country (251 out of 257) spent less than the 8 per cent of the PPE on repairs and maintenance. This poor allocation for repairs and maintenance was prevalent in all categories of municipalities; as further analysis shows that:
• Out of eight (8) metros, only one metro had spent adequately on repairs and maintenance as a percentage of PPE. The rest are finding it difficult to spend in line with the norm;
• About 18 secondary cities didn’t provide enough for repairs and maintenance in 2018/19, similar to 2017/18;
The State Of Local Government Finances and Financial Management - As at 30 June 2019
Audit Outcomes of the 2018/19 financial year : Analysis Document | 15
ASSESSMENT OF THE FINANCIAL HEALTH OF MUNICIPALITIES
The State Of Local Government Finances and Financial Management - As at 30 June 2019
Audit Outcomes of the 2018/19 financial year : Analysis Document | 15
ASSESSMENT OF THE FINANCIAL HEALTH OF MUNICIPALITIES
• Out of a total of 186 local municipalities, only two (2) provided adequately for repairs and maintenance; and
• The same trend was observed amongst the district municipalities, where only two out of the 44 districts
provided adequately for repairs and maintenance as percentage of PPE.
34. It has been observed over the years that municipalities consistently under budget for maintenance, and often
sacrifice maintenance budgets in lieu of other municipal ‘priorities’. National Treasury has consistently cautioned
municipalities against this practice as it would in the long run severely affect revenue generating assets.
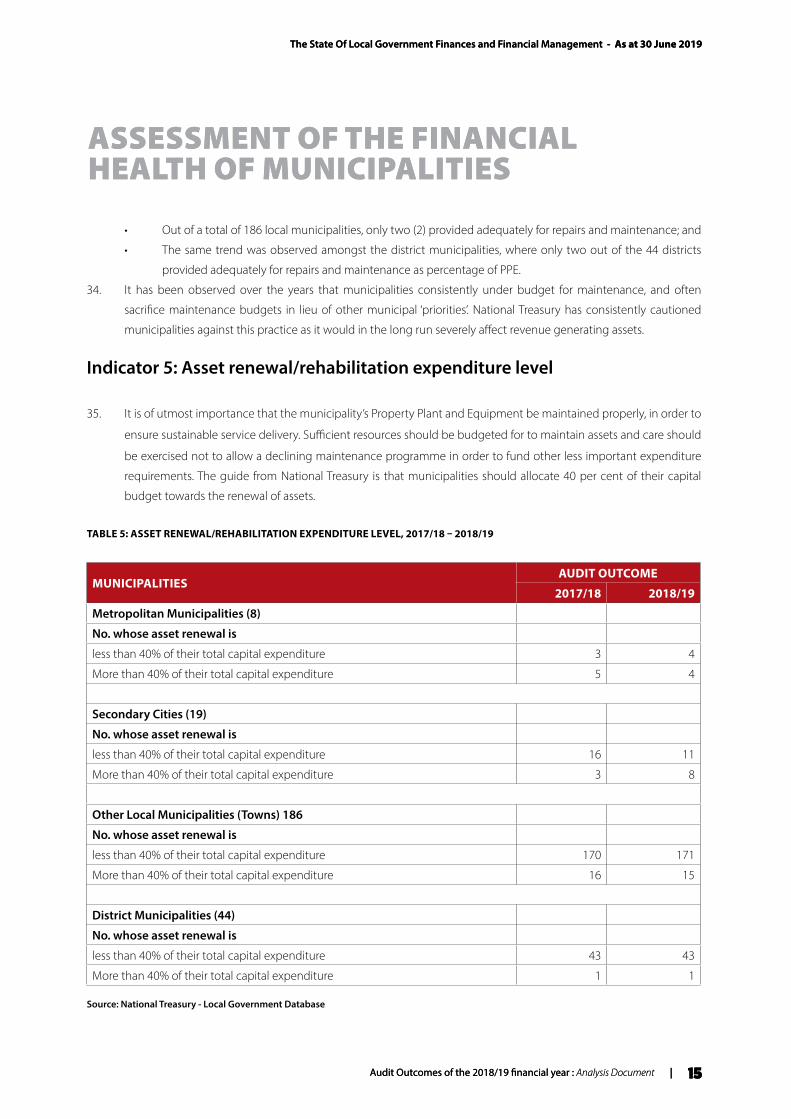
Indicator 5: Asset renewal/rehabilitation expenditure level
35. It is of utmost importance that the municipality’s Property Plant and Equipment be maintained properly, in order to
ensure sustainable service delivery. Sufficient resources should be budgeted for to maintain assets and care should
be exercised not to allow a declining maintenance programme in order to fund other less important expenditure
requirements. The guide from National Treasury is that municipalities should allocate 40 per cent of their capital
budget towards the renewal of assets.
TABLE 5: ASSET RENEWAL/REHABILITATION EXPENDITURE LEVEL, 2017/18 – 2018/19
MUNICIPALITIESAUDIT OUTCOME
2017/18 2018/19
Metropolitan Municipalities (8)
No. whose asset renewal is
less than 40% of their total capital expenditure 3 4
More than 40% of their total capital expenditure 5 4
Secondary Cities (19)
No. whose asset renewal is
less than 40% of their total capital expenditure 16 11
More than 40% of their total capital expenditure 3 8
Other Local Municipalities (Towns) 186
No. whose asset renewal is
less than 40% of their total capital expenditure 170 171
More than 40% of their total capital expenditure 16 15
District Municipalities (44)
No. whose asset renewal is
less than 40% of their total capital expenditure 43 43
More than 40% of their total capital expenditure 1 1
Source: National Treasury - Local Government Database
The State Of Local Government Finances and Financial Management - As at 30 June 2019
16 | Audit Outcomes of the 2018/19 financial year : Analysis Document
ASSESSMENT OF THE FINANCIAL HEALTH OF MUNICIPALITIES
The State Of Local Government Finances and Financial Management - As at 30 June 2019
16 | Audit Outcomes of the 2018/19 financial year : Analysis Document
ASSESSMENT OF THE FINANCIAL HEALTH OF MUNICIPALITIES
36. As shown in table 5 above, 229 out of 257 municipalities spent less than 40 per cent of their total capital expenditure
on the renewal of assets at the end of 2018/19. This confirms the notion that municipalities tend to focus on new
infrastructure investments rather than renewal of the existing infrastructure. Further analysis shows that municipalities
are not prioritising the renewal of the old infrastructure:
• Four (4) metros, up from three (3) in 2017/18, reported assets renewal of less than 40 per cent;
• 11 secondary cities, down from 16 in 2017/18, reported assets renewal of less than 40 per cent;
• 171 local municipalities, up from 170 in 2017/18, reported asset renewal of less than 40 per cent; and
• 43 district municipalities, the same as in 2017/18, with asset renewal less than 40 per cent. It should be noted
however that not all districts are water service authorities, therefore districts would not necessarily have to
spend their capital budget on renewal of assets except for those that are water service authorities.
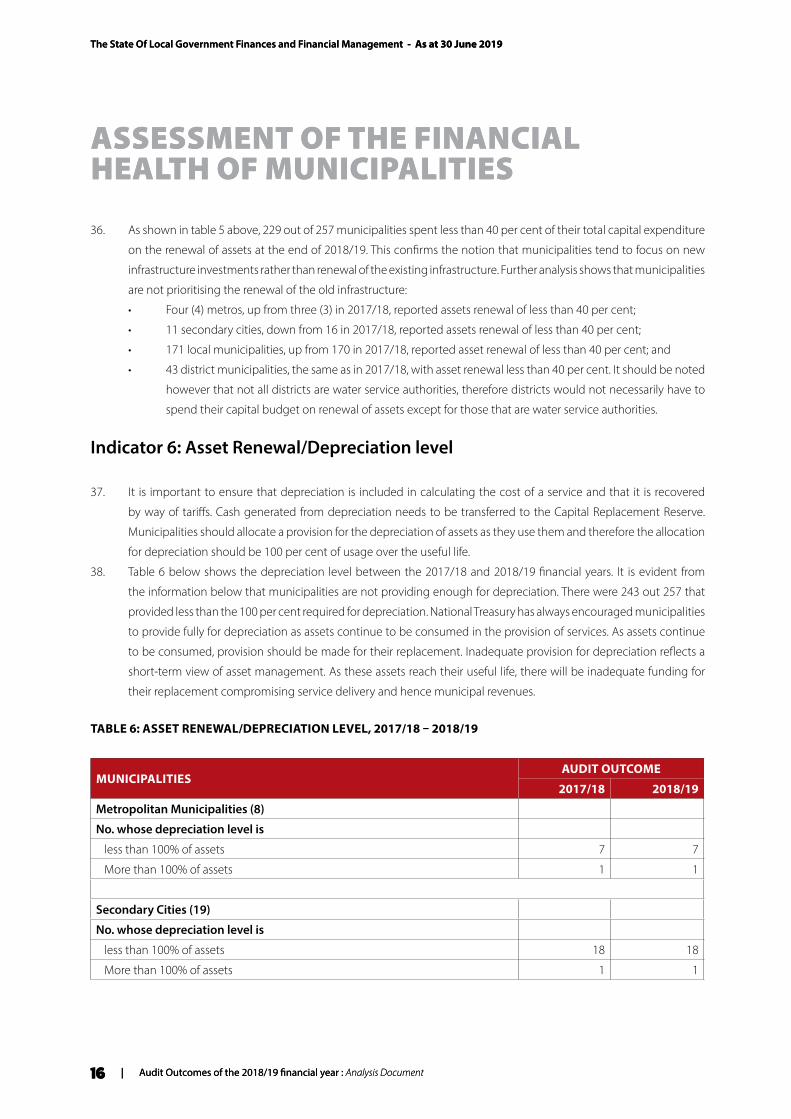
Indicator 6: Asset Renewal/Depreciation level
37. It is important to ensure that depreciation is included in calculating the cost of a service and that it is recovered
by way of tariffs. Cash generated from depreciation needs to be transferred to the Capital Replacement Reserve.
Municipalities should allocate a provision for the depreciation of assets as they use them and therefore the allocation
for depreciation should be 100 per cent of usage over the useful life.
38. Table 6 below shows the depreciation level between the 2017/18 and 2018/19 financial years. It is evident from
the information below that municipalities are not providing enough for depreciation. There were 243 out 257 that
provided less than the 100 per cent required for depreciation. National Treasury has always encouraged municipalities
to provide fully for depreciation as assets continue to be consumed in the provision of services. As assets continue
to be consumed, provision should be made for their replacement. Inadequate provision for depreciation reflects a
short-term view of asset management. As these assets reach their useful life, there will be inadequate funding for
their replacement compromising service delivery and hence municipal revenues.
TABLE 6: ASSET RENEWAL/DEPRECIATION LEVEL, 2017/18 – 2018/19
MUNICIPALITIESAUDIT OUTCOME
2017/18 2018/19
Metropolitan Municipalities (8)
No. whose depreciation level is
less than 100% of assets 7 7
More than 100% of assets 1 1
Secondary Cities (19)
No. whose depreciation level is
less than 100% of assets 18 18
More than 100% of assets 1 1
The State Of Local Government Finances and Financial Management - As at 30 June 2019
Audit Outcomes of the 2018/19 financial year : Analysis Document | 17
ASSESSMENT OF THE FINANCIAL HEALTH OF MUNICIPALITIES
The State Of Local Government Finances and Financial Management - As at 30 June 2019
Audit Outcomes of the 2018/19 financial year : Analysis Document | 17
ASSESSMENT OF THE FINANCIAL HEALTH OF MUNICIPALITIES
MUNICIPALITIESAUDIT OUTCOME
2017/18 2018/19
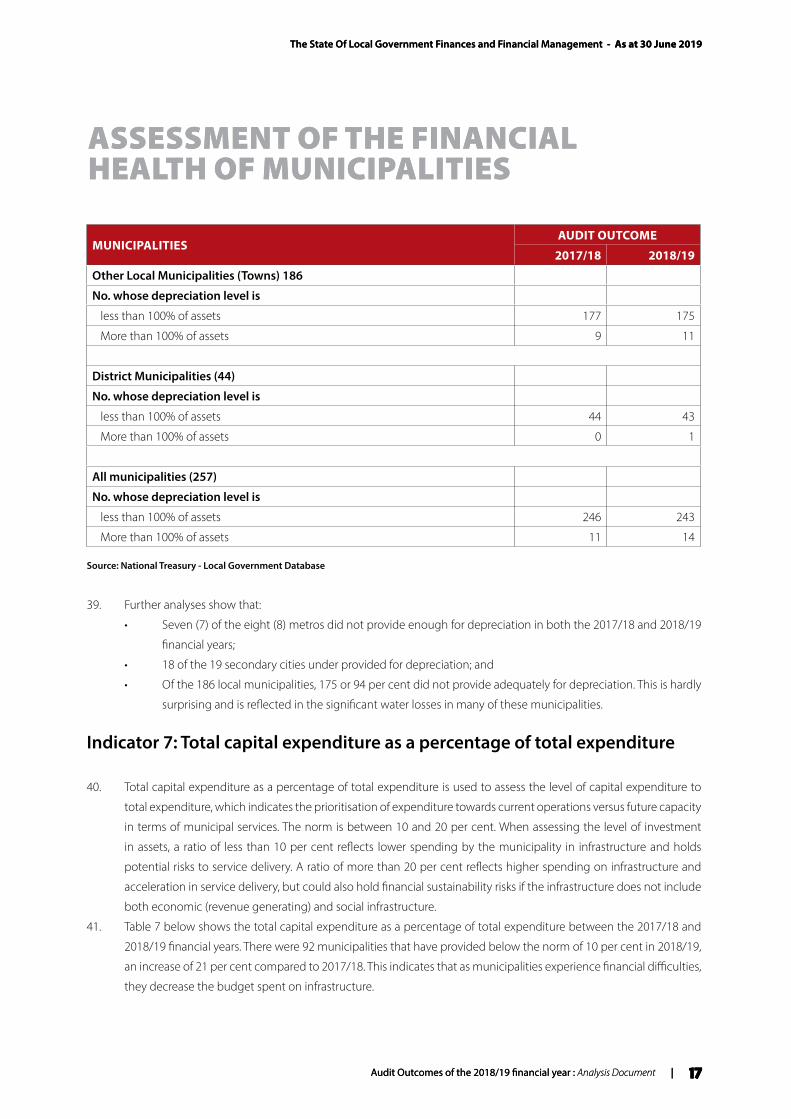
Other Local Municipalities (Towns) 186
No. whose depreciation level is
less than 100% of assets 177 175
More than 100% of assets 9 11
District Municipalities (44)
No. whose depreciation level is
less than 100% of assets 44 43
More than 100% of assets 0 1
All municipalities (257)
No. whose depreciation level is
less than 100% of assets 246 243
More than 100% of assets 11 14
Source: National Treasury - Local Government Database
39. Further analyses show that:
• Seven (7) of the eight (8) metros did not provide enough for depreciation in both the 2017/18 and 2018/19
financial years;
• 18 of the 19 secondary cities under provided for depreciation; and
• Of the 186 local municipalities, 175 or 94 per cent did not provide adequately for depreciation. This is hardly
surprising and is reflected in the significant water losses in many of these municipalities.
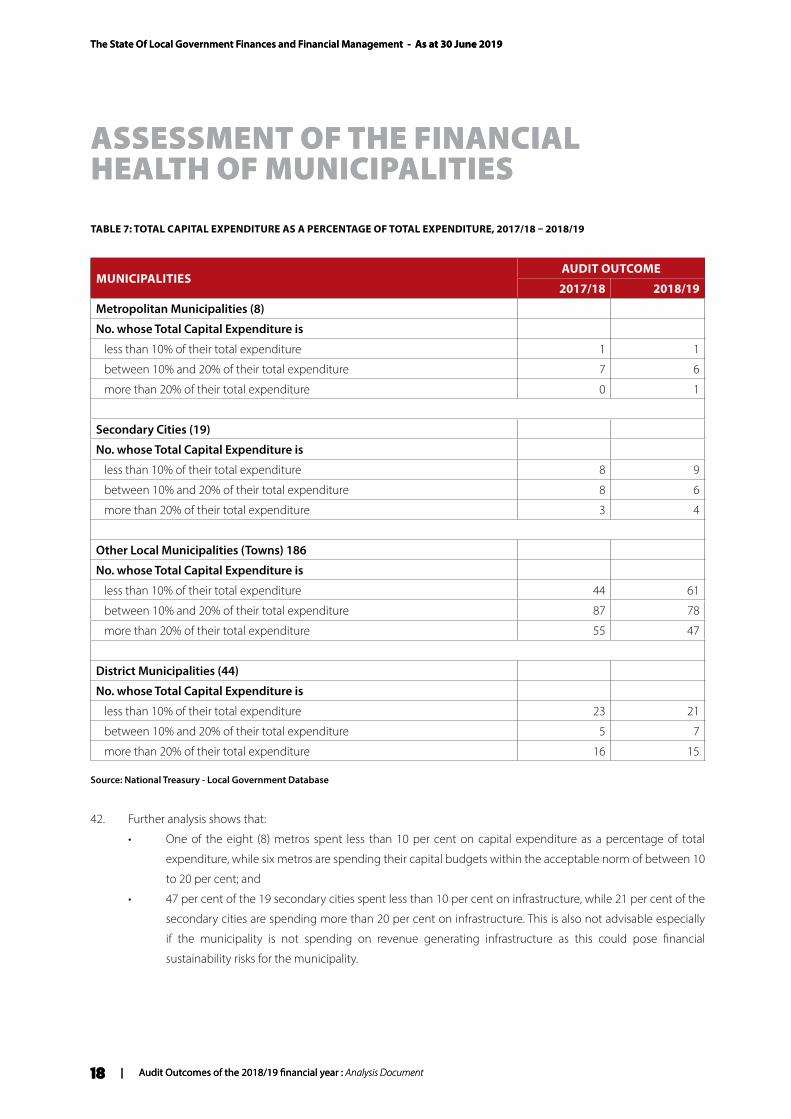
Indicator 7: Total capital expenditure as a percentage of total expenditure
40. Total capital expenditure as a percentage of total expenditure is used to assess the level of capital expenditure to
total expenditure, which indicates the prioritisation of expenditure towards current operations versus future capacity
in terms of municipal services. The norm is between 10 and 20 per cent. When assessing the level of investment
in assets, a ratio of less than 10 per cent reflects lower spending by the municipality in infrastructure and holds
potential risks to service delivery. A ratio of more than 20 per cent reflects higher spending on infrastructure and
acceleration in service delivery, but could also hold financial sustainability risks if the infrastructure does not include
both economic (revenue generating) and social infrastructure.
41. Table 7 below shows the total capital expenditure as a percentage of total expenditure between the 2017/18 and
2018/19 financial years. There were 92 municipalities that have provided below the norm of 10 per cent in 2018/19,
an increase of 21 per cent compared to 2017/18. This indicates that as municipalities experience financial difficulties,
they decrease the budget spent on infrastructure.
The State Of Local Government Finances and Financial Management - As at 30 June 2019
18 | Audit Outcomes of the 2018/19 financial year : Analysis Document
ASSESSMENT OF THE FINANCIAL HEALTH OF MUNICIPALITIES
The State Of Local Government Finances and Financial Management - As at 30 June 2019
18 | Audit Outcomes of the 2018/19 financial year : Analysis Document
ASSESSMENT OF THE FINANCIAL HEALTH OF MUNICIPALITIES
TABLE 7: TOTAL CAPITAL EXPENDITURE AS A PERCENTAGE OF TOTAL EXPENDITURE, 2017/18 – 2018/19
MUNICIPALITIESAUDIT OUTCOME
2017/18 2018/19
Metropolitan Municipalities (8)
No. whose Total Capital Expenditure is
less than 10% of their total expenditure 1 1
between 10% and 20% of their total expenditure 7 6
more than 20% of their total expenditure 0 1
Secondary Cities (19)
No. whose Total Capital Expenditure is
less than 10% of their total expenditure 8 9
between 10% and 20% of their total expenditure 8 6
more than 20% of their total expenditure 3 4
Other Local Municipalities (Towns) 186
No. whose Total Capital Expenditure is
less than 10% of their total expenditure 44 61
between 10% and 20% of their total expenditure 87 78
more than 20% of their total expenditure 55 47
District Municipalities (44)
No. whose Total Capital Expenditure is
less than 10% of their total expenditure 23 21
between 10% and 20% of their total expenditure 5 7
more than 20% of their total expenditure 16 15
Source: National Treasury - Local Government Database
42. Further analysis shows that:
• One of the eight (8) metros spent less than 10 per cent on capital expenditure as a percentage of total
expenditure, while six metros are spending their capital budgets within the acceptable norm of between 10
to 20 per cent; and
• 47 per cent of the 19 secondary cities spent less than 10 per cent on infrastructure, while 21 per cent of the
secondary cities are spending more than 20 per cent on infrastructure. This is also not advisable especially
if the municipality is not spending on revenue generating infrastructure as this could pose financial
sustainability risks for the municipality.
The State Of Local Government Finances and Financial Management - As at 30 June 2019
Audit Outcomes of the 2018/19 financial year : Analysis Document | 19
ASSESSMENT OF THE FINANCIAL HEALTH OF MUNICIPALITIES
The State Of Local Government Finances and Financial Management - As at 30 June 2019
Audit Outcomes of the 2018/19 financial year : Analysis Document | 19
ASSESSMENT OF THE FINANCIAL HEALTH OF MUNICIPALITIES
Indicator 8: Liquidity ratio
43. The liquidity ratios are a result of dividing cash and investments by current liabilities. These ratios show the number
of times the short-term debt obligations are covered by the cash and investments. If the value is greater than one, it
means the short-term obligations are fully covered.
44. Table 8 below shows the liquidity ratio between the 2017/18 and 2018/19 financial years. Just over 27 per cent of
municipalities had enough cash and investments to pay current obligations.
TABLE 8: LIQUIDITY RATIO, 2017/18 – 2018/19
MUNICIPALITIESAUDIT OUTCOME
2017/18 2018/19
Metropolitan Municipalities (8)
No. of municipalities whose cash and investments is 0 0
less than current liabilities (less than 1) 7 6
More than current liabilities (more than 1) 1 2
Secondary Cities (19)
No. of municipalities whose cash and investments is 0 0
less than current liabilities (less than 1) 16 16
More than current liabilities (more than 1) 3 3
Other Local Municipalities (Towns) 186
No. of municipalities whose cash and investments is 0 0
less than current liabilities (less than 1) 135 137
More than current liabilities (more than 1) 51 49
District Municipalities (44)
No. of municipalities whose cash and investments is 0 0
less than current liabilities (less than 1) 29 27
More than current liabilities (more than 1) 15 17
All municipalities (257) - -
No. of municipalities whose cash and investments is - -
less than current liabilities (less than 1) 187 186
More than current liabilities (more than 1) 70 71
Source: National Treasury - Local Government Database
The State Of Local Government Finances and Financial Management - As at 30 June 2019
20 | Audit Outcomes of the 2018/19 financial year : Analysis Document
ASSESSMENT OF THE FINANCIAL HEALTH OF MUNICIPALITIES
The State Of Local Government Finances and Financial Management - As at 30 June 2019
20 | Audit Outcomes of the 2018/19 financial year : Analysis Document
ASSESSMENT OF THE FINANCIAL HEALTH OF MUNICIPALITIES
45. Further analysis shows that:
• Six metros and 16 secondary cities reported that their cash and investments are insufficient to pay all current
liabilities;
• 73.7 per cent of the local municipalities do not have adequate cash and investments to pay for current
liabilities; and
• 61.4 per cent of districts did not have adequate cash and investments to pay for current liabilities.
Indicator 9: Debtors days
46. Debtors days reflects the collection period. Net Debtor Days refers to the average number of days required for a
municipality to receive payment from its consumers for bills/invoices issued to them for services. The norm for
the collection period is 30 days. If the ratio is above the norm, this indicates that the municipality is exposed to
significant cash flow risk. This is also an indication that the municipality is experiencing challenges in the collection
of outstanding amounts due to it. In addition, this indicates that a significant amount of potential cash is tied up in
consumer debtors and the municipality must improve its revenue and cash flow management.
47. Table 9 below shows the debtors days between the 2017/18 and 2018/19 financial years. 39.5 per cent of
municipalities collect debt within 30 days. The rest of municipalities are not able to collect debt within 30 days. This
explains why most municipalities are experiencing cash flow challenges.
TABLE 9: DEBTORS DAYS, 2017/18 – 2018/19
MUNICIPALITIESAUDIT OUTCOME
2017/18 2018/19
Metropolitan Municipalities (8)
No. of municipalities who receive debtors
less than 30 days 0 0
More than 30 days 8 8
Secondary Cities (19)
No. of municipalities who receive debtors
less than 30 days 2 2
More than 30 days 17 17
Other Local Municipalities (Towns) 186
No. of municipalities who receive debtors
less than 30 days 20 23
More than 30 days 166 163
The State Of Local Government Finances and Financial Management - As at 30 June 2019
Audit Outcomes of the 2018/19 financial year : Analysis Document | 21
ASSESSMENT OF THE FINANCIAL HEALTH OF MUNICIPALITIES
The State Of Local Government Finances and Financial Management - As at 30 June 2019
Audit Outcomes of the 2018/19 financial year : Analysis Document | 21
ASSESSMENT OF THE FINANCIAL HEALTH OF MUNICIPALITIES
MUNICIPALITIESAUDIT OUTCOME
2017/18 2018/19
District Municipalities (44)
No. of municipalities who receive debtors
less than 30 days 24 26
More than 30 days 20 18
All municipalities (257)
No. of municipalities who receive debtors
less than 30 days 46 51
More than 30 days 211 206
Source: National Treasury - Local Government Database
48. Further analysis shows that:
• None of the metros are able to collect debt within 30 days;
• Only two of the 19 secondary cities are able to collect debt within 30 days of issuing the bill;
• Only 12 per cent of local municipalities are able to collect debt within 30 days; and
• About 59.1 per cent of districts are able to collect debt within 30 days.
Indicator 10: Creditors days
49. Timely payment of creditors by a municipality is not only essential for the liquidity of local economies and the
survival of small and medium sized enterprises, but is also a good reflection of the extent of financial challenges
facing a municipality. A municipality that is unable to pay its creditors within prescribed time limits is ineffectively
using their resources to fund other activities, indicating the likelihood of underlying financial problems. A year-on-
year increase in outstanding creditors could be an indication that municipalities are experiencing liquidity and cash
challenges and consequently are delaying the settlement of outstanding debt owed.
50. Section 65(2)(e) of the MFMA provides that a municipality’s accounting officer must take all reasonable steps
to ensure “that all money owing by the municipality be paid within 30 days of receiving the relevant invoice or
statement, unless prescribed otherwise for certain categories of expenditure. In addition, Section 65(2)(h) provides
that the accounting officer must take all reasonable steps to ensure that the municipality’s available working capital
is managed effectively and economically. At a minimum, this involves ensuring that the timing of the municipality’s
expenditures is matched by its flow of income.
51. The following table shows payment of creditors days between 2017/18 and 2018/19. This indicates the extent to
which municipalities had working capital to settle their outstanding creditors.
The State Of Local Government Finances and Financial Management - As at 30 June 2019
22 | Audit Outcomes of the 2018/19 financial year : Analysis Document
ASSESSMENT OF THE FINANCIAL HEALTH OF MUNICIPALITIES
The State Of Local Government Finances and Financial Management - As at 30 June 2019
22 | Audit Outcomes of the 2018/19 financial year : Analysis Document
ASSESSMENT OF THE FINANCIAL HEALTH OF MUNICIPALITIES
TABLE 10: CREDITORS DAYS, 2017/18 – 2018/19
MUNICIPALITIESAUDIT OUTCOME
2017/18 2018/19
Metropolitan Municipalities (8)
No. of municipalities who pay creditors
within 30 days of receiving the invoice 2 3
more than 30 days after receiving the invoice 6 5
Secondary Cities (19)
No. of municipalities who pay creditors
within 30 days of receiving the invoice 5 5
more than 30 days after receiving the invoice 14 14
Other Local Municipalities (Towns) 186
No. of municipalities who pay creditors
within 30 days of receiving the invoice 75 50
more than 30 days after receiving the invoice 111 136
District Municipalities (44)
No. of municipalities who pay creditors
within 30 days of receiving the invoice 21 10
more than 30 days after receiving the invoice 23 34
All municipalities (257)
No. of municipalities who pay creditors
within 30 days of receiving the invoice 103 68
more than 30 days after receiving the invoice 154 189
Source: National Treasury - Local Government Database
52. Total creditors across all municipalities has increased to R137.9 billion at the end of 2018/19, from R109.8 billion in
2017/18 financial year. ‘Other’ made up the bulk of total creditors at 37 per cent followed by Trade Creditors (31.5 per
cent) and bulk electricity (15.6 per cent). Further analysis shows that:
• Five metros and 14 secondary cities reported that it takes more than 30 days of receiving the invoice to pay
creditors. This is a slight improvement from 6 metros who reported this position in 2017/18. However, the
nominal value of creditors outstanding had risen to R85.1 billion (or by 55.6 per cent) in metros. In the case of
secondary cities and local municipalities creditors outstanding had decreased to R45.1 billion from R48 billion
(or by 6 per cent) in 2017/18; and
• 34 district municipalities reported that it takes more than 30 days of receiving the invoice to pay creditors. The
total nominal value of creditors outstanding increased from R6.6 billion in 2017/18 to R7.6 billion in 2018/19.
The State Of Local Government Finances and Financial Management - As at 30 June 2019
Audit Outcomes of the 2018/19 financial year : Analysis Document | 23
ASSESSMENT OF THE FINANCIAL HEALTH OF MUNICIPALITIES
The State Of Local Government Finances and Financial Management - As at 30 June 2019
Audit Outcomes of the 2018/19 financial year : Analysis Document | 23
ASSESSMENT OF THE FINANCIAL HEALTH OF MUNICIPALITIES
53. This data clearly shows that some municipalities are not complying with Section 65 (2)(e) of the MFMA and that
their cash flow management is weak. This has serious implications for the financial viability of Small Medium and
Micro Enterprises (SMMEs) and other suppliers that provide services to municipalities. The year-on-year increase in
outstanding creditors in some municipalities is an indication that they are experiencing liquidity and cash challenges
and consequently are delaying the settlement of outstanding debt owed. These findings are consistent with the
trends observed in the past, with municipalities delaying payments to creditors at the end of the financial year in
order to report a ‘favourable cash position’ and thereby ostensibly comply with Section 65 of the MFMA.
54. National Treasury has made efforts to ensure that municipalities pay their long outstanding creditors. Methods
used have included obtaining settlement agreements with those municipalities owing monies to Eskom and the
country’s Water Boards.
Indicator 11: Total borrowing vs total operating revenue
55. This ratio indicates the extent of total borrowings in relation to total operating revenue. It indicates short- and long-
term debt relative to operating revenue of the municipality.
56. The purpose of the ratio is to provide assurance that sufficient revenue will be generated to repay liabilities.
Alternatively stated, the ratio indicates the affordability of the total borrowings. The accepted norm for total
borrowing is up to 45 per cent of the total operating revenue.
57. Table 11 below indicates total borrowing versus total operating revenue. 250 of the 257 municipalities have less than
45 per cent borrowing as a percentage of total operating revenue. This indicates that municipalities still have capacity
to take increase funding from borrowings. However, this should be considered within the cash flow requirements
of the municipalities and their ability to repay borrowing. Importantly, municipalities should borrow for revenue
generating assets.
TABLE 11: TOTAL BORROWING VS TOTAL OPERATING REVENUE, 2017/18 – 2018/19
MUNICIPALITIESAUDIT OUTCOME
2017/18 2018/19
Metropolitan Municipalities (8)
No. of municipalities whose debt level is
less than 45% 7 7
more than 45% 1 1
Secondary Cities (19)
No. of municipalities whose debt level is
less than 45% 17 17
more than 45% 2 2
Other Local Municipalities (Towns) 186
No. of municipalities whose debt level is
less than 45% 185 183
The State Of Local Government Finances and Financial Management - As at 30 June 2019
24 | Audit Outcomes of the 2018/19 financial year : Analysis Document
The State Of Local Government Finances and Financial Management - As at 30 June 2019
24 | Audit Outcomes of the 2018/19 financial year : Analysis Document
ASSESSMENT OF THE FINANCIAL HEALTH OF MUNICIPALITIES
MUNICIPALITIESAUDIT OUTCOME
2017/18 2018/19
more than 45% 1 3
District Municipalities (44)
No. of municipalities whose debt level is
less than 45% 43 43
more than 45% 1 1
All municipalities (257)
No. of municipalities whose debt level is
less than 45% 252 250
more than 45% 5 7
Source: National Treasury - Local Government Database
58. Further analysis shows that:
• Seven of eight (8) metros’ total borrowing is less than 45 per cent of total operating revenue;
• 17 secondary cities have adequate capacity to borrow but may not be able to afford borrowing given cash
flow constraints or poor credit ratings;
• Only three (3) of the 186 local municipalities have reported to have borrowed more than 45 per cent of their
operating revenue. This supports the notion that local municipalities are cash strapped and therefore many
cannot afford the repayment of borrowing nor do they qualify for a loan from the banks; and
• Among district municipalities, only one district reported to have borrowed more than 45 per cent of their
operating revenue.
Indicator 12: Current ratio
59. The ratio is used to assess the municipality’s ability to pay back its short-term liabilities (debt and payables) with its
short-term assets (cash and receivables).
60. The higher the current ratio, the more capable the municipality will be to pay its current or short-term obligations
and provide for a risk cover to enable it to continue operations at desired levels. A financial ratio of under 1 suggests
that a municipality will be unable to pay all its current or short-term obligations if they fall due at any specific point.
61. If current liabilities exceed current assets, it highlights serious financial challenges and most likely liquidity problems (i.e.
insufficient cash to meet short-term financial obligations). Current assets must therefore be increased to appropriately
cover current liabilities or there is a risk that non-current assets will need to be liquidated to settle current liabilities.
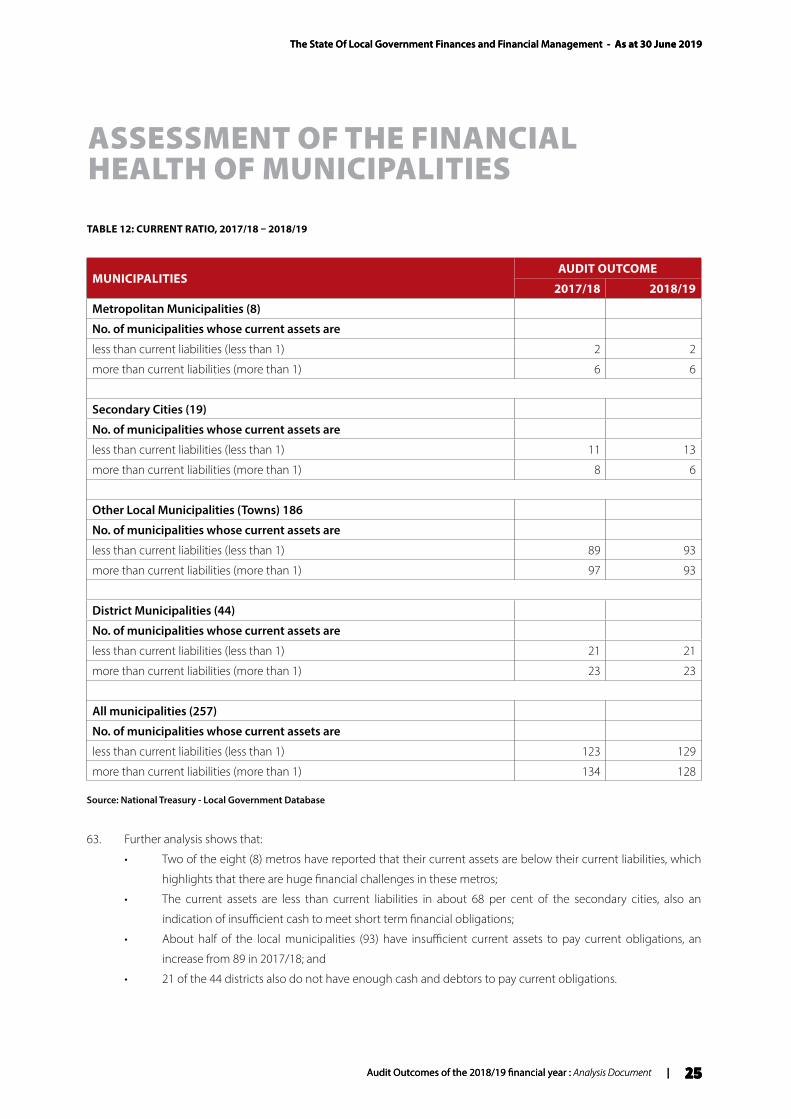
62. Table 12 below shows current ratio between 2017/18 and 2018/19. A huge concern is that the current assets are
below the current liabilities in about half of the municipalities.
The State Of Local Government Finances and Financial Management - As at 30 June 2019
Audit Outcomes of the 2018/19 financial year : Analysis Document | 25
The State Of Local Government Finances and Financial Management - As at 30 June 2019
Audit Outcomes of the 2018/19 financial year : Analysis Document | 25
ASSESSMENT OF THE FINANCIAL HEALTH OF MUNICIPALITIES
TABLE 12: CURRENT RATIO, 2017/18 – 2018/19
MUNICIPALITIESAUDIT OUTCOME
2017/18 2018/19
Metropolitan Municipalities (8)
No. of municipalities whose current assets are
less than current liabilities (less than 1) 2 2
more than current liabilities (more than 1) 6 6
Secondary Cities (19)
No. of municipalities whose current assets are
less than current liabilities (less than 1) 11 13
more than current liabilities (more than 1) 8 6
Other Local Municipalities (Towns) 186
No. of municipalities whose current assets are
less than current liabilities (less than 1) 89 93
more than current liabilities (more than 1) 97 93
District Municipalities (44)
No. of municipalities whose current assets are
less than current liabilities (less than 1) 21 21
more than current liabilities (more than 1) 23 23
All municipalities (257)
No. of municipalities whose current assets are
less than current liabilities (less than 1) 123 129
more than current liabilities (more than 1) 134 128
Source: National Treasury - Local Government Database
63. Further analysis shows that:
• Two of the eight (8) metros have reported that their current assets are below their current liabilities, which
highlights that there are huge financial challenges in these metros;
• The current assets are less than current liabilities in about 68 per cent of the secondary cities, also an
indication of insufficient cash to meet short term financial obligations;
• About half of the local municipalities (93) have insufficient current assets to pay current obligations, an
increase from 89 in 2017/18; and
• 21 of the 44 districts also do not have enough cash and debtors to pay current obligations.
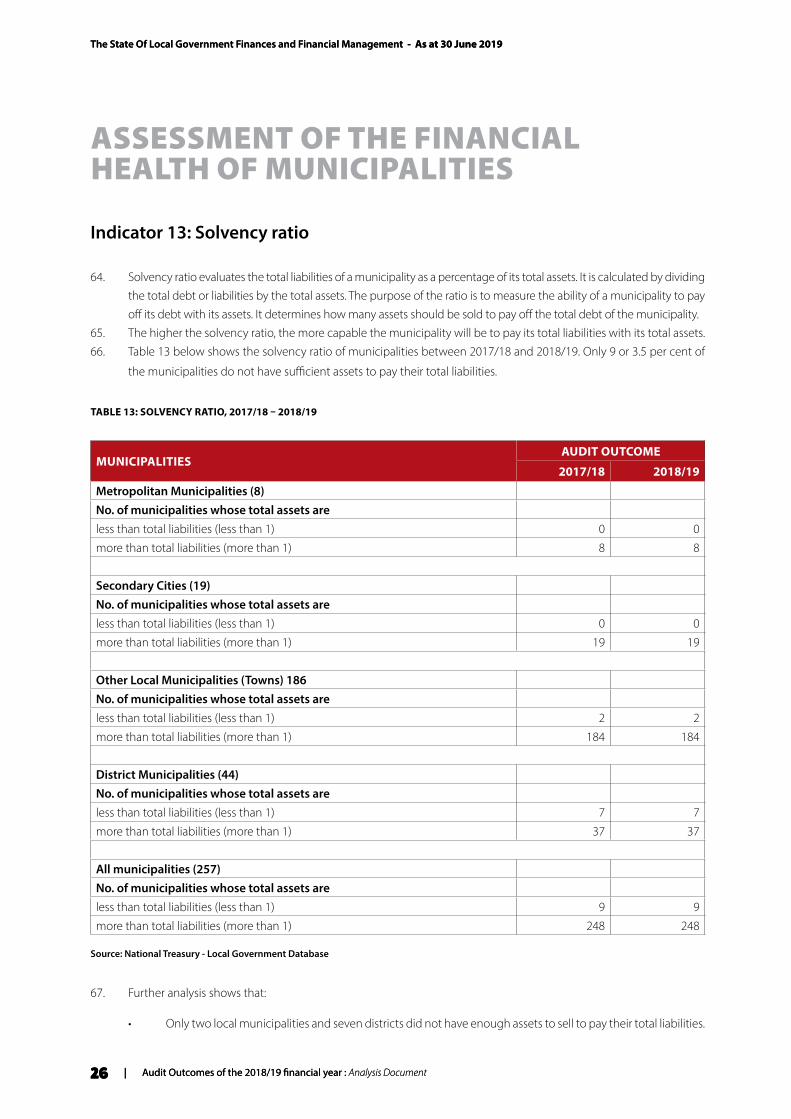
The State Of Local Government Finances and Financial Management - As at 30 June 2019
26 | Audit Outcomes of the 2018/19 financial year : Analysis Document
The State Of Local Government Finances and Financial Management - As at 30 June 2019
26 | Audit Outcomes of the 2018/19 financial year : Analysis Document
ASSESSMENT OF THE FINANCIAL HEALTH OF MUNICIPALITIES
Indicator 13: Solvency ratio
64. Solvency ratio evaluates the total liabilities of a municipality as a percentage of its total assets. It is calculated by dividing the total debt or liabilities by the total assets. The purpose of the ratio is to measure the ability of a municipality to pay off its debt with its assets. It determines how many assets should be sold to pay off the total debt of the municipality.
65. The higher the solvency ratio, the more capable the municipality will be to pay its total liabilities with its total assets.66. Table 13 below shows the solvency ratio of municipalities between 2017/18 and 2018/19. Only 9 or 3.5 per cent of
the municipalities do not have sufficient assets to pay their total liabilities.
TABLE 13: SOLVENCY RATIO, 2017/18 – 2018/19
MUNICIPALITIESAUDIT OUTCOME
2017/18 2018/19Metropolitan Municipalities (8)No. of municipalities whose total assets areless than total liabilities (less than 1) 0 0
more than total liabilities (more than 1) 8 8
Secondary Cities (19)No. of municipalities whose total assets areless than total liabilities (less than 1) 0 0
more than total liabilities (more than 1) 19 19
Other Local Municipalities (Towns) 186No. of municipalities whose total assets areless than total liabilities (less than 1) 2 2
more than total liabilities (more than 1) 184 184
District Municipalities (44)No. of municipalities whose total assets areless than total liabilities (less than 1) 7 7
more than total liabilities (more than 1) 37 37
All municipalities (257)No. of municipalities whose total assets areless than total liabilities (less than 1) 9 9
more than total liabilities (more than 1) 248 248
Source: National Treasury - Local Government Database
67. Further analysis shows that:
• Only two local municipalities and seven districts did not have enough assets to sell to pay their total liabilities.
The State Of Local Government Finances and Financial Management - As at 30 June 2019
Audit Outcomes of the 2018/19 financial year : Analysis Document | 27
The State Of Local Government Finances and Financial Management - As at 30 June 2019
Audit Outcomes of the 2018/19 financial year : Analysis Document | 27
OTHER ISSUES IMPACTING ON THE FINANCIAL HEALTH OF A MUNICIPALITY
AUDIT OUTCOMES: 2018/19 FINANCIAL YEAR
68. It is important to note that audit outcomes are not necessarily the only indicator of financial health. A good audit
outcome means that the financial statements fairly represent the financial condition of the municipality, even if the
finances are not in a good state. A bad audit outcome can mean that the financial statements cannot be relied on
due to lack of supporting documentation, or cannot be verified, even if the municipality is in good financial health.
69. The audit outcomes regressed for a third consecutive year. The Auditor-Generals (AG) 2018/19 report5 on local
government audit outcomes highlighted that municipal audit outcomes of 76 municipalities regressed while only
31 showed improvement. Even the deadline for submission of the annual financial statements to the AG had been
met by only 89.1 per cent of municipalities. By the legislative audit deadline of 31 August 20196, 28 annual financial
statements for 2018/19 were outstanding.
70. It was also noted by the AG that municipalities used consultants for financial reporting services at a cost of R1.3
billion in 2018/19.
5 The 2018/19 AG report was used for the purpose of this report as it was the most recent report available, however please note that 28 audit opinions were still outstanding.
6 Consolidated Financial Statements are submitted by 30 September for municipalities with entities.
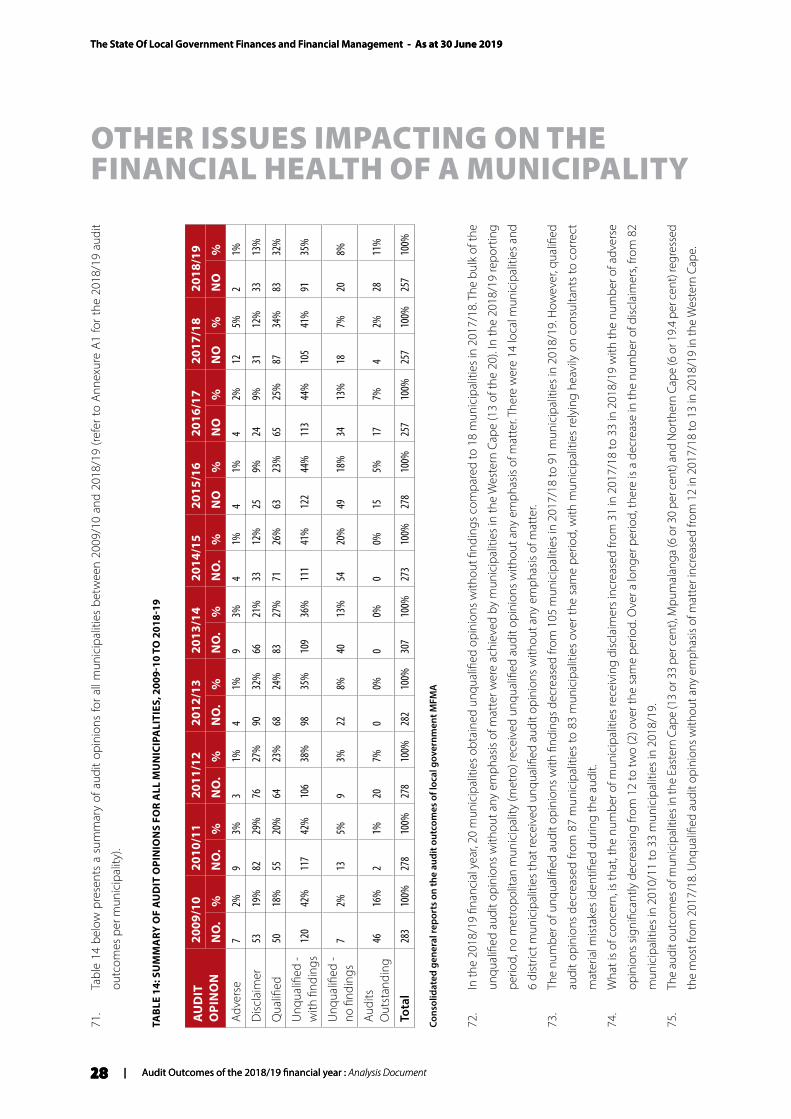
The State Of Local Government Finances and Financial Management - As at 30 June 2019
28 | Audit Outcomes of the 2018/19 financial year : Analysis Document
OTHER ISSUES IMPACTING ON THE FINANCIAL HEALTH OF A MUNICIPALITY
The State Of Local Government Finances and Financial Management - As at 30 June 2019
28 | Audit Outcomes of the 2018/19 financial year : Analysis Document
71.
Tabl
e 14
bel
ow p
rese
nts
a su
mm
ary
of a
udit
opin
ions
for a
ll m
unic
ipal
ities
bet
wee
n 20
09/1
0 an
d 20
18/1
9 (re
fer t
o An
nexu
re A
1 fo
r the
201
8/19
aud
it
outc
omes
per
mun
icip
ality
).
TAB
LE 1
4: S
UM
MA
RY O
F A
UD
IT O
PIN
ION
S FO
R A
LL M
UN
ICIP
ALI
TIES
, 200
9-10
TO
201
8-19
AU
DIT
O
PIN
ON
2009
/10
2010
/11
2011
/12
2012
/13
2013
/14
2014
/15
2015
/16
2016
/17
2017
/18
2018
/19
NO
.%
NO
.%
NO
.%
NO
.%
NO
.%
NO
.%
NO
%N
O%
NO
%N
O%
Adve
rse
72%
93%
31%
41%
93%
41%
41%
42%
125%
21%
Disc
laim
er53
19%
8229
%76
27%
9032
%66
21%
3312
%25
9%24
9%31
12%
3313
%
Qua
lified
5018
%55
20%
6423
%68
24%
8327
%71
26%
6323
%65
25%
8734
%83
32%
Unq
ualifi
ed -
with
find
ings
120
42%
117
42%
106
38%
9835
%10
936
%11
141
%12
244
%11
344
%10
541
%91
35%
Unq
ualifi
ed -
no fi
ndin
gs7
2%13
5%9
3%22
8%40
13%
5420
%49
18%
3413
%18
7%20
8%
Audi
ts
Out
stan
ding
4616
%2
1%20
7%0
0%0
0%0
0%15
5%17
7%4
2%28
11%
Tota
l28
310
0%27
810
0%27
810
0%28
210
0%30
710
0%27
310
0%27
810
0%25
710
0%25
710
0%25
710
0%
Cons
olid
ated
gen
eral
repo
rts
on th
e au
dit o
utco
mes
of l
ocal
gov
ernm
ent M
FMA
72.
In th
e 20
18/1
9 fin
anci
al y
ear,
20 m
unic
ipal
ities
obt
aine
d un
qual
ified
opi
nion
s with
out fi
ndin
gs c
ompa
red
to 1
8 m
unic
ipal
ities
in 2
017/
18. T
he b
ulk
of th
e
unqu
alifi
ed a
udit
opin
ions
with
out a
ny e
mph
asis
of m
atte
r wer
e ac
hiev
ed b
y m
unic
ipal
ities
in th
e W
este
rn C
ape
(13
of th
e 20
). In
the
2018
/19
repo
rtin
g
perio
d, n
o m
etro
polit
an m
unic
ipal
ity (m
etro
) rec
eive
d un
qual
ified
aud
it op
inio
ns w
ithou
t any
em
phas
is of
mat
ter.
Ther
e w
ere
14 lo
cal m
unic
ipal
ities
and
6 di
stric
t mun
icip
aliti
es th
at re
ceiv
ed u
nqua
lified
aud
it op
inio
ns w
ithou
t any
em
phas
is of
mat
ter.
73.
The
num
ber o
f unq
ualifi
ed a
udit
opin
ions
with
find
ings
dec
reas
ed fr
om 1
05 m
unic
ipal
ities
in 2
017/
18 to
91
mun
icip
aliti
es in
201
8/19
. How
ever
, qua
lified
audi
t opi
nion
s de
crea
sed
from
87
mun
icip
aliti
es to
83
mun
icip
aliti
es o
ver t
he s
ame
perio
d, w
ith m
unic
ipal
ities
rely
ing
heav
ily o
n co
nsul
tant
s to
cor
rect
mat
eria
l mist
akes
iden
tified
dur
ing
the
audi
t.
74.
Wha
t is
of c
once
rn, i
s th
at, t
he n
umbe
r of m
unic
ipal
ities
rece
ivin
g di
scla
imer
s in
crea
sed
from
31
in 2
017/
18 to
33
in 2
018/
19 w
ith th
e nu
mbe
r of a
dver
se
opin
ions
sign
ifica
ntly
dec
reas
ing
from
12
to tw
o (2
) ove
r the
sam
e pe
riod.
Ove
r a lo
nger
per
iod,
ther
e is
a de
crea
se in
the
num
ber o
f disc
laim
ers,
from
82
mun
icip
aliti
es in
201
0/11
to 3
3 m
unic
ipal
ities
in 2
018/
19.
75.
The
audi
t out
com
es o
f mun
icip
aliti
es in
the
East
ern
Cape
(13
or 3
3 pe
r cen
t), M
pum
alan
ga (6
or 3
0 pe
r cen
t) an
d N
orth
ern
Cape
(6 o
r 19.
4 pe
r cen
t) re
gres
sed
the
mos
t fro
m 2
017/
18. U
nqua
lified
aud
it op
inio
ns w
ithou
t any
em
phas
is of
mat
ter i
ncre
ased
from
12
in 2
017/
18 to
13
in 2
018/
19 in
the
Wes
tern
Cap
e.
The State Of Local Government Finances and Financial Management - As at 30 June 2019
Audit Outcomes of the 2018/19 financial year : Analysis Document | 29
OTHER ISSUES IMPACTING ON THE FINANCIAL HEALTH OF A MUNICIPALITY
The State Of Local Government Finances and Financial Management - As at 30 June 2019
Audit Outcomes of the 2018/19 financial year : Analysis Document | 29
76. The provinces with the poorest audit outcomes in 2018/19 (based on the number of municipalities with disclaimer
opinions) were the North West (9), Eastern Cape (8), Northern Cape (6) and Mpumalanga Provinces (4). Mpumalanga
was the only province with adverse audit findings in 2018/19 (2 municipalities received adverse opinions). Audits
were mostly outstanding in the Free State (8), Northern West (5) and Northern Cape (4).
77. According to the AG, the closing amounts for irregular7 expenditure increased from R53.41 billion in 2017/18 to
R65.6 billion in 2018/19. The annual value of irregular expenditure increased from R25.2 billion to R32.1 billion
(R21.46 billion audited plus R10.6 billion outstanding based on unaudited AFS), the number of municipalities
incurring irregular expenditure slightly increased from 239 to 241. The main cause for irregular expenditure in 93 per
cent of the time was non-compliance with supply chain legislation, relating to procurement without following the
competitive bidding or quotation process (R5.5 billion), non-compliance with procurement process requirements
(R12.3 billion), and inadequate contract management (R2.2 billion).
78. Fruitless and wasteful expenditure incurred by municipalities increased marginally from R1 billion in 2017/18 to
R3.12 billion (including outstanding audits) in 2018/19. The main reason for the fruitless and wasteful expenditure
was interest, penalties on overdue accounts and late payments.
79. Unauthorised expenditure increased from R8.9 billion in 2017/18 to R15.9 billion (including outstanding audits) in
2018/19. Unauthorised expenditure is predominantly the result of overspending of budgets (R5 billion related to
actual payment in excess of budget) and expenditure related to non-cash items (R6.8 billion) which indicates a poor
estimation of asset impairment.
80. The AG highlighted three main root causes for limited improvement in the audits of 2018/19. These are: (i) slow
or no response in improving internal controls and addressing risk areas; (ii) inadequate consequences for poor
performance and transgressions; and (iii) instability or vacancies in key positions or key officials lacking appropriate
completeness.
81. In its report the AG concluded the following:
• Legislation coupled with policies and procedures are in place to guide local government, but local
government persistently fails to implement these in the intended manner to enforce compliance;
• More focus must be placed on exercising political oversight and addressing the aspirations of citizens;
• Municipal managers and senior management also do not devote sufficient energy to areas that matter such
as key controls, risk management and credible reporting in prime areas such as reconciliations, supervisory
reviews, action plan monitoring and adherence as well as record keeping, which form the foundation for
sound levels of accountability;
• Consequently, there is often a blatant disregard for the legislation that governs good administration, without
punitive measures being actioned against errant officials;
• Moreover, consultants continue to be appointed in many instances while officials are in positions to execute
these functions. This promotes indolence among officials as well as a wastage of funds;
• The municipal managers, with their management teams, must set an ethical tone to solidify systems and
processes as well as preventative controls, which should operate on autopilot and set accountability in
overdrive. The levels of tolerance for non-compliance need to be minimised, with transparent reporting to
councils and the public; and
7 Irregular, unauthorised and wasteful expenditure is defined in Section 1 of the MFMA.
The State Of Local Government Finances and Financial Management - As at 30 June 2019
30 | Audit Outcomes of the 2018/19 financial year : Analysis Document
OTHER ISSUES IMPACTING ON THE FINANCIAL HEALTH OF A MUNICIPALITY
The State Of Local Government Finances and Financial Management - As at 30 June 2019
30 | Audit Outcomes of the 2018/19 financial year : Analysis Document
• The importance of implementing the recommendations of audit committees cannot be over emphasised,
nor can the need for assurance providers (municipal public accounts committees and audit committees) to
understand the business of local government beyond the financial statements. This is important to support
cohesive and better-governed municipalities.
82. The provinces with the best audit outcomes (based on the number of municipalities with unqualified with no
findings) were the Western Cape (13 in 2018/19) and Mpumalanga (2 in 2018/19).
83. The Municipal Regulations on Financial Misconduct Procedures and Criminal Proceedings were promulgated
on 31 May 2014 to deal with matters of financial misconduct and to give effect to the concept of consequence
management. A concerted effort has also been made with the Section 71 monthly budget statements and Back to
Basics (B2B) reports to ensure that municipalities that fail to comply with audit requirements put in place internal
controls and early-warning systems to minimise the risk of future non-compliance.
GOVERNANCE: ACTING MUNICIPAL MANAGER AND CHIEF FINANCIAL OFFICER POSITIONS
84. The instability in senior municipal management positions has a negative impact on service delivery to communities.
This manifests in a number of ways including the inability to make basic managerial decisions, such as the
appointment of service providers, and overall financial sustainability. This often delays project implementation and
affects the municipality’s ability to spend its capital budget.
85. Section 82 of the Municipal Structures Act (MSA) obliges a municipal council to appoint a Municipal Manager
(MM) with relevant skills and expertise to perform the relevant functions of the position. The MM is the accounting
officer of a municipality and is responsible for all major operations and holds overall accountability for the
administration of the municipality.
86. Through its interaction with municipalities, National Treasury has observed that when the position of MM is vacant,
accountability is weak. It may be that the acting incumbent, if one is appointed, feels restricted from making certain
key decisions. Alternatively, if (in cases where a permanent MM is not in place due to resignation, suspension
or termination of service) the MM’s role is spread amongst several senior managers, no one person can be held
accountable when things go wrong. It is therefore critical that the post of MM be permanently filled and that the
necessary performance agreements and contracts are in place.
87. The Chief Financial Officer (CFO) is another critical position in the municipal structure. The CFO is responsible for
managing the Budget and Treasury Office, overseeing the municipality’s finances and ensuring compliance with
public finance management legislation and council policies. Section 80 of the MFMA regulates the establishment of
the Budget and Treasury Office led by the CFO.
88. As part of National Treasury’s efforts to promote stability and accountability in municipalities, MFMA Budget Circular
No. 72 introduced additional requirements for approval of roll-over of unspent conditional grants. Municipalities
applying to retain conditional allocations committed to identifiable projects or requesting a roll-over in terms of
Section 22 of the 2015/16 DoRA must submit proof that the MM and CFO are permanently appointed.
89. Table 15 shows the number of acting MMs and CFOs as at 30 June 2019.
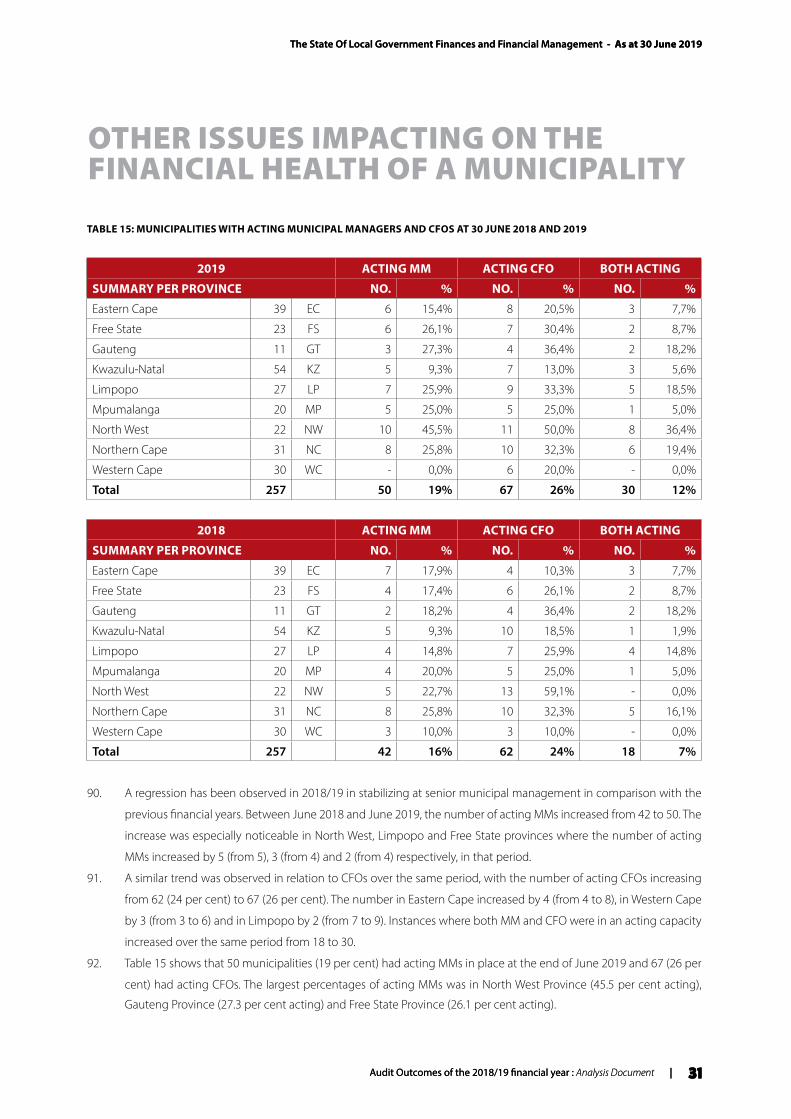
The State Of Local Government Finances and Financial Management - As at 30 June 2019
Audit Outcomes of the 2018/19 financial year : Analysis Document | 31
OTHER ISSUES IMPACTING ON THE FINANCIAL HEALTH OF A MUNICIPALITY
The State Of Local Government Finances and Financial Management - As at 30 June 2019
Audit Outcomes of the 2018/19 financial year : Analysis Document | 31
TABLE 15: MUNICIPALITIES WITH ACTING MUNICIPAL MANAGERS AND CFOS AT 30 JUNE 2018 AND 2019
2019 ACTING MM ACTING CFO BOTH ACTING
SUMMARY PER PROVINCE NO. % NO. % NO. %
Eastern Cape 39 EC 6 15,4% 8 20,5% 3 7,7%
Free State 23 FS 6 26,1% 7 30,4% 2 8,7%
Gauteng 11 GT 3 27,3% 4 36,4% 2 18,2%
Kwazulu-Natal 54 KZ 5 9,3% 7 13,0% 3 5,6%
Limpopo 27 LP 7 25,9% 9 33,3% 5 18,5%
Mpumalanga 20 MP 5 25,0% 5 25,0% 1 5,0%
North West 22 NW 10 45,5% 11 50,0% 8 36,4%
Northern Cape 31 NC 8 25,8% 10 32,3% 6 19,4%
Western Cape 30 WC - 0,0% 6 20,0% - 0,0%
Total 257 50 19% 67 26% 30 12%
2018 ACTING MM ACTING CFO BOTH ACTING
SUMMARY PER PROVINCE NO. % NO. % NO. %
Eastern Cape 39 EC 7 17,9% 4 10,3% 3 7,7%
Free State 23 FS 4 17,4% 6 26,1% 2 8,7%
Gauteng 11 GT 2 18,2% 4 36,4% 2 18,2%
Kwazulu-Natal 54 KZ 5 9,3% 10 18,5% 1 1,9%
Limpopo 27 LP 4 14,8% 7 25,9% 4 14,8%
Mpumalanga 20 MP 4 20,0% 5 25,0% 1 5,0%
North West 22 NW 5 22,7% 13 59,1% - 0,0%
Northern Cape 31 NC 8 25,8% 10 32,3% 5 16,1%
Western Cape 30 WC 3 10,0% 3 10,0% - 0,0%
Total 257 42 16% 62 24% 18 7%
90. A regression has been observed in 2018/19 in stabilizing at senior municipal management in comparison with the
previous financial years. Between June 2018 and June 2019, the number of acting MMs increased from 42 to 50. The
increase was especially noticeable in North West, Limpopo and Free State provinces where the number of acting
MMs increased by 5 (from 5), 3 (from 4) and 2 (from 4) respectively, in that period.
91. A similar trend was observed in relation to CFOs over the same period, with the number of acting CFOs increasing
from 62 (24 per cent) to 67 (26 per cent). The number in Eastern Cape increased by 4 (from 4 to 8), in Western Cape
by 3 (from 3 to 6) and in Limpopo by 2 (from 7 to 9). Instances where both MM and CFO were in an acting capacity
increased over the same period from 18 to 30.
92. Table 15 shows that 50 municipalities (19 per cent) had acting MMs in place at the end of June 2019 and 67 (26 per
cent) had acting CFOs. The largest percentages of acting MMs was in North West Province (45.5 per cent acting),
Gauteng Province (27.3 per cent acting) and Free State Province (26.1 per cent acting).
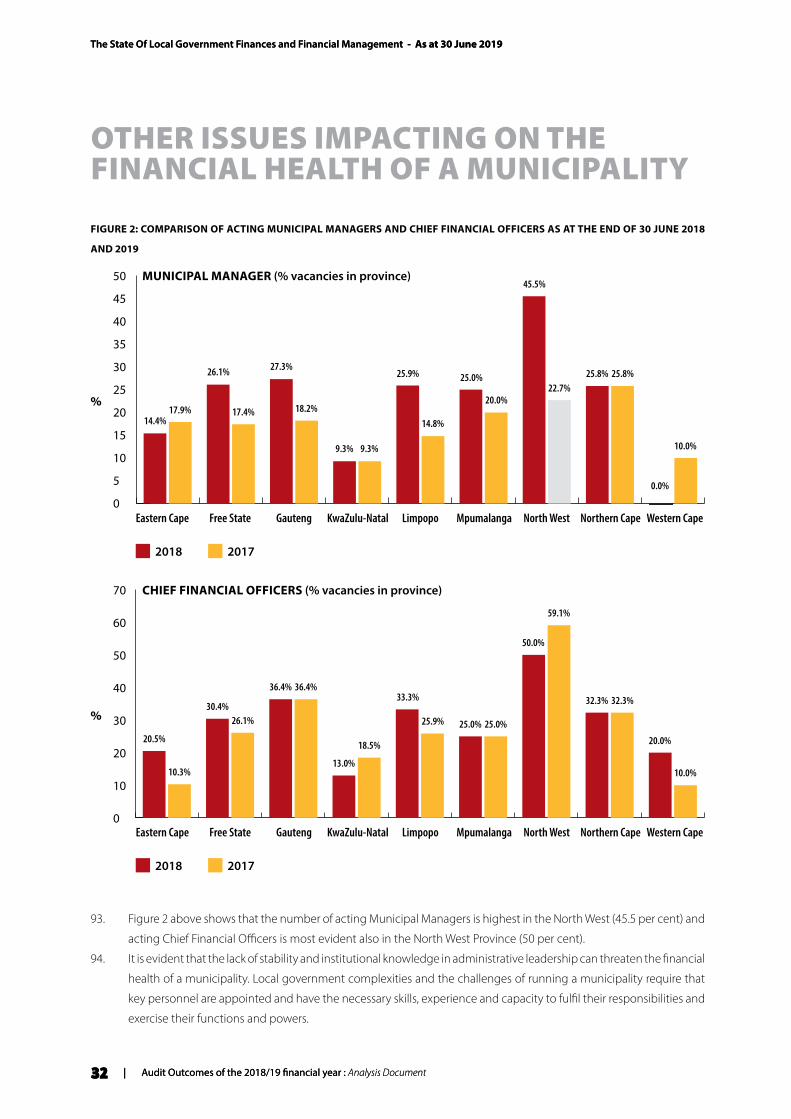
The State Of Local Government Finances and Financial Management - As at 30 June 2019
32 | Audit Outcomes of the 2018/19 financial year : Analysis Document
OTHER ISSUES IMPACTING ON THE FINANCIAL HEALTH OF A MUNICIPALITY
The State Of Local Government Finances and Financial Management - As at 30 June 2019
32 | Audit Outcomes of the 2018/19 financial year : Analysis Document
FIGURE 2: COMPARISON OF ACTING MUNICIPAL MANAGERS AND CHIEF FINANCIAL OFFICERS AS AT THE END OF 30 JUNE 2018
AND 2019
93. Figure 2 above shows that the number of acting Municipal Managers is highest in the North West (45.5 per cent) and
acting Chief Financial Officers is most evident also in the North West Province (50 per cent).
94. It is evident that the lack of stability and institutional knowledge in administrative leadership can threaten the financial
health of a municipality. Local government complexities and the challenges of running a municipality require that
key personnel are appointed and have the necessary skills, experience and capacity to fulfil their responsibilities and
exercise their functions and powers.
50
45
40
35
30
25
20
15
10
5
0Eastern Cape Free State Gauteng KwaZulu-Natal Limpopo Mpumalanga North West Northern Cape Western Cape
2018 2017
MUNICIPAL MANAGER (% vacancies in province)
14.4%17.9%
26.1% 25.9% 25.0% 25.8%
0.0%
25.8%
10.0%
45.5%
27.3%
9.3%
17.4%14.8%
20.0%22.7%
18.2%
9.3%
%
70
60
50
40
30
20
10
0Eastern Cape Free State Gauteng KwaZulu-Natal Limpopo Mpumalanga North West Northern Cape Western Cape
2018 2017
CHIEF FINANCIAL OFFICERS (% vacancies in province)
20.5%
10.3%
30.4%33.3%
25.0%
32.3%
20.0%
32.3%
10.0%
50.0%
36.4%
13.0%
26.1% 25.9% 25.0%
59.1%
36.4%
18.5%
%
The State Of Local Government Finances and Financial Management - As at 30 June 2019
Audit Outcomes of the 2018/19 financial year : Analysis Document | 33
OTHER ISSUES IMPACTING ON THE FINANCIAL HEALTH OF A MUNICIPALITY
The State Of Local Government Finances and Financial Management - As at 30 June 2019
Audit Outcomes of the 2018/19 financial year : Analysis Document | 33
GOVERNANCE: SUSPENDED MUNICIPAL OFFICIALS
95. Due to various accounts of misconduct these municipal officials gets suspended. What is of concern is the continued
full payment of salaries to these officials even after a number of years that they are on suspension.
96. The Department of Cooperative Governance indicated that there are about 35 managers in the local government
sphere that have been suspended in the 2019/20 period. Of this, 21 of the suspended are municipal managers.
97. Further analysis shows that:
• In the Eastern Cape, five municipal managers have been suspended. These included the City Managers of the
Nelson Mandela Bay Metro, Sakhisizwe Local Municipality, Ingquza Local Municipality, Enoch Mgijima Local
Municipality and O.R Tambo District Municipality;
• Municipal managers were suspended in the Free State at Nala, Dihlabeng, Metsimaholo and Moqhaka Local
Municipalities;
• In Gauteng there were two municipalities (West Rand District Municipality and Merafong City Local
Municipality) whose MMs are suspended but receiving full pay;
• Three municipal managers and one senior manager have been suspended in Limpopo. All four are still being
paid. They were working at Ephraim Mogale, Elias Motsoaledi and the Collins Chabane Local Municipalities;
• In KwaZulu-Natal four municipal managers and two senior officials have been suspended. The municipal
managers of the Umzinyathi District Municipality as well as the Richmond, Abaqulusi and Emadlangeni Local
Municipalities were suspended on full pay. The two suspended officials worked at the Umzinyathi District
Municipality and Emadlangeni Local Municipality;
• In Mpumalanga, three senior officials from the Msukaligwa, Dr Pixley ka Seme and Dr JS Moroka Local
Municipalities were suspended on full pay;
• Two senior officials of the Dikgatlong Local Municipality were suspended while the municipal manager and
a senior official of the Sol Plaatjie Municipality were suspended on full pay in the Northern Cape;
• In the Western Cape, the municipal manager of the Knysna Local Municipality was suspended alongside two
senior officials of the George and Cederberg Municipalities. All officials were suspended on full pay; and
• Four municipal officials were suspended in the North West.
SIGNIFICANT ELECTRICITY AND WATER LOSSES
98. Table 16 below shows the extent of water and electricity losses by metros at 30 June 2019. No reliable comparative
data is yet available for other municipalities. It should be noted that a degree of technical and commercial losses is
inherent to water and electricity transmission and distribution systems. However, the extent of these losses is also
affected by the level of a municipalities’ spending on repairs and maintenance, theft of services and the effectiveness
of its metering and credit control procedures.
99. On 30 June 2019, metropolitan municipalities recorded water and electricity losses amounting to R5.2 billion or an
average of 32.8 per cent and R7.3 billion or an average 14.8 per cent respectively. During the 2018/19 financial year,
water losses increased significantly, by R1 billion. Electricity losses increased by R391.5 million, from R6.9 billion in
2017/18 to R7.3 billion in 2018/19.
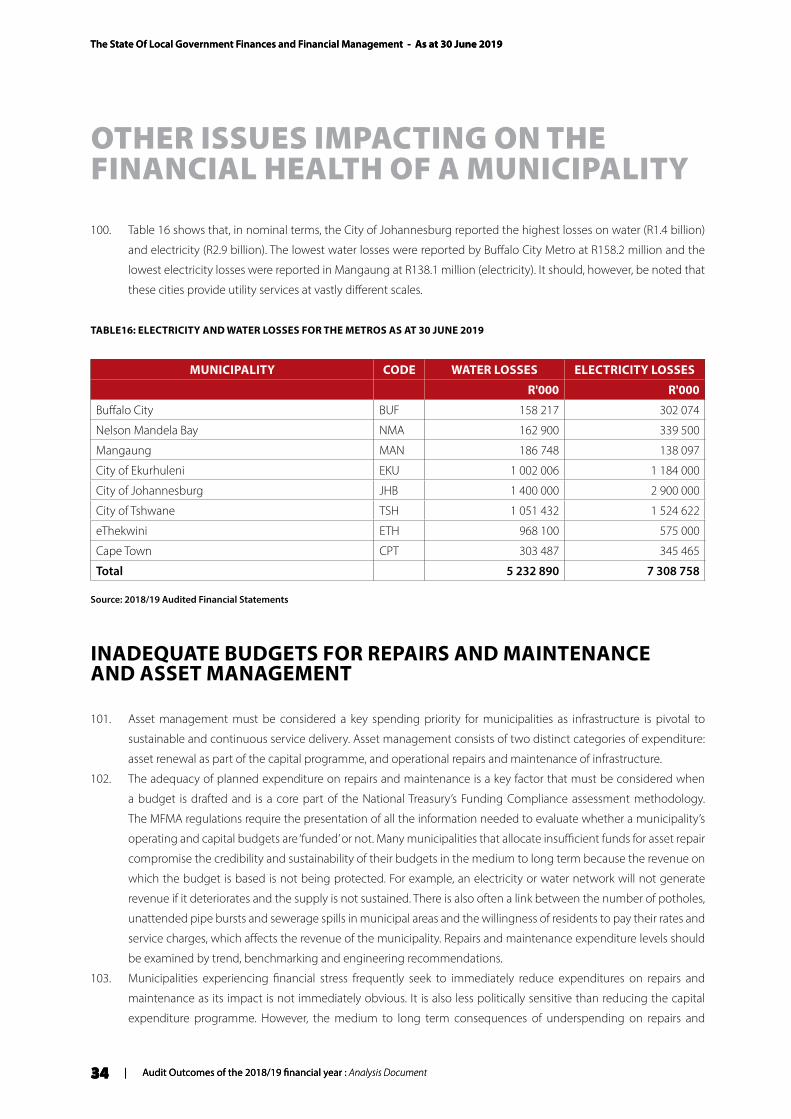
The State Of Local Government Finances and Financial Management - As at 30 June 2019
34 | Audit Outcomes of the 2018/19 financial year : Analysis Document
OTHER ISSUES IMPACTING ON THE FINANCIAL HEALTH OF A MUNICIPALITY
The State Of Local Government Finances and Financial Management - As at 30 June 2019
34 | Audit Outcomes of the 2018/19 financial year : Analysis Document
100. Table 16 shows that, in nominal terms, the City of Johannesburg reported the highest losses on water (R1.4 billion)
and electricity (R2.9 billion). The lowest water losses were reported by Buffalo City Metro at R158.2 million and the
lowest electricity losses were reported in Mangaung at R138.1 million (electricity). It should, however, be noted that
these cities provide utility services at vastly different scales.
TABLE16: ELECTRICITY AND WATER LOSSES FOR THE METROS AS AT 30 JUNE 2019
MUNICIPALITY CODE WATER LOSSES ELECTRICITY LOSSES
R'000 R'000
Buffalo City BUF 158 217 302 074
Nelson Mandela Bay NMA 162 900 339 500
Mangaung MAN 186 748 138 097
City of Ekurhuleni EKU 1 002 006 1 184 000
City of Johannesburg JHB 1 400 000 2 900 000
City of Tshwane TSH 1 051 432 1 524 622
eThekwini ETH 968 100 575 000
Cape Town CPT 303 487 345 465
Total 5 232 890 7 308 758
Source: 2018/19 Audited Financial Statements
INADEQUATE BUDGETS FOR REPAIRS AND MAINTENANCE AND ASSET MANAGEMENT
101. Asset management must be considered a key spending priority for municipalities as infrastructure is pivotal to
sustainable and continuous service delivery. Asset management consists of two distinct categories of expenditure:
asset renewal as part of the capital programme, and operational repairs and maintenance of infrastructure.
102. The adequacy of planned expenditure on repairs and maintenance is a key factor that must be considered when
a budget is drafted and is a core part of the National Treasury’s Funding Compliance assessment methodology.
The MFMA regulations require the presentation of all the information needed to evaluate whether a municipality’s
operating and capital budgets are ‘funded’ or not. Many municipalities that allocate insufficient funds for asset repair
compromise the credibility and sustainability of their budgets in the medium to long term because the revenue on
which the budget is based is not being protected. For example, an electricity or water network will not generate
revenue if it deteriorates and the supply is not sustained. There is also often a link between the number of potholes,
unattended pipe bursts and sewerage spills in municipal areas and the willingness of residents to pay their rates and
service charges, which affects the revenue of the municipality. Repairs and maintenance expenditure levels should
be examined by trend, benchmarking and engineering recommendations.
103. Municipalities experiencing financial stress frequently seek to immediately reduce expenditures on repairs and
maintenance as its impact is not immediately obvious. It is also less politically sensitive than reducing the capital
expenditure programme. However, the medium to long term consequences of underspending on repairs and
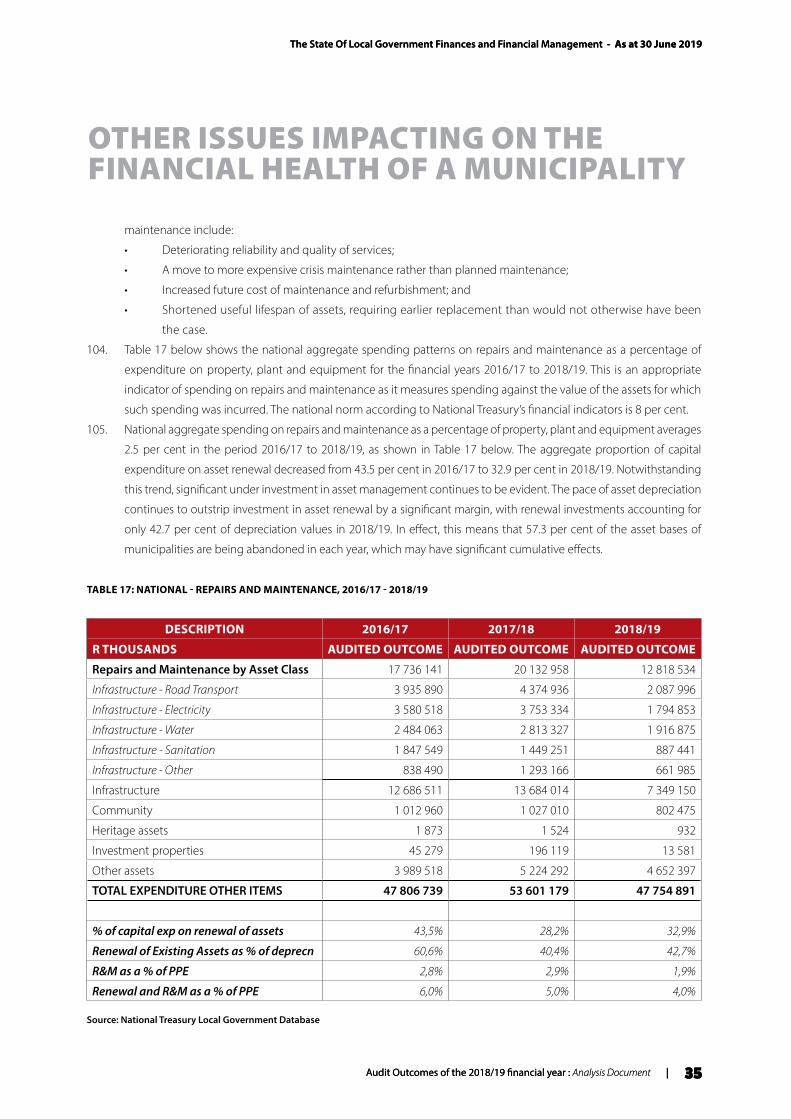
The State Of Local Government Finances and Financial Management - As at 30 June 2019
Audit Outcomes of the 2018/19 financial year : Analysis Document | 35
OTHER ISSUES IMPACTING ON THE FINANCIAL HEALTH OF A MUNICIPALITY
The State Of Local Government Finances and Financial Management - As at 30 June 2019
Audit Outcomes of the 2018/19 financial year : Analysis Document | 35
maintenance include:
• Deteriorating reliability and quality of services;
• A move to more expensive crisis maintenance rather than planned maintenance;
• Increased future cost of maintenance and refurbishment; and
• Shortened useful lifespan of assets, requiring earlier replacement than would not otherwise have been
the case.
104. Table 17 below shows the national aggregate spending patterns on repairs and maintenance as a percentage of
expenditure on property, plant and equipment for the financial years 2016/17 to 2018/19. This is an appropriate
indicator of spending on repairs and maintenance as it measures spending against the value of the assets for which
such spending was incurred. The national norm according to National Treasury’s financial indicators is 8 per cent.
105. National aggregate spending on repairs and maintenance as a percentage of property, plant and equipment averages
2.5 per cent in the period 2016/17 to 2018/19, as shown in Table 17 below. The aggregate proportion of capital
expenditure on asset renewal decreased from 43.5 per cent in 2016/17 to 32.9 per cent in 2018/19. Notwithstanding
this trend, significant under investment in asset management continues to be evident. The pace of asset depreciation
continues to outstrip investment in asset renewal by a significant margin, with renewal investments accounting for
only 42.7 per cent of depreciation values in 2018/19. In effect, this means that 57.3 per cent of the asset bases of
municipalities are being abandoned in each year, which may have significant cumulative effects.
TABLE 17: NATIONAL - REPAIRS AND MAINTENANCE, 2016/17 - 2018/19
DESCRIPTION 2016/17 2017/18 2018/19
R THOUSANDS AUDITED OUTCOME AUDITED OUTCOME AUDITED OUTCOME
Repairs and Maintenance by Asset Class 17 736 141 20 132 958 12 818 534
Infrastructure - Road Transport 3 935 890 4 374 936 2 087 996
Infrastructure - Electricity 3 580 518 3 753 334 1 794 853
Infrastructure - Water 2 484 063 2 813 327 1 916 875
Infrastructure - Sanitation 1 847 549 1 449 251 887 441
Infrastructure - Other 838 490 1 293 166 661 985
Infrastructure 12 686 511 13 684 014 7 349 150
Community 1 012 960 1 027 010 802 475
Heritage assets 1 873 1 524 932
Investment properties 45 279 196 119 13 581
Other assets 3 989 518 5 224 292 4 652 397
TOTAL EXPENDITURE OTHER ITEMS 47 806 739 53 601 179 47 754 891
% of capital exp on renewal of assets 43,5% 28,2% 32,9%
Renewal of Existing Assets as % of deprecn 60,6% 40,4% 42,7%
R&M as a % of PPE 2,8% 2,9% 1,9%
Renewal and R&M as a % of PPE 6,0% 5,0% 4,0%
Source: National Treasury Local Government Database
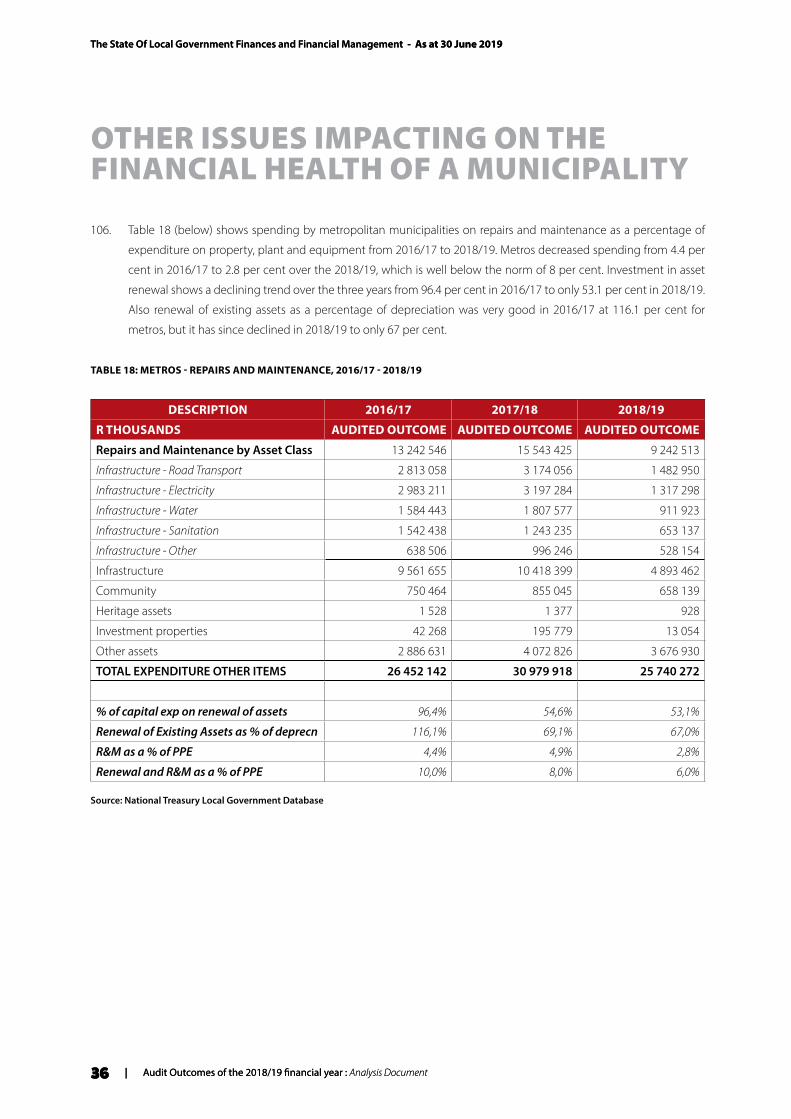
The State Of Local Government Finances and Financial Management - As at 30 June 2019
36 | Audit Outcomes of the 2018/19 financial year : Analysis Document
OTHER ISSUES IMPACTING ON THE FINANCIAL HEALTH OF A MUNICIPALITY
The State Of Local Government Finances and Financial Management - As at 30 June 2019
36 | Audit Outcomes of the 2018/19 financial year : Analysis Document
106. Table 18 (below) shows spending by metropolitan municipalities on repairs and maintenance as a percentage of
expenditure on property, plant and equipment from 2016/17 to 2018/19. Metros decreased spending from 4.4 per
cent in 2016/17 to 2.8 per cent over the 2018/19, which is well below the norm of 8 per cent. Investment in asset
renewal shows a declining trend over the three years from 96.4 per cent in 2016/17 to only 53.1 per cent in 2018/19.
Also renewal of existing assets as a percentage of depreciation was very good in 2016/17 at 116.1 per cent for
metros, but it has since declined in 2018/19 to only 67 per cent.
TABLE 18: METROS - REPAIRS AND MAINTENANCE, 2016/17 - 2018/19
DESCRIPTION 2016/17 2017/18 2018/19
R THOUSANDS AUDITED OUTCOME AUDITED OUTCOME AUDITED OUTCOME
Repairs and Maintenance by Asset Class 13 242 546 15 543 425 9 242 513
Infrastructure - Road Transport 2 813 058 3 174 056 1 482 950
Infrastructure - Electricity 2 983 211 3 197 284 1 317 298
Infrastructure - Water 1 584 443 1 807 577 911 923
Infrastructure - Sanitation 1 542 438 1 243 235 653 137
Infrastructure - Other 638 506 996 246 528 154
Infrastructure 9 561 655 10 418 399 4 893 462
Community 750 464 855 045 658 139
Heritage assets 1 528 1 377 928
Investment properties 42 268 195 779 13 054
Other assets 2 886 631 4 072 826 3 676 930
TOTAL EXPENDITURE OTHER ITEMS 26 452 142 30 979 918 25 740 272
% of capital exp on renewal of assets 96,4% 54,6% 53,1%
Renewal of Existing Assets as % of deprecn 116,1% 69,1% 67,0%
R&M as a % of PPE 4,4% 4,9% 2,8%
Renewal and R&M as a % of PPE 10,0% 8,0% 6,0%
Source: National Treasury Local Government Database
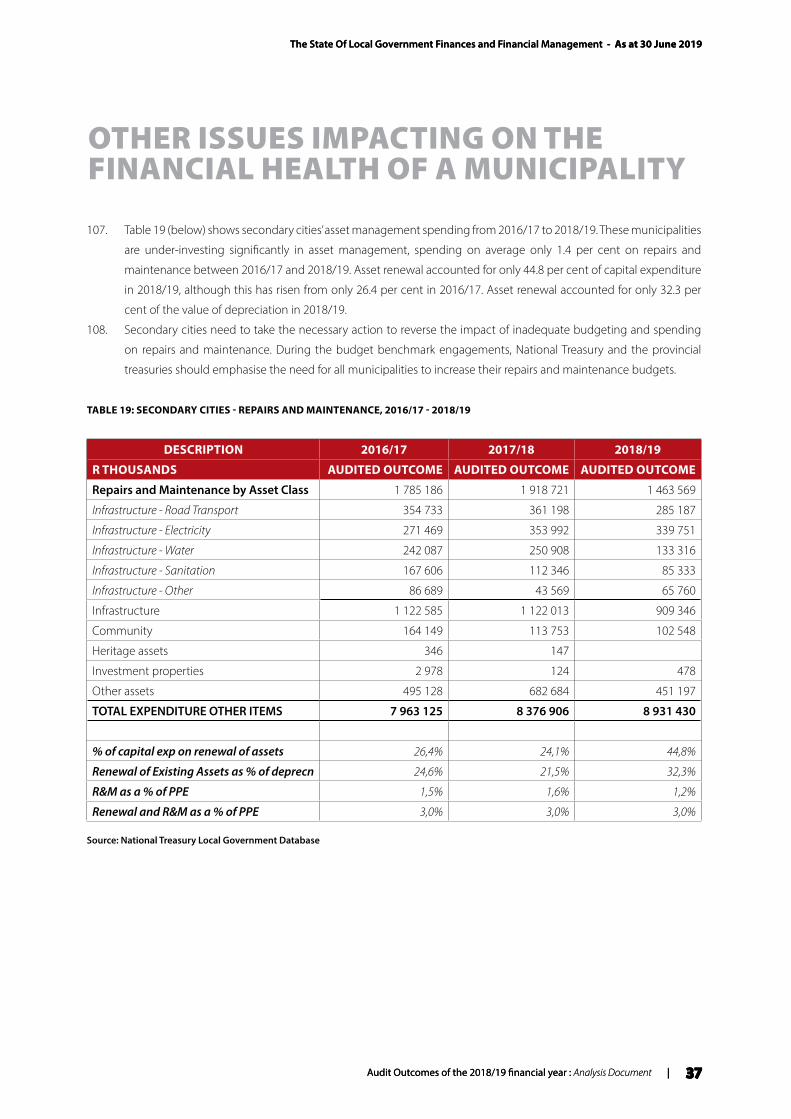
The State Of Local Government Finances and Financial Management - As at 30 June 2019
Audit Outcomes of the 2018/19 financial year : Analysis Document | 37
OTHER ISSUES IMPACTING ON THE FINANCIAL HEALTH OF A MUNICIPALITY
The State Of Local Government Finances and Financial Management - As at 30 June 2019
Audit Outcomes of the 2018/19 financial year : Analysis Document | 37
107. Table 19 (below) shows secondary cities’ asset management spending from 2016/17 to 2018/19. These municipalities
are under-investing significantly in asset management, spending on average only 1.4 per cent on repairs and
maintenance between 2016/17 and 2018/19. Asset renewal accounted for only 44.8 per cent of capital expenditure
in 2018/19, although this has risen from only 26.4 per cent in 2016/17. Asset renewal accounted for only 32.3 per
cent of the value of depreciation in 2018/19.
108. Secondary cities need to take the necessary action to reverse the impact of inadequate budgeting and spending
on repairs and maintenance. During the budget benchmark engagements, National Treasury and the provincial
treasuries should emphasise the need for all municipalities to increase their repairs and maintenance budgets.
TABLE 19: SECONDARY CITIES - REPAIRS AND MAINTENANCE, 2016/17 - 2018/19
DESCRIPTION 2016/17 2017/18 2018/19
R THOUSANDS AUDITED OUTCOME AUDITED OUTCOME AUDITED OUTCOME
Repairs and Maintenance by Asset Class 1 785 186 1 918 721 1 463 569
Infrastructure - Road Transport 354 733 361 198 285 187
Infrastructure - Electricity 271 469 353 992 339 751
Infrastructure - Water 242 087 250 908 133 316
Infrastructure - Sanitation 167 606 112 346 85 333
Infrastructure - Other 86 689 43 569 65 760
Infrastructure 1 122 585 1 122 013 909 346
Community 164 149 113 753 102 548
Heritage assets 346 147
Investment properties 2 978 124 478
Other assets 495 128 682 684 451 197
TOTAL EXPENDITURE OTHER ITEMS 7 963 125 8 376 906 8 931 430
% of capital exp on renewal of assets 26,4% 24,1% 44,8%
Renewal of Existing Assets as % of deprecn 24,6% 21,5% 32,3%
R&M as a % of PPE 1,5% 1,6% 1,2%
Renewal and R&M as a % of PPE 3,0% 3,0% 3,0%
Source: National Treasury Local Government Database
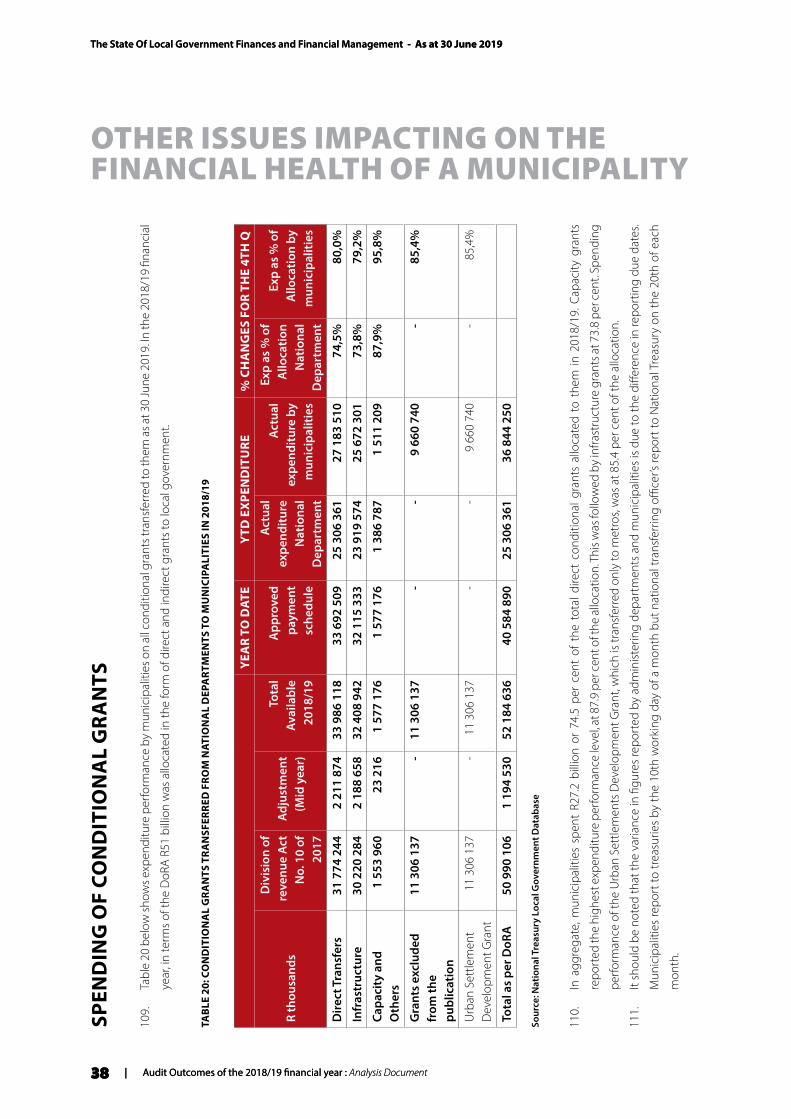
The State Of Local Government Finances and Financial Management - As at 30 June 2019
38 | Audit Outcomes of the 2018/19 financial year : Analysis Document
OTHER ISSUES IMPACTING ON THE FINANCIAL HEALTH OF A MUNICIPALITY
The State Of Local Government Finances and Financial Management - As at 30 June 2019
38 | Audit Outcomes of the 2018/19 financial year : Analysis Document
SPEN
DIN
G O
F CO
ND
ITIO
NA
L G
RA
NTS
109.
Ta
ble
20 b
elow
show
s exp
endi
ture
per
form
ance
by
mun
icip
aliti
es o
n al
l con
ditio
nal g
rant
s tra
nsfe
rred
to th
em a
s at 3
0 Ju
ne 2
019.
In th
e 20
18/1
9 fin
anci
al
year
, in
term
s of t
he D
oRA
R51
billi
on w
as a
lloca
ted
in th
e fo
rm o
f dire
ct a
nd in
dire
ct g
rant
s to
loca
l gov
ernm
ent.
TAB
LE 2
0: C
ON
DIT
ION
AL
GR
AN
TS T
RA
NSF
ERRE
D F
ROM
NAT
ION
AL
DEP
ART
MEN
TS T
O M
UN
ICIP
ALI
TIES
IN 2
018/
19
YEA
R TO
DAT
EY
TD E
XPE
ND
ITU
RE%
CH
AN
GES
FO
R TH
E 4T
H Q
R th
ousa
nds
Div
isio
n of
re
venu
e A
ct
No.
10
of
2017
Adj
ustm
ent
(Mid
yea
r)
Tota
l Av
aila
ble
2018
/19
App
rove
d pa
ymen
t sc
hedu
le
Act
ual
expe
nditu
re
Nat
iona
l D
epar
tmen
t
Act
ual
expe
nditu
re b
y m
unic
ipal
ities
Exp
as %
of
Allo
catio
n N
atio
nal
Dep
artm
ent
Exp
as %
of
Allo
catio
n by
m
unic
ipal
ities
Dire
ct T
rans
fers
31
774
244
2 21
1 87
4 33
986
118
33
692
509
2
5 30
6 36
1 2
7 18
3 51
0 74
,5%
80,0
%
Infr
astr
uctu
re 3
0 22
0 28
4 2
188
658
32
408
942
32
115
333
23
919
574
25
672
301
73,8
%79
,2%
Capa
city
and
O
ther
s 1
553
960
2
3 21
6 1
577
176
1
577
176
1
386
787
1
511
209
87
,9%
95,8
%
Gra
nts
excl
uded
fr
om th
e pu
blic
atio
n
11
306
137
- 1
1 30
6 13
7 -
- 9
660
740
-
85,4
%
Urb
an S
ettle
men
t D
evel
opm
ent G
rant
11
306
137
- 1
1 30
6 13
7 -
- 9
660
740
-
85,4
%
Tota
l as
per D
oRA
50
990
106
1 1
94 5
30
52
184
636
40
584
890
25
306
361
36
844
250
Sour
ce: N
atio
nal T
reas
ury
Loca
l Gov
ernm
ent D
atab
ase
110.
In
agg
rega
te, m
unic
ipal
ities
spe
nt R
27.2
bill
ion
or 7
4.5
per
cent
of
the
tota
l dire
ct c
ondi
tiona
l gra
nts
allo
cate
d to
the
m in
201
8/19
. Cap
acity
gra
nts
repo
rted
the
high
est e
xpen
ditu
re p
erfo
rman
ce le
vel, a
t 87.
9 pe
r cen
t of t
he a
lloca
tion.
Thi
s was
follo
wed
by
infra
stru
ctur
e gr
ants
at 7
3.8
per c
ent.
Spen
ding
perfo
rman
ce o
f the
Urb
an S
ettle
men
ts D
evel
opm
ent G
rant
, whi
ch is
tran
sfer
red
only
to m
etro
s, w
as a
t 85.
4 pe
r cen
t of t
he a
lloca
tion.
111.
It
shou
ld b
e no
ted
that
the
varia
nce
in fi
gure
s re
port
ed b
y ad
min
ister
ing
depa
rtm
ents
and
mun
icip
aliti
es is
due
to th
e di
ffere
nce
in re
port
ing
due
date
s.
Mun
icip
aliti
es re
port
to tr
easu
ries
by th
e 10
th w
orki
ng d
ay o
f a m
onth
but
nat
iona
l tra
nsfe
rrin
g offi
cer’s
repo
rt to
Nat
iona
l Tre
asur
y on
the
20th
of e
ach
mon
th.
The State Of Local Government Finances and Financial Management - As at 30 June 2019
Audit Outcomes of the 2018/19 financial year : Analysis Document | 39
OTHER ISSUES IMPACTING ON THE FINANCIAL HEALTH OF A MUNICIPALITY
The State Of Local Government Finances and Financial Management - As at 30 June 2019
Audit Outcomes of the 2018/19 financial year : Analysis Document | 39
FUNDED BUDGETS AS PER THE AUDIT OUTCOMES
112. There was a negligible decline of municipalities with unfunded budgets from 140 in 2017/18 to 139 municipalities in
2018/19. The main reason for the unfunded budgets is that municipalities budget for deficits with an increase inability
to maintain payments to creditors which compromises service delivery and threatens their fiscal sustainability.
The State Of Local Government Finances and Financial Management - As at 30 June 2019
40 | Audit Outcomes of the 2018/19 financial year : Analysis Document
The State Of Local Government Finances and Financial Management - As at 30 June 2019
40 | Audit Outcomes of the 2018/19 financial year : Analysis Document
MUNICIPALITIES IN FINANCIAL DISTRESS
113. Municipalities are responsible for their own fiscal sustainability. Section 135 of the MFMA assigns municipalities the
primary responsibility to avoid, identify and resolve financial problems that they may experience. Section 154(1) of
the Constitution requires the national government and provincial governments, by legislative and other measures,
to “support and strengthen the capacity of municipalities to manage their own affairs, to exercise their powers and
to perform their functions.” It is only once these measures have failed to resolve challenges facing a municipality that
other spheres of government are empowered to intervene in the affairs of a municipality.
114. The National Treasury, in exercising its oversight role in relation to municipalities, monitors the fiscal health and
sustainability of the local government sphere and individual municipalities. This includes evaluating and assisting
municipalities that are currently, or are likely to, experience financial distress.
115. Financial distress in this context is defined as the sustained inability of a municipality to fund the delivery of basic
public goods and other requirements as per their constitutional mandate. This has far reaching implications for the
political, social and economic state of affairs in a municipality.
116. National Treasury has developed a diagnostic tool for fiscal health. It should be noted that this tool simply reports
fiscal distress when it has occurred, instead of predicting it. It also does not capture the service delivery side of
fiscal distress in a municipality. Although valuable for oversight purposes, it is not the only instrument necessary to
proactively prevent the occurrence or mitigate the impact of the financial distress.
117. Annexure A1 lists the 163 municipalities (an increase from 125 municipalities as reported in the 2017/18 State of
Local Government Finances and Financial Management Report) that are evaluated to be experiencing some form
of financial distress in 2018/19, based on the financial health assessment. Annexure A1 also provides a consolidated
analysis of the 257 municipalities’ audit outcomes, those identified as financially distressed and trends for the 2018/19
financial year. The list in annexure A1 shows that four (4) of the 20 municipalities that received unqualified audit
opinion with no findings, were classified as financially distressed. Thirty-eight of the 91 municipalities that received
unqualified audit report with findings, were classified as financially distressed. This suggests that the result of the
audit outcome is not on its own a reflection of good financial health, nor is it intended to be. An audit opinion relates
to whether the financial statements give a fair and accurate account of the municipalities finances. If they accurately
report huge debts, they will receive an unqualified audit opinion. Of the 83 municipalities that received qualified
audit opinion, 65 were financially distressed. Of the 33 municipalities that received disclaimers, 30 of them were
financially distressed. All two 10 municipalities that received adverse opinion were financially distressed. Twenty-four
of the 28 municipalities whose audit opinions are still outstanding are financially distressed.
MANIFESTATIONS OF FINANCIAL DISTRESS
118. Liquidity challenges are the most common manifestation of financial distress in a municipality. Municipalities with
liquidity challenges are failing at effectively delivering services, billing for services and collecting the revenue due.
Consequently, outstanding debtors are increasing, and municipalities are not able to maintain positive cash flows to
pay creditors within the thirty days’ timeframe as legally prescribed.
119. Outstanding consumer debt owed to municipalities, as reported in terms of 2018/19 audit outcomes, has increased
significantly since 2011. Currently, the outstanding municipal debt (R132.9 billion as per the audited AFS for
2018/19 (R115.8 billion in 2017/18)) exceeds the total amount allocated to local government through direct and
The State Of Local Government Finances and Financial Management - As at 30 June 2019
Audit Outcomes of the 2018/19 financial year : Analysis Document | 41
MUNICIPALITIES IN FINANCIAL DISTRESS
The State Of Local Government Finances and Financial Management - As at 30 June 2019
Audit Outcomes of the 2018/19 financial year : Analysis Document | 41
indirect grants from the national fiscus (R114.9 billion). While households continue to be the largest contributor
to outstanding municipal debt comprising 64.8 per cent of the total, there is wide-spread non-payment across all
customer segments.
120. Municipalities in turn owe creditors R137.9 billion (audited AFS, 2018/19) (R109.8 billion in 2017/18). This includes all
categories of creditors and indicates that many municipalities are not paying creditors within the required 30-day
period (as per sections 65(1) and (2)(e) of the MFMA). Although it is the monies owed to Eskom and Water Boards
that has attracted most attention, cases of non-payment of other municipal creditors and suppliers have resulted in
attachment and sale-in-execution of municipal assets by the courts. In some cases, this can further undermine the
ability of the municipality to deliver basic services.
CAUSES AND EFFECTS OF LOCAL GOVERNMENT FINANCE FAILURES
121. When diagnosing the reasons that contribute to the municipal liquidity challenges it is prudent to holistically
examine the organisational and operational management inefficiencies. Among the audit issues raised with respect
to municipal financial management inefficiencies are weak internal controls; weaknesses and non-compliance to
policies and procedures; and fruitless and wasteful, unauthorised and irregular expenditure.
122. Causes of financial distress can be classified into:
• Structural (or fixed) factors, including the erosion or interruption of the tax base, decrease in population
size, residents’ socio-economic status, government resource allocation, loss of financial independence (e.g.
through reliance on government transfers), and decline in economic productivity. Structural factors are
known to be the hardest to resolve, as they are sometimes outside the municipality’s control;
• Organisational factors including mismanagement, transparency and labour unions power in public
administration and other political factors. Organisational factors are relatively easier to resolve because
they are often internal to the organisation. Research shows that mismanagement, one of the organisational
factors, is a major cause of fiscal distress; and
• Hybrid factors, which relate to intergovernmental relations and coordination. Sometimes grey areas exist in
intergovernmental relations, especially regarding roles, responsibility and accountability.
123. When National Treasury engaged the defaulting municipalities, the following issues were tabled for consideration as
the root causes that impact on their ability to operate:
• Several municipalities with poor cash flows have adopted unfunded budgets. Unrealistic budgeted revenue
collection levels are not realised while operating costs (such as employee related costs) remain high with no
effort made to contain expenditure particularly on non-priority spending has led to persistent negative cash
balances;
• Weak management of the overall revenue value chain, including tariff setting for trading services,
administering the property transfer process, and misalignment of tariffs, billings and credit control measures
with indigent policies. The local government equitable share is mainly used to fund operating costs rather
than utilised for the purpose of service delivery targeting the poorest of the poor;
• Weak internal controls, risk management and supply chain management (SCM) inefficiencies resulting in
poor audit outcomes and wasteful expenditure;
The State Of Local Government Finances and Financial Management - As at 30 June 2019
42 | Audit Outcomes of the 2018/19 financial year : Analysis Document
MUNICIPALITIES IN FINANCIAL DISTRESS
The State Of Local Government Finances and Financial Management - As at 30 June 2019
42 | Audit Outcomes of the 2018/19 financial year : Analysis Document
• Historically inadequate budget allocation for repairs and maintenance and asset management have
weakened revenue potential;
• Limited evidence based financial management such as cash flow management;
• Inefficient management of electricity demand means that penalty charges are unnecessarily incurred
(fruitless and wasteful expenditure);
• Payment arrangements negotiated with creditors are not subsequently provided for in the municipal budget.
It may be argued that the signed payment arrangements are merely a case of malicious compliance; and
• Inadequate human resources capacity and a shortage of technical skills.
124. In most cases weak municipal leadership underpins these issues. Political instability, poor administrative governance
and weak financial management remains the common denominator and at the heart of the problem impacting on the municipality’s ability to deliver services as per their mandate. Key issues include:
• Ineffective councils and governance structures that contributes to weak fiscal discipline and consequently
financial mismanagement;
• An inappropriate or ineffective political-administrative interface within a municipality, with councillors
irregularly involved in administrative decisions or action, and administrators often participating in political or
factional activities;
• Vacant positions for municipal managers or appointment of temporary incumbents: accountability is
notably weaker at municipalities where the position of municipal manager is vacant or occupied by an
“acting” incumbent, as an “acting” municipal manager is less inclined to take decisions and responsibility for
actions; and
• The absence of a suitably competent CFO: this presents a risk to sound financial management as it provides opportunities for the flouting of internal controls, non-compliance to the legal framework and general mismanagement of public funds.
125. The AG has also identified key causative factors for financial distress as the lack (or total absence) of leadership
commitment, and a management system that is almost completely devoid of consequences for poor performance
and wrong-doing.
The State Of Local Government Finances and Financial Management - As at 30 June 2019
Audit Outcomes of the 2018/19 financial year : Analysis Document | 43
MUNICIPALITIES IN FINANCIAL DISTRESS
The State Of Local Government Finances and Financial Management - As at 30 June 2019
Audit Outcomes of the 2018/19 financial year : Analysis Document | 43
SUPPORT AND REFORMS TO MUNICIPALITIES PROVIDED BY THE NATIONAL TREASURY
126. South Africa’s local government financial management system has undergone a number of reforms and there has
been considerable progress. It is internationally acknowledged that South Africa has some exceptional financial
management legislation. National government has introduced changes to the local government equitable share
formula, announced multi-year allocations, and other reforms to bring predictability and certainty into the fiscal
system. However, there is still a long way to go before all 257 municipalities are fully functional and sustainable. A
multi-pronged approach that includes addressing operational inefficiencies, incompetence and governance failures
is required to ensure sound fiscal discipline in the longer term.
127. The financial management reform agenda for local government is an evolutionary process and needs to be nurtured
to maturity. Government has initiated a number of capacity building initiatives to support municipalities in achieving
this, including:
a) Implementing Minimum Competency Levels: Prescribed minimum competency levels were introduced
13 years ago for Municipal Managers, Chief Financial Officers (CFOs) and Chief Executive Officers (CEOs) of
municipal entities where they exist, Senior Managers, SCM managers and Middle Managers including other
officials dealing with financial management (FM) and supply chain management (SCM). Table 21 below
summarises the provincial patterns of enrolment in the Minimum Competency Levels programme across
the regulated positions. Out of 2 747 municipal officials, only 1 565 officials meet the minimum competency
levels as at 31 January 2020. Out of 248 CFOs8, only 128 (51.6 per cent) have achieved minimum competency
levels. 53.7 per cent of senior managers have achieved minimum competency levels.
However, please note that the amendment to the regulation, through Government Gazette No. 41996 of 26
October 2018, allows municipalities to appoint officials that have not completed the required unit standards
and this affects the number of officials compliant with the regulation since 2007. The officials are given 18
months from day of appointment to obtain the unit standards.
Table 21: Minimum competency levels among senior municipal officials as at 30 June 2019
TABLE 21: NATIONAL STATUS OF THE MINIMUM COMPETENCY LEVELS BY POSITION
8 This list includes CFOs from the Municipal Entities
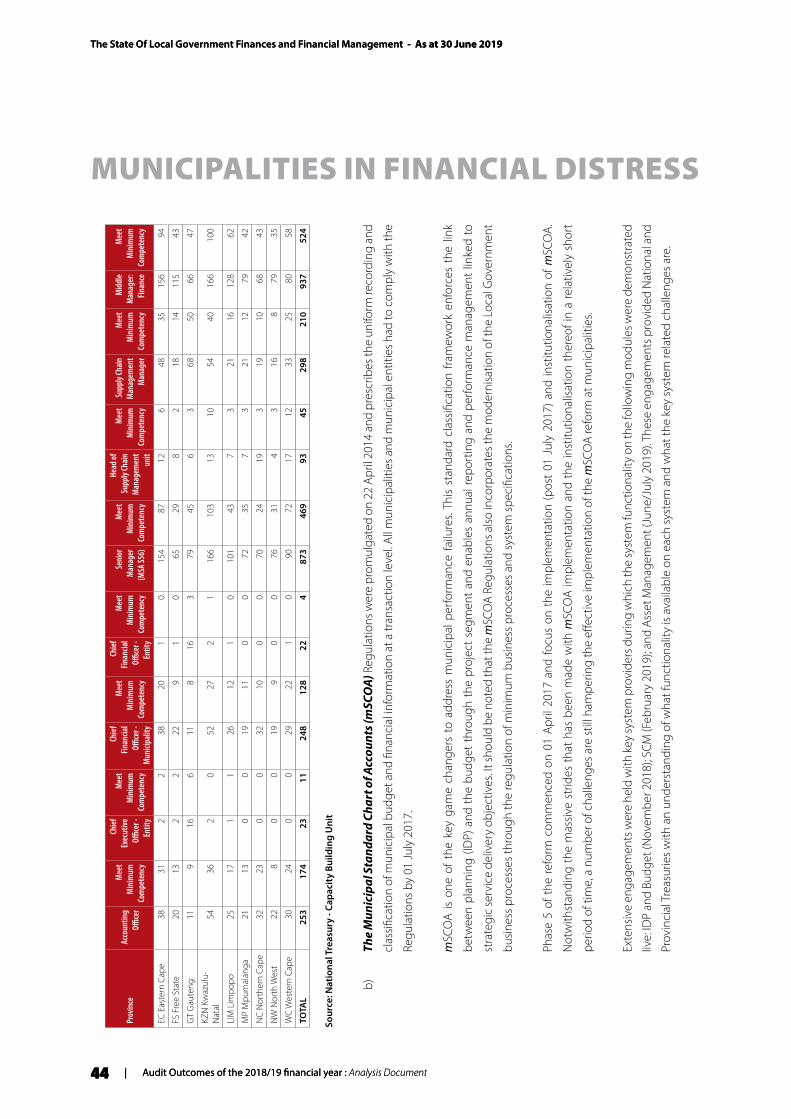
The State Of Local Government Finances and Financial Management - As at 30 June 2019
44 | Audit Outcomes of the 2018/19 financial year : Analysis Document
MUNICIPALITIES IN FINANCIAL DISTRESS
The State Of Local Government Finances and Financial Management - As at 30 June 2019
44 | Audit Outcomes of the 2018/19 financial year : Analysis Document
Prov
ince
Acco
untin
g Offi
cer
Mee
t M
inim
um
Com
pete
ncy
Chief
Ex
ecut
ive
Office
r -
Entit
y
Mee
t M
inim
um
Com
pete
ncy
Chief
Fin
ancia
l Offi
cer -
M
unici
palit
y
Mee
t M
inim
um
Com
pete
ncy
Chief
Fin
ancia
l Offi
cer -
En
tity
Mee
t M
inim
um
Com
pete
ncy
Seni
or
Man
ager
(M
SA S5
6)
Mee
t M
inim
um
Com
pete
ncy
Head
of
Supp
ly Ch
ain
Man
agem
ent
unit
Mee
t M
inim
um
Com
pete
ncy
Supp
ly Ch
ain
Man
agem
ent
Man
ager
Mee
t M
inim
um
Com
pete
ncy
Mid
dle
Man
ager
: Fin
ance
Mee
t M
inim
um
Com
pete
ncy
EC E
aste
rn C
ape
3831
22
3820
10
154
8712
648
3515
694
FS F
ree
Stat
e20
132
222
91
065
298
218
1411
543
GT
Gau
teng
119
166
118
163
7945
63
6850
6647
KZN
Kw
azul
u-N
atal
5436
20
5227
21
166
103
1310
5440
166
100
LIM
Lim
popo
2517
11
2612
10
101
437
321
1612
862
MP
Mpu
mal
anga
2113
00
1911
00
7235
73
2112
7942
NC
Nor
ther
n Ca
pe32
230
032
100
070
2419
319
1068
43
NW
Nor
th W
est
228
00
199
00
7631
43
168
7935
WC
Wes
tern
Cap
e30
240
029
221
090
7217
1233
2580
58
TOTA
L25
317
423
1124
812
822
487
346
993
4529
821
093
752
4
Sour
ce: N
atio
nal T
reas
ury
- Cap
acit
y Bu
ildin
g U
nit
b)
Th
e M
unic
ipal
Sta
ndar
d Ch
art o
f Acc
ount
s (m
SCO
A) R
egul
atio
ns w
ere
prom
ulga
ted
on 2
2 Ap
ril 2
014
and
pres
crib
es th
e un
iform
reco
rdin
g an
d
clas
sifica
tion
of m
unic
ipal
bud
get a
nd fi
nanc
ial i
nfor
mat
ion
at a
tran
sact
ion
leve
l. All
mun
icip
aliti
es a
nd m
unic
ipal
ent
ities
had
to c
ompl
y w
ith th
e
Regu
latio
ns b
y 01
July
201
7.
mSC
OA
is on
e of
the
key
gam
e ch
ange
rs t
o ad
dres
s m
unic
ipal
per
form
ance
fai
lure
s. Th
is st
anda
rd c
lass
ifica
tion
fram
ewor
k en
forc
es t
he li
nk
betw
een
plan
ning
(ID
P) a
nd t
he b
udge
t th
roug
h th
e pr
ojec
t se
gmen
t an
d en
able
s an
nual
repo
rtin
g an
d pe
rform
ance
man
agem
ent
linke
d to
stra
tegi
c se
rvic
e de
liver
y ob
ject
ives
. It s
houl
d be
not
ed th
at th
e m
SCO
A Re
gula
tions
also
inco
rpor
ates
the
mod
erni
satio
n of
the
Loca
l Gov
ernm
ent
busin
ess p
roce
sses
thro
ugh
the
regu
latio
n of
min
imum
bus
ines
s pro
cess
es a
nd sy
stem
spec
ifica
tions
.
Phas
e 5
of t
he r
efor
m c
omm
ence
d on
01
April
201
7 an
d fo
cus
on t
he im
plem
enta
tion
(pos
t 01
Jul
y 20
17) a
nd in
stitu
tiona
lisat
ion
of m
SCO
A.
Not
with
stan
ding
the
mas
sive
strid
es t
hat
has
been
mad
e w
ith m
SCO
A im
plem
enta
tion
and
the
inst
itutio
nalis
atio
n th
ereo
f in
a re
lativ
ely
shor
t
perio
d of
tim
e, a
num
ber o
f cha
lleng
es a
re st
ill h
ampe
ring
the
effec
tive
impl
emen
tatio
n of
the
mSC
OA
refo
rm a
t mun
icip
aliti
es.
Exte
nsiv
e en
gage
men
ts w
ere
held
with
key
syst
em p
rovi
ders
dur
ing
whi
ch th
e sy
stem
func
tiona
lity
on th
e fo
llow
ing
mod
ules
wer
e de
mon
stra
ted
live:
IDP
and
Budg
et (N
ovem
ber 2
018)
; SCM
(Feb
ruar
y 20
19);
and
Asse
t Man
agem
ent (
June
/Jul
y 20
19). T
hese
eng
agem
ents
pro
vide
d N
atio
nal a
nd
Prov
inci
al T
reas
urie
s with
an
unde
rsta
ndin
g of
wha
t fun
ctio
nalit
y is
avai
labl
e on
eac
h sy
stem
and
wha
t the
key
syst
em re
late
d ch
alle
nges
are
.
The State Of Local Government Finances and Financial Management - As at 30 June 2019
Audit Outcomes of the 2018/19 financial year : Analysis Document | 45
MUNICIPALITIES IN FINANCIAL DISTRESS
The State Of Local Government Finances and Financial Management - As at 30 June 2019
Audit Outcomes of the 2018/19 financial year : Analysis Document | 45
Although these demonstrations indicated that most of the financial systems in the market contain the
required functionality, it was evident that municipalities are not using their systems optimally. Some of the
challenges that were identified in this regard include the following:
• Some municipalities have budgetary constraint / inadequate funds to:
• Purchase all the modules of the core financial system or upgrade to the Enterprise Resource
Planning (ERP) (mSCOA enabling) version of systems;
• Acquire the required licences to use system solutions; and
• Upgrade and maintain their servers, hardware and software to become and remain mSCOA
complaint.
• Due to perceived non-compliance of some systems with mSCOA, a number of municipalities
are still transacting on their legacy systems that are not mSCOA enabling, while they are paying
for maintenance and support for the mSCOA enabling system that was procured. This constitutes
fruitless and wasteful expenditure;
• A number of municipalities are not using all the modules of the core financial system (using 3rd party
systems) while they have procured these modules. This is once again fruitless and wasteful expenditure;
• Dependency on system vendors to operate financial systems is still a challenge. Some municipalities
are not taking ownership for their own data and processes, (e.g. cleansing, testing version changes,
transaction capturing, etc.);
• Weak contract management is implemented by municipalities to address non-compliance or lack of support
by system vendors. This is exacerbated when service level agreements (SLAs) are unfairly prejudiced and
protecting the system vendor but the municipality signed (therefore agreed to it) such a SLA;
• Non-payment of vendors by municipalities, resulting in support services (not the access to the actual
financial system) being suspended by the vendor until payment has been received;
• Information and communications technology (ICT) connectivity problems at rural municipalities’ impact
on submission of data strings to cloud/web-based solutions and the Local Government Upload Portal; and
• Poor ICT internal controls and securities impact on the optimal use of core financial systems solutions.
Most municipalities are using third party systems in conjunction with their core financial management and
internal control system due to cost implications and resistance to change.
Two years into implementation, at least 11 of the 18 systems in the municipal space (including those municipalities
with in-house systems) are complying with the minimum mSCOA requirements, while the submission rate of
financial information in the form of mSCOA data strings by municipalities are exceeding 80 per cent.
Ultimately the aim is to get to a point where all municipalities budget and transact directly in and report from
their core financial system. This will result in one version of the ‘truth’ where the financial performance reported to
Council will not differ from the performance information submitted to and published by National and Provincial
Treasuries. This will also reduce the reliance on consultants and system vendors to prepare municipal reports.
Further training and change management is required as mSCOA has not been fully embraced as yet and it is still seen as a finance reform and not a business reform and municipal officials are still not budgeting and transacting correctly.
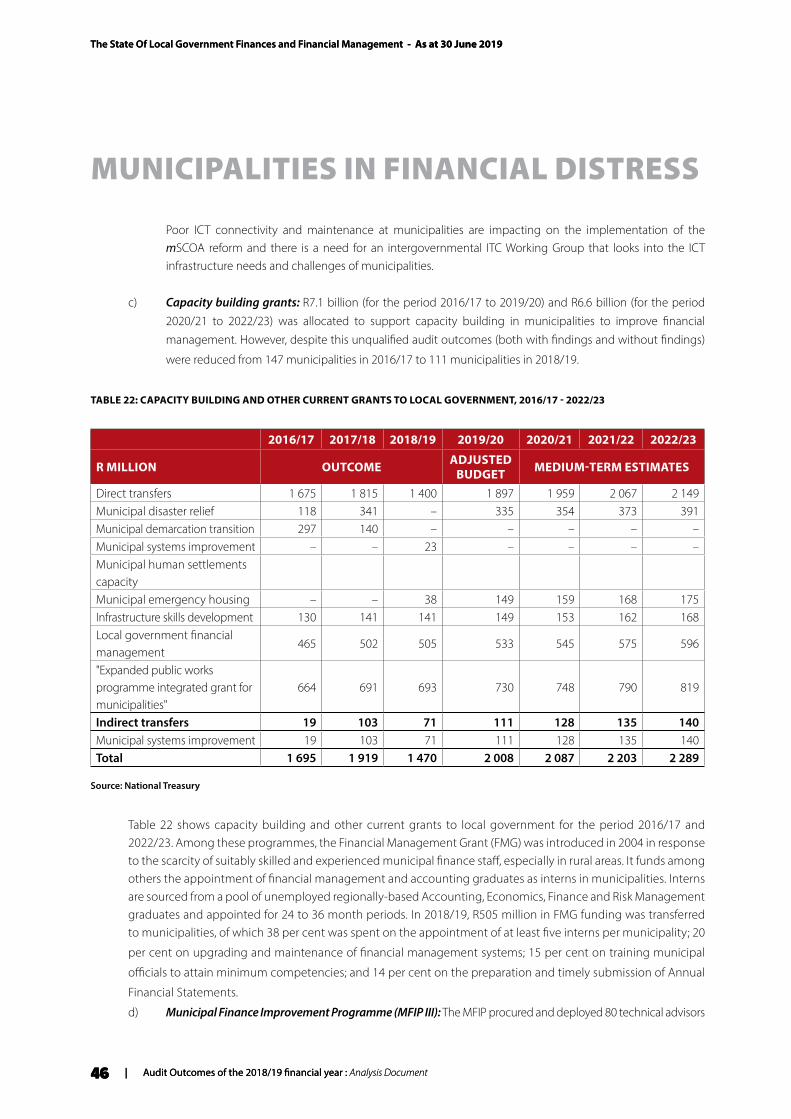
The State Of Local Government Finances and Financial Management - As at 30 June 2019
46 | Audit Outcomes of the 2018/19 financial year : Analysis Document
MUNICIPALITIES IN FINANCIAL DISTRESS
The State Of Local Government Finances and Financial Management - As at 30 June 2019
46 | Audit Outcomes of the 2018/19 financial year : Analysis Document
Poor ICT connectivity and maintenance at municipalities are impacting on the implementation of the mSCOA reform and there is a need for an intergovernmental ITC Working Group that looks into the ICT infrastructure needs and challenges of municipalities.
c) Capacity building grants: R7.1 billion (for the period 2016/17 to 2019/20) and R6.6 billion (for the period 2020/21 to 2022/23) was allocated to support capacity building in municipalities to improve financial management. However, despite this unqualified audit outcomes (both with findings and without findings)
were reduced from 147 municipalities in 2016/17 to 111 municipalities in 2018/19.
TABLE 22: CAPACITY BUILDING AND OTHER CURRENT GRANTS TO LOCAL GOVERNMENT, 2016/17 - 2022/23
2016/17 2017/18 2018/19 2019/20 2020/21 2021/22 2022/23
R MILLION OUTCOME ADJUSTED BUDGET MEDIUM-TERM ESTIMATES
Direct transfers 1 675 1 815 1 400 1 897 1 959 2 067 2 149 Municipal disaster relief 118 341 – 335 354 373 391 Municipal demarcation transition 297 140 – – – – – Municipal systems improvement – – 23 – – – – Municipal human settlements capacityMunicipal emergency housing – – 38 149 159 168 175 Infrastructure skills development 130 141 141 149 153 162 168 Local government financial management
465 502 505 533 545 575 596
"Expanded public works programme integrated grant for municipalities"
664 691 693 730 748 790 819
Indirect transfers 19 103 71 111 128 135 140 Municipal systems improvement 19 103 71 111 128 135 140 Total 1 695 1 919 1 470 2 008 2 087 2 203 2 289
Source: National Treasury
Table 22 shows capacity building and other current grants to local government for the period 2016/17 and 2022/23. Among these programmes, the Financial Management Grant (FMG) was introduced in 2004 in response to the scarcity of suitably skilled and experienced municipal finance staff, especially in rural areas. It funds among others the appointment of financial management and accounting graduates as interns in municipalities. Interns are sourced from a pool of unemployed regionally-based Accounting, Economics, Finance and Risk Management graduates and appointed for 24 to 36 month periods. In 2018/19, R505 million in FMG funding was transferred to municipalities, of which 38 per cent was spent on the appointment of at least five interns per municipality; 20
per cent on upgrading and maintenance of financial management systems; 15 per cent on training municipal
officials to attain minimum competencies; and 14 per cent on the preparation and timely submission of Annual
Financial Statements.
d) Municipal Finance Improvement Programme (MFIP III): The MFIP procured and deployed 80 technical advisors
The State Of Local Government Finances and Financial Management - As at 30 June 2019
Audit Outcomes of the 2018/19 financial year : Analysis Document | 47
MUNICIPALITIES IN FINANCIAL DISTRESS
The State Of Local Government Finances and Financial Management - As at 30 June 2019
Audit Outcomes of the 2018/19 financial year : Analysis Document | 47
(TAs) during the 2019/20 financial year. The increased number of TAs placed compared to previous years was
mainly as a result of the increase in the number of municipalities supported that were classified by National
Treasury and Department of Cooperative Governance (DCoG) as financially distressed and institutionally
dysfunctional. As at 31 March 2020, the programme was supporting the following institutions and work streams:
• Direct capacity support to municipal budget and treasury offices in general financial management:
23 TAs were deployed in municipalities across the nine provinces;
• Direct capacity support to the municipal finance units of provincial treasuries: 32 TAs were placed, of
whom five provided general support. Specialist support was offered in the following game changer
areas: supply chain management (seven advisors), the Municipal Standard Chart of Accounts or
mSCOA (six advisors), asset management (seven advisors) and revenue management (seven advisors);
• 18 TAs were placed to provide direct capacity support to the following National Treasury Chief
Directorates: Local Government Budget Analysis, MFMA Implementation and SCM Policy and Legal
on the six game changers (funded budgets, revenue management, mSCOA, asset management, SCM
and audit outcomes), the Financial Management Capability Maturity Model, the Municipal Financial Recovery Service; and
• Seven TAs were procured to provide programme and project management capacity support to the officials in the MFIP project management unit.
MFIP capacity building and skills transfer initiatives support various institutional and technical areas in financial
management in terms of the Municipal Finance Management Act and the local government reform agenda
of the National Treasury. While these interventions are mostly informal and non-accredited, they assist in
enhancing the practical, on-the-job skills of officials involved in municipal financial management. During the
year, 2 280 capacity building sessions were held, involving 13 603 officials. The municipal advisors conducted 948
capacity building sessions, reaching 1 507 officials across 29 municipalities. The provincial advisors conducted
199 capacity building sessions, involving 1 007 officials from both provincial treasuries and municipalities.
Finally, MFIP specialists conducted 1 133 capacity building sessions with 11 089 officials on topics such as SCM,
revenue management, asset management, mSCOA and the Municipal Financial Recovery Service.
e) Cities Support Programme (CSP): Located within the IGR division of the National Treasury, the CSP is aimed
at supporting metros to drive an effective spatial transformation agenda. The second phase of the CSP
started in March 2019 and its focus continues to be working with metros and a broad range of stakeholder
to support the achievement of the immediate outcomes in the CSP Theory of Change being:
• Capable cities: where metros are to implement strategies to accelerate inclusive economic growth by
building inclusive, productive and sustainable cities;
• Enabling fiscal and financial platform: ensuring the alignment of fiscal frameworks, policies, incentives
and grants by all sector departments to support sustainable urban financing and transformation; and
• Enabling policy environment: strengthened intergovernmental relations and coordination to support
the transformation agenda of metro and reviewed and refined national and provincial policies and plans
to support metros in implementing reforms and promote metros’ role in the transformation agenda.
For this second phase, the CSP is tasked to institutionalise and embed changes into the policy environment
and the fiscal and financial platforms.
The State Of Local Government Finances and Financial Management - As at 30 June 2019
48 | Audit Outcomes of the 2018/19 financial year : Analysis Document
MUNICIPALITIES IN FINANCIAL DISTRESS
The State Of Local Government Finances and Financial Management - As at 30 June 2019
48 | Audit Outcomes of the 2018/19 financial year : Analysis Document
The Programme is implemented through five components, namely Municipal Governance and Fiscal
Reforms, Public Transport, Human Settlements, Economic Development and Climate Resilience in the form
of 40 support projects in the eight metros.
f ) Revenue Management Support: A Revenue Management work stream is being implemented by a collective
effort of the National Treasury, the Department of Cooperative Governance and provincial treasuries and
their associated municipalities to achieve the following objectives:
• Strengthening support with respect to oversight of municipal revenue budget assessments with a
view to protect and optimise municipal revenue streams (provincial specific strategies to specifically
include this);
• Assessing the credibility of the municipal revenue base and its revenue generation potential to
maximise revenue collection (General Valuation Roll and supplementary valuation processes);
• Identify and fix the weaknesses in tariff determination processes (this will rely on mSCOA and correctly
understanding costs per service; consumption patterns and demand management);
• Improving municipal revenue governance arrangements and implement effective cash management systems;
• Assisting with establishing a revenue committee at the municipality with a revenue champion to
lead (preferably someone outside the BTO that reports directly to the municipal manager);
• Achieve alignment between revenue management strategies and policies; and
• Improve financial management performance in municipalities.
The focus is on the revenue value chain and all related internal and external dependencies and identifying catalytic
areas where attention should be focused to derive the largest financial benefit. Various stakeholders are part of this
work stream to avoid duplication in efforts.
INTERVENTIONS IN MUNICIPALITIES
128. The powers of other spheres of government to intervene in the affairs of a municipality is regulated by the
Constitution and the MFMA. Section 139 of the Constitution provides for provincial (and national) interventions in
municipalities as a last resort in response to serious problems. It envisages three kinds of failures in local government,
with responses to address each of these problems, set out in the different sub-sections. The role of the province
is to assess the nature of the problem, and to respond in terms of the relevant sub-section of Section 139 of the
Constitution as follows:
• Section 139(1) should be invoked in response to a “failure to fulfil an executive obligation”: these are
discretionary interventions;
• Section 139(4) should be invoked in response to a failure by Council to pass a budget or budget related
measures: this refers to a failure to fulfil a legislative function and is a mandatory intervention; and
• Section 139(5) should be invoked in response to a financial crisis, specifically a material breach of financial
obligations or ability to provide basic services: these are also mandatory interventions.
The State Of Local Government Finances and Financial Management - As at 30 June 2019
Audit Outcomes of the 2018/19 financial year : Analysis Document | 49
MUNICIPALITIES IN FINANCIAL DISTRESS
The State Of Local Government Finances and Financial Management - As at 30 June 2019
Audit Outcomes of the 2018/19 financial year : Analysis Document | 49
129. Sections 139(4) and (5) of the Constitution are regulated by Chapter 13 of the MFMA. Chapter 13 also addresses
the requirements for discretionary interventions that require the development of a financial recovery plan. Any
mandatory intervention invoked in a municipality must be referred to the Municipal Finance Recovery Services Unit
within the National Treasury for the development of a financial recovery plan. Section 139(7) of the Constitution also
provides that if the province fails to intervene when the conditions for a mandatory intervention exist, the national
executive must do so.
130. Research conducted on behalf of the National Treasury into the efficiency of Section 139 interventions revealed
that triggers for Section 139 interventions have not usually been informed by a careful review of the problems in
municipalities. Since 1998 to 2018, 140 interventions have been invoked in municipalities. 15 of these interventions
have subsequently been set aside. Of the remaining interventions, most were invoked in terms of Section 139(1)
of the Constitution, even though in many cases conditions existed for invoking a Section 139(5) intervention. Only
11 interventions were actually initiated using other subsections of Section 139 and 4 of these were invoked in
combination with Section 139(1). Of these 11 interventions, 6 interventions were in terms of Section 139(4) (failure
to pass a budget) and 5 were in terms of Section 139(5) (as a result of a financial crisis in the municipality).
131. As at January 2020, there were 36 interventions in terms of Section 139 of the Constitution. Most of these
interventions were in North West Province (9 municipalities), followed by KwaZulu-Natal Province (8 municipalities)
and Mpumalanga (6 municipalities). Gauteng only recorded one intervention, while Limpopo and Northern Cape
only recorded two interventions.
132. As at January 2020, financial recovery plans were in place in 33 municipalities with 9 of these being voluntary
recovery plans. More and more municipalities are requesting voluntary financial recovery plans. As January 2020,
there were 16 municipalities that had made requests for a voluntary financial recovery plans.
133. The State of Local Government and Financial Management Reports comprehensively discusses the financial health
of all 257 of the country’s municipalities. Annexure A1 lists the 163 municipalities that were assessed as in financial
The State Of Local Government Finances and Financial Management - As at 30 June 2019
50 | Audit Outcomes of the 2018/19 financial year : Analysis Document
The State Of Local Government Finances and Financial Management - As at 30 June 2019
50 | Audit Outcomes of the 2018/19 financial year : Analysis Document
CONCLUDING REMARKS
distress in 2018/19.
134. This analysis presented in this report indicates that a significant number of municipalities continue to perform
poorly and remain a cause for concern. This contributes to a negative impression of the performance of the
municipal system as a whole. At an aggregate level:
• A few municipalities still close the year with negative cash and cash equivalents. This indicates some
municipalities experience temporary cash-flow problems. The negative cash balance is a strong indicator
that there are severe underlying financial problems;
• Municipalities continue to have insufficient cash coverage to fund their operations. This indicates
that municipalities that are below the ratio of 1-3 months are vulnerable and at a higher risk in the event
of financial shocks and their ability to meet their obligations to provide basic services or their financial
commitments are compromised;
• Most municipalities do not have sufficient cash and investments to pay for current obligations
(liquidity ratio). The reflects that most short-term liabilities are not covered by the cash and investments;
• It takes longer than 30 days to collect debt from municipalities after issuing the bill. This reflects both
pressures on household budgets as well as poor revenue value chain management by municipalities;
• Creditors outstanding continues to grow. This reflects a reliance by municipalities on consumers to
finance their operations, weak financial management controls and a significant burden being placed on
local economies;
• There are not enough current assets to pay short term liabilities in about half of the municipalities.
This indicates that most municipalities will not be able to pay their current or short-term obligations and
provide for a risk cover to enable them to continue operations at desired levels;
• In terms of the total liabilities as a percentage of its total assets it’s a concern that there are some
municipalities that do not have enough assets to pay for total liabilities;
• Unfunded operations continue to be a challenge. Municipalities that adopt unfunded budgets
experience an increased inability to maintain payments to creditors which will compromise service delivery
and threaten their fiscal sustainability;
• Many municipalities are borrowing less given the cash flow challenges. This indicates that there is
no appetite to borrow as the municipalities know they will not be able to commit to the repayment of
borrowing due to cash flow challenges;
• Municipal audit outcomes continue to decline. This reflects a lack of commitment by municipal leadership
and a weak environment for consequence management;
• Municipalities are underspending on repairs and maintenance of infrastructure. Repairs and
maintenance of municipal assets is required to ensure the continued provision of services. Underspending
results in a steady deterioration in the quality and serviceability of municipal assets that poses both an
immediate and long-term risk to fiscal sustainability. This is also reflected in the continued high level of water
and electricity losses;
• Municipalities are spending too little on the renewal of municipal assets as a percentage of total
capital expenditure. This means that the municipality’s Property Plant and Equipment are not maintained
The State Of Local Government Finances and Financial Management - As at 30 June 2019
Audit Outcomes of the 2018/19 financial year : Analysis Document | 51
CONCLUDING REMARKS
The State Of Local Government Finances and Financial Management - As at 30 June 2019
Audit Outcomes of the 2018/19 financial year : Analysis Document | 51
properly, in order to ensure sustainable service delivery;
• Under-provision for depreciation remains a challenge. This means that municipalities are not setting
tariffs that reflect the depreciation of assets. It is important to have a cash-backed depreciation in order to
allow for the replacement of assets in future; and
• Underspending of capital budgets as a percentage of total expenditure continues to be a challenge.
This continues to undermine efforts to improve access to services, service reliability and local economic
growth.
135. 163 municipalities have been identified as experiencing some form of financial distress, characterised by poor cash
flow management and an increase in outstanding debtors and creditors. Initiatives by provincial governments to
address this situation have been limited to date. More scope exists for national government to play a larger role in
exercising powers under Chapter 13 of the MFMA when a provincial government fails to act timeously in addressing
a municipal financial emergency.
136. While a number of municipalities continue to demonstrate evidence of significant financial distress, these challenges
are not universal. A number of municipalities have either sustained or improved their financial performance,
particularly in larger urban areas, despite the economic and developmental challenges they face.
137. To address capacity challenges, government has channelled very substantial resources and effort towards support
municipalities through capacity building initiatives, a number of reform initiatives, support programmes and
conditional grant instruments.
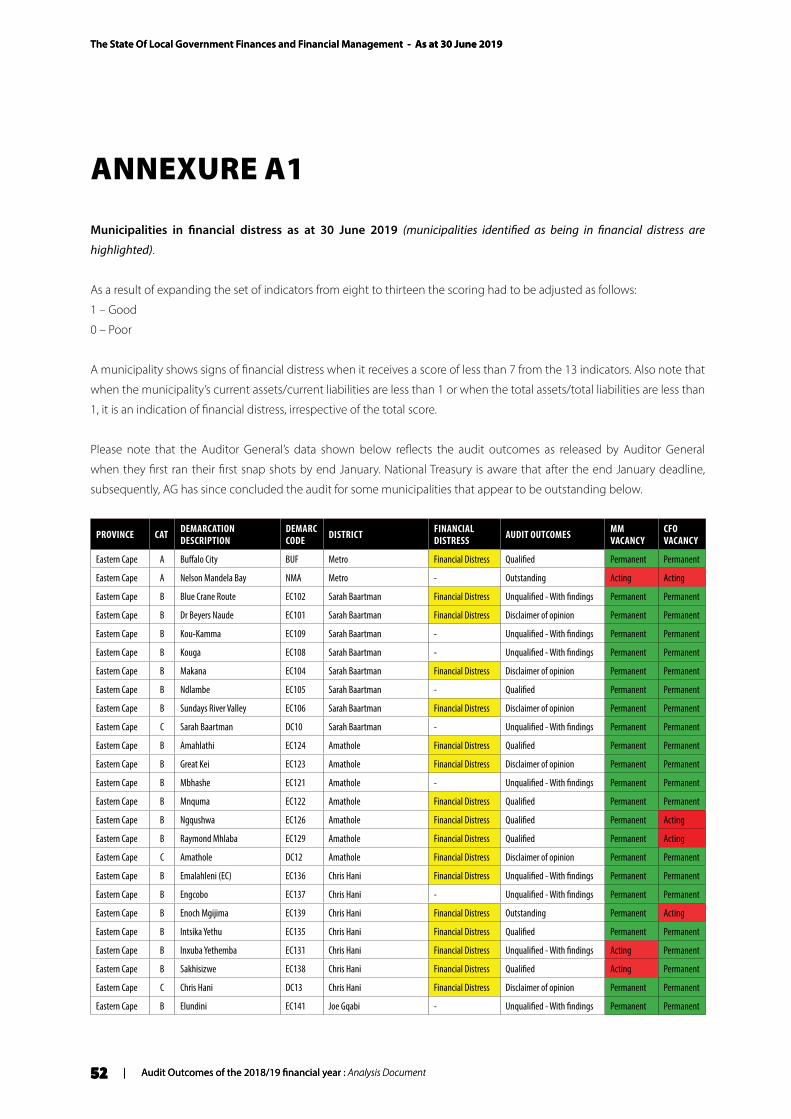
The State Of Local Government Finances and Financial Management - As at 30 June 2019
52 | Audit Outcomes of the 2018/19 financial year : Analysis Document
The State Of Local Government Finances and Financial Management - As at 30 June 2019
52 | Audit Outcomes of the 2018/19 financial year : Analysis Document
ANNEXURE A1
Municipalities in financial distress as at 30 June 2019 (municipalities identified as being in financial distress are
highlighted).
As a result of expanding the set of indicators from eight to thirteen the scoring had to be adjusted as follows:
1 – Good
0 – Poor
A municipality shows signs of financial distress when it receives a score of less than 7 from the 13 indicators. Also note that
when the municipality’s current assets/current liabilities are less than 1 or when the total assets/total liabilities are less than
1, it is an indication of financial distress, irrespective of the total score.
Please note that the Auditor General’s data shown below reflects the audit outcomes as released by Auditor General
when they first ran their first snap shots by end January. National Treasury is aware that after the end January deadline,
subsequently, AG has since concluded the audit for some municipalities that appear to be outstanding below.
PROVINCE CAT DEMARCATION DESCRIPTION
DEMARC CODE DISTRICT FINANCIAL
DISTRESS AUDIT OUTCOMES MM VACANCY
CFO VACANCY
Eastern Cape A Buffalo City BUF Metro Financial Distress Qualified Permanent Permanent
Eastern Cape A Nelson Mandela Bay NMA Metro - Outstanding Acting Acting
Eastern Cape B Blue Crane Route EC102 Sarah Baartman Financial Distress Unqualified - With findings Permanent Permanent
Eastern Cape B Dr Beyers Naude EC101 Sarah Baartman Financial Distress Disclaimer of opinion Permanent Permanent
Eastern Cape B Kou-Kamma EC109 Sarah Baartman - Unqualified - With findings Permanent Permanent
Eastern Cape B Kouga EC108 Sarah Baartman - Unqualified - With findings Permanent Permanent
Eastern Cape B Makana EC104 Sarah Baartman Financial Distress Disclaimer of opinion Permanent Permanent
Eastern Cape B Ndlambe EC105 Sarah Baartman - Qualified Permanent Permanent
Eastern Cape B Sundays River Valley EC106 Sarah Baartman Financial Distress Disclaimer of opinion Permanent Permanent
Eastern Cape C Sarah Baartman DC10 Sarah Baartman - Unqualified - With findings Permanent Permanent
Eastern Cape B Amahlathi EC124 Amathole Financial Distress Qualified Permanent Permanent
Eastern Cape B Great Kei EC123 Amathole Financial Distress Disclaimer of opinion Permanent Permanent
Eastern Cape B Mbhashe EC121 Amathole - Unqualified - With findings Permanent Permanent
Eastern Cape B Mnquma EC122 Amathole Financial Distress Qualified Permanent Permanent
Eastern Cape B Ngqushwa EC126 Amathole Financial Distress Qualified Permanent Acting
Eastern Cape B Raymond Mhlaba EC129 Amathole Financial Distress Qualified Permanent Acting
Eastern Cape C Amathole DC12 Amathole Financial Distress Disclaimer of opinion Permanent Permanent
Eastern Cape B Emalahleni (EC) EC136 Chris Hani Financial Distress Unqualified - With findings Permanent Permanent
Eastern Cape B Engcobo EC137 Chris Hani - Unqualified - With findings Permanent Permanent
Eastern Cape B Enoch Mgijima EC139 Chris Hani Financial Distress Outstanding Permanent Acting
Eastern Cape B Intsika Yethu EC135 Chris Hani Financial Distress Qualified Permanent Permanent
Eastern Cape B Inxuba Yethemba EC131 Chris Hani Financial Distress Unqualified - With findings Acting Permanent
Eastern Cape B Sakhisizwe EC138 Chris Hani Financial Distress Qualified Acting Permanent
Eastern Cape C Chris Hani DC13 Chris Hani Financial Distress Disclaimer of opinion Permanent Permanent
Eastern Cape B Elundini EC141 Joe Gqabi - Unqualified - With findings Permanent Permanent
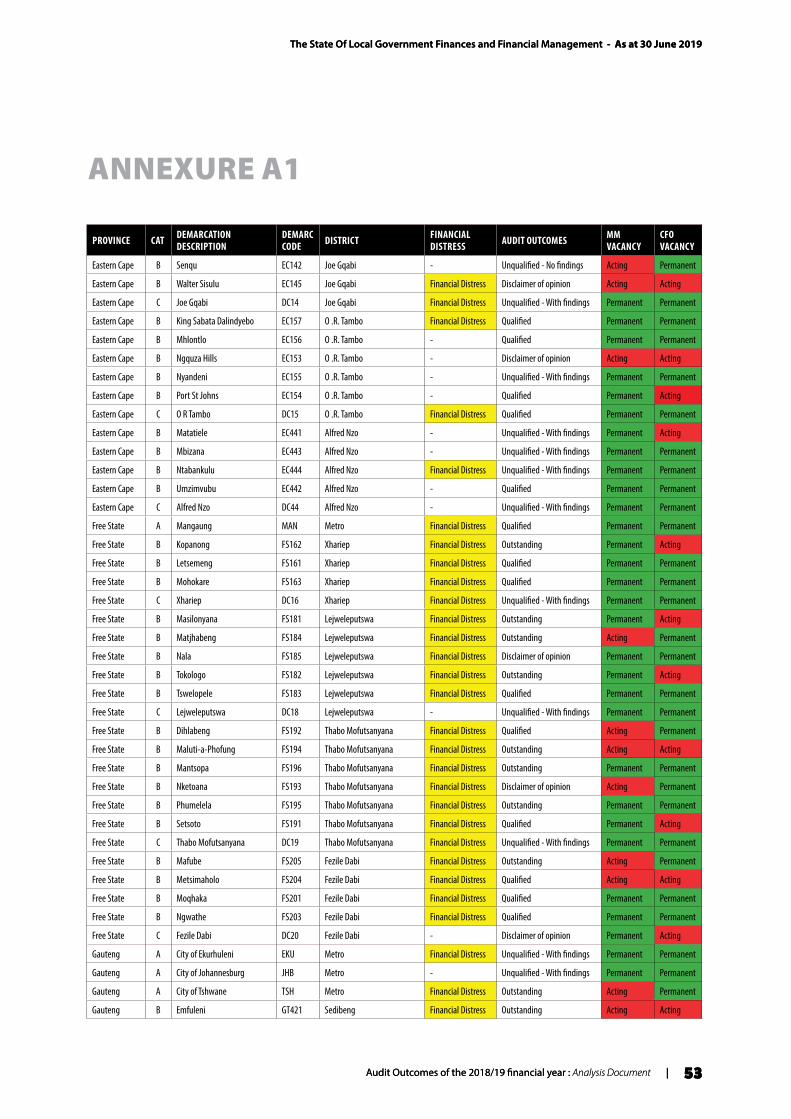
The State Of Local Government Finances and Financial Management - As at 30 June 2019
Audit Outcomes of the 2018/19 financial year : Analysis Document | 53
ANNEXURE A1
The State Of Local Government Finances and Financial Management - As at 30 June 2019
Audit Outcomes of the 2018/19 financial year : Analysis Document | 53
PROVINCE CAT DEMARCATION DESCRIPTION
DEMARC CODE DISTRICT FINANCIAL
DISTRESS AUDIT OUTCOMES MM VACANCY
CFO VACANCY
Eastern Cape B Senqu EC142 Joe Gqabi - Unqualified - No findings Acting Permanent
Eastern Cape B Walter Sisulu EC145 Joe Gqabi Financial Distress Disclaimer of opinion Acting Acting
Eastern Cape C Joe Gqabi DC14 Joe Gqabi Financial Distress Unqualified - With findings Permanent Permanent
Eastern Cape B King Sabata Dalindyebo EC157 O .R. Tambo Financial Distress Qualified Permanent Permanent
Eastern Cape B Mhlontlo EC156 O .R. Tambo - Qualified Permanent Permanent
Eastern Cape B Ngquza Hills EC153 O .R. Tambo - Disclaimer of opinion Acting Acting
Eastern Cape B Nyandeni EC155 O .R. Tambo - Unqualified - With findings Permanent Permanent
Eastern Cape B Port St Johns EC154 O .R. Tambo - Qualified Permanent Acting
Eastern Cape C O R Tambo DC15 O .R. Tambo Financial Distress Qualified Permanent Permanent
Eastern Cape B Matatiele EC441 Alfred Nzo - Unqualified - With findings Permanent Acting
Eastern Cape B Mbizana EC443 Alfred Nzo - Unqualified - With findings Permanent Permanent
Eastern Cape B Ntabankulu EC444 Alfred Nzo Financial Distress Unqualified - With findings Permanent Permanent
Eastern Cape B Umzimvubu EC442 Alfred Nzo - Qualified Permanent Permanent
Eastern Cape C Alfred Nzo DC44 Alfred Nzo - Unqualified - With findings Permanent Permanent
Free State A Mangaung MAN Metro Financial Distress Qualified Permanent Permanent
Free State B Kopanong FS162 Xhariep Financial Distress Outstanding Permanent Acting
Free State B Letsemeng FS161 Xhariep Financial Distress Qualified Permanent Permanent
Free State B Mohokare FS163 Xhariep Financial Distress Qualified Permanent Permanent
Free State C Xhariep DC16 Xhariep Financial Distress Unqualified - With findings Permanent Permanent
Free State B Masilonyana FS181 Lejweleputswa Financial Distress Outstanding Permanent Acting
Free State B Matjhabeng FS184 Lejweleputswa Financial Distress Outstanding Acting Permanent
Free State B Nala FS185 Lejweleputswa Financial Distress Disclaimer of opinion Permanent Permanent
Free State B Tokologo FS182 Lejweleputswa Financial Distress Outstanding Permanent Acting
Free State B Tswelopele FS183 Lejweleputswa Financial Distress Qualified Permanent Permanent
Free State C Lejweleputswa DC18 Lejweleputswa - Unqualified - With findings Permanent Permanent
Free State B Dihlabeng FS192 Thabo Mofutsanyana Financial Distress Qualified Acting Permanent
Free State B Maluti-a-Phofung FS194 Thabo Mofutsanyana Financial Distress Outstanding Acting Acting
Free State B Mantsopa FS196 Thabo Mofutsanyana Financial Distress Outstanding Permanent Permanent
Free State B Nketoana FS193 Thabo Mofutsanyana Financial Distress Disclaimer of opinion Acting Permanent
Free State B Phumelela FS195 Thabo Mofutsanyana Financial Distress Outstanding Permanent Permanent
Free State B Setsoto FS191 Thabo Mofutsanyana Financial Distress Qualified Permanent Acting
Free State C Thabo Mofutsanyana DC19 Thabo Mofutsanyana Financial Distress Unqualified - With findings Permanent Permanent
Free State B Mafube FS205 Fezile Dabi Financial Distress Outstanding Acting Permanent
Free State B Metsimaholo FS204 Fezile Dabi Financial Distress Qualified Acting Acting
Free State B Moqhaka FS201 Fezile Dabi Financial Distress Qualified Permanent Permanent
Free State B Ngwathe FS203 Fezile Dabi Financial Distress Qualified Permanent Permanent
Free State C Fezile Dabi DC20 Fezile Dabi - Disclaimer of opinion Permanent Acting
Gauteng A City of Ekurhuleni EKU Metro Financial Distress Unqualified - With findings Permanent Permanent
Gauteng A City of Johannesburg JHB Metro - Unqualified - With findings Permanent Permanent
Gauteng A City of Tshwane TSH Metro Financial Distress Outstanding Acting Permanent
Gauteng B Emfuleni GT421 Sedibeng Financial Distress Outstanding Acting Acting
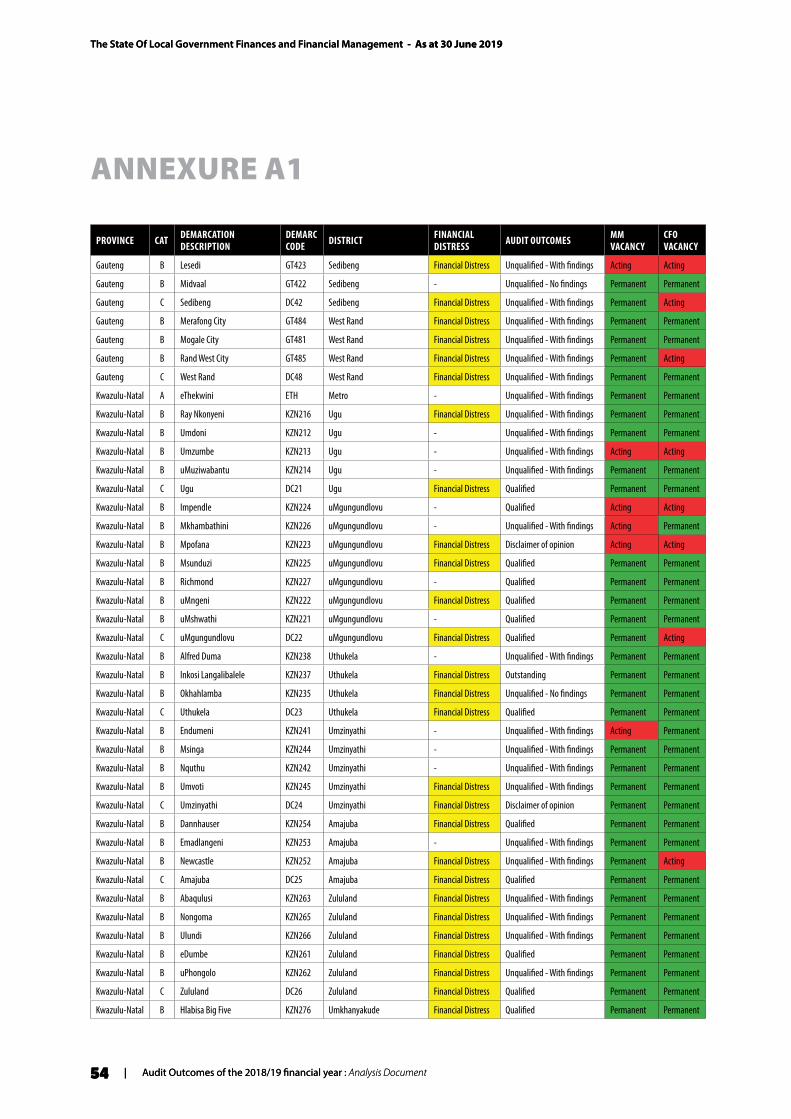
The State Of Local Government Finances and Financial Management - As at 30 June 2019
54 | Audit Outcomes of the 2018/19 financial year : Analysis Document
ANNEXURE A1
The State Of Local Government Finances and Financial Management - As at 30 June 2019
54 | Audit Outcomes of the 2018/19 financial year : Analysis Document
PROVINCE CAT DEMARCATION DESCRIPTION
DEMARC CODE DISTRICT FINANCIAL
DISTRESS AUDIT OUTCOMES MM VACANCY
CFO VACANCY
Gauteng B Lesedi GT423 Sedibeng Financial Distress Unqualified - With findings Acting Acting
Gauteng B Midvaal GT422 Sedibeng - Unqualified - No findings Permanent Permanent
Gauteng C Sedibeng DC42 Sedibeng Financial Distress Unqualified - With findings Permanent Acting
Gauteng B Merafong City GT484 West Rand Financial Distress Unqualified - With findings Permanent Permanent
Gauteng B Mogale City GT481 West Rand Financial Distress Unqualified - With findings Permanent Permanent
Gauteng B Rand West City GT485 West Rand Financial Distress Unqualified - With findings Permanent Acting
Gauteng C West Rand DC48 West Rand Financial Distress Unqualified - With findings Permanent Permanent
Kwazulu-Natal A eThekwini ETH Metro - Unqualified - With findings Permanent Permanent
Kwazulu-Natal B Ray Nkonyeni KZN216 Ugu Financial Distress Unqualified - With findings Permanent Permanent
Kwazulu-Natal B Umdoni KZN212 Ugu - Unqualified - With findings Permanent Permanent
Kwazulu-Natal B Umzumbe KZN213 Ugu - Unqualified - With findings Acting Acting
Kwazulu-Natal B uMuziwabantu KZN214 Ugu - Unqualified - With findings Permanent Permanent
Kwazulu-Natal C Ugu DC21 Ugu Financial Distress Qualified Permanent Permanent
Kwazulu-Natal B Impendle KZN224 uMgungundlovu - Qualified Acting Acting
Kwazulu-Natal B Mkhambathini KZN226 uMgungundlovu - Unqualified - With findings Acting Permanent
Kwazulu-Natal B Mpofana KZN223 uMgungundlovu Financial Distress Disclaimer of opinion Acting Acting
Kwazulu-Natal B Msunduzi KZN225 uMgungundlovu Financial Distress Qualified Permanent Permanent
Kwazulu-Natal B Richmond KZN227 uMgungundlovu - Qualified Permanent Permanent
Kwazulu-Natal B uMngeni KZN222 uMgungundlovu Financial Distress Qualified Permanent Permanent
Kwazulu-Natal B uMshwathi KZN221 uMgungundlovu - Qualified Permanent Permanent
Kwazulu-Natal C uMgungundlovu DC22 uMgungundlovu Financial Distress Qualified Permanent Acting
Kwazulu-Natal B Alfred Duma KZN238 Uthukela - Unqualified - With findings Permanent Permanent
Kwazulu-Natal B Inkosi Langalibalele KZN237 Uthukela Financial Distress Outstanding Permanent Permanent
Kwazulu-Natal B Okhahlamba KZN235 Uthukela Financial Distress Unqualified - No findings Permanent Permanent
Kwazulu-Natal C Uthukela DC23 Uthukela Financial Distress Qualified Permanent Permanent
Kwazulu-Natal B Endumeni KZN241 Umzinyathi - Unqualified - With findings Acting Permanent
Kwazulu-Natal B Msinga KZN244 Umzinyathi - Unqualified - With findings Permanent Permanent
Kwazulu-Natal B Nquthu KZN242 Umzinyathi - Unqualified - With findings Permanent Permanent
Kwazulu-Natal B Umvoti KZN245 Umzinyathi Financial Distress Unqualified - With findings Permanent Permanent
Kwazulu-Natal C Umzinyathi DC24 Umzinyathi Financial Distress Disclaimer of opinion Permanent Permanent
Kwazulu-Natal B Dannhauser KZN254 Amajuba Financial Distress Qualified Permanent Permanent
Kwazulu-Natal B Emadlangeni KZN253 Amajuba - Unqualified - With findings Permanent Permanent
Kwazulu-Natal B Newcastle KZN252 Amajuba Financial Distress Unqualified - With findings Permanent Acting
Kwazulu-Natal C Amajuba DC25 Amajuba Financial Distress Qualified Permanent Permanent
Kwazulu-Natal B Abaqulusi KZN263 Zululand Financial Distress Unqualified - With findings Permanent Permanent
Kwazulu-Natal B Nongoma KZN265 Zululand Financial Distress Unqualified - With findings Permanent Permanent
Kwazulu-Natal B Ulundi KZN266 Zululand Financial Distress Unqualified - With findings Permanent Permanent
Kwazulu-Natal B eDumbe KZN261 Zululand Financial Distress Qualified Permanent Permanent
Kwazulu-Natal B uPhongolo KZN262 Zululand Financial Distress Unqualified - With findings Permanent Permanent
Kwazulu-Natal C Zululand DC26 Zululand Financial Distress Qualified Permanent Permanent
Kwazulu-Natal B Hlabisa Big Five KZN276 Umkhanyakude Financial Distress Qualified Permanent Permanent
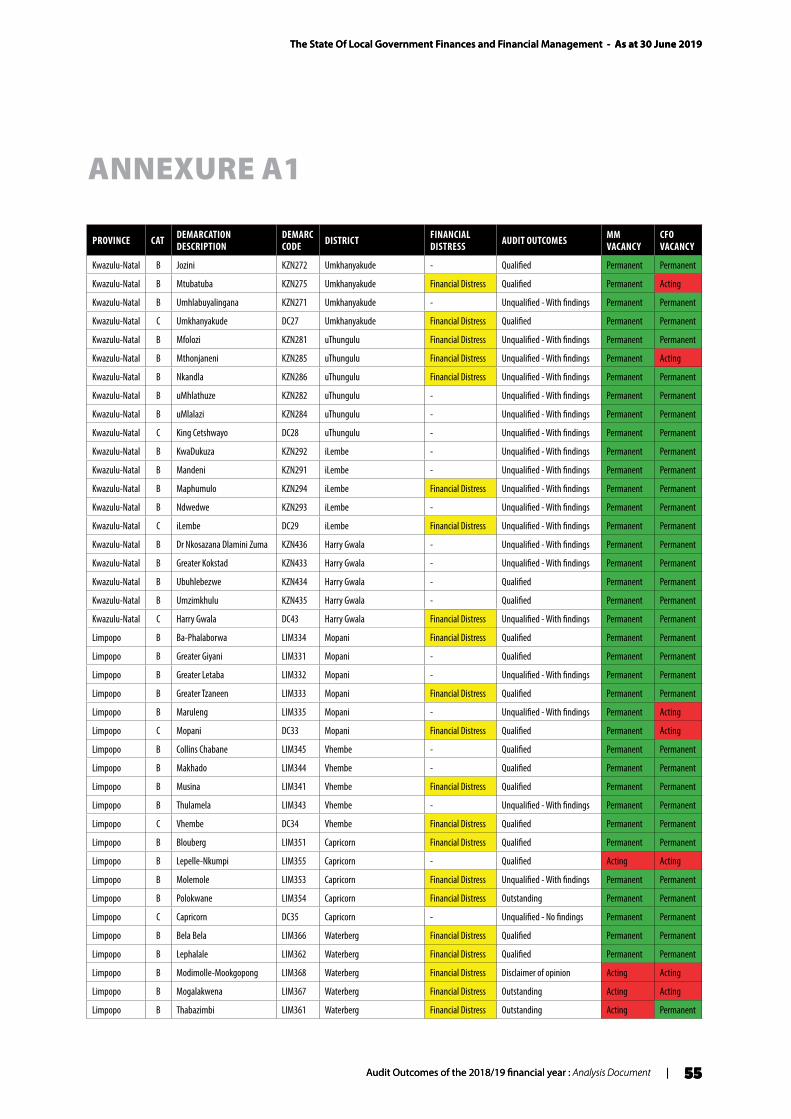
The State Of Local Government Finances and Financial Management - As at 30 June 2019
Audit Outcomes of the 2018/19 financial year : Analysis Document | 55
ANNEXURE A1
The State Of Local Government Finances and Financial Management - As at 30 June 2019
Audit Outcomes of the 2018/19 financial year : Analysis Document | 55
PROVINCE CAT DEMARCATION DESCRIPTION
DEMARC CODE DISTRICT FINANCIAL
DISTRESS AUDIT OUTCOMES MM VACANCY
CFO VACANCY
Kwazulu-Natal B Jozini KZN272 Umkhanyakude - Qualified Permanent Permanent
Kwazulu-Natal B Mtubatuba KZN275 Umkhanyakude Financial Distress Qualified Permanent Acting
Kwazulu-Natal B Umhlabuyalingana KZN271 Umkhanyakude - Unqualified - With findings Permanent Permanent
Kwazulu-Natal C Umkhanyakude DC27 Umkhanyakude Financial Distress Qualified Permanent Permanent
Kwazulu-Natal B Mfolozi KZN281 uThungulu Financial Distress Unqualified - With findings Permanent Permanent
Kwazulu-Natal B Mthonjaneni KZN285 uThungulu Financial Distress Unqualified - With findings Permanent Acting
Kwazulu-Natal B Nkandla KZN286 uThungulu Financial Distress Unqualified - With findings Permanent Permanent
Kwazulu-Natal B uMhlathuze KZN282 uThungulu - Unqualified - With findings Permanent Permanent
Kwazulu-Natal B uMlalazi KZN284 uThungulu - Unqualified - With findings Permanent Permanent
Kwazulu-Natal C King Cetshwayo DC28 uThungulu - Unqualified - With findings Permanent Permanent
Kwazulu-Natal B KwaDukuza KZN292 iLembe - Unqualified - With findings Permanent Permanent
Kwazulu-Natal B Mandeni KZN291 iLembe - Unqualified - With findings Permanent Permanent
Kwazulu-Natal B Maphumulo KZN294 iLembe Financial Distress Unqualified - With findings Permanent Permanent
Kwazulu-Natal B Ndwedwe KZN293 iLembe - Unqualified - With findings Permanent Permanent
Kwazulu-Natal C iLembe DC29 iLembe Financial Distress Unqualified - With findings Permanent Permanent
Kwazulu-Natal B Dr Nkosazana Dlamini Zuma KZN436 Harry Gwala - Unqualified - With findings Permanent Permanent
Kwazulu-Natal B Greater Kokstad KZN433 Harry Gwala - Unqualified - With findings Permanent Permanent
Kwazulu-Natal B Ubuhlebezwe KZN434 Harry Gwala - Qualified Permanent Permanent
Kwazulu-Natal B Umzimkhulu KZN435 Harry Gwala - Qualified Permanent Permanent
Kwazulu-Natal C Harry Gwala DC43 Harry Gwala Financial Distress Unqualified - With findings Permanent Permanent
Limpopo B Ba-Phalaborwa LIM334 Mopani Financial Distress Qualified Permanent Permanent
Limpopo B Greater Giyani LIM331 Mopani - Qualified Permanent Permanent
Limpopo B Greater Letaba LIM332 Mopani - Unqualified - With findings Permanent Permanent
Limpopo B Greater Tzaneen LIM333 Mopani Financial Distress Qualified Permanent Permanent
Limpopo B Maruleng LIM335 Mopani - Unqualified - With findings Permanent Acting
Limpopo C Mopani DC33 Mopani Financial Distress Qualified Permanent Acting
Limpopo B Collins Chabane LIM345 Vhembe - Qualified Permanent Permanent
Limpopo B Makhado LIM344 Vhembe - Qualified Permanent Permanent
Limpopo B Musina LIM341 Vhembe Financial Distress Qualified Permanent Permanent
Limpopo B Thulamela LIM343 Vhembe - Unqualified - With findings Permanent Permanent
Limpopo C Vhembe DC34 Vhembe Financial Distress Qualified Permanent Permanent
Limpopo B Blouberg LIM351 Capricorn Financial Distress Qualified Permanent Permanent
Limpopo B Lepelle-Nkumpi LIM355 Capricorn - Qualified Acting Acting
Limpopo B Molemole LIM353 Capricorn Financial Distress Unqualified - With findings Permanent Permanent
Limpopo B Polokwane LIM354 Capricorn Financial Distress Outstanding Permanent Permanent
Limpopo C Capricorn DC35 Capricorn - Unqualified - No findings Permanent Permanent
Limpopo B Bela Bela LIM366 Waterberg Financial Distress Qualified Permanent Permanent
Limpopo B Lephalale LIM362 Waterberg Financial Distress Qualified Permanent Permanent
Limpopo B Modimolle-Mookgopong LIM368 Waterberg Financial Distress Disclaimer of opinion Acting Acting
Limpopo B Mogalakwena LIM367 Waterberg Financial Distress Outstanding Acting Acting
Limpopo B Thabazimbi LIM361 Waterberg Financial Distress Outstanding Acting Permanent
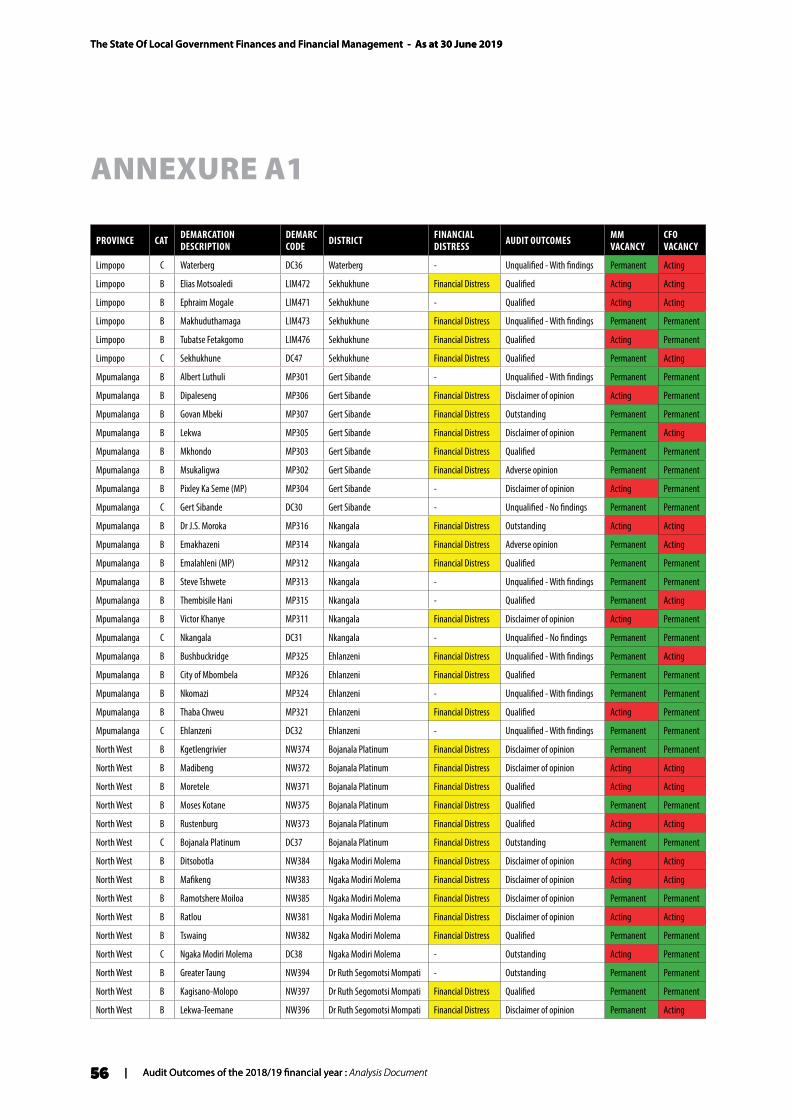
The State Of Local Government Finances and Financial Management - As at 30 June 2019
56 | Audit Outcomes of the 2018/19 financial year : Analysis Document
ANNEXURE A1
The State Of Local Government Finances and Financial Management - As at 30 June 2019
56 | Audit Outcomes of the 2018/19 financial year : Analysis Document
PROVINCE CAT DEMARCATION DESCRIPTION
DEMARC CODE DISTRICT FINANCIAL
DISTRESS AUDIT OUTCOMES MM VACANCY
CFO VACANCY
Limpopo C Waterberg DC36 Waterberg - Unqualified - With findings Permanent Acting
Limpopo B Elias Motsoaledi LIM472 Sekhukhune Financial Distress Qualified Acting Acting
Limpopo B Ephraim Mogale LIM471 Sekhukhune - Qualified Acting Acting
Limpopo B Makhuduthamaga LIM473 Sekhukhune Financial Distress Unqualified - With findings Permanent Permanent
Limpopo B Tubatse Fetakgomo LIM476 Sekhukhune Financial Distress Qualified Acting Permanent
Limpopo C Sekhukhune DC47 Sekhukhune Financial Distress Qualified Permanent Acting
Mpumalanga B Albert Luthuli MP301 Gert Sibande - Unqualified - With findings Permanent Permanent
Mpumalanga B Dipaleseng MP306 Gert Sibande Financial Distress Disclaimer of opinion Acting Permanent
Mpumalanga B Govan Mbeki MP307 Gert Sibande Financial Distress Outstanding Permanent Permanent
Mpumalanga B Lekwa MP305 Gert Sibande Financial Distress Disclaimer of opinion Permanent Acting
Mpumalanga B Mkhondo MP303 Gert Sibande Financial Distress Qualified Permanent Permanent
Mpumalanga B Msukaligwa MP302 Gert Sibande Financial Distress Adverse opinion Permanent Permanent
Mpumalanga B Pixley Ka Seme (MP) MP304 Gert Sibande - Disclaimer of opinion Acting Permanent
Mpumalanga C Gert Sibande DC30 Gert Sibande - Unqualified - No findings Permanent Permanent
Mpumalanga B Dr J.S. Moroka MP316 Nkangala Financial Distress Outstanding Acting Acting
Mpumalanga B Emakhazeni MP314 Nkangala Financial Distress Adverse opinion Permanent Acting
Mpumalanga B Emalahleni (MP) MP312 Nkangala Financial Distress Qualified Permanent Permanent
Mpumalanga B Steve Tshwete MP313 Nkangala - Unqualified - With findings Permanent Permanent
Mpumalanga B Thembisile Hani MP315 Nkangala - Qualified Permanent Acting
Mpumalanga B Victor Khanye MP311 Nkangala Financial Distress Disclaimer of opinion Acting Permanent
Mpumalanga C Nkangala DC31 Nkangala - Unqualified - No findings Permanent Permanent
Mpumalanga B Bushbuckridge MP325 Ehlanzeni Financial Distress Unqualified - With findings Permanent Acting
Mpumalanga B City of Mbombela MP326 Ehlanzeni Financial Distress Qualified Permanent Permanent
Mpumalanga B Nkomazi MP324 Ehlanzeni - Unqualified - With findings Permanent Permanent
Mpumalanga B Thaba Chweu MP321 Ehlanzeni Financial Distress Qualified Acting Permanent
Mpumalanga C Ehlanzeni DC32 Ehlanzeni - Unqualified - With findings Permanent Permanent
North West B Kgetlengrivier NW374 Bojanala Platinum Financial Distress Disclaimer of opinion Permanent Permanent
North West B Madibeng NW372 Bojanala Platinum Financial Distress Disclaimer of opinion Acting Acting
North West B Moretele NW371 Bojanala Platinum Financial Distress Qualified Acting Acting
North West B Moses Kotane NW375 Bojanala Platinum Financial Distress Qualified Permanent Permanent
North West B Rustenburg NW373 Bojanala Platinum Financial Distress Qualified Acting Acting
North West C Bojanala Platinum DC37 Bojanala Platinum Financial Distress Outstanding Permanent Permanent
North West B Ditsobotla NW384 Ngaka Modiri Molema Financial Distress Disclaimer of opinion Acting Acting
North West B Mafikeng NW383 Ngaka Modiri Molema Financial Distress Disclaimer of opinion Acting Acting
North West B Ramotshere Moiloa NW385 Ngaka Modiri Molema Financial Distress Disclaimer of opinion Permanent Permanent
North West B Ratlou NW381 Ngaka Modiri Molema Financial Distress Disclaimer of opinion Acting Acting
North West B Tswaing NW382 Ngaka Modiri Molema Financial Distress Qualified Permanent Permanent
North West C Ngaka Modiri Molema DC38 Ngaka Modiri Molema - Outstanding Acting Permanent
North West B Greater Taung NW394 Dr Ruth Segomotsi Mompati - Outstanding Permanent Permanent
North West B Kagisano-Molopo NW397 Dr Ruth Segomotsi Mompati Financial Distress Qualified Permanent Permanent
North West B Lekwa-Teemane NW396 Dr Ruth Segomotsi Mompati Financial Distress Disclaimer of opinion Permanent Acting

The State Of Local Government Finances and Financial Management - As at 30 June 2019
Audit Outcomes of the 2018/19 financial year : Analysis Document | 57
ANNEXURE A1
The State Of Local Government Finances and Financial Management - As at 30 June 2019
Audit Outcomes of the 2018/19 financial year : Analysis Document | 57
PROVINCE CAT DEMARCATION DESCRIPTION
DEMARC CODE DISTRICT FINANCIAL
DISTRESS AUDIT OUTCOMES MM VACANCY
CFO VACANCY
North West B Mamusa NW393 Dr Ruth Segomotsi Mompati Financial Distress Outstanding Permanent Permanent
North West B Naledi (NW) NW392 Dr Ruth Segomotsi Mompati Financial Distress Outstanding Acting Permanent
North West C Dr Ruth Segomotsi Mompati DC39 Dr Ruth Segomotsi Mompati Financial Distress Disclaimer of opinion Acting Acting
North West B City of Matlosana NW403 Dr Kenneth Kaunda Financial Distress Qualified Permanent Acting
North West B J B Marks NW405 Dr Kenneth Kaunda Financial Distress Qualified Permanent Permanent
North West B Maquassi Hills NW404 Dr Kenneth Kaunda Financial Distress Disclaimer of opinion Acting Acting
North West C Dr Kenneth Kaunda DC40 Dr Kenneth Kaunda - Qualified Permanent Acting
Northern Cape B Ga-Segonyana NC452 John Taolo Gaetsewe Financial Distress Outstanding Permanent Permanent
Northern Cape B Gamagara NC453 John Taolo Gaetsewe Financial Distress Qualified Permanent Permanent
Northern Cape B Joe Morolong NC451 John Taolo Gaetsewe Financial Distress Disclaimer of opinion Permanent Permanent
Northern Cape C John Taolo Gaetsewe DC45 John Taolo Gaetsewe Financial Distress Unqualified - No findings Permanent Permanent
Northern Cape B Hantam NC065 Namakwa Financial Distress Unqualified - With findings Permanent Permanent
Northern Cape B Kamiesberg NC064 Namakwa Financial Distress Disclaimer of opinion Permanent Acting
Northern Cape B Karoo Hoogland NC066 Namakwa Financial Distress Qualified Permanent Permanent
Northern Cape B Khai-Ma NC067 Namakwa Financial Distress Qualified Permanent Permanent
Northern Cape B Nama Khoi NC062 Namakwa Financial Distress Qualified Permanent Acting
Northern Cape B Richtersveld NC061 Namakwa Financial Distress Qualified Acting Acting
Northern Cape C Namakwa DC6 Namakwa Financial Distress Unqualified - With findings Permanent Permanent
Northern Cape B Emthanjeni NC073 Pixley ka Seme (NC) Financial Distress Qualified Permanent Permanent
Northern Cape B Kareeberg NC074 Pixley ka Seme (NC) - Unqualified - With findings Permanent Permanent
Northern Cape B Renosterberg NC075 Pixley ka Seme (NC) Financial Distress Outstanding Acting Acting
Northern Cape B Siyancuma NC078 Pixley ka Seme (NC) Financial Distress Unqualified - With findings Acting Permanent
Northern Cape B Siyathemba NC077 Pixley ka Seme (NC) Financial Distress Qualified Permanent Permanent
Northern Cape B Thembelihle NC076 Pixley ka Seme (NC) Financial Distress Qualified Permanent Permanent
Northern Cape B Ubuntu NC071 Pixley ka Seme (NC) Financial Distress Qualified Acting Permanent
Northern Cape B Umsobomvu NC072 Pixley ka Seme (NC) Financial Distress Qualified Permanent Permanent
Northern Cape C Pixley Ka Seme (NC) DC7 Pixley ka Seme (NC) Financial Distress Unqualified - With findings Permanent Permanent
Northern Cape B !Kai! Garib NC082 Z F Mgcawu Financial Distress Disclaimer of opinion Acting Acting
Northern Cape B !Kheis NC084 Z F Mgcawu Financial Distress Disclaimer of opinion Acting Acting
Northern Cape B Dawid Kruiper NC087 Z F Mgcawu Financial Distress Unqualified - With findings Permanent Permanent
Northern Cape B Kgatelopele NC086 Z F Mgcawu Financial Distress Disclaimer of opinion Permanent Permanent
Northern Cape B Tsantsabane NC085 Z F Mgcawu Financial Distress Outstanding Permanent Permanent
Northern Cape C Z F Mgcawu DC8 Z F Mgcawu Financial Distress Unqualified - With findings Permanent Permanent
Northern Cape B Dikgatlong NC092 Frances Baard Financial Distress Disclaimer of opinion Permanent Acting
Northern Cape B Magareng NC093 Frances Baard Financial Distress Qualified Permanent Permanent
Northern Cape B Phokwane NC094 Frances Baard - Outstanding Acting Acting
Northern Cape B Sol Plaatje NC091 Frances Baard - Qualified Acting Acting
Northern Cape C Frances Baard DC9 Frances Baard - Unqualified - With findings Permanent Acting
Western Cape A Cape Town CPT Metro - Unqualified - With findings Permanent Permanent
Western Cape B Bergrivier WC013 West Coast - Unqualified - No findings Permanent Permanent
Western Cape B Cederberg WC012 West Coast Financial Distress Unqualified - No findings Permanent Acting
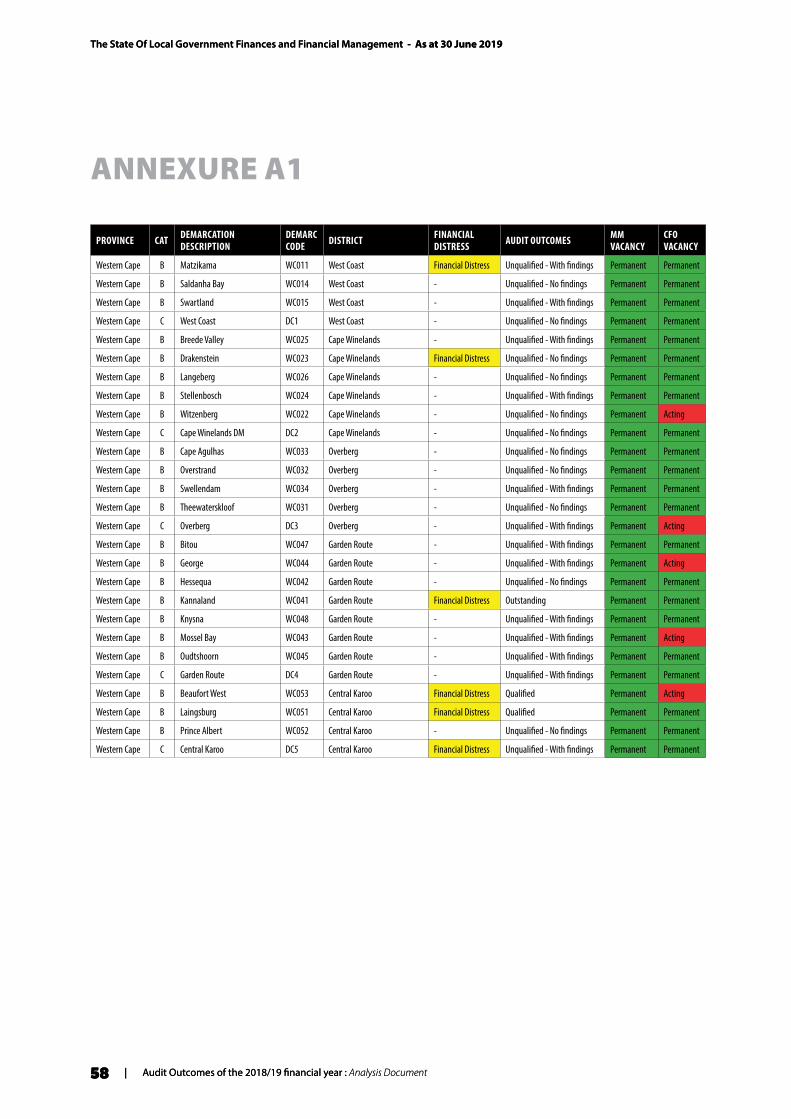
The State Of Local Government Finances and Financial Management - As at 30 June 2019
58 | Audit Outcomes of the 2018/19 financial year : Analysis Document
ANNEXURE A1
The State Of Local Government Finances and Financial Management - As at 30 June 2019
58 | Audit Outcomes of the 2018/19 financial year : Analysis Document
PROVINCE CAT DEMARCATION DESCRIPTION
DEMARC CODE DISTRICT FINANCIAL
DISTRESS AUDIT OUTCOMES MM VACANCY
CFO VACANCY
Western Cape B Matzikama WC011 West Coast Financial Distress Unqualified - With findings Permanent Permanent
Western Cape B Saldanha Bay WC014 West Coast - Unqualified - No findings Permanent Permanent
Western Cape B Swartland WC015 West Coast - Unqualified - With findings Permanent Permanent
Western Cape C West Coast DC1 West Coast - Unqualified - No findings Permanent Permanent
Western Cape B Breede Valley WC025 Cape Winelands - Unqualified - With findings Permanent Permanent
Western Cape B Drakenstein WC023 Cape Winelands Financial Distress Unqualified - No findings Permanent Permanent
Western Cape B Langeberg WC026 Cape Winelands - Unqualified - No findings Permanent Permanent
Western Cape B Stellenbosch WC024 Cape Winelands - Unqualified - With findings Permanent Permanent
Western Cape B Witzenberg WC022 Cape Winelands - Unqualified - No findings Permanent Acting
Western Cape C Cape Winelands DM DC2 Cape Winelands - Unqualified - No findings Permanent Permanent
Western Cape B Cape Agulhas WC033 Overberg - Unqualified - No findings Permanent Permanent
Western Cape B Overstrand WC032 Overberg - Unqualified - No findings Permanent Permanent
Western Cape B Swellendam WC034 Overberg - Unqualified - With findings Permanent Permanent
Western Cape B Theewaterskloof WC031 Overberg - Unqualified - No findings Permanent Permanent
Western Cape C Overberg DC3 Overberg - Unqualified - With findings Permanent Acting
Western Cape B Bitou WC047 Garden Route - Unqualified - With findings Permanent Permanent
Western Cape B George WC044 Garden Route - Unqualified - With findings Permanent Acting
Western Cape B Hessequa WC042 Garden Route - Unqualified - No findings Permanent Permanent
Western Cape B Kannaland WC041 Garden Route Financial Distress Outstanding Permanent Permanent
Western Cape B Knysna WC048 Garden Route - Unqualified - With findings Permanent Permanent
Western Cape B Mossel Bay WC043 Garden Route - Unqualified - With findings Permanent Acting
Western Cape B Oudtshoorn WC045 Garden Route - Unqualified - With findings Permanent Permanent
Western Cape C Garden Route DC4 Garden Route - Unqualified - With findings Permanent Permanent
Western Cape B Beaufort West WC053 Central Karoo Financial Distress Qualified Permanent Acting
Western Cape B Laingsburg WC051 Central Karoo Financial Distress Qualified Permanent Permanent
Western Cape B Prince Albert WC052 Central Karoo - Unqualified - No findings Permanent Permanent
Western Cape C Central Karoo DC5 Central Karoo Financial Distress Unqualified - With findings Permanent Permanent

NOTES

NOTES

THE STATE OF LOCAL GOVERNMENT FINANCES AND
FINANCIAL MANAGEMENT AS AT 30JUNE 2019
Audit Outcomes of the 2018/19 financial yearAnalysis Document
Private Bag X115, Pretoria, 0001 | 40 Church Square, Pretoria, 0002
Tel: +27 12 315 5944 | Fax: +27 12 406 9055
www.treasury.gov.za