Embed Size (px)
Citation preview

THE STATE OF THE INORGANIC COMPONENTS OF HUMAN RED BLOOD CELLS*
BY REBECCA Z. SOLOMON,t PAULINE M. HALD, AND JOHN P. PETERS
(Iborn the Department of Internal Medicine, Yale University School of Medicine, New Haven)
(Received for publication, November 28, 1939)
Under resting conditions-that is, when metabolism is reduced to a minimum by chilling-previous experiments have indicated that sodium, potassium, inorganic phosphorus, and phosphate esters will not traverse the membrane of the red blood cell even when the concentrations of water, sodium, potassium, or inorganic phosphate in the serum are greatly altered (l-3). However, when the metabolic processes in the red blood cells are activated by heating the cells to 37”, inorganic phosphorus may be made to pass in either direction across the cellular membranes (2, 3). Two explanations for the difference in the behavior of the active and resting cells present themselves. The permeability of the red blood cell membrane may vary with the metabolic processes. On the other hand it is possible that in the resting cell sodium, potas- sium, and phosphate are restrained by combination in undisso- ciable or non-diffusible form with substances of such large molecular size that they cannot penetrate the membrane and that these are broken down in the reactions involved in the metabolic processes of the cells. In an effort to determine the relative im- portance of physical and chemical restraints in the segregation of the chemical components within the cell, the passage of sodium, potassium, and phosphate of hemolyzed blood across an artificial membrane was compared with their movements across the intact
* This work was aided by a grant from the Fluid Research Fund of Yale University School of Medicine.
t This article represents work done in fulfilment of the thesis require- ment for the degree of Doctor of Medicine at Yale University School of Medicine.
723
by guest on May 11, 2018
http://ww
w.jbc.org/
Dow
nloaded from

724 Inorganic Components of Red Cells
cell membrane. Such studies have been made before and have seemed to indicate that all the inorganic components of hemolyzed blood are freely diffusible and behave in accordance with the physi- cochemical laws that would govern the distribution of active ions between two fluid phases, one of which contained protein in high concentration. In these experiments, however, no attempt has been made to preserve the vitality of the blood.
The experiments to be reported may be divided into four groups. The first deals with the effect of hemolysis on the glucose and phos- phorus of blood. The second treats of the ultrafiltration at 7” and at 37” of blood which has been hemolyzed by repeated freezing; the third of the ultrafiltration at 7” of blood hemolyzed by the addition of saponin. The last is concerned with t,he pas- sage of sodium, potassium, and phosphorus across the membranes of intact, red blood cells at 7” and 37”.
Methods
Venous blood drawn from non-fasting subjects was defibrinated by stirring with a glass rod and hemolyzed by repeated freezing or by addition of saponin.
Hemolysis by freezing was accomplished by lowering stoppered Pyrex tubes containing 4 or 5 cc. of blood into a thermos bottle which contained liquid air, where they were held until the blood was solidified. The tubes were then withdrawn and placed in water at room temperature until the blood had again become fluid. This process was repeated until hemolysis was sufficiently advanced. Later it was found that ethylene glycol monomethyl ether (commercially known as Cellosolve), cooled to about -78” by the addition of solid carbon dioxide, was a more convenient and efficient freezing medium than liquid air. The progress of hemolysis was followed by repeated blood counts. The red cell count dropped rapidly at first, but with diminishing rapidity in successive freezings (see Fig. 1). At least twenty freezings were required to reduce the count to 200,000 per c.mm. Since no bloods with original counts of less than 4 million cells were used, this means that at most only 5 per cent of the cells remained intact. This proportion of cells would contain a maximum of 0.5 mM of acid-soluble phosphorus and 2 mM of potassium (4, 5). The error that might be introduced by the restraint of such small
by guest on May 11, 2018
http://ww
w.jbc.org/
Dow
nloaded from

Solomon, Hald, and Peters 725
quantities of these substances did not warrant repeating the freezings further.
Hemolysis by Saponin--Since the quantity of saponin needed to hemolyze blood was not known, successive small amounts of the glucoside were added to blood until no intact cells could be detected under the microscope. It was found that complete hemolysis could be secured within 5 minutes by the addition to each cc. of blood of approximately 4 mg. of saponin.
5'
2
4-1 >!
\ .s! G E 3- :: vi
\ \ = ti2
\ \ \ -0 \ 0 \ g \ 1, \
3 w OO
““\ 5 , IO 20 15
Number of freezingg
FIG. 1. The rate of destruction of red cells in blood hemolyaed by freezing.
Ultrajltration-The hemolyzed blood was filtered under posi- tive pressure through cellophane by the method described by Lavietes (6).
Controls-Samples of hemolyzed blood and of whole blood were allowed to stand beside each filter to serve as controls. At the end of the period these controls as well as the ultrafiltrate were subjected to chemical analysis.
Analytical Procedures
Analyses for potassium and sodium were made by the methods of Hald (7).
Both acid-soluble and inorganic phosphorus were determined by a micro modification of the method of Fiske and Subbarow (8).
by guest on May 11, 2018
http://ww
w.jbc.org/
Dow
nloaded from
726 Inorganic Components of Red Cells
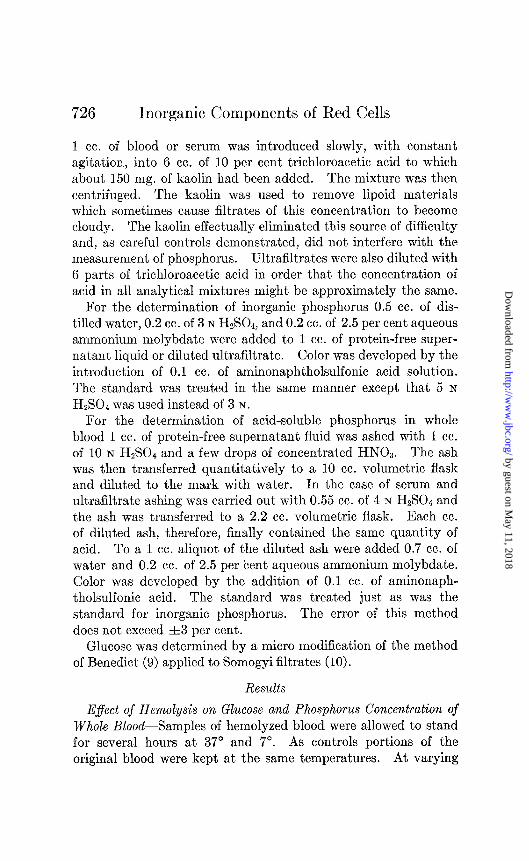
1 cc. of blood or serum was introduced slowly, with constant agitation, into 6 cc. of 10 per cent trichloroacetic acid to which about 150 mg. of kaolin had been added. The mixture was then centrifuged. The kaolin was used to remove lipoid materials which sometimes cause filtrates of this concentration to become cloudy. The kaolin effectually eliminated this source of difficulty and, as careful controls demonstrated, did not interfere with the measurement of phosphorus. Ultrafiltrates were also diluted with 6 parts of trichloroacetic acid in order that the concentration of acid in all analytical mixtures might be approximately the same.
For the determination of inorganic phosphorus 0.5 cc. of dis- tilled water, 0.2 cc. of 3 N HzS04, and 0.2 cc. of 2.5 per cent aqueous ammonium molybdate were added to 1 cc. of protein-free super- natant liquid or diluted ultrafiltrate. Color was developed by the introduction of 0.1 cc. of aminonaphtholsulfonic acid solution. The standard was treated in the same manner except that 5 N
H&SO4 was used instead of 3 N.
For the determination of acid-soluble phosphorus in whole blood 1 cc. of protein-free supernatant fluid was ashed with 1 cc. of 10 N H&S04 and a few drops of concentrated HNO,. The ash was then transferred quantitatively to a 10 cc. volumetric flask and diluted to the mark with water. In the case of serum and ultrafiltrate ashing was carried out with 0.55 cc. of 4 N HzS04 and the ash was transferred to a 2.2 cc. volumetric flask. Each cc. of diluted ash, therefore, finally contained the same quantity of acid. To a 1 cc. aliquot of the diluted ash were added 0.7 cc. of water and 0.2 cc. of 2.5 per bent aqueous ammonium molybdate. Color was developed by the addition of 0.1 cc. of aminonaph- tholsulfonic acid. The standard was treated just as was the standard for inorganic phosphorus. The error of this method does not exceed &3 per cent.
Glucose was determined by a micro modification of the method of Benedict (9) applied to Somogyi filtrates (10).
Results
Effect of Hemolysis on Glucose and Phosphorus Concentration of Whole BloodPSamples of hemolyzed blood were allowed to stand for several hours at 37” and 7”. As controls portions of the original blood were kept at the same temperatures. At varying
by guest on May 11, 2018
http://ww
w.jbc.org/
Dow
nloaded from

Solomon, Hald, and Peters 727
times all of these samples were analyzed for glucose and inorganic phosphorus.
Hemolysis, whether brought about by freezing or by treatment with saponin, tended to retard glycolysis at 37”. In one experi-
TABLE I
Glucose and Phosphorus Concentration of Blood, Hemolyzed by Freezing and with Saponin after Varying Time Intervals at 7” and 37”
All values are in mg. per cent.
Hemolyzed with
3. 3. 4.
13. 20. -
Glu- ccxe
78 68
0
62 0
82 77 88 42 52 52 23
0
s”psn at Liquid air I e
-
2.7
56 17.7 0
2.5 2.7 3.3 4.2
10.5 3.5 65 4.2 51 5.3 23
13.1 0 20.4
XU- cme
89
78 59 56 45 50
0
2.
13.
h1 :ani
P -
2. 6
13. 6 2. 6 2. 6 4. 3 5. 3
12. 0 3. 8 4. 4 8. 0
16. 2 18. 8 - -
83 34
2.7
8.7 3.7 5.3
10.7 13.6 17.3
hrs.
f 2
17
t 4
7 17
01 3
15 3
15
01 15 3 8
20
“C.
23 37 37 23
4 37 37 23
7 7
37 37 23
7 37 37 37
I
II
III
IV
82 78
0
80 30
100 98 88 98 59 59 68 46
0
* At 23” while blood was hemolyzed. t At 4” while blood was hemolyzed. $ Immediately after hemolysis.
ment (Experiment III, Table I) the concentration of glucose in the hemolyzed blood remained unchanged. However, for the same reason glycolysis was not complete in the control blood, since glucose still remained after 15 hours at 37”. As was to be
by guest on May 11, 2018
http://ww
w.jbc.org/
Dow
nloaded from

728 Inorganic Components of Red Cells
expected, at 7” glycolysis was inhibited both in the hemolyzed blood and in the controls.
The inorganic phosphorus rose slightly, but definitely, immedi- ately after hemolysis. It increased markedly in both hemolyzed and control bloods after standing at 37”. At 7” after 15 hours there was sometimes a small change in the controls, while in the hemolyzed samples there was a more definite and consistent rise.
In these experiments at least 2 hours were required to bring about hemolysis by freezing. Hemolysis with saponin consumed about half an hour, because repeated small quantities were added. Therefore, in order to determine the effect of varying time and temperature two control samples were set up. One sample of whole blood was kept at room temperature; the other stood in ice (Experiments II and IV, Table I). In one experiment (Experi- ment II) hemolysis with saponin was brought about at 23” and at 4’. All of these variations had little effect on the behavior of glucose and inorganic phosphorus.
Ultrafiltration of Blood Hemolyxed by Freezing-Freshly drawn blood was defibrinated and divided into two portions. One portion was kept as whole blood; the other was hemolyzed by freezing. As soon as hemolysis was complete, both portions were analyzed for inorganic phosphorus. In addition the whole blood was analyzed for acid-soluble phosphorus, potassium, and in some instances sodium. Samples of the hemolyzed blood were placed in two filters and allowed to stand at temperatures either of 7” or 37”. Tubes containing both whole blood and hemolyzed blood were placed beside the filters to serve as controls. After 18 hours the ultrafiltrate was removed and analyzed for inorganic and acid-soluble phosphorus, potassium, and sodium, while the con- trols were analyzed for inorganic phosphorus. The results of these analyses are presented in Table II.
Substrate was not analyzed directly, because its high viscosity made measurement almost impossible. It was assumed that hydrolysis of phosphate esters would be the same in the substrate as in the hemolyzed blood control. It was feared that lipoid phosphorus or protein phosphorus might possibly be liberated in the hemolyzed blood. However, three control experiments proved conclusively that total acid-soluble phosphorus remained unchanged under the conditions of these experiments. The
by guest on May 11, 2018
http://ww
w.jbc.org/
Dow
nloaded from

I
II
III
IV
V
VI
VII
-
Solomon, Hald, and Peters
TABLE II
Ultrajiltration of Hemol
Solute Initial After 18 hrs.
729
zed Blood
y: 1 Concentration per kilo water
IJ1tr* filtrate
pramrate Substrate
Blood hemolyzed by freezing; filtered at 7”
7n.n m.M rnM n&x CC. 7n.M m.w
Inorganic P 1.08 1.38 2.5 2.46 Organic P 8.30 1.15 K 39.10 53.6 24.2 0.450 Inorganic P 1.14 1.161.17 2.20 3.0 2.83 2.36 0.833 Organic P 16.8916.69 23.90 0.46 0.019 K 34.39 47.80 21.90 0.458 Inorganic P 0.75 0.880.75 2.21 3.0 2.96 2.10 0.710 Organic P 12.6811.70 K 40.44 52.4 42.34 0.808 Na 77.50 98.0 91.30 0.932 Inorganic P 0.71 1.360.74 2.62 3.0 3.40 2.72 0.801 Organic P 8.37 9.52 1.23 0.129 K 37.1 46.3 46.8 1.010 Na 78.7 102.5 79.0 0.770
Blood hemolyzed by freezing; filtered at 37”
Inorganic P 0.99 1.185.65 15.81 2.0 7.55 5.30 Organic P 8.57 4.78 4.07 K 36.7 47.5 34.5 Na 81.4 100.0 116.7 Inorganic P 0.83 7.17 5.33 Organic P 11.26 8.17 8.24 Inorganic P 0.75 1.666.50 6.50 2.0 8.44 5.87 Organic P 7.68 6.00 6.43 K 41.5 54.3 40.3 Na 79.0 97.1 110.6
Blood hemolyzed by saponin; filtered at 7”
0.702 0.852 0.726 1.167 0.743 1.007 0.696 I .070 0.742 1.140
VIII Inorganic P 0.60 0.71’0.62 1.34 0.75 1.70 1.56 0.920 Organic P 4.86 5.16 5.57 1.078 K 33.56 44.2 7.84 0.177 Na 91.20 114.5 122.5 1.070
by guest on May 11, 2018
http://ww
w.jbc.org/
Dow
nloaded from

Inorganic Components of Red Cells
TABLE II-Concluded
Blood hemolyzed by saponin; filtered at 7”-Concluded
rnM nod m‘u ?nM cc. n&M n&M
IX Inorganic P 0.70 / 1 0.92 1.35t3.24t 1.25 1.97 Organic P 6.01 K 46.1 Na 70.8
0.83 ~ 0.980.75 ~ 2.76
57.5 58.9 1.023 89.1 84.1 0.943
X Inorganic P i
1.0 3.46 3.08 0.890 Organic P 5.98
37.7 ! 4.41 3.36 0.763
K 48.2 31.9 0.662 Na 95.8 120.2 108.0 0.900
* These values in this column were calculated as described in the text; all others were directly measured.
t Blood stood 18 hours at 23”.
concentration of each constituent in the substrate was estimated by subtracting from the total amount of this substance originally in the blood the amount which had passed into the filtrate and dividing the residue by the volume of substrate that remained. These estimates are not exact, because measurements of volume could only be approximated. The ultrafilters, which were filled to capacity each time, were supposed to contain 20 cc. Actually some of them may have held as little as 17 cc. In every experi- ment as much ultrafiltrate as possible was removed for analysis. The total volume of ultrafiltrate was assumed to be equal to the sums of the volumes taken for analysis plus 0.5 cc. to account for the amounts lost in wetting pipettes and containers and left in the ultrafilter. Recovery tests indicate that these estimations may be too great, by 0.2 cc.
To learn whether solutes are freely ultrafiltrable, it is necessary to compare concentrations per unit of water rather than concen- trations per unit of volume. To estimate the proportions of water in substrate and ultrafiltrate, it was assumed that each sample
by guest on May 11, 2018
http://ww
w.jbc.org/
Dow
nloaded from

Solomon, Hald, and Peters 731
of blood originally contained 80 per cent and the ultrafiltrate 100 per cent of water.
The final concentrations of solutes in the water of substrate and ultrafiltrate and their distribution ratios are included in Table II. It is appreciated that quantitative deductions based on such rough measurements and so many assumptions must be made with caution. However, they do permit comparison of the relative filtrability of the various solutes at least.
Except for the initial burst immediately resulting from hemolysis inorganic phosphate remained unchanged in hemolyzed blood kept at 7”, but increased at the expense of organic phosphate esters at 37”. If it is assumed that hydrolysis proceeded at the same rate in substrate as it did in the control hemolyzed blood, the final concentration of inorganic phosphate was greater in substrate than filtrate. Since the Gibbs-Donnan equilibrium requires that the concentration in filtrate be higher and the cellophane mem- brane is quite permeable to the phosphate ion, this indicates that a certain proportion of the inorganic phosphate is restrained by some force other than the membrane or the Donnan equilibrium. The divergence from theory (more than 30 per cent) is so great that it can hardly be attributed to errors of analysis and measurement. Moreover it is quite as great in the 37“ as in the 7” experiments, although in the former inorganic phosphorus concentrations are greatly increased.
At 7” the organic acid-soluble phosphorus of blood hemolyzed by freezing remains practically unchanged. Furthermore, although the esters of which this fraction of phosphorus is supposed to be composed are of relatively small molecular size and should be freely diffusible, only negligible quantities escaped with the ultrafiltrate. In this case the disparity of distribution is unequiv- ocal. There cannot be a shadow of doubt that most, if not all, the phosphate esters are restrained, and it is hard to conceive of any restraining force of this magnitude other than combination with compounds of such large molecular size that they cannot traverse the membrane. When the blood is incubated, a large proportion of the organic phosphate is hydrolyzed. At the same time the remainder becomes ultrafiltrable, as if hydrolysis, under the influence of incubation, was accompanied by rupture of the combinations by which the organic phosphates were held at 7”.
by guest on May 11, 2018
http://ww
w.jbc.org/
Dow
nloaded from
732 Inorganic Components of Red Cells
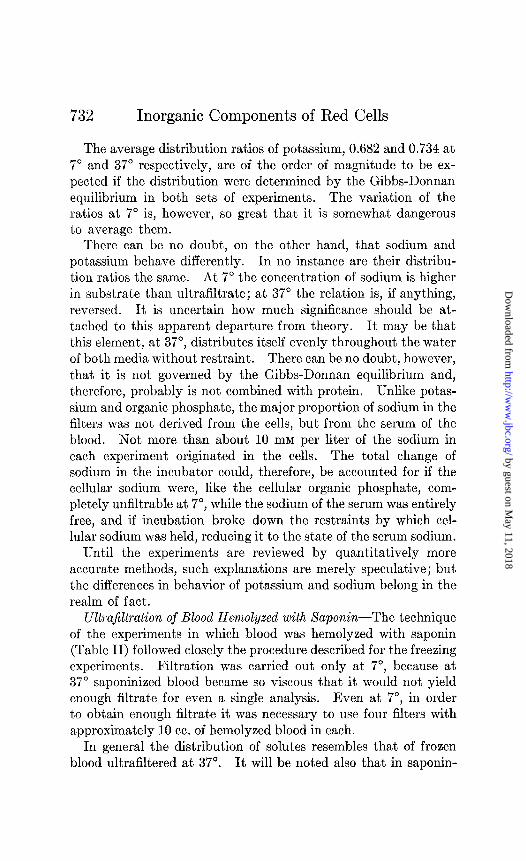
The average distribution ratios of potassium, 0.682 and 0.734 at 7” and 37” respectively, are of the order of magnitude to be ex- pected if the distribution were determined by the Gibbs-Donnan equilibrium in both sets of experiments. The variation of the ratios at 7” is, however, so great that it is somewhat dangerous to average them.
There can be no doubt, on the other hand, that sodium and potassium behave differently. In no instance are their distribu- tion ratios the same. At 7” the concentration of sodium is higher in substrate than ultrafiltrate; at 37” the relation is, if anything, reversed. It is uncertain how much significance should be at- tached to this apparent departure from theory. It may be that this element, at 37”, distributes itself evenly throughout the water of both media without restraint. There can be no doubt, however, that it is not governed by the Gibbs-Donnan equilibrium and, therefore, probably is not combined with protein. Unlike potas- sium and organic phosphate, the major proportion of sodium in the filters was not derived from the cells, but from the serum of the blood. Not more than about 10 mM per liter of the sodium in each experiment originated in the cells. The total change of sodium in the incubator could, therefore, be accounted for if the cellular sodium were, like the cellular organic phosphate, com- pletely unfiltrable at 7”, while the sodium of the serum was entirely free, and if incubation broke down the restraints by which cel- lular sodium was held, reducing it to the state of the serum sodium.
Until the experiments are reviewed by quantitatively more accurate methods, such explanations are merely speculative; but the differences in behavior of potassium and sodium belong in the realm of fact.
Ultrafiltration of Blood Hemolyzed with Xaponin-The technique of the experiments in which blood was hemolyzed with saponin (Table II) followed closely the procedure described for the freezing experiments. Filtration was carried out only at 7”, because at 37” saponinized blood became so viscous that it would not yield enough fi1trat.e for even a single analysis. Even at 7”, in order to obtain enough filtrate it was necessary to use four filters with approximately 10 cc. of hemolyzed blood in each.
In general the distribution of solutes resembles that of frozen blood ultrafiltered at 37”. It will be noted also that in saponin-
by guest on May 11, 2018
http://ww
w.jbc.org/
Dow
nloaded from

Solomon, Hald, and Peters 733
treated blood, although organic phosphate esters are preserved quite as completely as they are in frozen blood at 7”, they diffuse across the membrane as freely as they do in the frozen blood only at 37”. Sodium again is more evenly distributed than potassium, with ratios so near 1.0 as to give the impression that it filters with- out restraint. Again the distribution of potassium is extremely variable, averaging about what the Gibbs-Donnan equilibrium would predict. The variations seem altogether too large, how- ever, to be attributed to analytical errors. Moreover, in every instance sodium was measured on filtrates of the samples from which potassium had been precipitated, and the sodium ratios are highly consistent.
Permeability of Red Cell Membrane to Sodium, Potassium, and Phosphorus at 7” and 37”-Freshly drawn whole blood, after defibrination, was divided into three portions. From the first, serum was separated at once and stored in the refrigerator. The other two portions of whole blood were allowed to stand for 18 hours at 7” and 37” respectively. Serum was then separated from both. These and the original serum were then analyzed for protein, potassium, sodium, and inorganic and acid-soluble phos- phorus. The results of these analyses are presented in Table III.
The close agreement of the proteins at the beginning and end of each experiment shows that at 7” transfers of water were not appreciable. Both inorganic and organic acid-soluble phosphorus also remained unchanged. Potassium and sodium, however, seem to have crossed the cell membrane in opposite directions and in nearly equivalent amounts. The exchanges in Experiments III and IV are unmistakably large. While they are not so striking in Experiments I and II, they are nevertheless consist.ent in direction and equivalence. In previous experiments, referred to above (1, 2), these exchanges were not discovered for certain reasons. First of all, the blood was allowed to stand only until equilibrium had been attained, not 18 hours as it was in the pres- ent experiments. Secondly it was analyzed only for total base or for sodium. The exchanges here presented would, of course, have escaped detection by total base analyses because the trans- fers of potassium and sodium balance one another. In most instances, moreover, they were so small that one would have hesitated to attribute any significance to them from measurements
by guest on May 11, 2018
http://ww
w.jbc.org/
Dow
nloaded from
734 Inorganic Components of Red Cells
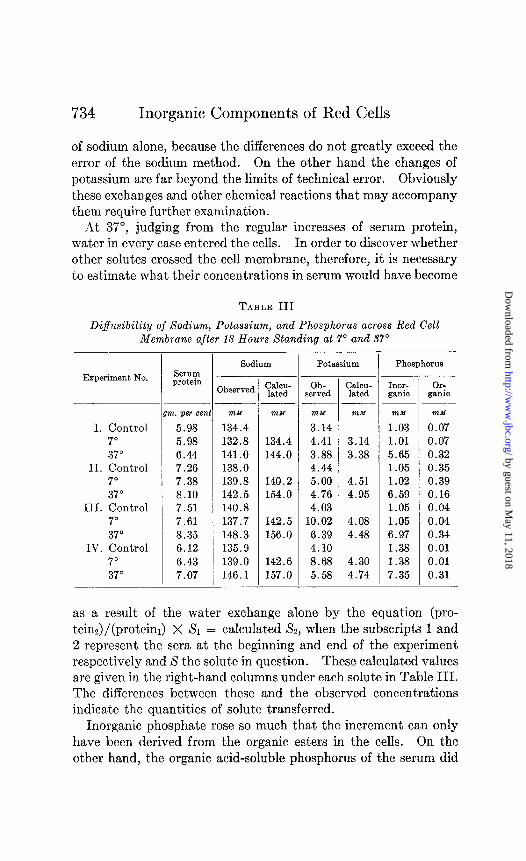
of sodium alone, because the differences do not greatly exceed the error of the sodium method. On the other hand the changes of potassium are far beyond the limits of technical error. Obviously these exchanges and other chemical reactions that may accompany them require further examination.
At 37”, judging from the regular increases of serum protein, water in every case entered the cells. In order to discover whether other solutes crossed the cell membrane, therefore, it is necessary to estimate what their concentrations in serum would have become
TABLE III
Diffusibility of Sodium, Potassium, and Phosphorus across Red Cell Membrane after 18 Hours Standing at 7” and 37”
Experiment No.
I. Control 7” 37”
II. Control 7” 37”
III. Control 7” 37”
IV. Control 7” 37”
SWXXI protein
m. per cm
5.98 5.98 6.44 7.26 7.38 8.10 7.51 7.61 8.35 6.12 6.43 7.07
(
t
Sodium
3bserved
nzM
134.4 132.8 141.0 138.0 139.8 142.5 140.8 137.7 148.3 135.9 139.0 146.1
nz2.f
134.4 144.0
140.2 154.0
142.5 156.0
142.6 157.0
_-
-
Ob- served
n&M
3.14 4.41 3.88 4.44 5.00 4.76 4.03
10.02 6.39 4.10 8.68 5.58
- , C&U- lated
nzM
3.14 3.38
4.51 4.95
4.08 4.48
4.30 4.74
-
Phosphorus -
IWX- ganic
Or- ganic
?nM 7n.u
1.03 0.07 1.01 0.07 5.65 0.32 1.05 0.35 1.02 0.39 6.59 0.16 1.05 0.04 1.05 0.04 6.97 0.34 1.38 0.01 1.38 0.01 7.35 0.31
as a result of the water exchange alone by the equation (pro- teinJ/(proteim) X X1 = calculated X2, when the subscripts 1 and 2 represent the sera at the beginning and end of the experiment respectively and S the solute in question. These calculated values are given in the right-hand columns under each solute in Table III. The differences between these and the observed concentrations indicate the quantities of solute transferred.
Inorganic phosphate rose so much that the increment can only have been derived from the organic esters in the cells. On the other hand, the organic acid-soluble phosphorus of the serum did
by guest on May 11, 2018
http://ww
w.jbc.org/
Dow
nloaded from

Solomon, Hald, and Peters 735
not rise. Analyses of blood showed that after 18 hours at 37” from 2.2 to 4.0 mM of organic acid-soluble phosphorus per liter still remained in the cells. The esters of which this was composed must, therefore, have been unable to traverse the cell membrane. While changes in potassium were relatively small, they were too great to be referred entirely to transfers of water. Some potas- sium seems to have escaped from the cells in every case. On the other hand, since sodium rose far less than protein, it must have passed into the cells. The quantities of sodium that left the serum, moreover, were far greater than the potassium that en- tered. For phosphate and sodium to move in opposite directions may seem anomalous at first, but it must be recognized that the blood becomes acid in the incubator.
DISCUSSION
The sudden increase of inorganic phosphorus immediately after blood is hemolyzed indicates that the integrity of the cellular contents is not entirely preserved. Further evidence to this effect is found in the retardation of glycolysis. That vital processes are not entirely abolished is evidenced by the fact that glycolysisdoes occur, though at a reduced rate. It is rather generally stated that rupture of the cellular membranes abolishes glycolysis. This statement rests upon experiments in which blood was hemolyzed by the addition of water (11, 12). Obviously the method by which hemolysis is effected is not a matter of indifference. Frozen blood differs strikingly from blood to which saponin is added. The former, in consistency, ‘more clearly resembles intact blood; the latter is far more viscous. These differences are reflected in chemical behavior. Frozen blood acts much as does intact blood so far as phosphates are concerned. The organic esters remain intact as long as the blood is kept cold, but break down at incu- bator temperature. For this reason and because freezing has proved to be the best means of preserving the chemical composition of muscle cells, it seems reasonable to suppose that the state of the cellular constituents of blood will be least altered by this procedure.
If this assumption is justified; it may be inferred that organic phosphate esters in the intact resting cell are restrained from escaping by some force in addition to the membrane of the cell. The simplest restraining force that can be conceived is chemical
by guest on May 11, 2018
http://ww
w.jbc.org/
Dow
nloaded from

Inorganic Components of Red Cells
aggregation or combination with substances of large molecular size. At incubator temperature under the conditions of these experiments, without provision of nourishment or oxygen, the chemical reactions in the blood are not to be regarded as normal metabolic activities, but rather as processes of degradation or disintegration. In intact blood they can be reversed by addition of glucose (3); whether such a reversal could be effected after hemolysis remains to be determined. If the reactions in hemo- lyzed and intact blood are the same, these degradation processes involve not only the breakdown of a certain amount of organic phosphate but also resolution of the chemical restraint placed upon the remainder of the phosphate esters.
If the reactions in hemolyzed and intact blood are the same, it becomes at once apparent at this point that the effect or purpose of the chemical restraint is not to prevent loss of organic phosphate from the cell. This is effectively prevented by the physical restraint imposed by the membrane. At 37” in hemolyzed blood the organic phosphate residue moves freely across cellophane, but in intact blood no appreciable amount escapes from the cells. If the cellular envelope is impervious to free organic phosphate esters, as these experiments suggest, the chemical restraint must serve only to diminish or abolish the osmotic activity of the phosphate esters. The cells would by this means be enabled to vary their load of these important constituents without being compelled to assume or deliver an equivalent amount of water. The vari- ability of the concentration of organic phosphate so far exceeds that of water or other chemical constituents of the red blood cells that some such osmotic defense would have to be postulated, even if it could not be dem0nstrated.l
The saponin experiments served two purposes: first to demon- strate that the chemical restraint can be dissociated from the reactions that attend glycolysis; second to prove that the non- filtrability of organic phosphate of frozen blood at 7” was not referable merely to the temperature. Cold inhibited glycolysis and hydrolysis of phosphate esters quite as effectively in the blood
1 In the present experiments organic phosphorus of whole blood varied from 4.8 to 16.7 mM per liter. In blood with the normal proportions of cells containing the usual amounts of water, this would be equivalent to 15 to 55 mM per liter of cell water.
by guest on May 11, 2018
http://ww
w.jbc.org/
Dow
nloaded from

Solomon, Hald, and Peters 737
treated with saponin as it did in the frozen blood. Nevertheless, in the former the organic phosphates became filtrable, whereas in the latter they did not.
As far as potassium and sodium are concerned, the experiments give less clear cut information. The results are less consistent and less striking. There can be no doubt, however, that the behavior of the two elements is quite different; and this difference must signify that at least a fraction of one or both elements is under restraint. Again the experiments with whole blood prove that it is not this restraint which determines their disparate distribution between cells and serum. For this the cell membrane must still be held responsible. The chemical restraint only conditions or modifies their osmotic activity. Although at 7” some sodium and potassium is transferred across the cell membranes, the quantities are small; even at 37” distribution coefficients do not approximate those found in hemolyzed blood. The distribution coefficients of the two bases in the latter suggest that potassium plays a major role in combining with protein. The difference between the dis- tribution coefficients of sodium in frozen chilled blood and in incubated or saponin-treated blood suggests that sodium may be associated with organic phosphates. To draw any such exact conclusions from these rough preliminary observations, however, would be hazardous in the extreme.
SUMMARY
1. When blood is hemolyzed ‘by repeated freezing or by the addition of saponin, glycolysis and hydrolysis of phosphate esters proceed at a slower rate than they do in intact blood, but are not abolished.
2. When blood hemolyzed by these methods was ultrafiltered through cellophane, phosphates, sodium, and potassium did not distribute themselves between the water of ultrafiltrate and sub- strate as if they were restrained only by the Gibbs-Donnan equilibrium. (a) Under all conditions the concentration of inorganic phosphate was higher in the water of substrate. 0)) Potassium distributed itself always according to the dictates of the Gibbs-Donnan equilibrium. (c) In blood hemolyzed by freezing, after 18 hours at 7”, the acid-soluble organic phosphorus remained unchanged and acted as if it was completely non-
by guest on May 11, 2018
http://ww
w.jbc.org/
Dow
nloaded from

Inorganic Components of Red Cells
filtrable. Under the same conditions the concentration of sodium was higher in the substrate. (d) In blood hemolyzed by saponin, after 18 hours at 7”, acid-soluble organic phosphorus, though intact, distributed itself equally between the water of substrate and ultrafiltrate. Sodium also appeared to be uniformly dis- tributed. (e) In blood hemolyzed by freezing, after 18 hours at 37”, acid-soluble organic phosphorus was largely converted to inorganic phosphate, but the residual organic phosphate was distributed evenly throughout the water of substrate and filtrate. Sodium also appeared to be uniformly distributed.
3. The action of the same solutes in intact blood kept 18 hours at 7” and 37” was investigated. (a) At 7” organic acid-soluble phosphorus remained unchanged, imprisoned in the cells. A small amount of potassium escaped from the cells, while an equivalent amount of sodium passed in the reverse direction. @I At 37” a large proportion of the organic acid-soluble phosphorus was broken down and much of the inorganic phosphorus derived from it passed into the serum, but no organic phosphate appeared to escape from the cells. A small amount of potassium left the cells and a far larger amount of sodium moved in the reverse direction.
4. The implications of these experiments with respect to the state of phosphates, potassium, and sodium in the red blood cells are discussed.
BIBLIOGRAPHY
1. Wakeman, A. M., Eisenman, A. J., and Peters, J. P., J. Biol. Chem., 73, 567 (1927).
2. Eisenman, A. J., Hald, P. M., and Peters, J. P., J. Biol. Chem., 118, 289 (1937).
3. Halpern, L., J. Biol. Chem., 114, 747 (1936). 4. Hald, P. M., and Eisenman, A. J., J. Biol. Chem., 118,275 (1937). 5. Peters, J. P., and Van Slyke, D. D., Quantitative clinical chemistry,
Interpretations, Baltimore, 1097 (1931). 6. Lavietes, P. H., J. Biol. Chem., 120,267 (1937). 7. Hald, P. M., J. Biol. Chem., 103, 471 (1933). 8. Fiske, C. H., and Subbarow, Y., J. Biol. Chem., 66, 375 (1925). 9. Benedict, S. R., J. Biol. Chem., 68, 759 (1926).
10. Somogyi, M., Proc. Xoc. Exp. Biol. and Med., 26, 353 (1929). 11. Rona, P., and Diiblin, A., Biochem. Z., 32,489 (1911). 12. Martland, M., Hansman, F., and Robison, R., Biochem. J., 18, 1152
(1924).
by guest on May 11, 2018
http://ww
w.jbc.org/
Dow
nloaded from

John P. PetersRebecca Z. Solomon, Pauline M. Hald and
BLOOD CELLSCOMPONENTS OF HUMAN RED
THE STATE OF THE INORGANIC
1940, 132:723-738.J. Biol. Chem.
http://www.jbc.org/content/132/2/723.citation
Access the most updated version of this article at
Alerts:
When a correction for this article is posted•
When this article is cited•
alerts to choose from all of JBC's e-mailClick here
tml#ref-list-1
http://www.jbc.org/content/132/2/723.citation.full.haccessed free atThis article cites 0 references, 0 of which can be by guest on M
ay 11, 2018http://w
ww
.jbc.org/D
ownloaded from