Embed Size (px)
Citation preview
Journal of Statistics Education, Volume 20, Number 1(2012)
1
The Statistics Teaching Inventory: A Survey on Statistics Teachers’
Classroom Practices and Beliefs
Andrew Zieffler
Jiyoon Park
Joan Garfield
Robert delMas
Audbjorg Bjornsdottir
University of Minnesota
Journal of Statistics Education Volume 20, Number 1 (2012),
www.amstat.org/publications/jse/v20n1/zieffler.pdf
Copyright © 2012 by Andrew Zieffler, Jiyoon Park, Joan Garfield, Robert delMas, and Audbjorg
Bjornsdottir all rights reserved. This text may be freely shared among individuals, but it may not
be republished in any medium without express written consent from the authors and advance
notification of the editor.
Key Words: Statistics education research; Teaching practice; Teacher beliefs
Abstract
This paper reports on an instrument designed to assess the practices and beliefs of instructors of
introductory statistics courses across the disciplines. Funded by a grant from the National
Science Foundation, this project developed, piloted, and gathered validity evidence for the
Statistics Teaching Inventory (STI). The instrument consists of 50 items in six parts and is
administered online. The development of the instrument and the gathering and analysis of
validity evidence are described. Plans and suggestions for use of the STI are offered.
1. The Teaching of Introductory Statistics At The College Level
In 2005 the Board of Directors of the American Statistical Association approved the Guidelines
for Assessment and Instruction in Statistics Education (GAISE) for both the K–12 and college
levels. Following years of “reform efforts”–that produced workshops, papers and NSF grants–
GAISE was an attempt to make the need for reform more visible and to make recommendations
about important features of a modern, introductory statistics class. The GAISE college report
(ASA, 2005) described a set of guidelines for teaching the introductory, college statistics course
and included six basic recommendations:

Journal of Statistics Education, Volume 20, Number 1(2012)
2
1. Emphasize statistical literacy and develop statistical thinking.
2. Use real data.
3. Stress conceptual understanding rather than mere knowledge of procedures.
4. Foster active learning in the classroom.
5. Use technology for developing conceptual understanding and analyzing data.
6. Integrate assessments that are aligned with course goals to improve as well as evaluate
student learning.
The intent of these recommendations was to encourage statistics instructors to make introductory
statistics courses more modern, engaging and authentic.
The response from the statistics education community to the publication of the recommendations
in the GAISE college report has been positive, with many talks, workshops and publications that
advocate these guidelines. Textbooks have even been marketed by stressing the alignment of the
materials with these guidelines. Has the publication of the GAISE college report, or the activities
and publications following the report, had an impact on the teaching of statistics? In an effort to
gather evidence on this impact, the development of a survey was funded by a grant from the
National Science Foundation (STEPS Project, NSF DUE-0808862). The instrument that emerged
from this project, the Statistics Teaching Inventory (STI), was designed to obtain data about
statistics instructors‟ practices and beliefs about the teaching and learning of statistics across
institutions and disciplines.
The focus of this paper is to document the development process of the STI, including the initial
collection and analysis of pilot data. These data suggest further improvements to the instrument
and also form the beginning of the long task of collecting evidence used to support the validity of
the inferences that may eventually be drawn from the STI responses. As a precursor, however, a
short review of the literature related to research on teaching practices and beliefs is presented.
2. Studies of Teaching Practice and Beliefs
Little work has been published on instruments that have been used to assess the teaching of
statistics. Recently Hassad (2011) examined the teaching practices of 227 college-level
instructors of introductory statistics from the health and behavioral sciences. He created a 10-
item scale that was used to assess teaching practice, by categorizing teachers as following more
of a constructivist orientation to teaching as opposed to what he calls a behaviorist approach to
teaching.
In other literature on assessing the practice and beliefs of instructors, studies have explored the
influence of the instructor on student learning. Studies at the primary, secondary, and tertiary
levels have examined teachers‟ conceptions (e.g., Boulton-Lewis, Smith, McCrindle, Burnett &
Campbell 2001; Kember 1997), teachers‟ perspectives (e.g., Pratt 2002), and teachers‟
knowledge and beliefs (e.g., Calderhead 1996; Meijer, Verloop & Beijaard 1999; Pajares 1992).
Meirink, Meijer, Verloop & Bergen (2009) noted that instructors‟ beliefs about student learning,
and subsequently the research examining them, are typically oriented toward one of two
ideologies, a teacher- or subject-matter-orientation (often referred to as the “traditional”
Journal of Statistics Education, Volume 20, Number 1(2012)
3
perspective), or a learner-orientation (referred to as a “reformed” perspective). The majority of
this research has tended to focus on the extent to which teachers‟ beliefs regarding instruction are
aligned with either of these two ideologies.
Researchers have also found that it is very difficult for teachers to change their beliefs about
teaching (Kane 2002; Pajares 1992). In science and mathematics education where the reform
movement occurred earlier, research revealed that teachers are reluctant to change their ways of
teaching in spite of evidence for the effectiveness of the reformed teaching methods (e.g.,
Meirink et al. 2009). This resistance to change is also documented in a survey study of statistics
instructors (Garfield, Hogg, Schau, & Whittinghill 2002).
Studies on the relationship between teaching beliefs and practice have found that instructors‟
beliefs often drive their teaching practices (Pajares 1992; Richardson 1996; Thompson 1984).
Similarly, other researchers (e.g., Bailey 1992; Golombek 1998) assert the notion that changes in
teachers‟ beliefs precede changes in their teaching practices. Hampton (1994) also notes that
teachers‟ beliefs or “personal constructs” determine how they approach their teaching.
The researchers studying the relationship between instructors‟ espoused beliefs and their
classroom practices have reported contradictory results. While the results of some studies have
suggested that there is a match between what teachers say they believe and what they do in the
classroom (e.g., Reed 2002; Tsai 2006), others have reported a mismatch between the two (e.g.,
Brown 1985; Cooney 1985; as cited in Kane 2002).
While the literature does not address the development of an instrument directly, it does, as a
whole, highlight several design considerations. For example, the research reviewed above
suggests that in designing a teaching inventory, separate scales of an instrument that measures
teachers‟ characteristics and practices, and teachers‟ beliefs about teaching and learning in
specific disciplines are needed (e.g., Roehrig, Turner, Grove, Schneider & Liu 2009). It also
suggests that items that help distinguish teacher-centered or student-centered ideologies would
also be useful in such an inventory (e.g., Meirink, Meijer, Verloop & Bergen 2009). In the next
section, the design process used to create the Statistics Teaching Inventory is described.
3. The Statistics Teaching Inventory (STI)
During the initial development of the STI, the project team had many discussions on the topics
and constructs to be measured on the instrument. Using the recommendations and learning goals
reported in the college-level GAISE document as a blueprint, several items were drafted for the
STI. The project team discussed and refined these items, and also considered potential sets of
items (scales) that might be useful when gathering responses. During these meetings, the
robustness of the items for use across different settings and schedules (e.g., labs/recitations, etc.),
with differing levels of TA support was also considered. Finally, additional items intended to
measure more abstract constructs (e.g., instructors‟ attempts to “promote statistical thinking”)
were discussed, written, and refined.
The initial draft version of the STI, which included 102 items, was piloted with members of the
statistics education community–members of the Consortium for the Advancement of
Journal of Statistics Education, Volume 20, Number 1(2012)
4
Undergraduate Statistics Education (CAUSE) and the Research Advisory Board (RAB) of
CAUSE. These groups, as well as the NSF project advisors, also provided written feedback on
each of the items. The feedback and the pilot results provided three types of information: items
that did not appear to be interpreted in a consistent manner by survey respondents, items that
were redundant, and topics that were missing from the STI. This information was used to refine
some of the items and also to add and remove items to the instrument to remove redundancy and
to achieve better content coverage.
Think-aloud interviews were then conducted using the revised instrument. The goal of these
interviews was to make sure faculty outside of the statistics education community would
interpret the questions as intended by the authors, which provided validity evidence based on
response processes elicited by the respondents (American Educational Research Association,
American Psychological Association, & National Council on Measurement in Education 2002).
The response processes involved in interpreting each item were analyzed to diagnose problems
in the items.
The interview participants consisted of two groups of University of Minnesota faculty, and a
group of statistics educators from postsecondary institutions across the United States. One of the
University of Minnesota groups consisted of two statisticians teaching in departments outside of
statistics and mathematics (e.g., psychology; business). The other University of Minnesota group
was made up of two education researchers from postsecondary Scientific, Technology,
Engineering and Mathematical (STEM) disciplines. The group of post-secondary statistics
educators consisted of six members of the CAUSE Research Advisory Board.
During the interviews, the interviewers read each item to the participants, and then recorded the
participants‟ responses and processes. When conducting these interviews, the interviewers
interjected very little, except to prompt the participants during pauses to verbalize their thought
processes as they responded to the items. At the end of the interview, the participants were asked
to suggest any content that they felt was missing from the survey.
The interviews helped the development team to identify slight differences in the interpretation of
the items, as well as some additional domain content that was not covered. Using the information
from the interviews, the STI was again revised. Small-scale, online pilot testing was conducted
on this third version of the STI using a sample of statistics educators from the greater
Minneapolis/St. Paul area. The pilot results, as well as the written feedback from the pilot
participants, resulted in a 50-item version consisting of six parts: Teaching Practice; Assessment
Practice; Course Characteristics; Teaching Beliefs; Assessment Beliefs; and Additional
Information. The two parts, Course Characteristics and Additional Information, were included to
gather data on course and teacher characteristics, respectively. Since the items in both the
Teaching Practice and Course Characteristics parts of the STI asked respondents to respond in
reference to a particular course, the Course Characteristics part of the instrument was positioned
immediately after Teaching Practice. The Additional Information part of the instrument was
placed at the end of the survey to adhere to good principles of survey design (see for example,
Dillman 2007). This version of the STI instrument is presented in Appendix A.
Journal of Statistics Education, Volume 20, Number 1(2012)
5
The six parts of the STI were intended to gather data related to particular aspects of teachers‟
practices and beliefs about teaching and learning statistics. In what follows, we separately
describe the design and construction of the four parts of the survey related to teaching and
assessment (Teaching Practice, Assessment Practice, Teaching Beliefs; Assessment Beliefs).
These items are of primary importance and constitute the majority of the items on the STI. In an
additional subsection, the items in the Course Characteristics and Additional Information parts
of the STI are described.
3.1 Teaching Practice
The 11 items in this section were intended to measure the extent to which instructors use the
learner-oriented pedagogical methods endorsed in the GAISE college report in their classroom
practice. All the items in this section were presented using five frequency-based response
categories to assess the extent to which an instructor teaches using each method. To minimize the
response bias associated with item scales that are worded in a single direction (Churchill 1979;
Couch & Kenniston 1960; Nunnally 1978), we used mixed-worded scales. Eight of the 11 items
were worded so that a response indicating a higher frequency indicated more alignment with the
learner-oriented pedagogical methods endorsed in the GAISE college report. The other three
items were worded so that a response indicating a lower frequency was more aligned with the
learner-oriented pedagogical methods endorsed in the report.
3.2 Assessment Practice
The 10 items included in this scale were intended to measure the degree to which instructors use
assessment methods endorsed in the GAISE college report in their classroom practice. Unlike the
items in the Teaching Practice section in which frequency response categories were employed,
the items in the Assessment Practice section employed dichotomous response categories. The
decision to use dichotomous response categories was made because the authors felt that in
considering the variation in assessment practices, it would be easier for respondents to indicate
whether or not a particular assessment method was being used, than for them to report the
frequency of use.
3.3 Teaching Beliefs
The 10 items included in this section were intended to measure the degree to which an
instructor‟s beliefs about teaching statistics correspond to the learner-oriented pedagogic
methods endorsed in the college-level GAISE document. Eight of the 10 items in this section
were presented using four Likert-based response categories to assess the extent to which an
instructor agreed with statements regarding the teaching of introductory statistics. Four of these
items were written such that a higher level of agreement indicated more belief in the learner-
oriented pedagogic methods endorsed in the college-level GAISE document, and four were
written such that a lower level of agreement indicated more belief in the learner-oriented
pedagogic methods endorsed in the document. The response category “undecided” was also
included for each of the eight items since it was felt that it was necessary to distinguish
respondents who were truly undecided from those that had beliefs about the statement. The other
Journal of Statistics Education, Volume 20, Number 1(2012)
6
two items presented in this section used frequency-based response categories because of the
nature of the questions.
3.4 Assessment Beliefs
The six items included in the Assessment Beliefs section are intended to measure the degree to
which a statistics instructor‟s beliefs about assessment correspond to assessment methods
endorsed in the GAISE college report. Five items in this section utilized a Likert-based response
scale of agreement with four options. These items also included a response option of
“undecided”. All five items were written such that a higher level of agreement indicated more
belief in the assessment methods endorsed in the college-level GAISE document. The remaining
item used five frequency-based response categories because of the nature of the question.
3.5 Teacher and Institutional Characteristics and Constraints
These two parts of the STI were intended to gather data related to course, instructor and
institutional characteristics. Of the 13 items included in these parts, three were related to course
characteristics: number of students enrolled, mathematical prerequisite(s), and whether or not
teaching assistants were used. Nine items asked for additional information such as the type of
institution, teaching experience of the respondent, and the respondent‟s awareness of the
recommendations in the GAISE college report. One item was included to collect information
about potential constraints keeping the instructor from making changes to the course, and a final
item was included to ask whether or not the respondent was willing to be interviewed as part of a
validation study of the STI.
4. Pilot Test of the STI and Validity Evidence
Pilot data were collected during a large-scale, online administration of the STI during the late
spring and early summer of 2009. Registrants for the 2009 United States Conference on
Teaching Statistics (USCOTS) were contacted via email and invited to complete the STI.
USCOTS is a national conference focusing on undergraduate and Advanced Placement (AP)
level statistics education and research. Sessions at USCOTS present ideas, methods, and research
results regarding teaching and learning statistics. A reminder email was sent to USCOTS
registrants two weeks after the initial contact. In both email messages, a direct hyperlink to the
online version of the instrument was provided. Of about 400 USCOTS registrants, 101
voluntarily completed the STI prior to the conference, a response rate of about 25%.
At the end of the STI survey, pilot respondents were invited to submit their name to participate in
an interview to collect additional validity evidence. Sixteen respondents agreed to participate in
the interviews. Nine face-to-face interviews took place at USCOTS and an additional seven
interviews were conducted on the telephone after USCOTS. All interviewees were college-level
instructors of statistics.
Six graduate students, working in teams of two, conducted the face-to-face interviews at
USCOTS. Interviewers followed a protocol that was designed by the PIs and revised with the
interviewers during a preparation training session. (The final version of this protocol is presented

Journal of Statistics Education, Volume 20, Number 1(2012)
7
in Appendix B.) The questionnaire included nine open-ended questions intended to obtain further
detail regarding the pedagogic and assessment practices and beliefs of the interviewee. In order
to see if the participants held similar perspectives regarding what constitutes a traditional or
reformed approach to teaching statistics, interviewees were asked to define a very traditional and
a very reformed approach across four areas of instruction: pedagogy, technology, content, and
assessment. They were also asked to rate their own overall teaching along their defined spectrum
of traditional to reform. The same protocol was used for the telephone interviews that took place
after USCOTS.
All 16 interviews were recorded and transcribed. In addition, materials were collected from each
interviewee (e.g., syllabus, assessments, etc.) to further help examine the validity of the STI in
terms of the relationship between their responses and the aspects of their actual teaching and
assessment practice. Two of the interviewers carried out the transcription of each interview.
Based on the interview responses, these two graduate students individually attributed a holistic
rating of the degree to which each interviewee seemed to have a traditional- or reform-
orientation toward four areas of instruction: pedagogy, technology, content, and assessment.
These holistic ratings were made on a scale of 1 to 10 for each of the four areas with lower
scores indicating a more “traditional” oriented approach to instruction and higher scores
indicating a more “reform” oriented approach to instruction. To anchor these ratings, the two
raters used the type of instructional approach presented in the GAISE college report as a
common reference for a reform-oriented approach. After individually rating the interviews, the
two students met together with the PIs to discuss the criteria used to make their ratings.
Following that meeting the two graduate students used a consensus building process to come to
agreement over the final ratings for each interviewee. An overall rating was then computed for
each interview as the average of the ratings for the four areas of instruction.
5. Results
5.1 Analysis of STI Pilot Data
Of the 101 statistics instructors who completed the STI, 49.5% were University instructors,
37.6% were 4-year college instructors, and 12.9% were 2-year college instructors. Seventy-three
percent of the participants were in Mathematics or Statistics departments, 13.9% were in Liberal
Arts, Education, Psychology, or Sociology related departments, and 13.1% were in Business,
Engineering, Biology, or science related departments.
Most of the respondents (71%) reported that they were familiar with the GAISE
recommendations. Of those who reported familiarity with these recommendations, 76%
classified their teaching as either “mostly” or “completely” aligned with these recommendations.
Arguably, because the participants chose to attend a conference on the teaching of statistics, it
would be expected that these instructors have teaching practices and beliefs that are more aligned
with the recommendations than the general population of statistics instructors in the United
States.
The response categories for each item in the Teaching Practice, Assessment Practice, Teaching
Beliefs and Assessment Beliefs sections were assigned consecutive integer values, beginning at 0,
Journal of Statistics Education, Volume 20, Number 1(2012)
8
such that higher values were indicative of an instructor who uses more GAISE endorsed teaching
or assessment methods, or has a higher degree of belief in the GAISE-aligned pedagogical or
assessment methods. The highest value coded varied across sections since the number of
response categories varied. For example, the responses to the items in the part on Teaching
Practice were coded from 0 to 4 and the responses in the part on Assessment Practice were
coded either 0 (disagree) or 1 (agree). The one frequency-based item in the Assessment Beliefs
section (#41) was coded using consecutive integer values from 0 to 3 with the first two response
categories, which corresponded to the lowest degree of belief in reform-based methods, each
coded as 0.
There were a few items in each section that were worded in the opposite direction. For example,
in the Teaching Beliefs section, some items were worded such that a response indicating a lower
degree of belief is more aligned with the learner-oriented pedagogical methods endorsed in the
GAISE college report. All such items were reverse coded prior to the analysis.
5.1.1 Teaching Practice
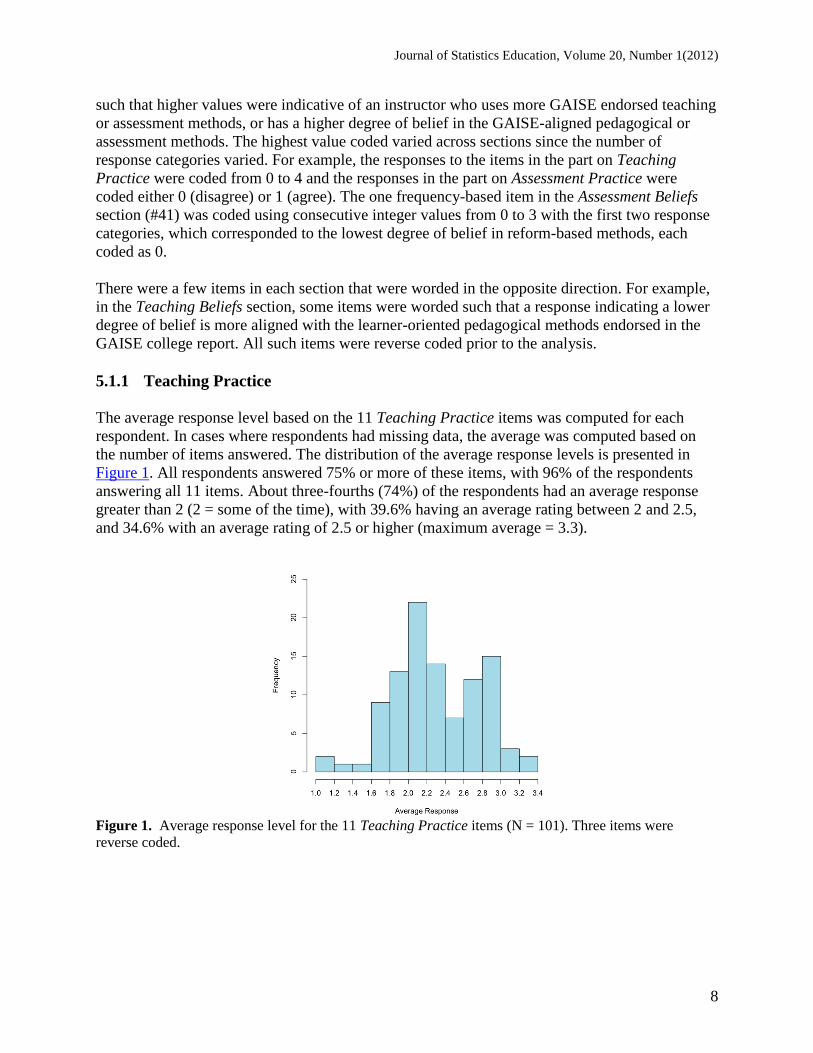
The average response level based on the 11 Teaching Practice items was computed for each
respondent. In cases where respondents had missing data, the average was computed based on
the number of items answered. The distribution of the average response levels is presented in
Figure 1. All respondents answered 75% or more of these items, with 96% of the respondents
answering all 11 items. About three-fourths (74%) of the respondents had an average response
greater than 2 (2 = some of the time), with 39.6% having an average rating between 2 and 2.5,
and 34.6% with an average rating of 2.5 or higher (maximum average = 3.3).
Figure 1. Average response level for the 11 Teaching Practice items (N = 101). Three items were
reverse coded.
Journal of Statistics Education, Volume 20, Number 1(2012)
9
5.1.2 Assessment Practice
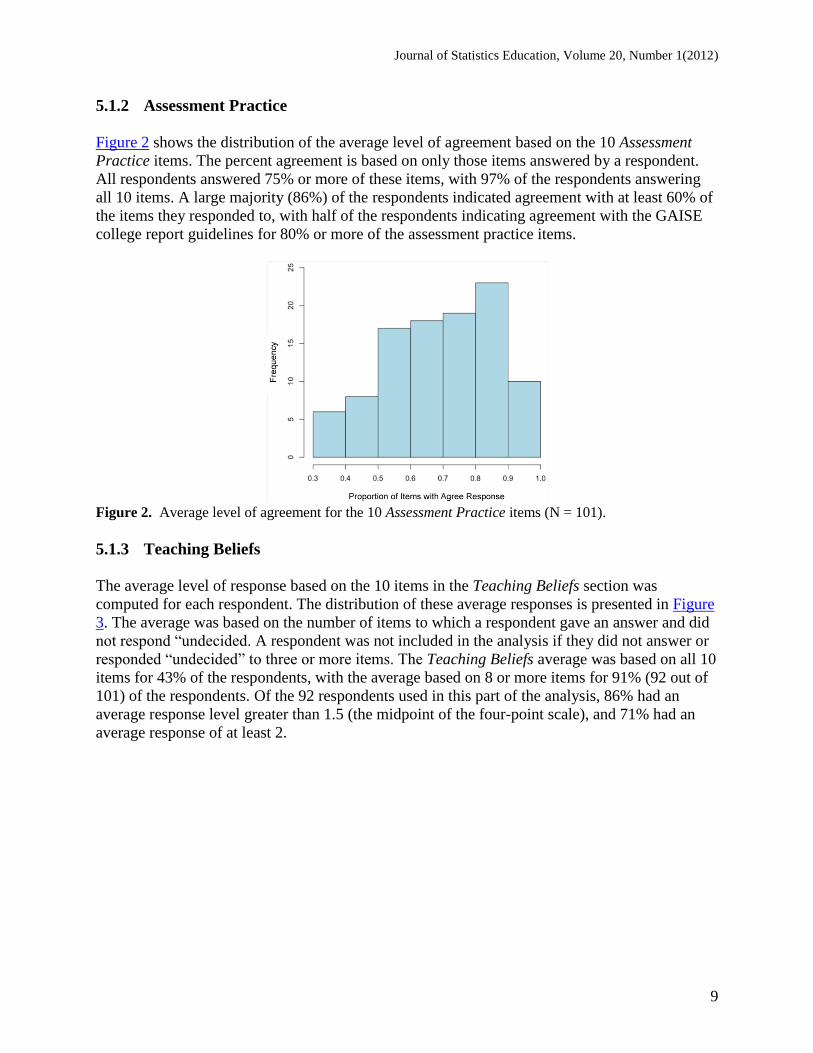
Figure 2 shows the distribution of the average level of agreement based on the 10 Assessment
Practice items. The percent agreement is based on only those items answered by a respondent.
All respondents answered 75% or more of these items, with 97% of the respondents answering
all 10 items. A large majority (86%) of the respondents indicated agreement with at least 60% of
the items they responded to, with half of the respondents indicating agreement with the GAISE
college report guidelines for 80% or more of the assessment practice items.
Figure 2. Average level of agreement for the 10 Assessment Practice items (N = 101).
5.1.3 Teaching Beliefs
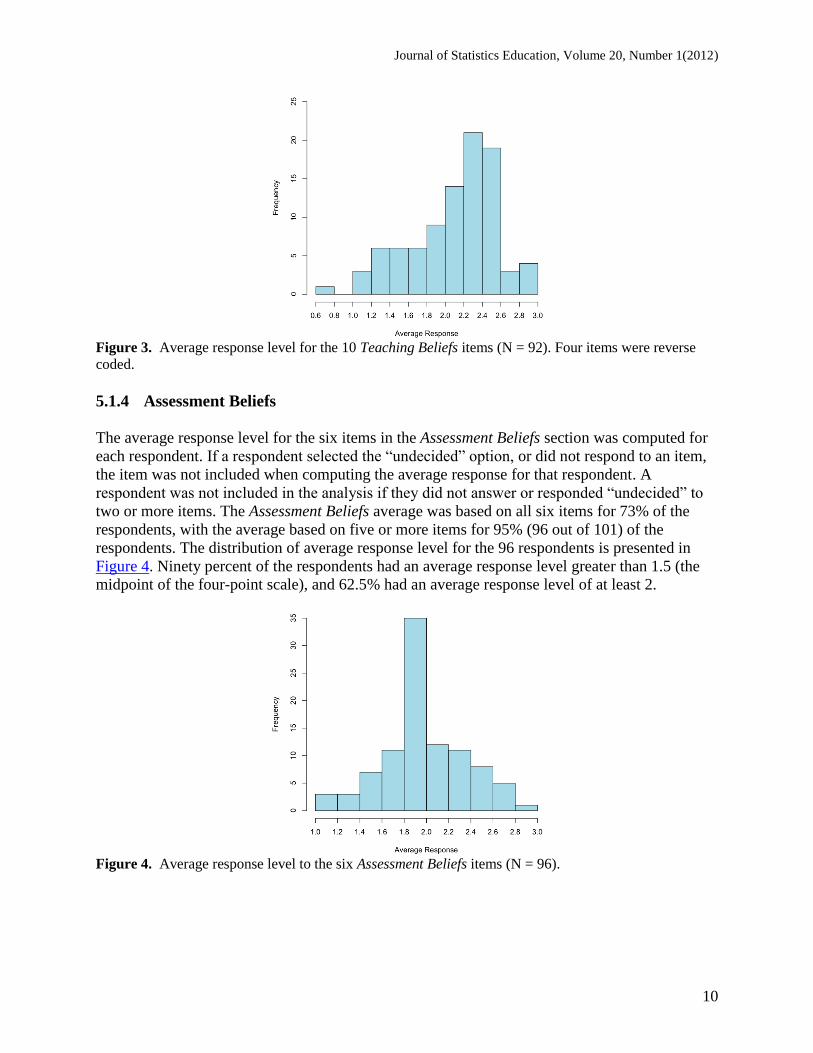
The average level of response based on the 10 items in the Teaching Beliefs section was
computed for each respondent. The distribution of these average responses is presented in Figure
3. The average was based on the number of items to which a respondent gave an answer and did
not respond “undecided. A respondent was not included in the analysis if they did not answer or
responded “undecided” to three or more items. The Teaching Beliefs average was based on all 10
items for 43% of the respondents, with the average based on 8 or more items for 91% (92 out of
101) of the respondents. Of the 92 respondents used in this part of the analysis, 86% had an
average response level greater than 1.5 (the midpoint of the four-point scale), and 71% had an
average response of at least 2.
Journal of Statistics Education, Volume 20, Number 1(2012)
10
Figure 3. Average response level for the 10 Teaching Beliefs items (N = 92). Four items were reverse
coded.
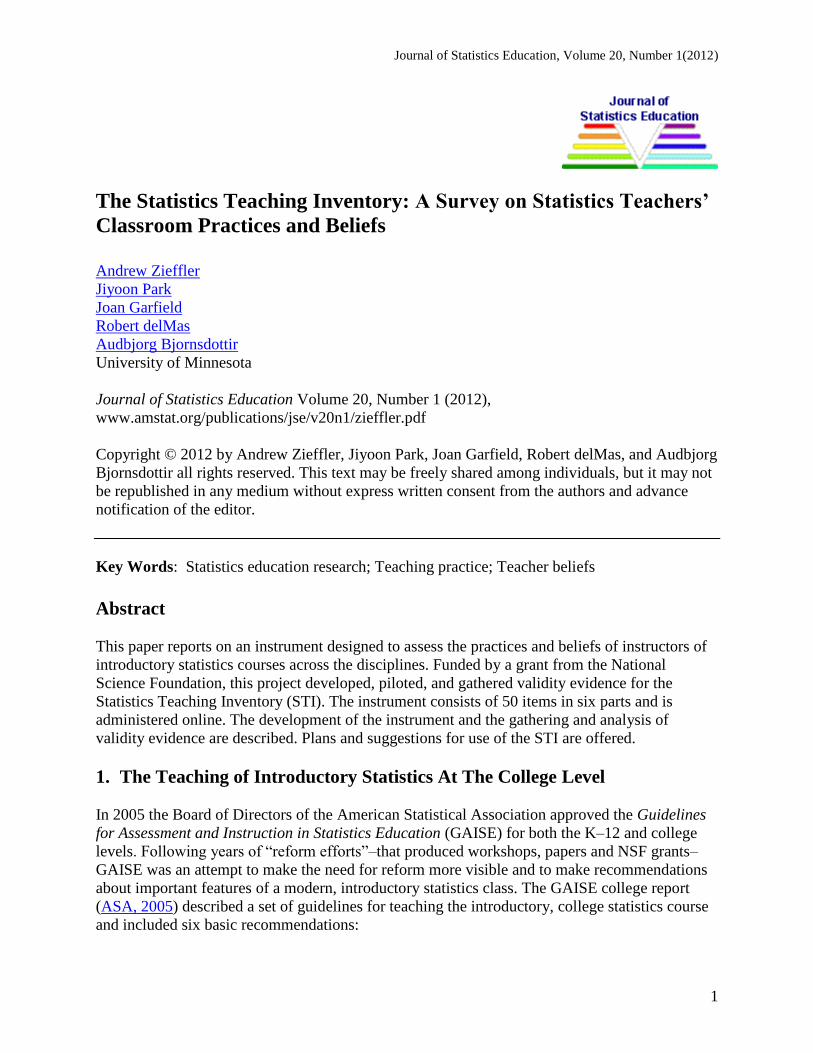
5.1.4 Assessment Beliefs
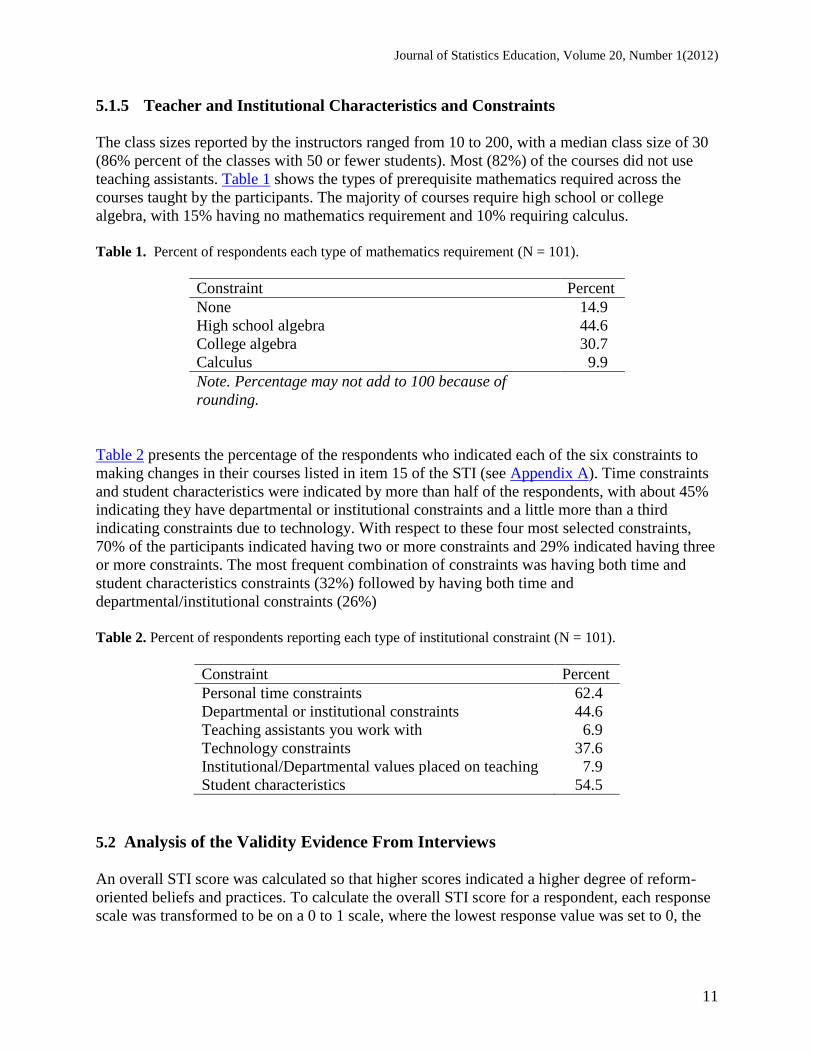
The average response level for the six items in the Assessment Beliefs section was computed for
each respondent. If a respondent selected the “undecided” option, or did not respond to an item,
the item was not included when computing the average response for that respondent. A
respondent was not included in the analysis if they did not answer or responded “undecided” to
two or more items. The Assessment Beliefs average was based on all six items for 73% of the
respondents, with the average based on five or more items for 95% (96 out of 101) of the
respondents. The distribution of average response level for the 96 respondents is presented in
Figure 4. Ninety percent of the respondents had an average response level greater than 1.5 (the
midpoint of the four-point scale), and 62.5% had an average response level of at least 2.
Figure 4. Average response level to the six Assessment Beliefs items (N = 96).
Journal of Statistics Education, Volume 20, Number 1(2012)
11
5.1.5 Teacher and Institutional Characteristics and Constraints
The class sizes reported by the instructors ranged from 10 to 200, with a median class size of 30
(86% percent of the classes with 50 or fewer students). Most (82%) of the courses did not use
teaching assistants. Table 1 shows the types of prerequisite mathematics required across the
courses taught by the participants. The majority of courses require high school or college
algebra, with 15% having no mathematics requirement and 10% requiring calculus.
Table 1. Percent of respondents each type of mathematics requirement (N = 101).
Constraint Percent
None 14.9
High school algebra 44.6
College algebra 30.7
Calculus 9.9
Note. Percentage may not add to 100 because of
rounding.
Table 2 presents the percentage of the respondents who indicated each of the six constraints to
making changes in their courses listed in item 15 of the STI (see Appendix A). Time constraints
and student characteristics were indicated by more than half of the respondents, with about 45%
indicating they have departmental or institutional constraints and a little more than a third
indicating constraints due to technology. With respect to these four most selected constraints,
70% of the participants indicated having two or more constraints and 29% indicated having three
or more constraints. The most frequent combination of constraints was having both time and
student characteristics constraints (32%) followed by having both time and
departmental/institutional constraints (26%)
Table 2. Percent of respondents reporting each type of institutional constraint (N = 101).
Constraint Percent
Personal time constraints 62.4
Departmental or institutional constraints 44.6
Teaching assistants you work with 6.9
Technology constraints 37.6
Institutional/Departmental values placed on teaching 7.9
Student characteristics 54.5
5.2 Analysis of the Validity Evidence From Interviews
An overall STI score was calculated so that higher scores indicated a higher degree of reform-
oriented beliefs and practices. To calculate the overall STI score for a respondent, each response
scale was transformed to be on a 0 to 1 scale, where the lowest response value was set to 0, the
Journal of Statistics Education, Volume 20, Number 1(2012)
12
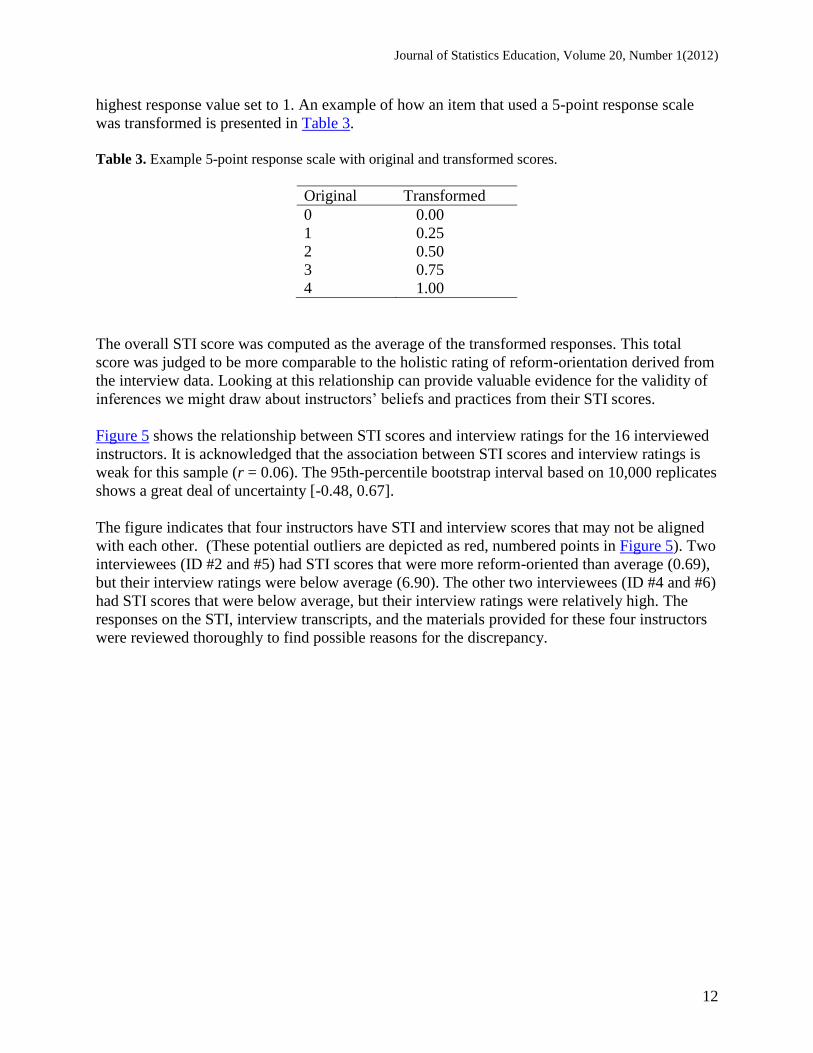
highest response value set to 1. An example of how an item that used a 5-point response scale
was transformed is presented in Table 3.
Table 3. Example 5-point response scale with original and transformed scores.
Original Transformed
0 0.00
1 0.25
2 0.50
3 0.75
4 1.00
The overall STI score was computed as the average of the transformed responses. This total
score was judged to be more comparable to the holistic rating of reform-orientation derived from
the interview data. Looking at this relationship can provide valuable evidence for the validity of
inferences we might draw about instructors‟ beliefs and practices from their STI scores.
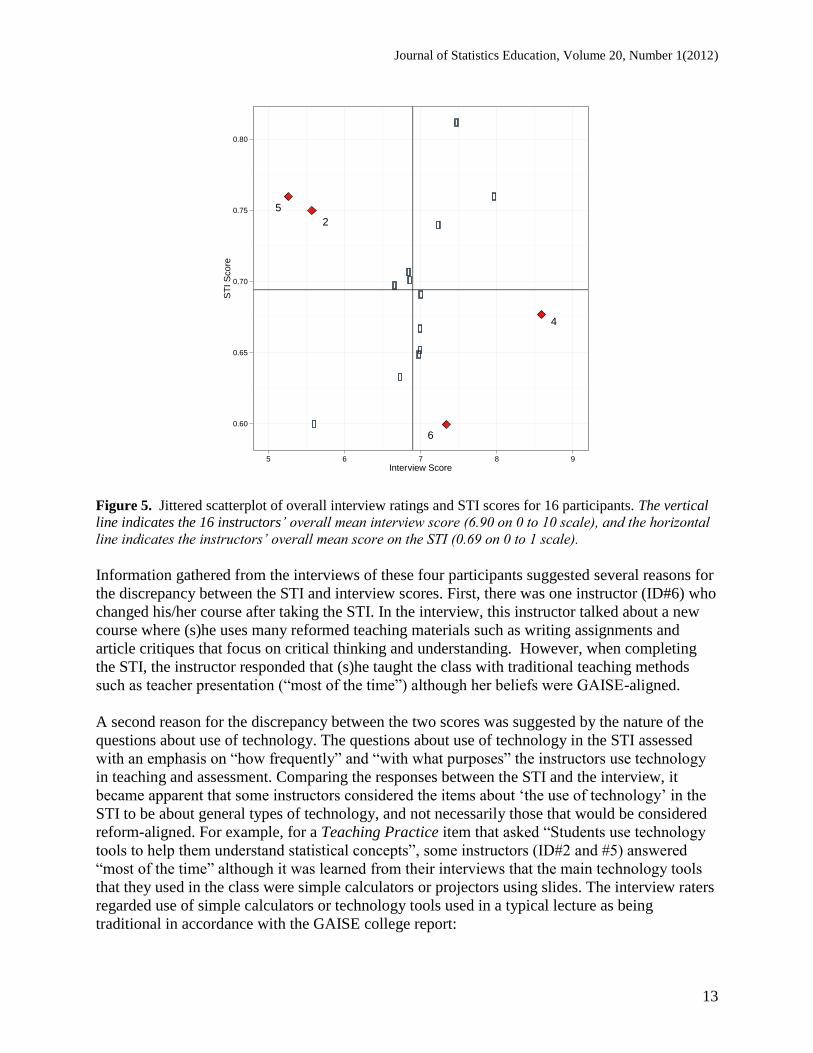
Figure 5 shows the relationship between STI scores and interview ratings for the 16 interviewed
instructors. It is acknowledged that the association between STI scores and interview ratings is
weak for this sample (r = 0.06). The 95th-percentile bootstrap interval based on 10,000 replicates
shows a great deal of uncertainty [-0.48, 0.67].
The figure indicates that four instructors have STI and interview scores that may not be aligned
with each other. (These potential outliers are depicted as red, numbered points in Figure 5). Two
interviewees (ID #2 and #5) had STI scores that were more reform-oriented than average (0.69),
but their interview ratings were below average (6.90). The other two interviewees (ID #4 and #6)
had STI scores that were below average, but their interview ratings were relatively high. The
responses on the STI, interview transcripts, and the materials provided for these four instructors
were reviewed thoroughly to find possible reasons for the discrepancy.
Journal of Statistics Education, Volume 20, Number 1(2012)
13
Figure 5. Jittered scatterplot of overall interview ratings and STI scores for 16 participants. The vertical
line indicates the 16 instructors’ overall mean interview score (6.90 on 0 to 10 scale), and the horizontal
line indicates the instructors’ overall mean score on the STI (0.69 on 0 to 1 scale).
Information gathered from the interviews of these four participants suggested several reasons for
the discrepancy between the STI and interview scores. First, there was one instructor (ID#6) who
changed his/her course after taking the STI. In the interview, this instructor talked about a new
course where (s)he uses many reformed teaching materials such as writing assignments and
article critiques that focus on critical thinking and understanding. However, when completing
the STI, the instructor responded that (s)he taught the class with traditional teaching methods
such as teacher presentation (“most of the time”) although her beliefs were GAISE-aligned.
A second reason for the discrepancy between the two scores was suggested by the nature of the
questions about use of technology. The questions about use of technology in the STI assessed
with an emphasis on “how frequently” and “with what purposes” the instructors use technology
in teaching and assessment. Comparing the responses between the STI and the interview, it
became apparent that some instructors considered the items about „the use of technology‟ in the
STI to be about general types of technology, and not necessarily those that would be considered
reform-aligned. For example, for a Teaching Practice item that asked “Students use technology
tools to help them understand statistical concepts”, some instructors (ID#2 and #5) answered
“most of the time” although it was learned from their interviews that the main technology tools
that they used in the class were simple calculators or projectors using slides. The interview raters
regarded use of simple calculators or technology tools used in a typical lecture as being
traditional in accordance with the GAISE college report:
0.60
0.65
0.70
0.75
0.80
5
2
6
4
5 6 7 8 9
Interview Score
ST
I S
core

Journal of Statistics Education, Volume 20, Number 1(2012)
14
“Technology should be used to analyze data, allowing students to focus on interpretation
of results and testing of conditions, rather than on computational mechanics. Technology
tools should also be used to help students visualize concepts and develop an
understanding of abstract ideas by simulations (ASA, 2005, p. 19).”
There was also an interviewee who presented a different response pattern on the STI and the
interview specifically regarding the Assessment Practice questions. On the STI, the interviewee‟s
responses indicated a reformed approach on the Assessment Practice scale (mean=0.9), meaning
that (s)he tends to use reformed methods in assessing students learning outcomes “most of the
time” or to be “strongly against” the use of traditional methods. However, in the interview, the
interviewee answered that (s)he uses traditional types of assessment such as typical traditional
types of tests including multiple choice items. One possible reason for the high score on this
scale might be that the response choices on the Assessment Practice scale are dichotomous
presenting only “Agree” (1) and “Disagree” (0). In the initial survey design, we intended that the
interviewees‟ responses for the Assessment Practice items would indicate whether or not they
assess student‟s learning outcomes in a way that is consistent with the GAISE college report
recommendations. However, we realized that dichotomous items in this scale led the participants
of the STI to respond “Agree” even though their practice is only moderately GAISE-aligned.
After investigating these four interviewees‟ different response patterns on the STI and in the
interview and removing them, we found a positive relationship between the STI and interview
scores from the other remaining twelve interviewees, r = 0.77, [0.50, 0.92]. While the small
sample of 12 interviewees may not be representative of the larger USCOTS sample, it does
indicate preliminary validity evidence for the use of STI scores by accounting for instructors who
did not present their perspectives accurately or consistently.
5.3 Relationship between Teaching Practice and Beliefs and between Assessment
Practice and Beliefs
Using the scale scores, participants‟ beliefs and teaching practices were classified as either
having less or more reform-orientation. The midpoint on each scale was used as the cutoff point,
with scores at or below the midpoint classified as having less reform-orientation and those above
the midpoint classified as having more reform-orientation. For the assessment practice scale,
which is based on dichotomous disagree/agree response items, the cutoff was set at 60%
agreement, with those below the cutoff classified as having less reform-orientation and those at
or above the cutoff classified as having more reform-orientation. Table 4 shows the cross-
classification of teaching practice and beliefs for the 92 participants who responded to at least
eight of the teaching beliefs items. Based on this classification, there was agreement between the
self-reported teaching practice and beliefs for 79% of the respondents (κ = 0.37, [0.15, 0.59]).
Journal of Statistics Education, Volume 20, Number 1(2012)
15
Table 4. Cross-classification of participants‟ degree of reform-orientation (less/more) in teaching practice
and beliefs (N = 92).
Teaching Practice
Teaching Beliefs Less More
Less 9 4
More 15 64
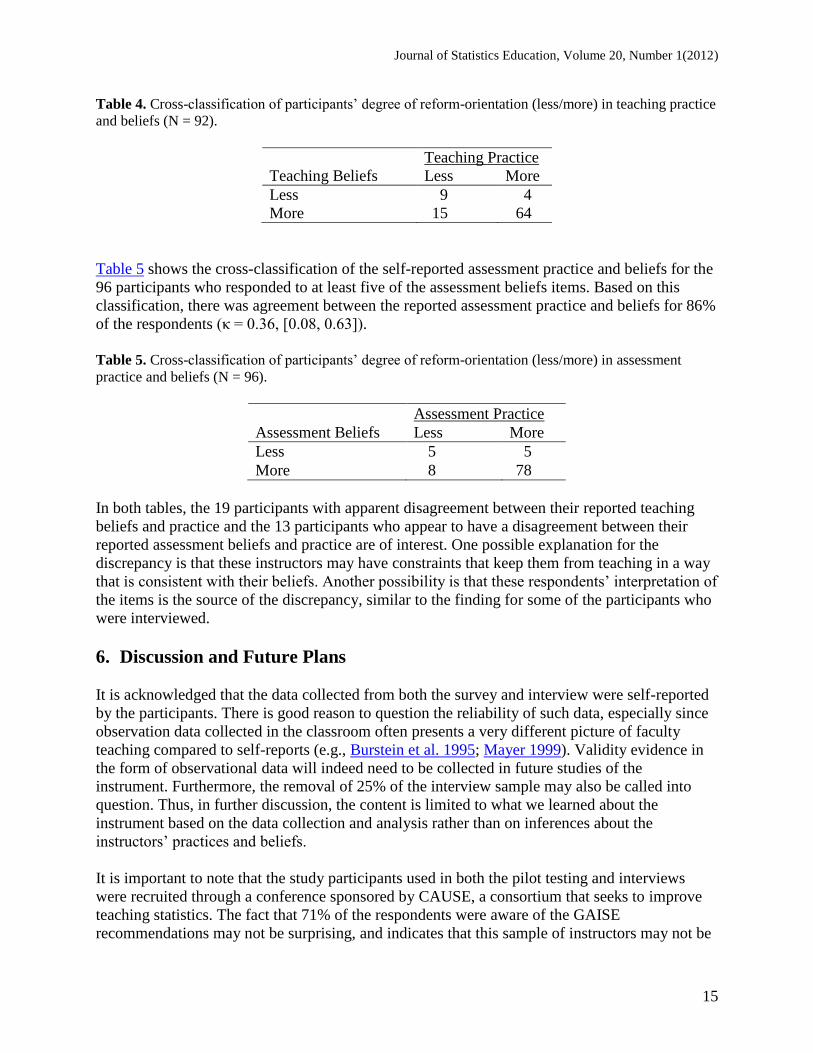
Table 5 shows the cross-classification of the self-reported assessment practice and beliefs for the
96 participants who responded to at least five of the assessment beliefs items. Based on this
classification, there was agreement between the reported assessment practice and beliefs for 86%
of the respondents (κ = 0.36, [0.08, 0.63]).
Table 5. Cross-classification of participants‟ degree of reform-orientation (less/more) in assessment
practice and beliefs (N = 96).
Assessment Practice
Assessment Beliefs Less More
Less 5 5
More 8 78
In both tables, the 19 participants with apparent disagreement between their reported teaching
beliefs and practice and the 13 participants who appear to have a disagreement between their
reported assessment beliefs and practice are of interest. One possible explanation for the
discrepancy is that these instructors may have constraints that keep them from teaching in a way
that is consistent with their beliefs. Another possibility is that these respondents‟ interpretation of
the items is the source of the discrepancy, similar to the finding for some of the participants who
were interviewed.
6. Discussion and Future Plans
It is acknowledged that the data collected from both the survey and interview were self-reported
by the participants. There is good reason to question the reliability of such data, especially since
observation data collected in the classroom often presents a very different picture of faculty
teaching compared to self-reports (e.g., Burstein et al. 1995; Mayer 1999). Validity evidence in
the form of observational data will indeed need to be collected in future studies of the
instrument. Furthermore, the removal of 25% of the interview sample may also be called into
question. Thus, in further discussion, the content is limited to what we learned about the
instrument based on the data collection and analysis rather than on inferences about the
instructors‟ practices and beliefs.
It is important to note that the study participants used in both the pilot testing and interviews
were recruited through a conference sponsored by CAUSE, a consortium that seeks to improve
teaching statistics. The fact that 71% of the respondents were aware of the GAISE
recommendations may not be surprising, and indicates that this sample of instructors may not be
Journal of Statistics Education, Volume 20, Number 1(2012)
16
representative of all college-level statistics teachers. Based on our small, biased sample it
appears that a large number of instructors (70%) reported both teaching practices and beliefs that
are aligned with GAISE and a larger number (81.25%) reported both assessment practices and
beliefs that are aligned with GAISE. Such a homogenous sample likely inhibits the variability
one would expect to see in the responses had the sample been more representative of the general
population of statistics instructors.
That being the case, the analysis of data still pointed out areas that need to be changed in the next
version for the STI. For example, it was found that the items related to technology did not
provide the needed degree of precision in determining what and how technology was used to
accurately classify participants (low discrimination). Subsequently, participants might have
appeared more reform-oriented due to their responses on these items, so these questions are
being revised to collect more accurate information.
The analysis also suggested changes in both the Assessment Practices and Assessment Beliefs
sections. Across both sections it seemed that there was on over-emphasis of assessment items on
the STI compared to the Teaching Practices and Teaching Beliefs sections. In future iterations of
the STI, we hope to alleviate this discrepancy. It may also help to have more parallel items
between the Teaching Practices and Teaching Beliefs part to facilitate an analysis of consistency
between teaching practices and beliefs (e.g. Teaching Practice: Teacher presentations (e.g.,
lectures, demonstrations, etc.) are used to help students learn statistics.; Teaching Beliefs:
Teacher presentations (e.g., lectures, demonstrations, etc.) should be used to help students learn
statistics.).
In addition, the dichotomous response scales used in the Assessment Practice section of the STI
did not provide enough information to reliably place instructors along a continuum of alignment
with the GAISE recommendations. The use of Likert-response items (similar to those used for
the Teaching and Assessment Beliefs sections) in this section will need to be explored in future
versions of the STI. Consistency in the response scales across all items on the STI will also allow
more direct comparison of the subscales.
The results suggest that many of the instructors surveyed reported feeling constrained in their
ability to carry out in practice what they believe. These constraints come in many forms, namely
time, student characteristics and institutional factors. Many of the instructors felt constrained by
more than one of these. Interestingly, in the techno-centric world we live in, a fair number of
these instructors indicated that technology was also constraining their instructional and
assessment practices.
Evidence from the qualitative analysis of the data collected from the phone interviews also
suggests future changes for the STI. One of the surprising findings was that the interviewees did
not use the same definitions or interpretations, and in fact, had very different ideas about the end
points of the Reform–Traditional scale when asked to rate themselves on the four areas of
content, technology, teaching and assessment. It was also clear from the interviews that some of
the instructors who rated themselves as more reform-oriented were viewed by the researchers as
more traditionally-oriented. Revisions of the STI will need to provide examples or models of
Journal of Statistics Education, Volume 20, Number 1(2012)
17
reform, as well as, traditional teaching so that the scales are interpreted in a consistent way
across respondents.
The assessment of teachers‟ practices and beliefs remains an important but challenging area of
study. The STI holds promise as an instrument to assess teachers‟ practices and beliefs regarding
statistics. As a result of the study summarized in this paper, revisions are again being made and a
large-scale implementation of the survey will take place in the 2012-2013 academic year, funded
by a new grant from the NSF (e-ATLAS; DUE-1043141). One feature of the next version of the
STI is that it will have the capability to be modularized, offering appropriate questions to
instructors of online and hybrid courses, large and small classes.
As part of the validation of the new STI, a course observation form is being developed that can
be used to identify teacher behaviors during a session of an introductory statistics course. This
would provide information for judging the level of agreement between a teacher‟s self-reported
teaching practice and actual practice in the classroom. A similar type of checklist needs to be
developed for evaluating examples of assessments used by instructors to assess the agreement
between self-reported and actual assessment practices. In addition, we hope that future analyses
of the revised STI will show less disconnect between teachers‟ practices and beliefs, so as better
to indicate the true relationship between these constructs.
The STI when revised and used in a national survey can play an important role in studies of the
relationship between teaching practice and student learning outcomes. National baseline data as
well as longitudinal data will allow the statistics education community to study the extent and
change in efforts to reform the teaching on introductory statistics.
Journal of Statistics Education, Volume 20, Number 1(2012)
18
APPENDIX A
STATISTICS TEACHING INVENTORY
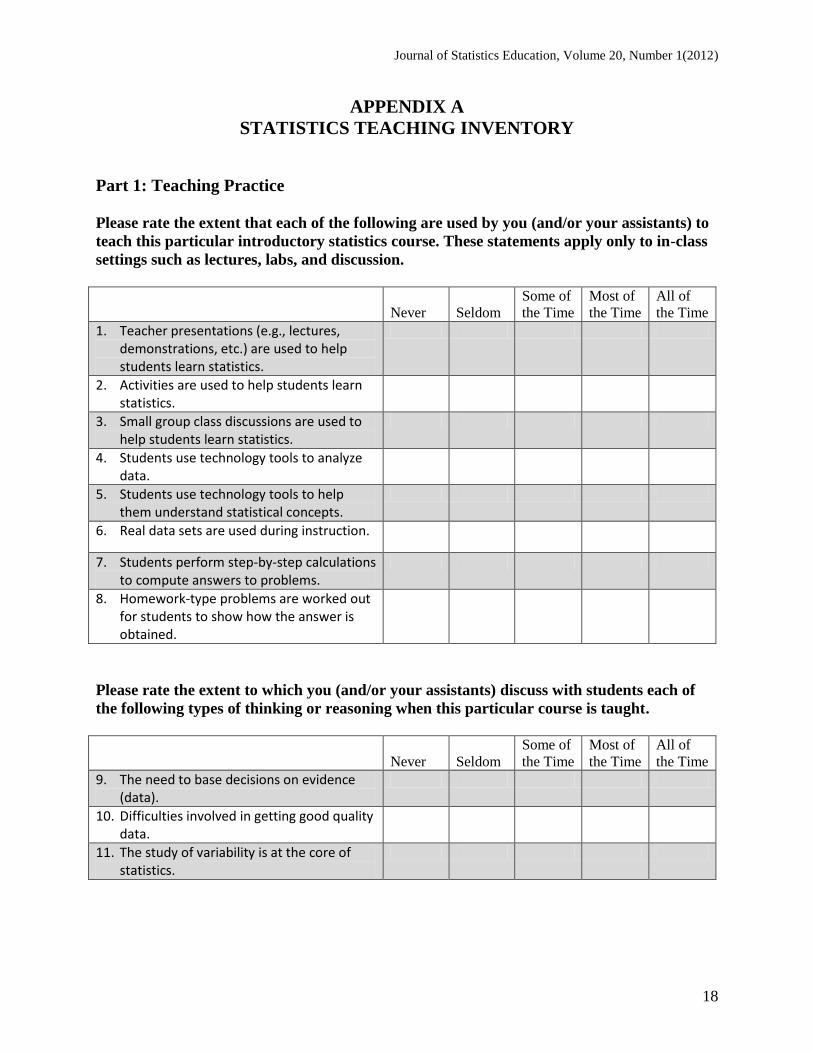
Part 1: Teaching Practice
Please rate the extent that each of the following are used by you (and/or your assistants) to
teach this particular introductory statistics course. These statements apply only to in-class
settings such as lectures, labs, and discussion.
Never Seldom
Some of
the Time
Most of
the Time
All of
the Time
1. Teacher presentations (e.g., lectures, demonstrations, etc.) are used to help students learn statistics.
2. Activities are used to help students learn statistics.
3. Small group class discussions are used to help students learn statistics.
4. Students use technology tools to analyze data.
5. Students use technology tools to help them understand statistical concepts.
6. Real data sets are used during instruction.
7. Students perform step-by-step calculations to compute answers to problems.
8. Homework-type problems are worked out for students to show how the answer is obtained.
Please rate the extent to which you (and/or your assistants) discuss with students each of
the following types of thinking or reasoning when this particular course is taught.
Never Seldom
Some of
the Time
Most of
the Time
All of
the Time
9. The need to base decisions on evidence (data).
10. Difficulties involved in getting good quality data.
11. The study of variability is at the core of statistics.

Journal of Statistics Education, Volume 20, Number 1(2012)
19
Part 2: Course Characteristics 12. How many students are in the classroom when you teach this particular course?
13. Please indicate the mathematical prerequisite for this course Calculus
College Algebra
High School Algebra
None
Other Please Specify: _______________________________________________
14. Do you have teaching assistants who lead lab/recitation/discussion sections of this course? Yes
No
15. Identify any constraints that keep you from making changes that you would like to implement to improve your course (Please check all that apply.) Your personal time constraints
Departmental or Institutional constraints (e.g., choice of textbook, class size, mandated curriculum,
etc.)
The teaching assistants you work with
Technology constraints (e.g., lack of computer lab, cost of software)
Institutional/Departmental values placed on teaching
Characteristics of students (ability, interest, etc.)
Other Please Specify: _______________________________________________

Journal of Statistics Education, Volume 20, Number 1(2012)
20
Part 3: Assessment Practice
Please consider all assessments that are used in this particular course to evaluate student learning.
Indicate your agreement or disagreement with each of the following statements as they reflect your
assessment of student learning for this particular course.
Disagree Agree
16. My assessments include a variety of assessment types (e.g., homework, quizzes, projects, minute papers, etc.).
17. One use of my assessments is to reveal whether students are using statistical language properly.
18. My assessments evaluate students’ abilities to use formulas to produce numerical summaries of a data set.
19. My assessments evaluate students’ ability to use technology (e.g., statistical software) to produce numerical summaries of a data set.
20. My assessments evaluate students’ ability to interpret results of data analyses.
21. My assessments evaluate students’ ability to critically examine statistics in the media.
22. My assessments evaluate students’ ability to successfully complete a statistical investigation (e.g., a course project).
23. My assessment items typically include problems that involve real data.
24. My assessments include a component in which students are required to collaborate (e.g., group project, group quiz).
25. I evaluate my assessments regularly to determine whether they are aligned with student learning goals.

Journal of Statistics Education, Volume 20, Number 1(2012)
21
Part 4: Teaching Beliefs Please rate the extent to which you agree with each of the following statements as they reflect your
beliefs (but not necessarily your actual teaching) regarding the teaching and learning of
introductory statistics
Strongly
Disagree Disagree Agree
Strongly
Agree Undecided
26. Rules of probability should be included in
an introductory statistics course.
27. The topic of theoretical probability
distributions (e.g., the binomial
distribution) should be included in an
introductory statistics course.
28. Students should learn how to read
statistical tables of theoretical distributions
(e.g., t-table, F-table).
29. Technology tools should be used to
illustrate most abstract statistical concepts.
30. Students should learn methods for
collecting data (e.g., taking samples, taking
surveys).
31. Students should learn methods for
producing data (e.g., designing an
experiment).
32. Students learn statistics more effectively
by learning fewer topics in greater depth
than learning more topics in less depth.
33. Students learn statistics more effectively
from a good lecture than from a good
activity.
34. Indicate the type of data that you believe helps students learn statistics best.
All constructed data
Mostly constructed data
Equal amounts of constructed data and real data
Mostly real data
All real data
35. Indicate the method of computing numerical solutions to problems that you believe helps students
learn statistics best.
All solutions computed by hand
Most solutions computed by hand
Equal amounts of computing solutions by hand and using technology tools
Most solutions computed using technology tools
All solutions computed using technology tools
Journal of Statistics Education, Volume 20, Number 1(2012)
22
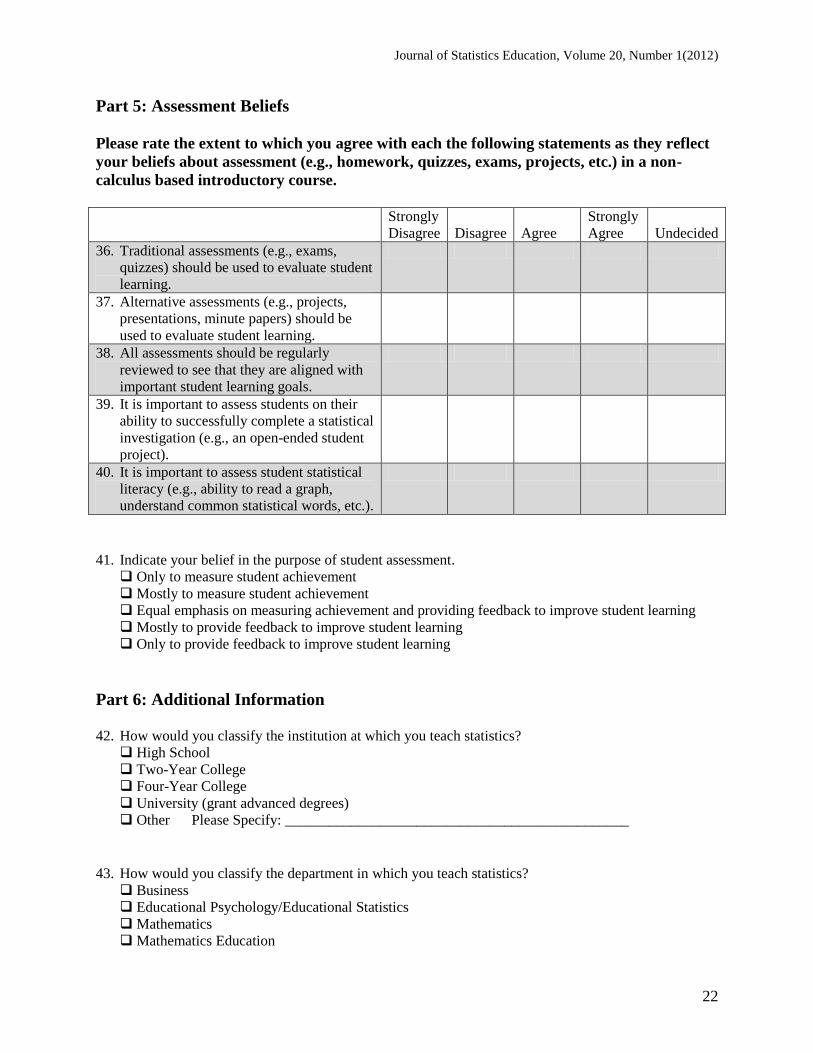
Part 5: Assessment Beliefs
Please rate the extent to which you agree with each the following statements as they reflect
your beliefs about assessment (e.g., homework, quizzes, exams, projects, etc.) in a non-
calculus based introductory course.
Strongly
Disagree Disagree Agree
Strongly
Agree Undecided
36. Traditional assessments (e.g., exams,
quizzes) should be used to evaluate student
learning.
37. Alternative assessments (e.g., projects,
presentations, minute papers) should be
used to evaluate student learning.
38. All assessments should be regularly
reviewed to see that they are aligned with
important student learning goals.
39. It is important to assess students on their
ability to successfully complete a statistical
investigation (e.g., an open-ended student
project).
40. It is important to assess student statistical
literacy (e.g., ability to read a graph,
understand common statistical words, etc.).
41. Indicate your belief in the purpose of student assessment.
Only to measure student achievement
Mostly to measure student achievement
Equal emphasis on measuring achievement and providing feedback to improve student learning
Mostly to provide feedback to improve student learning
Only to provide feedback to improve student learning
Part 6: Additional Information 42. How would you classify the institution at which you teach statistics?
High School
Two-Year College
Four-Year College
University (grant advanced degrees)
Other Please Specify: _______________________________________________
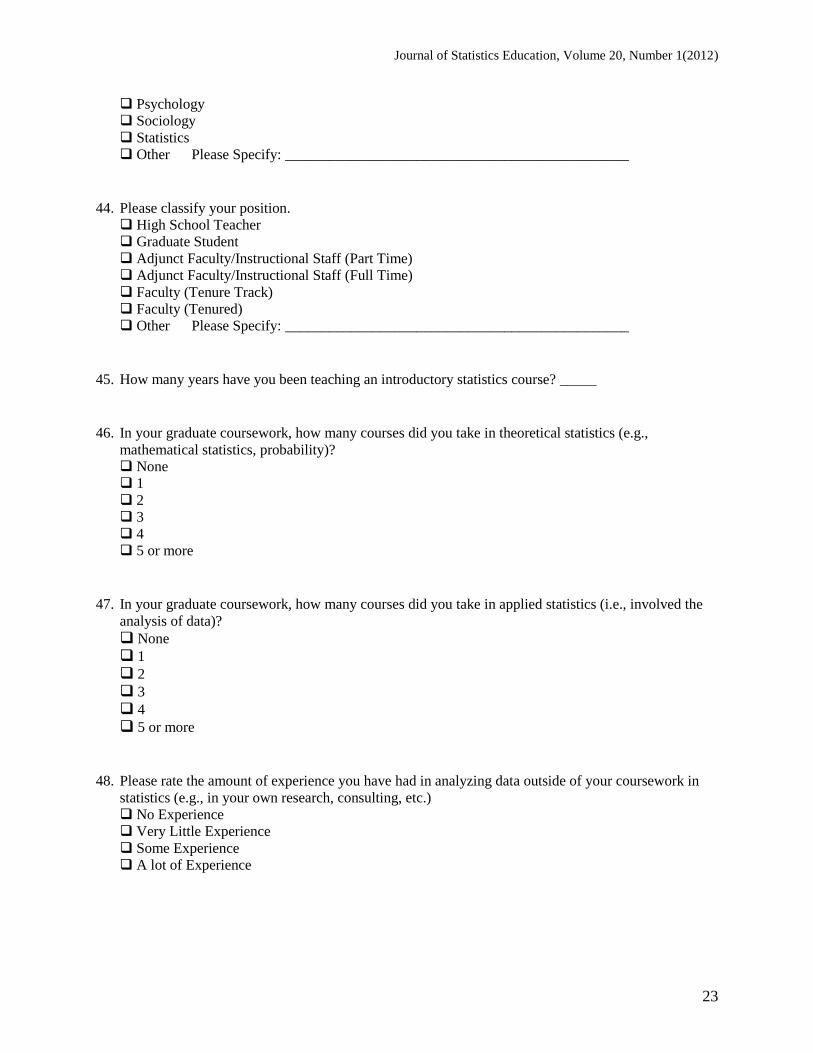
43. How would you classify the department in which you teach statistics?
Business
Educational Psychology/Educational Statistics
Mathematics
Mathematics Education
Journal of Statistics Education, Volume 20, Number 1(2012)
23
Psychology
Sociology
Statistics
Other Please Specify: _______________________________________________
44. Please classify your position.
High School Teacher
Graduate Student
Adjunct Faculty/Instructional Staff (Part Time)
Adjunct Faculty/Instructional Staff (Full Time)
Faculty (Tenure Track)
Faculty (Tenured)
Other Please Specify: _______________________________________________
45. How many years have you been teaching an introductory statistics course? _____
46. In your graduate coursework, how many courses did you take in theoretical statistics (e.g.,
mathematical statistics, probability)?
None
1
2
3
4
5 or more
47. In your graduate coursework, how many courses did you take in applied statistics (i.e., involved the
analysis of data)?
None
1
2
3
4
5 or more
48. Please rate the amount of experience you have had in analyzing data outside of your coursework in
statistics (e.g., in your own research, consulting, etc.)
No Experience
Very Little Experience
Some Experience
A lot of Experience
Journal of Statistics Education, Volume 20, Number 1(2012)
24
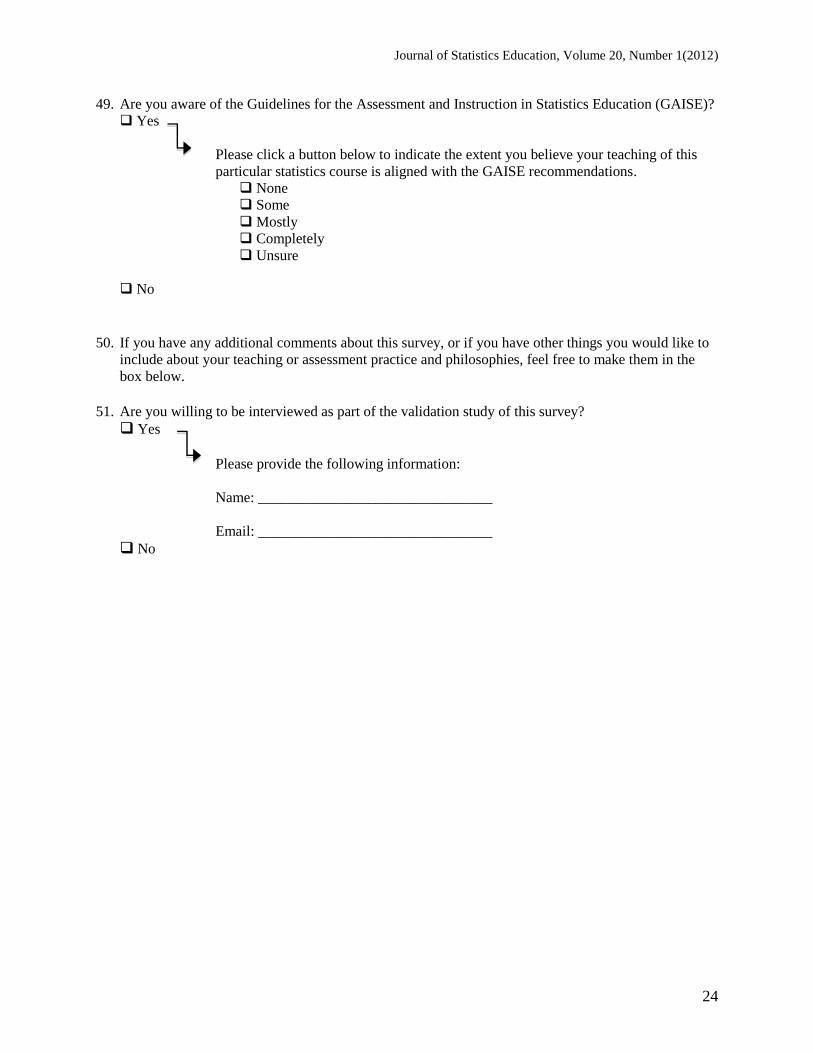
49. Are you aware of the Guidelines for the Assessment and Instruction in Statistics Education (GAISE)?
Yes
Please click a button below to indicate the extent you believe your teaching of this
particular statistics course is aligned with the GAISE recommendations.
None
Some
Mostly
Completely
Unsure
No
50. If you have any additional comments about this survey, or if you have other things you would like to
include about your teaching or assessment practice and philosophies, feel free to make them in the
box below.
51. Are you willing to be interviewed as part of the validation study of this survey?
Yes
Please provide the following information:
Name: ________________________________
Email: ________________________________
No
Journal of Statistics Education, Volume 20, Number 1(2012)
25
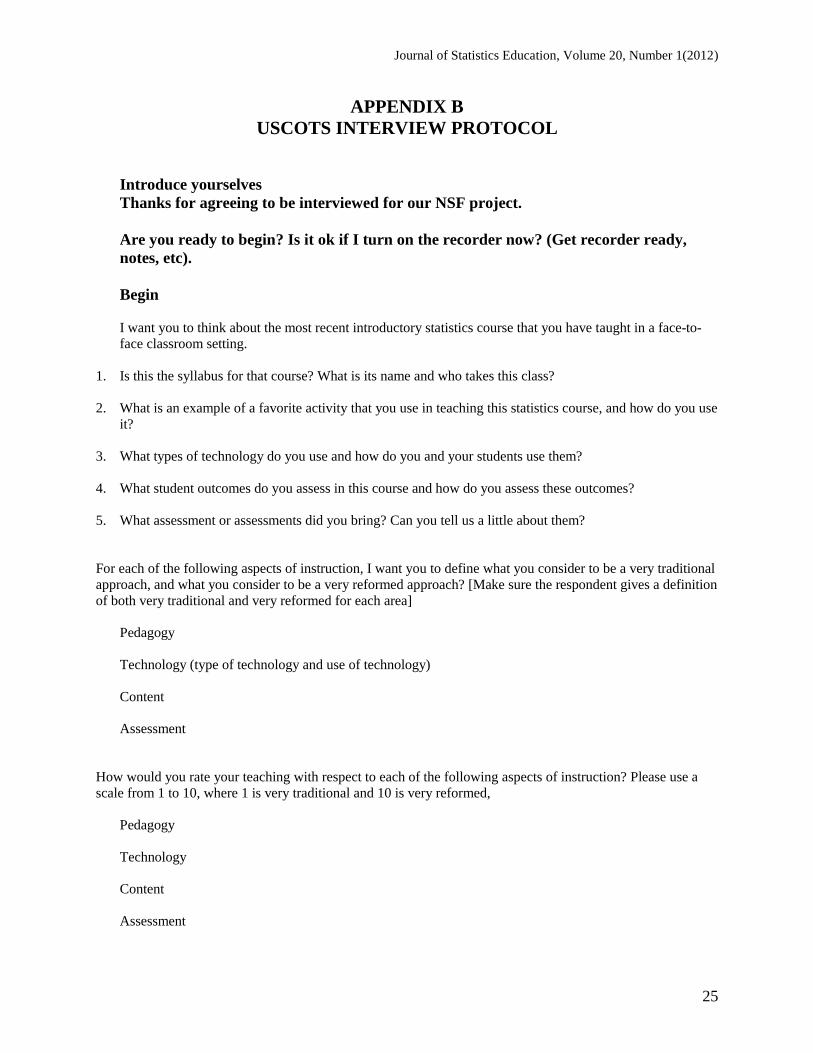
APPENDIX B
USCOTS INTERVIEW PROTOCOL
Introduce yourselves
Thanks for agreeing to be interviewed for our NSF project.
Are you ready to begin? Is it ok if I turn on the recorder now? (Get recorder ready,
notes, etc).
Begin
I want you to think about the most recent introductory statistics course that you have taught in a face-to-
face classroom setting.
1. Is this the syllabus for that course? What is its name and who takes this class?
2. What is an example of a favorite activity that you use in teaching this statistics course, and how do you use
it?
3. What types of technology do you use and how do you and your students use them?
4. What student outcomes do you assess in this course and how do you assess these outcomes?
5. What assessment or assessments did you bring? Can you tell us a little about them?
For each of the following aspects of instruction, I want you to define what you consider to be a very traditional
approach, and what you consider to be a very reformed approach? [Make sure the respondent gives a definition
of both very traditional and very reformed for each area]
Pedagogy
Technology (type of technology and use of technology)
Content
Assessment
How would you rate your teaching with respect to each of the following aspects of instruction? Please use a
scale from 1 to 10, where 1 is very traditional and 10 is very reformed,
Pedagogy
Technology
Content
Assessment
Journal of Statistics Education, Volume 20, Number 1(2012)
26
6. In what ways would you like to change the way you teach your course?
7. Is there content you have given up that used to be in your class? (Explain.)
8. With respect to your syllabus for this course, is there anything missing or that you plan to change for next
year?
9. Is there anything you would like to comment on regarding the STI survey or these questions?
Thanks for participating in the interview.
Acknowledgements
The authors gratefully acknowledge the support from the National Science Foundation (DUE-
0808862). The authors also wish to thank Beth Chance for numerous contributions and feedback
on the instrument. Lastly, the editing work and comments of Anelise Sabbag are gratefully
acknowledged.
References
American Educational Research Association, American Psychological Association, and the
National Council on Measurement in Education. (2002). Standards for educational and
psychological testing. Washington, DC: AERA.
American Statistical Association. (2005). GAISE college report.
http://www.amstat.org/education/gaise/GAISECollege.htm.
Bailey, K. M. (1992). The processes of innovation in language teacher development: What, why
and how teachers change. In J. Flowerdew, M. Brock & S. Hsia (eds.), Perspectives on Second
Language Teacher Education. Hong Kong: City Polytechnic of Hong Kong, 253-282.
Boulton-Lewis, G. M., Smith, H., McCrindle, R., Burnett, C., & Campbell, K. J. (2001).
Secondary teachers‟ beliefs about teaching and learning. Learning and Instruction, 11, 35–51.
Brown, C. A. (1985). A study of the socialization to teaching of a beginning mathematics
teacher. Unpublished doctoral dissertation, University of Georgia, Athens.
Burstein, L., McDonnell, L. M., VanWinkle, J., Ormseth, T. H., Mirocha, J. V., Guiton, G.
(1995). Validating national curriculum indicators. Santa Monica, CA: RAND Corporation.
Calderhead, J. (1996). Teachers: beliefs and knowledge. In D. C. Berliner & R. C. Calfee (eds.),
Handbook of educational psychology (pp.709–725). New York: Macmillan.
Journal of Statistics Education, Volume 20, Number 1(2012)
27
Churchill, G. A., Jr. (1979). A Paradigm for Developing Better Measures of Marketing
Constructs. Journal of Marketing Research, 16 (February), 64–73.
Cooney, T. J. (1985). A beginning teacher's view of problem solving. Journal of Research in
Mathematics Education, 16, 324–336.
Couch, A. & Kenniston, K. (1960). “Yeasayers and Naysayers: Agreeing Response Set as a
Personality Variable,” Journal of Abnormal and Social Psychology, 60 (2), 151–174.
Dillman, D. A. (2007). Mail and internet surveys: The tailored design method (2nd
edition). New
York: Wiley.
Garfield, J., Hogg, B., Schau, C., & Whittinghill, D. (2002). First courses in statistical science:
The status of educational reform efforts. Journal of Statistics Education, 10(2).
http://www.amstat.org/publications/jse/v10n2/garfield.html
Golombek, P. R. (1998). A study of language teachers‟ personal practical knowledge. TESOL
Quarterly, 32(3), 447-464.
Hampton, S. (1994). Teacher change: Overthrowing the myth of one teacher, one classroom. In
T. Shanahan (ed.), Teachers thinking, teachers knowing. Urbana, IL: National Conference on
Research in English, & National Council of Teachers of English, 122-140.
Hassad, R. A. (2011). Constructivist and behaviorist approaches: Development and initial
evaluation of a teaching practice scale for introductory statistics at the college level. Numeracy:
Advancing Education in Quantitative Literacy, 4(2).
http://services.bepress.com/numeracy/vol4/iss2/art7/
Kane, R. (2002). Telling half the story: A critical review of research on the teaching beliefs and
practices of university academics. Review of Educational Research, 72 (2), 177–228.
Kember, D. (1997). A reconceptualisation of the research into university academics‟ beliefs
about teaching. Learning and Instruction, 7, 255–275.
Mayer, D. P. (1999). Measuring instructional practice: Can policymakers trust survey data?
Educational Evaluation and Policy Analysis, 21(1), 29-45.
Meijer, P. C., Verloop, N., & Beijaard, D. (1999). Exploring language teachers‟ practical
knowledge about teaching reading comprehension. Teaching and Teacher Education, 15, 59–84.
Meirink, J. A., Meijer, P. C., Verloop, N., & Bergen, T. C. (2009). Understanding teacher
learning in secondary education: The relations of teacher activities to changed beliefs about
teaching and learning. Teaching and Teacher Education, 25, 89–100.
Nunnally, J. C. (1978). Psychometric Theory, 2nd ed., New York: McGraw-Hill.
Journal of Statistics Education, Volume 20, Number 1(2012)
28
Pajares, M. (1992). Teachers‟ beliefs and educational research: Cleaning up a messy construct.
Review of Educational Research, 62(1), 307–332.
Pratt, D. D. (2002). Good teaching: one size fits all? New Directions for Adult and Continuing
Education, 2002(93), 5-16
Reed, S. (2002). The beliefs and practices of itinerant teachers of deaf and hard of hearing
children about literacy development (Doctoral dissertation, University of Arizona). Dissertation
Abstracts International, 62, 3742–3743A.
Richardson, V. (1996). The role of attitudes and beliefs in learning to teach. In J. Sikula (Ed.),
Handbook of research on teacher education (5th
ed., pp. 102–119). New York: Macmillan.
Roehrig, A.D., Turner., J. E., Grove, C. M., Schneider, N., & Liu, Z. (2009). Degree of
alignment between beginning teachers‟ practices and beliefs about effective classroom practices.
The Teacher Educator, 44(3), 164 – 187.
Thompson, A. (1984). The relationship of teachers‟ conceptions of mathematics and
mathematics teaching to instructional practice. Educational Studies in Mathematics, 15(2), 105–
127.
Tsai, C. C. (2006). Teachers‟ scientific epistemological views: The coherence with instruction
and students‟ views. Science Education, 91, 222-243.
Andrew Zieffler
250 EdSciB
56 E River Rd
Minneapolis, MN 55455
mailto:[email protected]
612-310-6959
Jiyoon Park
250 EdSciB
56 E River Rd
Minneapolis, MN 55455
Joan Garfield
250 EdSciB
56 E River Rd
Minneapolis, MN 55455
Robert delMas
250 EdSciB
56 E River Rd
Minneapolis, MN 55455
Journal of Statistics Education, Volume 20, Number 1(2012)
29
Audbjorg Bjornsdottir
250 EdSciB
56 E River Rd
Minneapolis, MN 55455
Volume 20 (2012) | Archive | Index | Data Archive | Resources | Editorial Board | Guidelines for
Authors | Guidelines for Data Contributors | Guidelines for Readers/Data Users | Home Page |
Contact JSE | ASA Publications