Embed Size (px)
DESCRIPTION
The Strategic Case for Gold Amsterdam 11 October 2009. Disclaimer. - PowerPoint PPT Presentation
Citation preview

The Strategic Case for GoldAmsterdam
11 October 2009

Disclaimer
The information and opinions contained in this presentation have been obtained from sources believed to be reliable, but no representation or warranty, express or implied, is made that such information is accurate or complete and it should not be relied upon as such. This presentation does not purport to make any recommendation or provide investment advice to the effect that any gold related transaction is appropriate for all investment objectives, financial situations or particular needs. Prior to making any investment decisions investors should seek advice from their advisers on whether any part of this presentation is appropriate to their specific circumstances. This presentation is not, and should not be construed as, an offer or solicitation to buy or sell gold or any gold related products. Expressions of opinion are those of the World Gold Council only and are subject to change without notice.
2

Introducing World Gold Council
• Funded by the world’s leading gold
mining companies
• We promote the use of gold in all its
forms through marketing activities in
major international markets.
• Offices in key consuming countries:
India
China
Middle East
United States
MEMBERSMEMBERS
Agnico EagleAgnico Eagle
AngloGold AshantiAngloGold Ashanti
Barrick Gold CorporationBarrick Gold Corporation
Coeur d’Alene Mines CorporationCoeur d’Alene Mines Corporation
Compania de Minas BuenaventuraCompania de Minas Buenaventura
Eldorado GoldEldorado Gold
GoldcorpGoldcorp
Gold Fields LimitedGold Fields Limited
HarmonyHarmony
IAM GoldIAM Gold
Kinross Gold CorporationKinross Gold Corporation
Newmont Mining CorporationNewmont Mining Corporation
Peter Hambro MiningPeter Hambro Mining
Yamana GoldYamana Gold
ASSOCIATESASSOCIATES
CediminCedimin
China National Gold CorporationChina National Gold Corporation
The Hutti Gold Mines CompanyThe Hutti Gold Mines Company
Kahama MiningKahama Mining
Minera Yanacocha S.R.L.Minera Yanacocha S.R.L.
Mitsubishi Materials CorporationMitsubishi Materials Corporation
Royal Gold IncRoyal Gold Inc..

Outline
• Demand and supply fundamentals – resilient demand and constrained supply
• The outlook• Key investment attributes
– A hedge against inflation– A hedge against dollar movements– A safe haven and insurance policy – A diversifier
4
Demand and Supply Fundamentals

Q2 tonnage down 9% on Q2 2008 6
-
200
400
600
800
1,000
1,200
1,400
Q1'06 Q3'06 Q1'07 Q3'07 Q1'08 Q3'08 Q1'09
Total identifiable demand (tonnes)
Jewellery Consumption Industrial & Dental Identifiable Investment London PM fix (US$/oz)
Source: GFMS

Price volatility a constraint on jewellery demand7
10000
15000
20000
25000
30000
35000
40000
45000
50000
55000
200
400
600
800
1000
1200
1400
1600
1800
02-Jan-04 02-Jan-05 02-Jan-06 02-Jan-07 02-Jan-08 02-Jan-09
The five year daily gold price (per oz) in selected currencies
$US Euro New Turkish Lira Indian Rupees, rhsSource: WGC based on Global Insight data
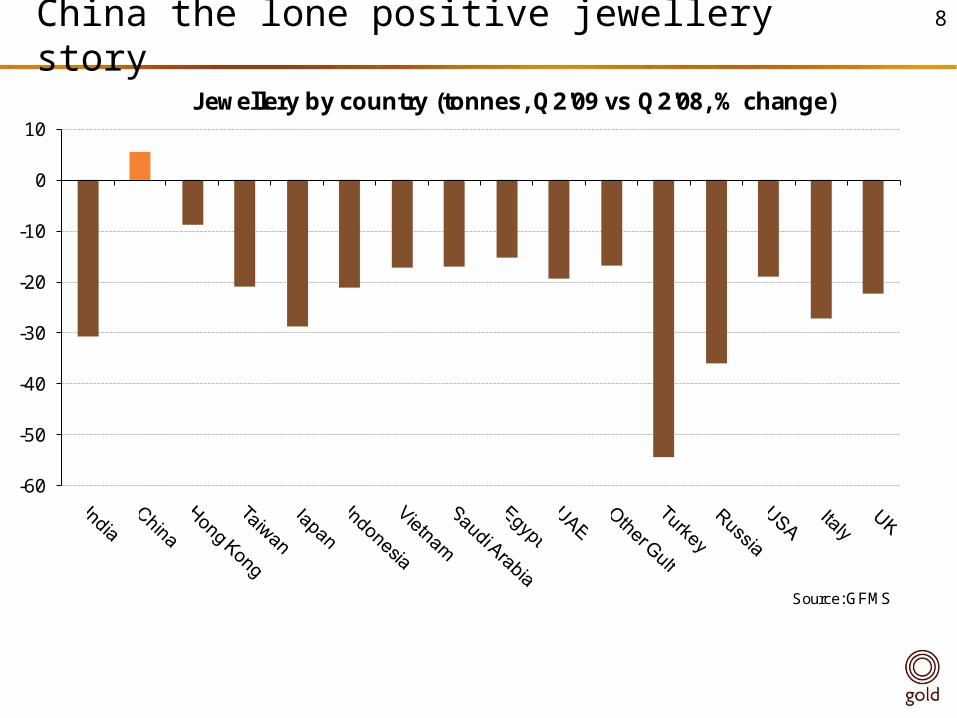
China the lone positive jewellery story
-60
-50
-40
-30
-20
-10
0
10
Jewellery by country (tonnes, Q2'09 vs Q2'08, % change)
Source: GFMS
8

A breakdown of investment demand
Tonnes, Q2’08 Tonnes, Q2’09 % change
Identifiable investment
151.9 222.4 46
Net retail investment 147.9 165.7 12
ETFs and similar 4.0 56.7 1315
“Inferred investment” 10.2 195.1 1657
“Total” investment 162.1 417.4 157
Source: GFMS
9
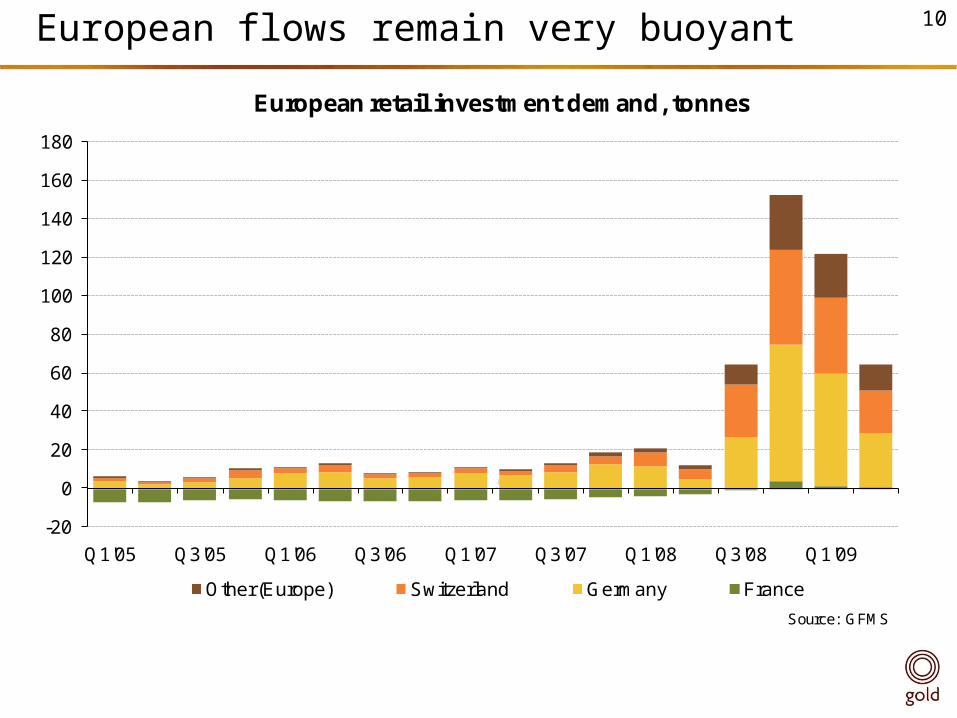
European flows remain very buoyant
-20
0
20
40
60
80
100
120
140
160
180
Q1'05 Q3'05 Q1'06 Q3'06 Q1'07 Q3'07 Q1'08 Q3'08 Q1'09
European retail investment demand, tonnes
Other (Europe) Switzerland Germany France
Source: GFMS
10

ETF flows generally long term in nature 11
200
300
400
500
600
700
800
900
1000
1100
0
200
400
600
800
1000
1200
1400
1600
1800
2000
Jan-06 Jul-06 Jan-07 Jul-07 Jan-08 Jul-08 Jan-09 Jul-09
Holdings in Exchange Traded Funds (tonnes) and the gold price, Jan 06 - Sep 09
Other funds 'GLD' Gold price, $US/oz, rhs
Source: www.exchangetradedgold.com, Global Insight

Share of identifiable demand
Q2 2008
Jewellery 66%
Industrial 15%
IdentifiableInvestment
19%
Q2 2009
Jewellery 56%
Industrial 13%
IdentifiableInvestment
31%
Source: GFMS
12

Total Q2 supply down 23% on Q1 2009
-200
-
200
400
600
800
1,000
1,200
1,400
Q1'05 Q3'05 Q1'06 Q3'06 Q1'07 Q3'07 Q1'08 Q3'08 Q1'09
Quarterly supply in tonnes
Total mine supply Official sector sales Recycled gold Source: WGC, GFMS
13

Net central bank sales have continued to reduce
-100
0
100
200
300
400
500
H1'02 H1'03 H1'04 H1'05 H1'06 H1'07 H1'08 H1'09
Supply from net central bank sales in tonnes
Non-CBGA CBGA Source: GFMS, WGC, IMF
14

The Strategic Investment Casefor Gold

Why gold? A safe haven and form of insurance
• A simple asset• No default risk• No counterparty risk• Liquid• Gold’s history
– As a means of exchange– As the centre of the global monetary system
16
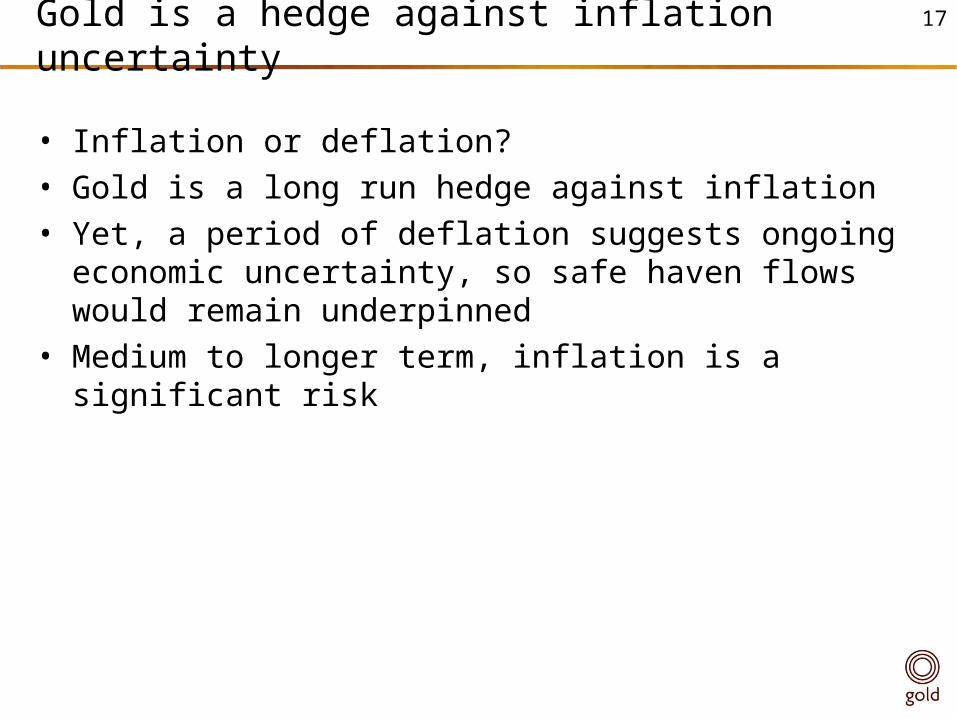
Gold is a hedge against inflation uncertainty
• Inflation or deflation? • Gold is a long run hedge against inflation• Yet, a period of deflation suggests ongoing
economic uncertainty, so safe haven flows would remain underpinned
• Medium to longer term, inflation is a significant risk
17

Gold is a long run hedge against the US dollar
18
0.58
0.61
0.64
0.67
0.70
0.73
0.76
0.79
0.82650
700
750
800
850
900
950
1000
1050
Aug-07 Oct-07 Dec-07 Feb-08 Apr-08 Jun-08 Aug-08 Oct-08 Dec-08 Feb-09 Apr-09 Jun-09 Aug-09
Gold and $/Euro
Gold Dollar/Euro (RHS, Inverted)
Source: Global Insight

Gold is a diversifier
Correlations, weekly returns 3 years ending June 2009
Gold
Gold 1.00
FTSE 100 -0.22
DAX 30 -0.20
S&P500 -0.10
MSCI World Ex UK -0.28
LB /BarCap Global Treasuries Index , TR, GBP
0.02
LB/BarCap Global Treasuries Index, TR, Euro -0.01
Euribor, 3 month 0.01
UK Lending Rate, 3 month 0.03Red text denotes that correlation coefficient is not significantly different from zero.Violet text denotes that correlation coefficient is negative (5% level of significance).
Data: Global Insight, Lehman Bros., WGC
19
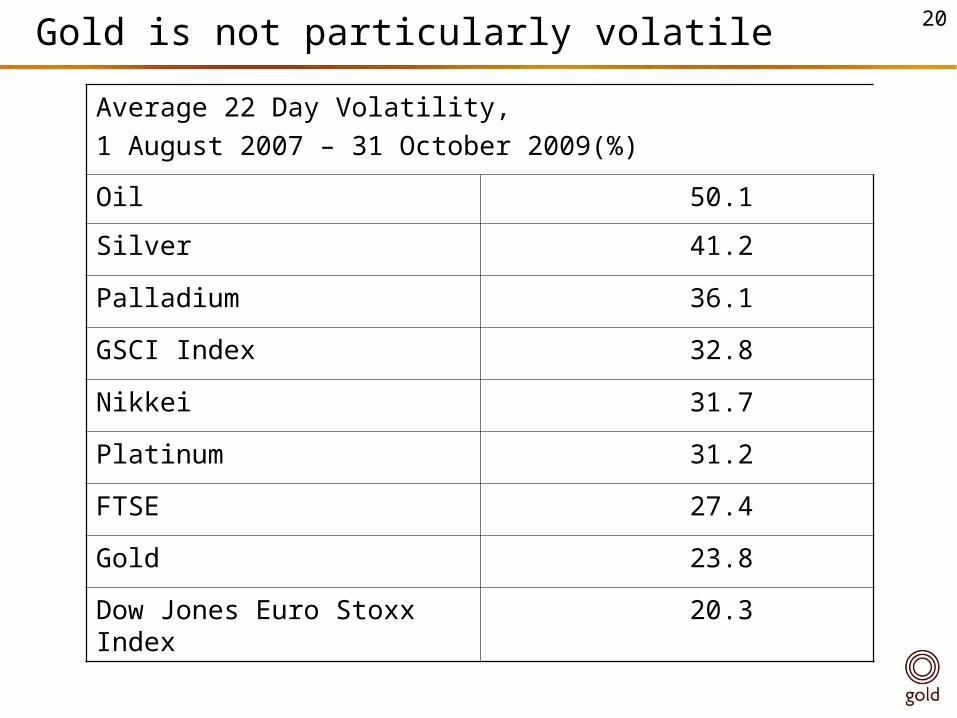
Gold is not particularly volatile
Average 22 Day Volatility, 1 August 2007 – 31 October 2009(%)
Oil 50.1
Silver 41.2
Palladium 36.1
GSCI Index 32.8
Nikkei 31.7
Platinum 31.2
FTSE 27.4
Gold 23.8
Dow Jones Euro Stoxx Index 20.3
20

WHERE DOES GOLD FIT INTO A PORTFOLIO?

Results with gold added
Optimal Portfolios Composition Map
0.0%
10.0%
20.0%
30.0%
40.0%
50.0%
60.0%
70.0%
80.0%
90.0%
100.0%
4.3% 4.4% 4.6% 5.1% 5.6% 6.2% 6.9% 7.6% 8.3% 9.1% 9.9% 10.9% 11.9%volatility
allo
ca
tio
n
UK Gilts Short UK Gilts Medium UK Gilts LongGlobal Bonds UK Equities Europe Ex UK EquitiesNorth American Equities Pacific Equities Gold
22

Over and above a commodity basketOptimal Portfolios Composition Map
0.0%
10.0%
20.0%
30.0%
40.0%
50.0%
60.0%
70.0%
80.0%
90.0%
100.0%
4.3% 4.3% 4.6% 4.9% 5.4% 6.0% 6.7% 7.3% 8.0% 8.8% 9.6% 10.5% 11.4%
volatility
allo
cati
on
UK Gilts Short UK Gilts Medium UK Gilts LongGlobal Bonds UK Equities Europe Ex UK EquitiesNorth American Equities Pacific Equities GoldCommodities
23

Summary
• The demand for gold has shown considerable resilience across the economic cycle
• The three sectors provide a source of balance• The outlook for supply remains constrained• High levels of uncertainty – economic, inflation,
currency – are supportive for gold • Gold’s biggest strength is its diversification
properties - the focus on diversification and risk management are expected to continue
24

Questions?
www.gold.org www.invest.gold.org
25


![Retailer Awards 2017 Winners List - Wine-Searcher Awards Results.pdfGold French List in Amsterdam Bolomey Wijnimport Gold French List in Antwerp [Antwerpen] Finest Wines Gold French](https://img.pdfslide.net/doc/110x75/5e3777d7880cb0549b364b5c/retailer-awards-2017-winners-list-wine-searcher-awards-resultspdf-gold-french.jpg)