Embed Size (px)
Citation preview
The strategic role of the purchasing function - Strategic alignment
JESÚS MERA RUIZ DE LIRA
Master of Science Thesis
Stockholm, Sweden 2011


iii
THE STRATEGIC ROLE OF THE PURCHASING FUNCTION. STRATEGIC ALIGNMENT
JESÚS MERA RUIZ DE LIRA
Master of Science Thesis INDEK 2011:93
KTH Industrial Engineering and Management
Industrial Management
SE-100 44 STOCKHOLM

iv
v
Master of Science Thesis INDEK 2011:93
THE STRATEGIC ROLE OF THE PURCHASING FUNCTION - STRATEGIC ALIGNMENT
Jesús Mera Ruiz de Lira
Approved
2011- 06 - 27
Examiner
Mats Engwall
Supervisor
Mandar Dabhilkar
Abstract
Problem. The importance of strategic alignment between the purchasing and the firm strategy has
increased in recent years because it has been pointed out as a mean to improve business performance.
However, the use of different sourcing strategies depending on the characteristics of the components
that firms are purchasing has not been considered when analyzing strategic alignment. That establishes
a lot of limitations to the results obtained in previous analyses about strategic alignment.
Purpose. The aim of this master thesis is to analyze empirically the consequences that the strategic
alignment of the purchasing function with the firm strategy has on business performing overcoming
previous limitations. In order to do so, sourcing strategies will be distinguished through Kraljic’s matrix.
Methodology. A data sample collected through the International Purchasing Survey (IPS) has been used
to the development of this master thesis. It consists of 429 firms from 9 European countries, Canada and
USA. Two hypotheses were tested by multiple regression analyses. One of them verifies the relationship
between strategic alignment business performance and the other one the link between the purchasing
role and strategic alignment. In order to draw conclusions, both hypotheses were tested on the four
purchasing categories of Kraljic’s matrix.
Findings. Results show that business performance is affected positively by strategic alignment only for
the category “strategic items” of Kraljic’s matrix. They also show that an active participation of the
purchasing function on the overall firm strategy can promote strategic alignment for strategic items.
Research limitations. It is difficult to establish a consistent index to measure strategic alignment. It is
also hard to find all the factors that influence strategic alignment. Further research is needed on these
themes.
Practical implications. Companies have been encouraged to integrate the whole purchasing function
into the firm strategy to improve business performance through strategic alignment. However, the
positive economic effects of this integration can’t be generalized. The implementation of those activities
that help integrate the purchasing function is a strategy recommended only when strategic items are
involved. It is justified by the fact that it is the only quadrant where business performance can be
improved through strategic alignment.

vi
Acknowledgements
The development of this master thesis is my last step to become an engineer. A lot of people
have helped me achieve that objective; three of them have been essential to its
accomplishment. Firstly, I would like to thank my mother for taking care of me almost every
day of my life. Secondly, I would like to thank my father for guiding my steps, very well up to
now. Finally, I would like to thank my brother because he usually is a reference in my life.
vii
Content 1. Introduction ......................................................................................................................................... 1
1.1. Purpose ....................................................................................................................................... 1
1.2. Scope ........................................................................................................................................... 2
1.3. Disposition .................................................................................................................................. 2
1.4. Graphical scheme ........................................................................................................................ 2
2. Methodology ....................................................................................................................................... 4
2.1. Classification of research .................................................................................................................. 4
2.2. Theory generation ............................................................................................................................. 5
2.3. Research paradigms ...................................................................................................................... 5
2.4. Research strategy .............................................................................................................................. 5
2.5. Data collection .................................................................................................................................. 6
3. Context ................................................................................................................................................ 7
3.1 Traditional approach of the purchasing function ....................................................................... 7
3.1.1. Markets’ characteristics ..................................................................................................... 7
3.1.2. Companies’ structures and strategies ................................................................................ 8
3.1.3. Purchasing function ............................................................................................................ 8
3.2. Changes in firms and in the environment ................................................................................... 9
3.2.1. Changes in the environment .............................................................................................. 9
3.2.2. Changes in firms ............................................................................................................... 10
3.3. Adaptation of the purchasing function ..................................................................................... 11
4. Theoretical Framework ...................................................................................................................... 13
4.1. Strategic Alignment ................................................................................................................... 14
4.1.1. Strategic Alignment from the concept of strategy ........................................................... 14
4.1.2. Strategic Alignment through its evolution ....................................................................... 15
4.2. The Kraljic approach ................................................................................................................. 19
4.2.1. Non-critical items ............................................................................................................. 21
4.2.2. Bottleneck items .............................................................................................................. 21
4.2.3. Leverage items ................................................................................................................. 21
4.2.4. Strategic items.................................................................................................................. 22
4.3. Strategic outsourcing and relationship management ............................................................... 22
4.3.1. Strategic outsourcing ....................................................................................................... 22
4.3.2. Relationship management ............................................................................................... 23
4.4. Research hypotheses ................................................................................................................ 26
5. Empirical Study .................................................................................................................................. 30
5.1. Data ........................................................................................................................................... 30
5.2. Measures .................................................................................................................................. 30
viii
5.2.1. To characterize the data .................................................................................................. 30
5.2.2. To assess hypotheses ....................................................................................................... 31
5.3. Analyses .................................................................................................................................... 36
6. Results ............................................................................................................................................... 37
6.1. Descriptive statistics ................................................................................................................. 37
6.2. Regression models .................................................................................................................... 38
6.3. Diagnosis of the model ............................................................................................................. 39
7. Discussion .......................................................................................................................................... 41
7.1. Theoretical implications ............................................................................................................ 41
7.2. Practical implications ................................................................................................................ 42
7.3. Limitations ................................................................................................................................ 43
8. Conclusions and Future Research ...................................................................................................... 44
8.1. Conclusions ............................................................................................................................... 44
8.2. Future research ......................................................................................................................... 44
References .................................................................................................................................................. 45
Appendixes ................................................................................................................................................. 50
Appendix 1. Purchasing competitive objectives .................................................................................... 50
Appendix 2. Firm competitive objectives ............................................................................................... 51
Appendix 3 Related purchasing and firm objectives .............................................................................. 52
Appendix 4. Level of customization ....................................................................................................... 52
Appendix 5. Plots of residuals, Hypothesis 1: Full sample ..................................................................... 53
Appendix 6. Plots of residuals, Hypothesis 1: Leverage items ............................................................... 54
Appendix 7. Plots of residuals, Hypothesis 1: Strategic items ............................................................... 55
Appendix 8. Plots of residuals, Hypothesis 1: Non-critical items ........................................................... 56
Appendix 9. Plots of residuals, Hypothesis 1: Bottleneck items ............................................................ 57
Appendix 10. Plots of residuals, Hypothesis 2: Full sample ................................................................... 58
Appendix 11. Plots of residuals, Hypothesis 2: Leverage items ............................................................. 60
Appendix 12. Plots of residuals, Hypothesis 2: Strategic items ............................................................. 62
Appendix 13. Plots of residuals, Hypothesis 2: Non-critical items ......................................................... 64
Appendix 14. Plots of residuals, Hypothesis 2: Bottleneck items .......................................................... 66
Appendix 15. Possible outliers ............................................................................................................... 68
ix
Figures
Figure 1. Graphical scheme of the theoretical part of the master thesis ..................................... 3
Figure 2. Value Chain. .................................................................................................................. 10
Figure 3. The process of strategic alignment. ............................................................................. 15
Figure 4. Graphical illustration of the concept of production competence. .............................. 17
Figure 5. Graphical illustration of the concept of purchasing competence. ............................... 18
Figure 6. Dimensions and categories in the Kraljic matrix .......................................................... 20
Figure 7. The Strategic Focused Outcomes Model (SFOM). ....................................................... 24
Figure 8. Strategic Relationship Positioning Model. ................................................................... 25
Figure 9. Alignment of strategies and relationships ................................................................... 27
Figure 10. Histogram of the variable Firm size (fig A) and Firm size (ln) (fig B). ......................... 35
1
1. Introduction
1.1. Purpose The purchasing function, which was considered a mere administrative function for decades,
has increased lately its competitive and strategic importance for both companies and
academics. Some authors (Pearson and Gritzmacher, 1990; Spekman et al., 1992; Chen et al.,
2004; Cousins et al., 2008) have developed different articles in which the increase of the
importance of this function has been highlighted.
Purchasing and Supply Management (PSM) is recognized as a very important tool to create
value for the company (Gadde and Hakansson, 1994). Its adequate management can create a
competitive advantage for the company. One of the specific managerial themes related to the
purchasing function that can create a competitive advantage is strategic alignment, a “fit
between business strategy and purchasing strategy” (Baier et al., 2008). Some analyses have
been developed to measure empirically the contribution of strategic alignment to business
performance in recent years (González-Benito, 2007; Baier et al., 2008). Both authors have
proved the positive effect of strategic alignment on business performance.
However, none of them has considered that firms organize their supply processes using a
variety of sourcing strategies (Gelderman et al., 2003). The choice of these different strategies
is contingent upon a variety of factors, such as the importance of a good or service to the firm
and the competitiveness of the supply market place (Cousin, 2008). Due to the existence of
this variety of sourcing strategies, it seems quite difficult, and even useless, to try to align the
strategy of every purchased good to the firm strategy. Therefore, this master thesis is going to
consider when strategic alignment is profitable according to the different sourcing strategies
followed by purchasing departments.
To help purchasing departments formulate appropriate sourcing and competitive strategies,
Kraljic (1983) developed a purchasing portfolio model which has received considerable
attention from academic and business world. It is a simple positioning matrix based on the
importance that a good or a service has for the firm and how technically complex the product
is. This master thesis is going to use Kraljic’s matrix as a tool to distinguish different purchasing
strategies and their consequences on strategic alignment and business performance. Some
other aspects of supply will also be considered to complete the analyses of the sourcing
strategies.
Once the purchasing function was recognized as a strategic function, it was encouraged to
develop an active role in the firm’s decision making in order to enhance its strategic role.
Several practices have been observed and proposed to do so in different articles. In one of
them, Watts (1992) developed a model to link purchasing to the firm strategy providing the
purchasing function with a higher status within the company. This master thesis is also going
to analyze if the active participation of the purchasing function in the strategy of the company
promote strategic alignment.
2
Therefore, the main purpose of this master thesis is to improve business performance through
strategic alignment between the purchasing function and the firm strategy. Kraljic’s matrix is
considered to distinguish purchasing strategies.
Two secondary objectives of the master thesis can be mentioned. Both of them are analyzed
through two hypotheses whose link constitutes the conducting thread of the master thesis.
The first secondary objective is to prove that strategic alignment can improve business
performance when strategic items of Kraljic’s matrix are involved. The other secondary
objective is to identify the practices that encourage the participation of the purchasing
function in the overall strategy of the firm to facilitate strategic alignment between the
purchasing function and the firm.
1.2. Scope The scope of this master thesis is related to the size of the firms considered in the analyses.
Previous research focused the topic of strategic alignment on large companies. However, this
master thesis extends the scope of the research on strategic alignment to any company size.
To do so, the answers provided by firms to the International Purchasing Survey (IPS) are
considered.
1.3. Disposition The purchasing function has not always been considered as an important part of the company.
There were changes in the environment that provoked this increase. They are the starting
point for the development of the master thesis in order to set a context for the topic analyzed.
They are explained just after the methodological chapter, which is the next one. Afterwards, a
theoretical framework about strategic alignment and sourcing strategies, based on Kraljic’s
matrix, is exposed. This theoretical framework provides support for the two hypothesis
analyzed in the master thesis. Hypothesis 1, based on the theory, asserts that an improvement
in business performance through strategic alignment can only be expected for strategic items
of Kraljic’s matrix. Hypothesis 2 analyzes the relationship between the active participation of
the purchasing function in the overall firm strategy and strategic alignment. Although there is
no theoretical support to test this hypothesis according to different quadrants of Kraljic’s
matrix, that distinction is made in order to link this second hypothesis to the first one.
Afterwards, the different parts of the empirical study, such as the data base or the variables
considered, are explained. Results are presented in the following chapter, providing support
for Hypothesis 1 and 2 and making it possible to link the results of both analyses. Then, results
are discussed because they provide both theoretical and practical implications. Finally,
conclusions about strategic alignment and its implications are exposed.
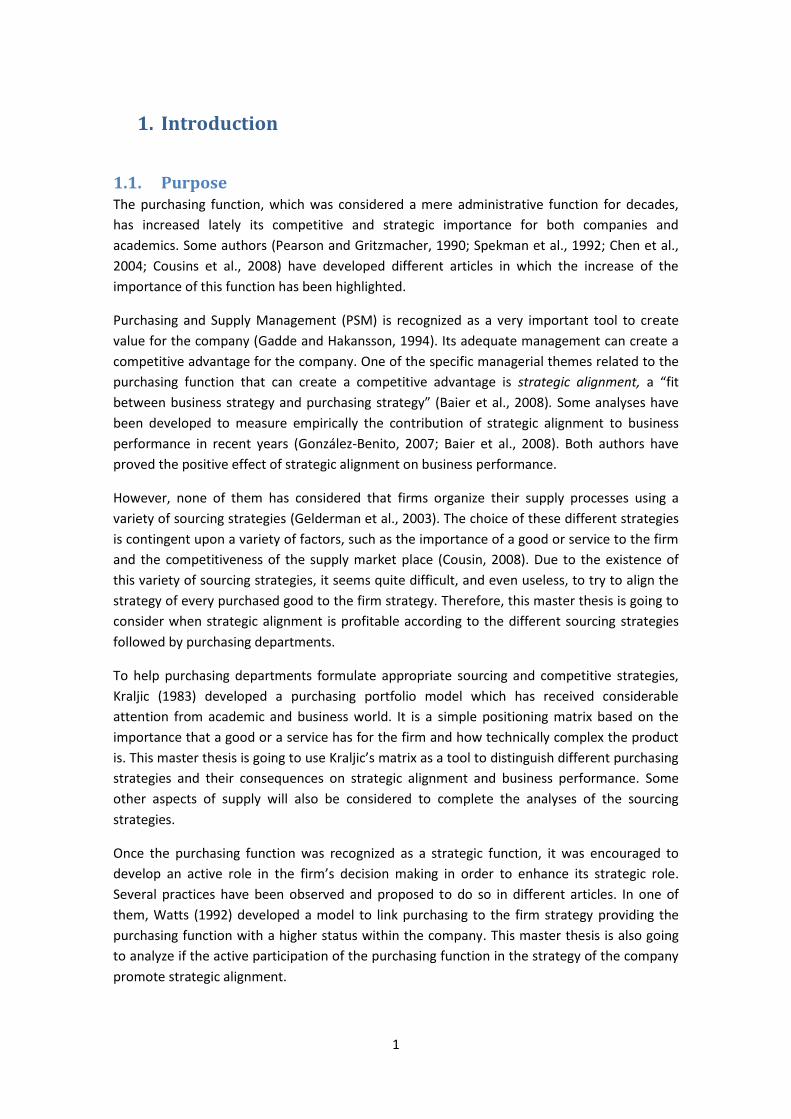
1.4. Graphical scheme There is a graphical scheme of the theoretical part of the master thesis in this section in order
to facilitate the reading of the document. The context chapter establishes a general framework
3
for the master thesis. Then, three different topics are developed in the theoretical framework
chapter, all of them necessary for the two hypotheses whose link is shown in the master thesis
conducting thread.
Figure 1. Graphical scheme of the theoretical part of the master thesis
4
2. Methodology
The aim of this second chapter is to gather the essential information about general research
approaches and about the specific research approaches used in the development of this
master thesis. It is very important to consider different aspects about research methodology
when developing a research project (Bryman et al., 2011). The following sections refer to
theories, methodologies, paradigms, strategies and data collection underlying any research
project in general and this specific project. Their aim is not to be a guide of all the aspects that
need to be considered for a research project but to point out the most important principles of
research methodology and establish the chosen one for this master thesis.
2.1. Classification of research Collis et al. (2009) asserted that every research project must fit in one of the following four
categories. The main characteristic to distinguish among different categories is the amount of
information available about the research theme.
- Exploratory research This kind of research is developed when little or no
knowledge exists about a topic. The aim of this kind of research is to find ideas or patterns that
can be guidelines for deeper research.
- Descriptive research The aim of this kind of research is to describe characteristics
of an existing problem. This kind of research is used when there is awareness of the problem
and a description of it is wanted.
- Analytical research This kind of research is more in-depth in its nature. It goes
further than a description of the problem because it analyzes the reasons beyond the problem:
“why” it exists and “how” it is. It is not a list of the characteristics of the problem but the
reasons underlying these characteristics.
- Predictive research This is the deepest kind of research. It considers the
probability of the problem to appear depending on a specific situation and can be used to
predict the arousal of the problem.
Considering the previous discussion, this master thesis is an analytical research. As there is
enough available information about strategic alignment due to previous research, it is not
expected that this master thesis is neither exploratory research nor descriptive research. The
aim of this master thesis is to develop an analytical research because it tries to explain why,
under certain circumstances, strategic alignment can improve business performance and how
certain practices can facilitate strategic alignment.
5
2.2. Theory generation Brian et al. (2011) asserted that some connection should exist between theory and practice
when conducting a research. Researchers classify the relationship between theory generation
and empirical evidence as inductive or deductive.
The starting point for the inductive approach is the existing theories, which are the support for
the researcher’s analyses. The conclusions of these analyses are also compared to the previous
research, which is the basis for the development of the project (Brian et al., 20011).
A research developed following deductive approach tries to generate theories and hypotheses
from the empirical evidence found by researchers (Brian et al., 2011).
This master thesis follows an inductive approach because the two hypotheses considered are
based on previous theory about strategic alignment, purchasing strategies and purchasing
relationships management. These three topics are the basis for the empirical study and
findings are compared to these different aspects.
2.3. Research paradigms Previous section refers to the relationship between theory and practice. The aim of this section
is to consider two different ways to create knowledge and theory from observations and
analyses of the real world: positivism and hermeneutic. In other words, this section considers
how the link between observations and theory is created.
A researcher with a positivistic point of view regards the world as objective. Therefore,
objectivity and casualty rule this approach (Collis et al., 2009). Objectivity is based on a
complete detachment for the analysis of the phenomenon observed. Casualty is concerned
about the relationship between the observation and the knowledge generated.
A hermeneutic point of view is based on historical and social stances (Collis et al., 2009). It
considers that the link between humans and institutions can’t be excluded in the analysis of a
phenomenon. Researchers following this approach are very interested in the roles that
different actors play when analyzing a phenomenon.
This master thesis follows a positivistic point of view. The analyses developed are based on
statistics and their aim is to be as objective and casual as possible.
2.4. Research strategy It is necessary to follow a research strategy in order to obtain some results and extract
information and conclusion from the analyses. There are two research strategies: qualitative
and quantitative (Bryman et al., 2011).
Quantitative strategy focuses on the quantification and analysis of empirical data. The nature
of this strategy is positivistic because it is very concerned about objectivity and casualty.
6
Qualitative strategy focuses on observations taking into account human interactions and the
analysis of such interactions. The nature of this strategy is hermeneutic; it has a non-objective
point of view because the human perception of the phenomenon is very important.
Quantitative strategy is very important in this master thesis because the two hypotheses
considered are analyzed through statistical analyses. However, there is also some qualitative
strategy. For instance, the decision about the practices that can facilitate the active
participation of the purchasing function in the overall strategy was decided following
qualitative analyses.
2.5. Data collection Data collection can be classified into two categories: primary data and secondary data.
Primary data includes the information obtained directly from a source, such as interviews or
observations (Collis et al., 2009). Primary data for this master thesis was mainly acquired from
the International Purchasing Survey (IPS). Further information about it can be found in the
Empirical Study chapter.
Secondary data refers to published sources such as research publications (Collis et al., 2009).
Most of the secondary data used in this master thesis is existing literature and research
publications regarding purchasing and strategic alignment. It is necessary to mention the
Journal of Purchasing and Supply Management as a very important source for the literature
review.
Therefore, according to the discussion of the previous section, this master thesis is an
analytical research whose theory generation follows an inductive approach, with a positivistic
point of view. It is both a qualitative and quantitative research whose main primary data is the
IPS and the main secondary data is the Journal of Purchasing and Supply Management.
7
3. Context
This master thesis focuses on the analysis of the importance of the alignment between the
purchasing and the firm strategies. This is one of the topics that tries to highlight the strategic
role of the purchasing function. Although a lot of studies have been developed to enhance the
importance of this function, it was not until the 1980’s that academics began to work on this
area. Neither the previous lack of attention nor the current interest on the purchasing function
is due to tendencies or fashions; it is mainly due to an evolution in the characteristics of both
the environment and firms. The aim of this chapter is to summarize this change through three
different sections. Firstly, the characteristics of firms and markets that were responsible for
the lack of importance of the purchasing function are mentioned. Secondly, it is explained
what changed so that the importance of the purchasing function increased. Finally, how this
function had to change to get adapted to the new environment is also explained.
3.1 Traditional approach of the purchasing function The objective of a company, as a production system, is to create a range of products to sell to
customers in the market. Market and customer characteristics determine the production
system’s behavior. In turn, the production system determines the requirements that
companies set to their suppliers through the purchasing function (Prida and Gutiérrez, 1996).
Therefore, purchasing is not a very remote function from customers and it is affected by
markets and their environments.
Markets have evolved a lot through history, especially during the last decades of the last
century. Consequently, companies’ strategies and purchasing functions have changed to be
able to compete in these changing environments (Ponce and Prida, 2006).
This section shows how markets, companies’ strategies and purchasing functions were since
1950s until 1980s. The aim of this section is to contextualize the purchasing function during
these three decades.
3.1.1. Markets’ characteristics During the fifties and the sixties, companies were working in stable and non-saturated markets
whose demand was larger than the offer. However, during the sixties, the relationship
between offer and demand began to change: offer had been growing so much during the last
years that it had become larger than demand. (Cousins, 2008)
As long as offer had been smaller than demand, customers hadn’t had much power to
influence companies. Firms had market’s power and could decide what kind of products (and
their characteristics) to produce. However, when offer grew up so much that it became larger
than demand, companies diversified their products in order to expand markets. Then,
customers got more options to choose although they didn’t gain much power because markets
were not still saturated. It was not until 1973 that markets became saturated due to several
reasons. One of the most important reasons was the increase in the gas prices. Both raw
8
materials and products became more expensive and the infinite expansion of markets came to
halt (Ponce and Prida, 2006).
3.1.2. Companies’ structures and strategies Most companies adopted a functional structure throughout the 20th century. Entrepreneur’s
tasks such as searching new markets and external funding were separated from worker’s tasks:
production activities (Ponce and Prida, 2006).
Similar functions were gathered and departments such as marketing, purchasing, human
resources, production, sales, etc., were created. Companies’ main focus was on production,
whereas the rest of the functions were subordinated to that function. These secondary
functions had no strategic objectives. Their main objective was to manage their resources
efficiently (Ponce and Prida, 2006).
Another important reason to explain why purchasing didn’t play an important role in
company’s strategy is vertical integration policy: “bringing a function or technology within the
boundary of a firm assuring continuity in the relationship because suppliers are now
hierarchically connected employees” (Dwyer and Tanner, 2001). In other words, vertical
integration implies that a component is developed within the company instead of buying it in
the market. Before 1970s companies were operating in very stable markets. That kind of
markets encourages companies to establish a vertical integration policy because they know
that large investments such as new plants will be recovered. When companies had to decide
whether to buy or make, they preferred to buy products belonging to very competitive
markets without significant differences among suppliers, such as raw materials. Therefore, the
purchase of those items was not a very demanding activity. On the other hand, they preferred
to make those products which didn’t have a very large offer in the market whose purchase
would be more sophisticated.
Therefore, purchasing function’s objectives were mainly to support production and to buy
products, components and services that were easily obtained in the market. Due to its
activities, from the company’s point of view, it was considered an administrative function
rather than a strategic function.
3.1.3. Purchasing function During these years, the purchasing function was isolated from the other functions of
companies and was subordinated to other functions, especially production (Ponce and Prida,
2006).
Purchasing policy was to ask large quantities of products to suppliers in order to get discounts
(Chopra and Meindl, 2001). Besides, large orders reduced the risk of running out of some
components because large stocks were available in warehouses. Additionally, more efficient
purchasing transactions were obtained. Although other variables were considered, such as
quality and delivery, the lack of responsibility and information in the purchasing department
made it difficult to consider other aspects but price.
Purchasers and suppliers used to have very competitive relationships. There used to be a kind
of winner-loser relationship in which both sides considered the other side as a competitor
9
rather than a support. Companies tried to have access to a wide range of suppliers so that they
didn’t depend on a single supplier. Therefore, close and helping relationships didn’t exist. As it
has been previously mentioned, companies purchased those items which belonged to a
competitive market so that they could purchase to several suppliers at the same time and
change from one to another very quickly and without negative consequences (Cousins, 2008).
3.2. Changes in firms and in the environment In the previous section, it has been described a stable market in which customers didn’t have
much power. Companies had been growing up continuously and had been structured in a way
that didn’t provide the purchasing function with responsibility. When the environment
changed in the 1970s, companies had to modify their strategies and in some ways their
structure. These changes in the environment and in companies are explained in this second
section.
3.2.1. Changes in the environment Markets became saturated in the 1970s. There were a lot of companies willing to provide
more products than customers willing to buy them (Cousins, 2008). Companies began to
realize that they had to satisfy customers’ growing expectations if they expected to keep their
market share. Customers had obtained market’s power and they began to ask more complex,
more personalized, cheaper and high-quality products as well as a better service from the
company.
Otherwise, technology has been improving a lot during the last decades. At the moment, there
are some devices which would have been a dream very few years ago. Consequently, products
have become more sophisticated. Not only is important technology evolution but also its
speed: it has been evolving so fast that life-spam of products is continuously decreasing. This
situation is opposed to large investments in new plants because of the short time spam to
recover the investment (Ponce and Prida, 2006).
During these last decades, there have been high improvements in information and
communication technology. The development of a lot of software programs facilitated the
management of any kind of institution. Besides, Internet, as well as mobile phones and
computers, have made communication easier, cheaper and faster among people all over the
world. It has facilitated innovation sharing between people and companies (Cousins, 2008).
Transports systems have also experienced a lot of improvements. Thousands or roads,
airports, railways and ports have been built all over the world, especially in developed
countries. The movement of people and freights has become faster and cheaper. It has implied
a wide expansion of markets, suppliers and resources (Chopra and Meindl, 2001).
All these improvements in communication, technology and transport, as well as the
elimination of trade barriers, have facilitated globalization: “the diminution or elimination of
state-enforced restrictions on exchanges across borders and the increasingly integrated and
complex global system of production and exchange that has emerged as a result” (Palmer,
2002). Globalization is another characteristic of nowadays market environment.
10
Consequently, the environment in which companies develop their activities is far away from
the environment they worked in the 1970s. Therefore, they have had to adapt to be able to
keep on competing.
3.2.2. Changes in firms When markets became saturated, companies diversified their products to maintain their
market share. In order to satisfy customers, companies couldn’t produce big quantities of the
same product anymore because more personalized products were demanded by customers.
Manufacturing systems had to become more flexible so that they could be adapted to that
new wide range of specifications. Customers also required higher quality products and better
service from the company (Ponce and Prida, 2006).
Companies had to accept some other changes due to customers’ exigencies (Cousins, 2008).
Customers’ satisfaction became the prior objective relegating strategy focus on production.
This change had a very important consequence: as customers’ satisfaction depends on every
area of the company, firms had to break the internal barriers among departments in order to
help information sharing.
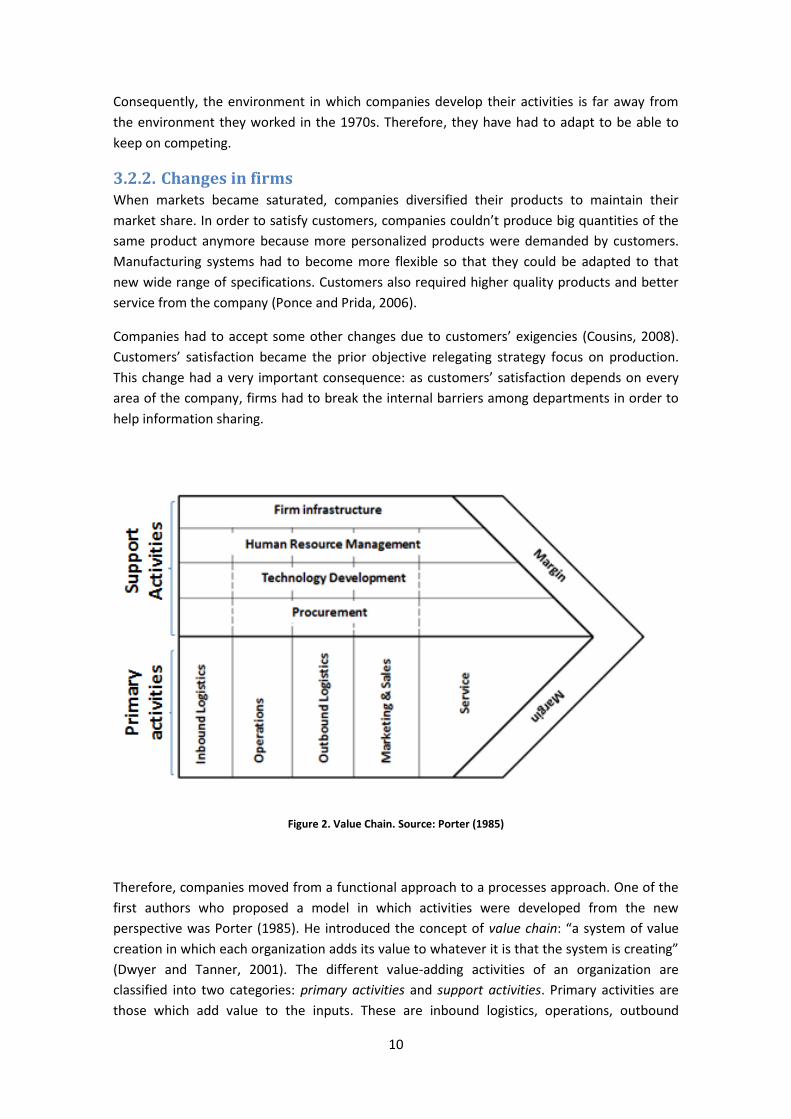
Figure 2. Value Chain. Source: Porter (1985)
Therefore, companies moved from a functional approach to a processes approach. One of the
first authors who proposed a model in which activities were developed from the new
perspective was Porter (1985). He introduced the concept of value chain: “a system of value
creation in which each organization adds its value to whatever it is that the system is creating”
(Dwyer and Tanner, 2001). The different value-adding activities of an organization are
classified into two categories: primary activities and support activities. Primary activities are
those which add value to the inputs. These are inbound logistics, operations, outbound
11
logistics, marketing and sales, and services. Support activities are those which hold primary
activities: firm infrastructure, human resource management, technology and procurement (see
Figure 2). Added value during each stage has to be higher than the cost of doing it so that
there is a margin at the end of the chain which is the benefits for the company.
Also during the 1980’s, the concept of Supply Chain Management emerged. Lambert (2004)
defined it as “the integration of business processes from end user through original suppliers
that provides products, services, and information that add value for customers”. Within each
organization, the supply chain includes all functions involved in receiving and filling a customer
request such as marketing, distribution, new product development or customer service.
Although the concept of supply chain evokes to a product moving from suppliers to
manufacturers to retailers to customers along a chain, there is a constant flow of information,
products and funds between different stages very significant (Cousin, 2008).
These two concepts, value chain and supply chain management, made firms realize of the
importance of the global perspective of the company. They started to remove a perspective in
which each department was just centered on their role and companies began to establish a
global perspective. However, not only did the different functions of a company increase their
relationships but also different companies established closer relationships. The objective of
every supply chain became to maximize the overall value generated not just the firm’s. This
approach is opposed to the previous approach in which every company just tried to maximize
its own benefits.
3.3. Adaptation of the purchasing function Companies had changed due to the modifications in the environment. Consequently, the
purchasing function was also forced to adapt to the new environment in which it had more
importance within the firm.
When companies decided to diversify their products, there was an increase in the variety of
components and products purchased. As technology evolved, purchasing departments had to
pay attention to technical specifications. It also implied life-spam reduction, which made it
necessary to reduce the time that the purchasing function had to deal with suppliers as well as
to focus on different aspects than price such as quality and time delivery so that no delays in
the final product were produced (Ponce and Prida, 2006).
The importance of quality requirements rose for customers and so did for companies. Not only
because quality became essential to get customers’ satisfaction but also because products
were more complex and it absolutely necessary to fix all the components properly. Therefore,
higher quality components were needed so that the development of the final product was
feasible (Ponce and Prida, 2006).
Transport, communications and information exchange improvements allowed companies to
buy all over the world. The purchasing department had much more suppliers to consider as
well as currency exchange rates to analyze. In other words, they had many more aspects to
consider in order to do a good purchase (Chopra and Meindl, 2001).
12
When markets became saturated in the 1970s, a lot of companies found that they had more
capacity to produce than the market could absorb. They also had plants without the adequate
flexibility and with a technology that was becoming obsolete. Besides, they had such a
diversity of business in the same company due to the vertical integration strategy that they
had been following for decades that they were unable to manage them properly. An
outsourcing strategy was followed by a lot of companies, without an adequate criterion in
some cases, which also increased the number of components that companies had to buy
(Ponce and Prida, 2006).
Therefore, purchasing functions needed more skilled people who knew several languages with
higher knowledge of technology and better management skills. Moreover, they were made to
take more responsibility because of the higher importance that the purchased items had, as
well as the larger variety.
Purchasing importance did not only rise for companies in the 1970s but also for academics; the
purchasing function had become strategically important. The purchasing functions could
become a competitive advantage if companies were able to manage them properly. Next
chapter’s focus is on theoretical aspects of purchasing.
13
4. Theoretical Framework
The importance of the purchasing function, its practices and its strategic role within the
company, have been some of the themes in which academics have been working on during the
last decades. However, the objective of this chapter is not to review the literature about the
purchasing function. The aim of this chapter is to establish a theoretical framework for an
empirical research on strategic alignment.
This chapter is divided into three sections. Firstly, the concept of strategic alignment is
discussed. It is the main topic of this master thesis; therefore, its definition, its importance and
its role within the firm are showed. In order to increase the available information about
strategic alignment, one statistical analysis is going to be developed. It is essential for its
implementation to distinguish the different supply procedures followed by purchasing
functions. That is the aim of the following sections. The second section is related to the
Kraljic’s matrix because it classifies different purchased components. Finally, the third section
focuses on strategic outsourcing. The number and importance of purchased goods has arisen.
Therefore, the variety and strength of the relationships that the purchasing function has with
its suppliers has been affected and, as a consequence, it affects strategic alignment.
Before going any further into strategic alignment, it is necessary to define a concept. Up to this
point, why and how the purchasing importance increased and the current importance of the
purchasing function management have been mentioned. Therefore, strategic purchasing
should be defined.
Ellram and Carr (1994) asserted that strategic purchasing exists in a company when purchasing
is viewed as a strategic function, it is included as a key decision maker and participant in the
firm’s strategic planning process. The word strategic has emerged two times in the definition
of strategic purchasing. That drives us immediately to a necessity for a definition of strategic.
Oxford University Dictionary defines it as “relating to the identification of long-term or overall
aims and interests and the means of achieving them” and also as “relating to the gaining of
overall or long-term advantage”. Therefore purchasing is a strategic function when it is
included as a key decision maker and participant in the firm’s process of identifying long-term
or overall aims and interests and the means of achieving them. In other words, strategic
purchasing implies that the purchasing function is considered an important function within the
firm. Besides, it takes part in the identification of the objectives and the problems of the firm
and also in the means to achieve the challenges and overcome the difficulties. It also implies
that competitive advantage can be obtained through the management of this function.
Now, the meaning of strategic purchasing is clear. Then, it is possible to delimit the theoretical
framework of this study to the specific topic of strategic alignment and to the necessary
concepts for the empirical study.
14
4.1. Strategic Alignment The concept of strategic alignment can be reached following several paths. This master thesis
is going to consider two: from the concept of strategy and from its historical evolution. The
concept of strategic alignment is completely linked with management and so it is with
strategy. On the other hand, it has been necessary a chapter to contextualize the evolution of
the purchasing function and the increase in its importance. Academics also worked throughout
the time and the concept of strategic alignment has also evolved during the last decades.
Some of their studies are empirical analyses about the advantages of strategic alignment.
Those are the reason beyond the explanation of that concept through its historical evolution.
4.1.1. Strategic Alignment from the concept of strategy
The path to reach strategic alignment from a managerial point of view starts at the definition
of strategy. A lot of definitions have been proposed and no agreement has been reached
about that concept because academics differ on all the aspects that strategy covers. However,
this master thesis considers that it is “the pattern or plan that integrates an organization’s
major goals, policies, and action sequences into a cohesive whole” (Quinn, 1980). There are
three immediate consequences that emerge from that definition (Cousins, 2008). Firstly,
strategy affects the scale and scope of organization’s activities over the long term. This is a
consequence of the word ‘major’ in the definition. Strategy is not interested in every detail of
the different goals, policies, and action sequences. On the contrary, it seeks the main aspects.
This is a very important point as it establishes limits to the company such as markets
addressed or the activities in which the company should or shouldn’t be involved. Secondly,
strategy is about being responsive to changes in the external environment. This point (which is
called outside-in approach to strategy) suggests that firms have to consider external markets in
order to develop their plans. This is a consequence of the temporal character of strategy
because it is a plan to develop through the time. Therefore, it can’t ignore the changes that
happen in the environment as time goes by. Finally, strategy is about aligning activities with
strategic resources and capabilities. This point of view, which is called inside-out approach to
strategy, suggests that a company can only obtain competitive advantage by an appropriate
use of their resources and capabilities. This is a consequence of the sentence ‘cohesive whole’
in the definition. The integration of major goals, policies, and actions sequences in a plan
makes it necessary to gather the available resources and capabilities in the development of
sequences, guided by common polices, to achieve the established goals. This last point is
aligned with the resource-based view (RBV) of the make-buy decision, one of the most
important decisions in supply management, which is developed later on in this document.
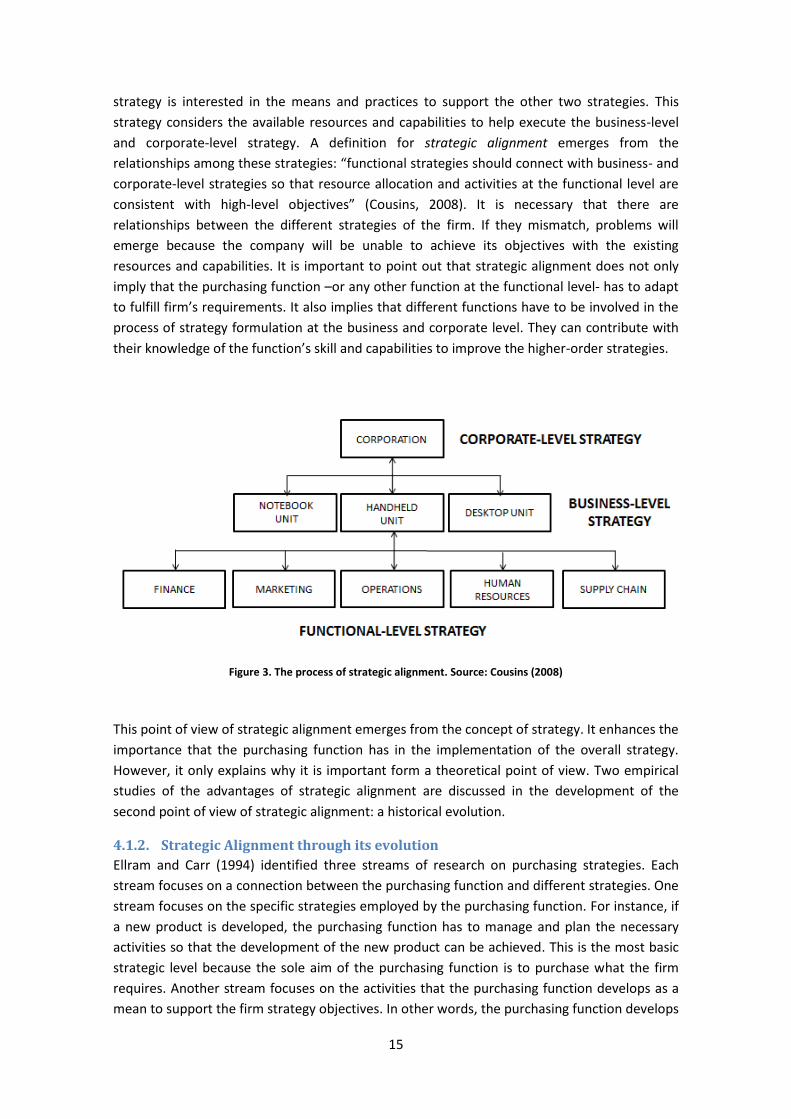
Strategy is usually developed at three levels within the organizations: corporate, business and
functional. Figure 3 shows the different strategy levels of a computer company. Each level
focuses on each one of the previous three consequences of the definition of strategy.
Corporate-level strategy focuses on the business in which the organization is involved. It
includes the organizational boundaries because it establishes the extension of the organization
and the markets in which it competes. Business-level strategy works on the ways to compete
in the chosen markets considering that markets are likely to differ. Therefore, business-level
strategy consider aspects such as the key elements of Porter’s (1980) model: barriers to new
entrants, power of buyers, substitutes, power of suppliers and industry rivalry. Functional-level
15
strategy is interested in the means and practices to support the other two strategies. This
strategy considers the available resources and capabilities to help execute the business-level
and corporate-level strategy. A definition for strategic alignment emerges from the
relationships among these strategies: “functional strategies should connect with business- and
corporate-level strategies so that resource allocation and activities at the functional level are
consistent with high-level objectives” (Cousins, 2008). It is necessary that there are
relationships between the different strategies of the firm. If they mismatch, problems will
emerge because the company will be unable to achieve its objectives with the existing
resources and capabilities. It is important to point out that strategic alignment does not only
imply that the purchasing function –or any other function at the functional level- has to adapt
to fulfill firm’s requirements. It also implies that different functions have to be involved in the
process of strategy formulation at the business and corporate level. They can contribute with
their knowledge of the function’s skill and capabilities to improve the higher-order strategies.
Figure 3. The process of strategic alignment. Source: Cousins (2008)
This point of view of strategic alignment emerges from the concept of strategy. It enhances the
importance that the purchasing function has in the implementation of the overall strategy.
However, it only explains why it is important form a theoretical point of view. Two empirical
studies of the advantages of strategic alignment are discussed in the development of the
second point of view of strategic alignment: a historical evolution.
4.1.2. Strategic Alignment through its evolution
Ellram and Carr (1994) identified three streams of research on purchasing strategies. Each
stream focuses on a connection between the purchasing function and different strategies. One
stream focuses on the specific strategies employed by the purchasing function. For instance, if
a new product is developed, the purchasing function has to manage and plan the necessary
activities so that the development of the new product can be achieved. This is the most basic
strategic level because the sole aim of the purchasing function is to purchase what the firm
requires. Another stream focuses on the activities that the purchasing function develops as a
mean to support the firm strategy objectives. In other words, the purchasing function develops
16
the same strategies than the firm. For instance, if a company is pursuing cost differentiation,
the supply function supports firm strategy buying to the lowest-cost suppliers. The last stream
focuses on the role of the purchasing function and its importance within the firm in order to
take part in the decision-making process of the overall firm. In other words, the purchasing
function drives the strategy of the firm because it can provide ideas and knowledge to the
company. Although each stream is concerned about different aspects of the purchasing role
and strategy, all of them converge on a single issue: the importance of integrating purchasing
into corporate strategy.
Purchasing integration refers to “the integration and alignment of strategic purchasing
practices and goals with that of the firm” (Narasimhan and Das, 2001). What the purchasing
function does (practices) and what it wants to achieve (goals) have to be coherent and related
to the activities and objectives of the firm. This master thesis focuses its attention on the
second half of the definition, in other words, in the integration and alignment of strategic
purchasing goals with that of the firm. The alignment of practices has already been through
deeply research (Carr and Person, 1999; Narasimhan and Das, 2001; Chen et al., 2004) and the
aim of this project is not to analyze it any further. The integration and alignment of any
strategic function with that of the firm is the definition of strategic alignment. When did this
concept emerge? Skinner (1969) is usually mentioned as a historical reference (Joshi et al.,
2002; González-Benito, 2007; Baier et al., 2008). He asserted that, “a competitive strategy at a
given time, places particular demands on its manufacturing function, and, conversely, that the
business unit is manufacturing posture and operations should be specifically designed to fulfill
the task demanded by strategic plans”. He exposed that as soon as a firm places a strategy, it is
establishing some requirements on its manufacturing function (top-down relationship). At the
same time, the manufacturing function should be designed to be able to provide the firm with
the necessary outcomes (bottom-up relationship).
Later on, other authors emphasized on this idea. Hayes and Schmenner (1978) asserted that
“manufacturing functions best when its facilities, technology and policies are consistent with
recognized priorities of corporate strategy”. It is important to note that they were addressing
their studies to the concept of strategic alignment between the manufacturing function and
the firm. The aim of this master thesis is to link the purchasing function strategy with the
overall firm strategy. Therefore, when it is not explicitly mentioned, the concept of strategic
alignment will be referred to the purchasing function in order to avoid becoming repetitive.
However, there was still a lack of studies on this theme.
Cleveland et al. developed the Theory of Production Competence in 1989. They established in
their study that the competitive potential of linking manufacturing strategy and policy with
business strategy represents the foundation of production competence, “the capability that
enables manufactures to pursue a specific business strategy” (González-Benito, 2007). This
concept refers to the alignment between manufacturing objectives and manufacturing
performance. This link is restricted to the manufacturing function because it assesses the
coherence between the capabilities and the objectives of the manufacturing function.
However, this theory is based on the premise that good fit –kind of alignment- exists between
business strategy and strategic objectives of the manufacturing function. This theory was
refined by Vickery in 1991. He added a graphical scheme (see Figure 4) to the theory of
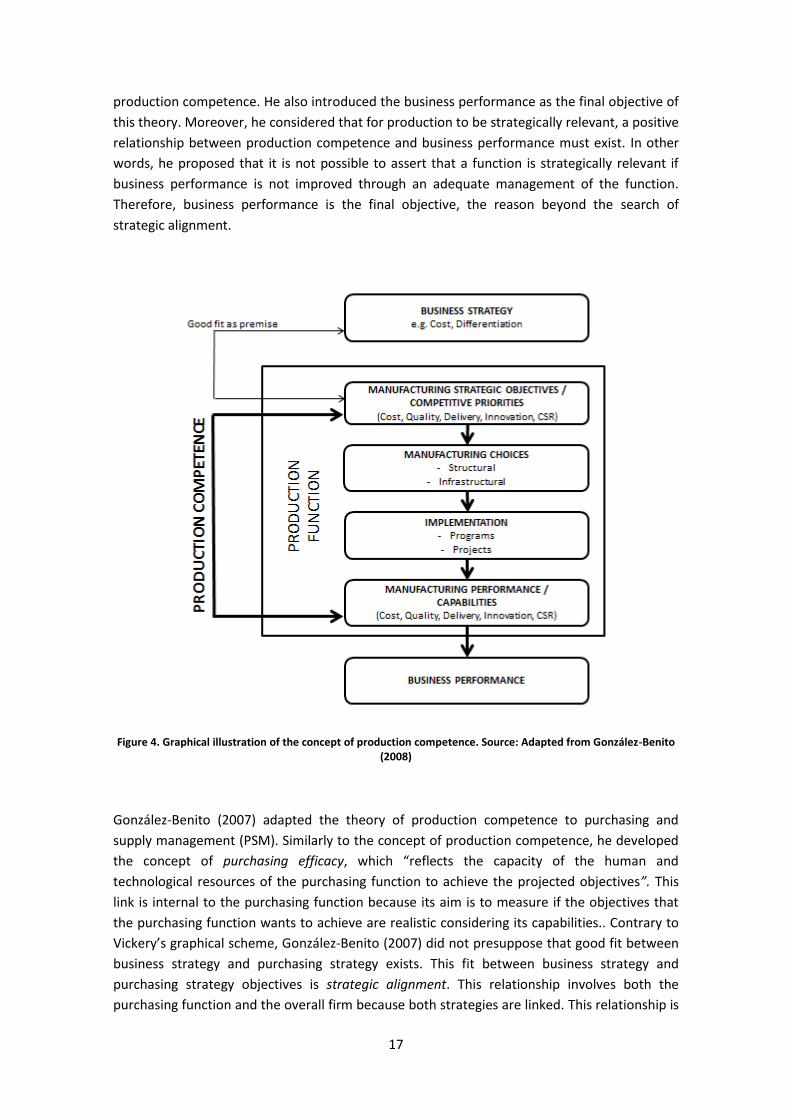
17
production competence. He also introduced the business performance as the final objective of
this theory. Moreover, he considered that for production to be strategically relevant, a positive
relationship between production competence and business performance must exist. In other
words, he proposed that it is not possible to assert that a function is strategically relevant if
business performance is not improved through an adequate management of the function.
Therefore, business performance is the final objective, the reason beyond the search of
strategic alignment.
Figure 4. Graphical illustration of the concept of production competence. Source: Adapted from González-Benito (2008)
González-Benito (2007) adapted the theory of production competence to purchasing and
supply management (PSM). Similarly to the concept of production competence, he developed
the concept of purchasing efficacy, which “reflects the capacity of the human and
technological resources of the purchasing function to achieve the projected objectives”. This
link is internal to the purchasing function because its aim is to measure if the objectives that
the purchasing function wants to achieve are realistic considering its capabilities.. Contrary to
Vickery’s graphical scheme, González-Benito (2007) did not presuppose that good fit between
business strategy and purchasing strategy exists. This fit between business strategy and
purchasing strategy objectives is strategic alignment. This relationship involves both the
purchasing function and the overall firm because both strategies are linked. This relationship is
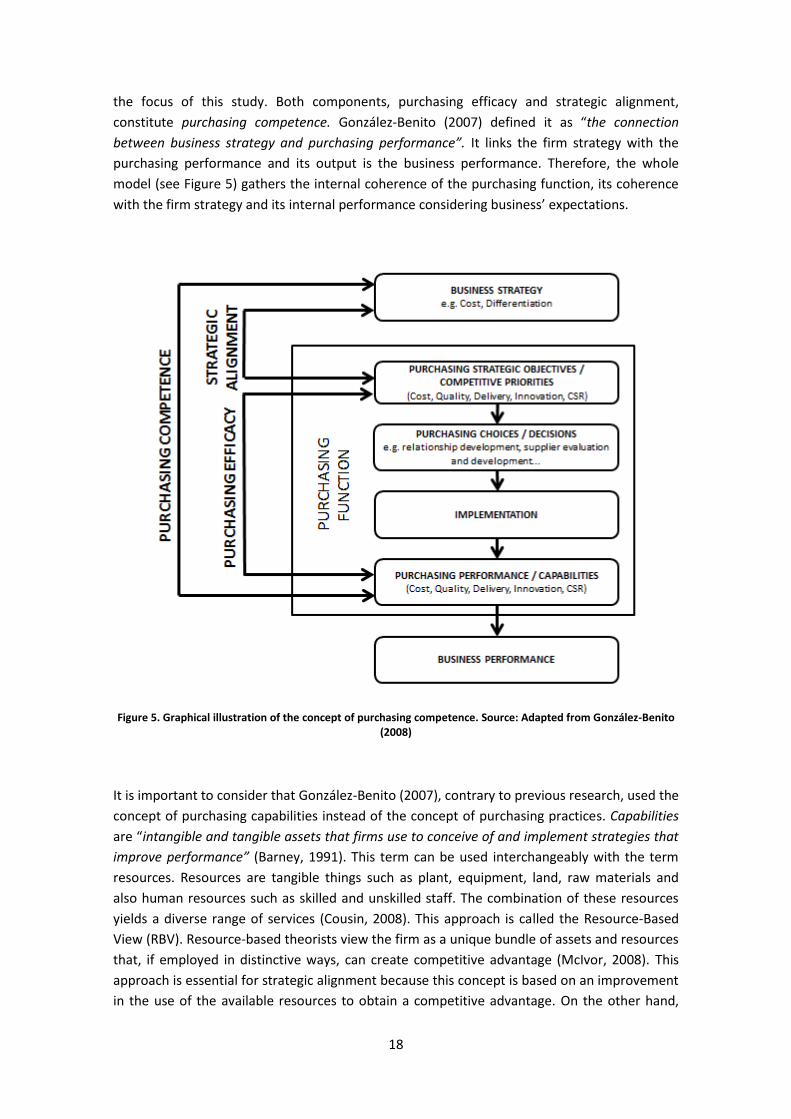
18
the focus of this study. Both components, purchasing efficacy and strategic alignment,
constitute purchasing competence. González-Benito (2007) defined it as “the connection
between business strategy and purchasing performance”. It links the firm strategy with the
purchasing performance and its output is the business performance. Therefore, the whole
model (see Figure 5) gathers the internal coherence of the purchasing function, its coherence
with the firm strategy and its internal performance considering business’ expectations.
Figure 5. Graphical illustration of the concept of purchasing competence. Source: Adapted from González-Benito (2008)
It is important to consider that González-Benito (2007), contrary to previous research, used the
concept of purchasing capabilities instead of the concept of purchasing practices. Capabilities
are “intangible and tangible assets that firms use to conceive of and implement strategies that
improve performance” (Barney, 1991). This term can be used interchangeably with the term
resources. Resources are tangible things such as plant, equipment, land, raw materials and
also human resources such as skilled and unskilled staff. The combination of these resources
yields a diverse range of services (Cousin, 2008). This approach is called the Resource-Based
View (RBV). Resource-based theorists view the firm as a unique bundle of assets and resources
that, if employed in distinctive ways, can create competitive advantage (McIvor, 2008). This
approach is essential for strategic alignment because this concept is based on an improvement
in the use of the available resources to obtain a competitive advantage. On the other hand,
19
there is another approach that focuses on practices: Transactions Cost Economics (TCE). This
approach considers activities such as the search for suitable suppliers, the selection among a
shortlist, to ensure that the supplier’s goods are delivered on time and to the correct
specification (Cousin, 2008). González-Benito (2007) proposed that the ultimate purpose of
any purchasing practice is to achieve certain capabilities which must be aligned with business
strategy regardless how they have been achieved. Therefore, he supports RBV. These
capabilities, as it will be explained later on the document, are essential to measure strategic
alignment.
As well as the development of a purchasing competence graphical scheme, González-Benito
(2007) proved that the degree of strategic integration of the purchasing function positively
moderates the relationship between purchasing efficacy and business performance. He
considered in his model that “the strategic integration of the purchasing function can be
viewed as a good indicator of strategic alignment”.
Baier et al. (2008) also developed a model of the alignment-performance link in PSM. Like
González-Benito’s (2007) model, they based their model on Cleveland et al. (1989) and Vickery
(1991) theory of production competence. Opposed to González-Benito’s (2007) model, who
didn’t distinguish among business strategies, they distinguished two different business
strategies using Porter’s (1980) generic strategies of cost leadership and differentiation. They
followed prior research (Narasimhan and Das, 2001; Joshi et al., 2002; Chen et al., 2004)
employing purchasing practices to conceptualize the strengths and weaknesses of the
purchasing function instead of purchasing capabilities.
Both González-Benito (2007) and Baier et al. (2008) proved that the strategic alignment
between the purchasing strategy and the firm strategy is a mean to raise business
performance. Consequently, both studies constitute additional proof of the strategic alignment
importance as they empirically analyzed the contribution of this relationship to business
performance.
Moreover, in order to extract greater competitive advantage from purchasing, González-
Benito (2007) considered that top managers “should attempt to integrate the purchasing
function into the strategic planning process of the overall business to ensure that its functional
objectives align with the business strategy”. In other words, he proposed that purchasing
function’s active participation in the firm strategy can ease strategic alignment. Watts et al.
(1992) had already emphasized that the purchasing function had to be a full participant in
business strategy formulation and implementation to achieve congruence between purchasing
objectives and business goals. These activities, as a mean to achieve strategic alignment, are
also considered later on the master thesis.
4.2. The Kraljic approach González-Benito’s (2007) adaption of the theory of production competence to purchasing
represents a very significant development in the linking of strategic alignment and business
performance both from a theoretical and empirical point of view. However, among other
limitations, it presents a very considerable weakness: it is implicit to the model that
20
homogeneous competitive priorities exist for every good and service bought by the purchasing
department. In other words, that study presupposes that the purchasing function considers
that every purchased product has the same quality, cost, delivery and flexibility objectives.
Baier et al. (2008), which is the other empirical study on the theme, only differentiated
between the two Porter’s (1980) generic strategies: cost leadership and differentiation. These
two strategies are business strategies, not purchasing strategies. They assumed that the
purchasing function has to adapt to one of these two strategies depending on the firm
strategy. The main consequence of having a purchasing function adapted to Porter’s (1980)
generic strategies is just on the management of the relationship between buyers and suppliers,
not in the purchased goods.
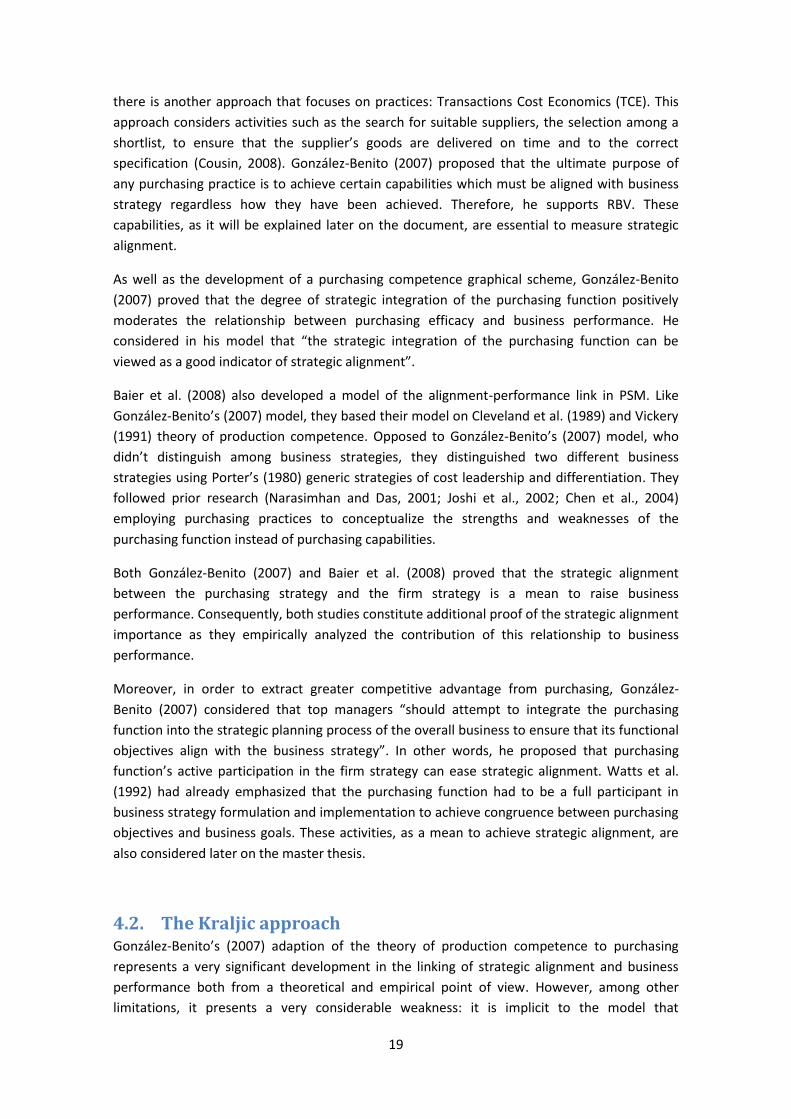
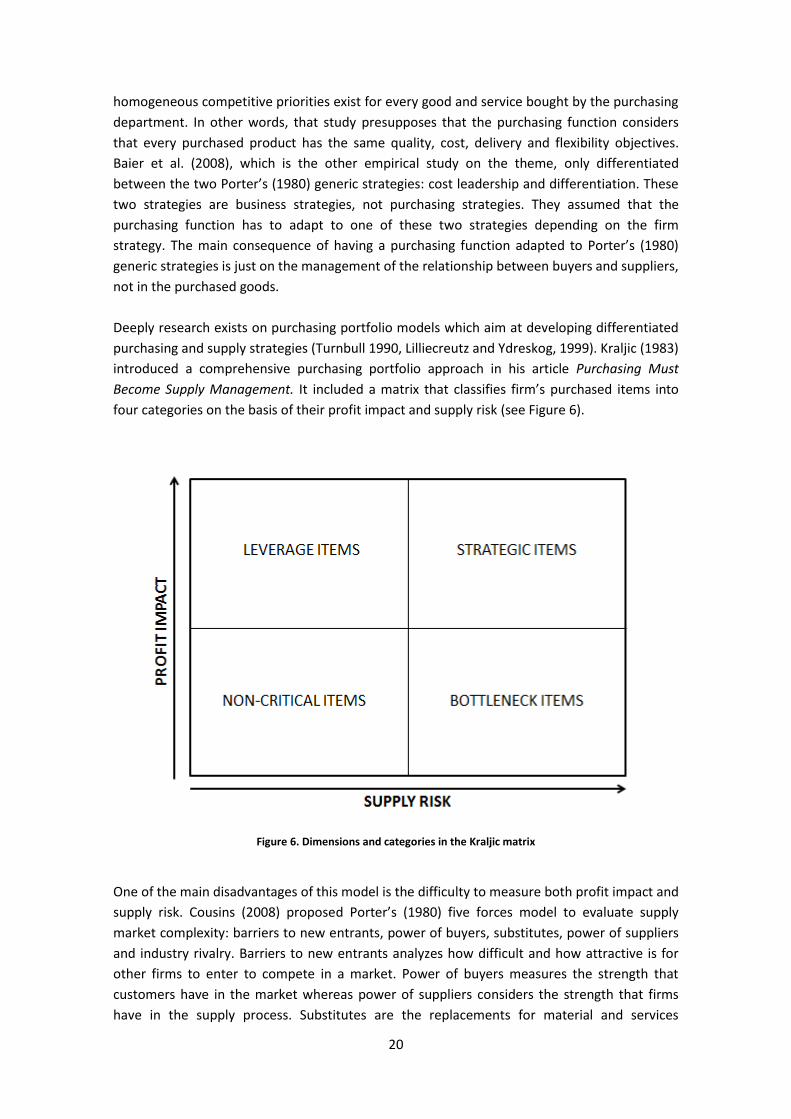
Deeply research exists on purchasing portfolio models which aim at developing differentiated
purchasing and supply strategies (Turnbull 1990, Lilliecreutz and Ydreskog, 1999). Kraljic (1983)
introduced a comprehensive purchasing portfolio approach in his article Purchasing Must
Become Supply Management. It included a matrix that classifies firm’s purchased items into
four categories on the basis of their profit impact and supply risk (see Figure 6).
Figure 6. Dimensions and categories in the Kraljic matrix
One of the main disadvantages of this model is the difficulty to measure both profit impact and
supply risk. Cousins (2008) proposed Porter’s (1980) five forces model to evaluate supply
market complexity: barriers to new entrants, power of buyers, substitutes, power of suppliers
and industry rivalry. Barriers to new entrants analyzes how difficult and how attractive is for
other firms to enter to compete in a market. Power of buyers measures the strength that
customers have in the market whereas power of suppliers considers the strength that firms
have in the supply process. Substitutes are the replacements for material and services
21
currently provided and industry rivalry analyzes the intensity of competition among current
participants. The second variable of Kraljic’s matrix, impact on business, is more difficult to
measure because of the confrontation between the terms value and cost. A product can have
a very high value (it is impossible to sell a product without that component) which is very
cheap. Most consultancy firms, when conducting the initial positioning of products and
services, would tent to use the cost category first and then sort by relative value and risk
(Cousins, 2008). Although the measure of the two variables of Kraljic’s matrix is quite difficult,
its approach has entered many textbooks on purchasing and supply management in the course
of time. It has also become the main strategic positioning tool for thinking about supply
management decisions for both purchasing departments and consultancy firms. Therefore,
this master thesis is going to consider Kraljic’s matrix to distinguish the different sourcing
strategies that a company can use at the same time depending on what category their
purchased products belong.
Each one of the four categories of Kraljic’s matrix includes items with different characteristics,
different competitiveness of the supply marketplace, different sourcing strategies, different
business impact, etc. The following sections describe each one of the quadrants of Kraljic’s
matrix.
4.2.1. Non-critical items Low value or cost and low technical or supply risk items belong to this category. They don’t
have any significant impact on business performance as they can be found to very competitive
marketplaces. Multiple sourcing is the recommended supply structure: many suppliers
guaranteeing a market price for the good or service. Cleaning materials or stationery are non-
critical items. Purchasing’s objective should be to get non-critical items from the most efficient
supplier: to pay the most competitive price for the product maintaining delivery and quality
standards. Moreover, transaction costs should be minimized as much as possible. It can be
done by buying several non-critical items from the same supplier or delegating the purchase to
the product user (Cousins, 2008).
4.2.2. Bottleneck items This category consists of those items that can seriously affect the delivery of the buyer firm’s
product but don’t have an important impact on business performance. They are very specific
goods which are very difficult to find in the supply market so that supply risk is high. However,
it cost is very low compared to total purchases. Computer chips, catalyst products for the
chemical industry and pigments for the paint industry usually belong to this category. PSM
literature recommends maintaining supply continuity for bottleneck items with single sourcing
(only one source of supply for a particular good or service) as the supply structure (Cousins,
2008). The objective is not to have supply risk increased due to suppliers’ permanent change
and to keep administrative costs low as items’ value is also low.
4.2.3. Leverage items Those products with high impact on business performance and low supply risk belong to this
category. They are non-differentiated items such as non-specific raw materials, foam for car
seats at automobile assemblers, packaging material, etc. Although their cost is highly
significant, they can be bought in competitive markets. As neither price nor product is
22
differentiated, suppliers are quite similar. Therefore, PSM literature recommends
concentrating purchases in few suppliers, or even one, so that economies of scale can be
achieved (Cousins, 2008). The objective is to get the best possible deal as the buyer power is
high and the supplier power is low.
4.2.4. Strategic items High business profit and high supply risk are the characteristics of strategic items. Engines and
gearboxes for car manufacturers, turbines for the chemical industry and modular assembly
products belong to this category (Cousins, 2008). These products are very complex from a
technical point of view so large investments are required on them. There are only few
available suppliers, sometimes only one, and the cost of changing the supplier is very high.
Therefore, strategic items must be considered from a long-term perspective. Cooperation
between the firm and a single supplier, highly involved in the process, is a recommended
sourcing strategy (Ponce and Prida, 2006). Moreover, due to the complexity of the purchase, a
centralized process is recommended.
4.3. Strategic outsourcing and relationship management The previous section focused on different strategies of the purchase of goods. The kind of
sourcing structure is within Kraljic’s matrix. It also determines the most important
characteristic that the purchasing function should search: delivery, cost, quality, etc. However,
Kraljic’s matrix doesn’t specify the content of the relationship. Neither the shared activities nor
the strength of the relationship is mentioned, except for slight comments for the strategic
quadrant. However, that relationship has content. The content of that relationship is
important to strategic alignment because it is the link between the firm and its suppliers. The
strength distribution between the two sides of the relationship is also important because it
determines the gains that the firm can expect. The increase in the importance of the
relationship between firms and their suppliers emerged when firms started to outsource the
production of some components. Therefore, this theme is going to be addressed from that
perspective.
4.3.1. Strategic outsourcing
As it has already been explained in the previous chapter, companies, which had been following
vertical integration strategies, began to follow outsourcing strategies when markets became
saturated. By then, some companies had more capacity to produce than the market could
absorb, they had such a diversity of businesses in the same company that they were unable to
manage them properly and technology was improving so fast that factories were becoming
obsolete in a few years. Therefore, the aim to outsource considering the previous facts was to
reduce costs. However, outsourcing can also improve performance when considered from a
strategic point of view (Holcomb and Hitt, 2007). Several authors have analyzed this strategic
supply, which has been named as strategic outsourcing (Hamel et al., 1990; Venkatesan, 1992;
Quinn and Hilmer, 1994). The aim of strategic outsourcing is to obtain from an external
supplier all the components whose purchase provides more advantages than its internal
production. They assert that companies should use their resources to develop their core
competencies, which are “specific factors that a business sees as being central to the way it, or
its employees, works” (Prahalad and Hamel, 1990). Core competencies have three main
23
characteristics: they can’t be easy to imitate, they can’t be leveraged widely to many products
and markets, and they must contribute to the end consumer's experienced benefits. In other
words, the core competencies of a company are some very specific characteristics of the firm
that make it unique and valuable for customers. On the other hand, academics encouraged
companies to outsource those activities which are not interesting from a strategic point of
view because companies are unable to develop them better than the companies they are
competing with. By the purchase of these components, they can also incorporate them to their
product while they employ their sources in activities in which they can obtain a competitive
advantage. The core competency concept is an evolution from one of the two theoretical
alternatives to understand strategic outsourcing already mentioned: the resource-based view
(RBV) which has already been described.
Therefore, companies are outsourcing very important components for their value chain. They
can’t obtain these essential components buying them directly in a competitive market because
their purchase is a critical activity. This is one of the reasons already mentioned to explain the
increase in purchasing importance. Academics have recommended a cooperative relationship
with suppliers to the purchase of essential items: partnership (Lamming, 1993; Ellram and
Billington, 2001). Some of the characteristics of this kind of relationship are the low number of
suppliers, the long-term relationship, the permanent information exchange and the
continuous search for agreements between the two parts of the relationship (Landeros and
Monckza, 1989). Relationship management is developed further in the next section.
4.3.2. Relationship management
Cousin (2005) developed the Strategic Focused Outcomes Model (SFOM) to determine the
relationship strategy that a company should establish with its suppliers. It is a four-quadrant
matrix obtained from two variables: business outcomes and strategic focus. The variable
business outcomes distinguishes between short-term and long-term relationships whereas the
variable strategic focus distinguishes between the two generic business strategies (Porter
1980) of cost and differentiation (see Figure 7). It is important to notice that the two generic
strategies are business strategies, not strategies followed by the purchasing department. The
reason beyond this fact is that the relationship is established between the overall firm and the
supplier although the department which establishes the contacts is purchasing.
Market and operational collaboration quadrants gather relationships between firms and
suppliers based on a cost-focused approach. Both of them consist of actions such as sharing
operations planning information, developing and sharing demand forecasts, linking order
management systems and joint capacity planning management systems to align operational
flows (Cousins, 2008). As market collaboration relationship is based on a long-term
perspective, more collaborative activities such as shared merchandising, co-branding, joint
selling and management of distributions channels are included. Firms with a ‘differentiation
focus’ tend to not have short-term relationships because this kind of relationship make it
difficult to link customers’ requirements with suppliers, which is essential in the differentiation
strategy. This type of collaboration focuses on sharing production-engineering resources, and
developing joint capital investment and expenditure plans (Cousins, 2008). Not only does this
model emphasize the appropriate allocation of resources, aligned with the resources-based
view perspective just described, but it also drives us back to the concept of alignment. Those
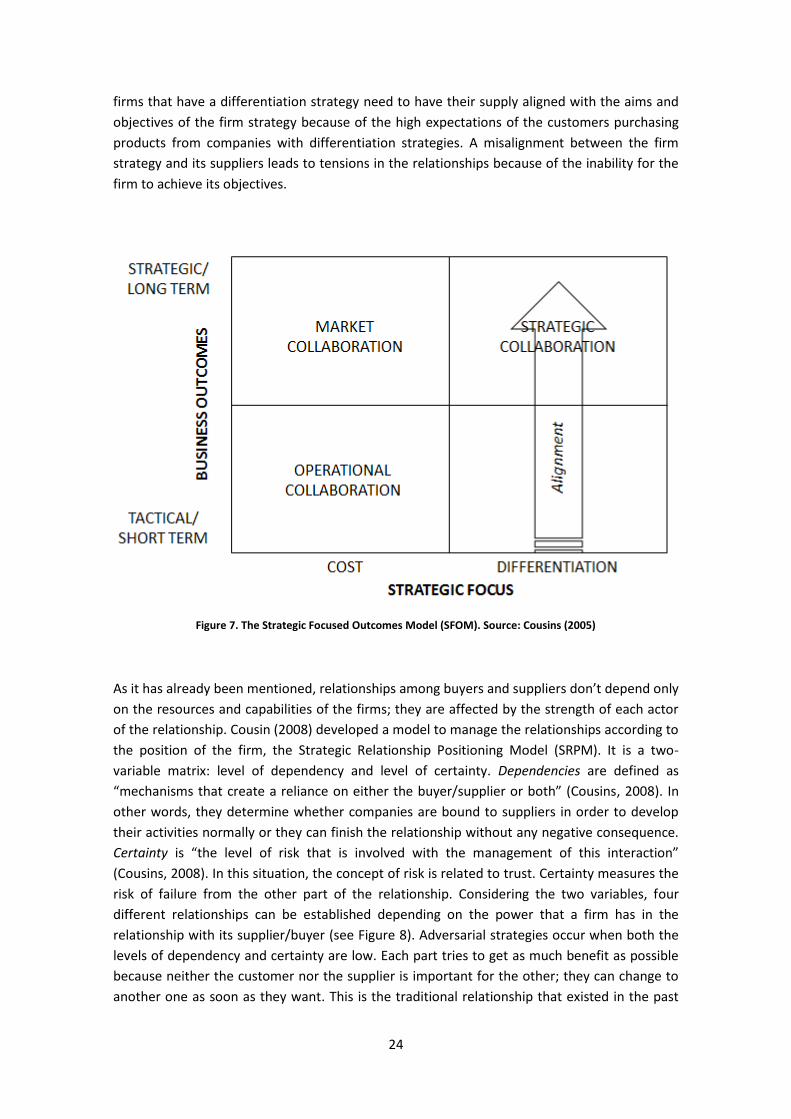
24
firms that have a differentiation strategy need to have their supply aligned with the aims and
objectives of the firm strategy because of the high expectations of the customers purchasing
products from companies with differentiation strategies. A misalignment between the firm
strategy and its suppliers leads to tensions in the relationships because of the inability for the
firm to achieve its objectives.
Figure 7. The Strategic Focused Outcomes Model (SFOM). Source: Cousins (2005)
As it has already been mentioned, relationships among buyers and suppliers don’t depend only
on the resources and capabilities of the firms; they are affected by the strength of each actor
of the relationship. Cousin (2008) developed a model to manage the relationships according to
the position of the firm, the Strategic Relationship Positioning Model (SRPM). It is a two-
variable matrix: level of dependency and level of certainty. Dependencies are defined as
“mechanisms that create a reliance on either the buyer/supplier or both” (Cousins, 2008). In
other words, they determine whether companies are bound to suppliers in order to develop
their activities normally or they can finish the relationship without any negative consequence.
Certainty is “the level of risk that is involved with the management of this interaction”
(Cousins, 2008). In this situation, the concept of risk is related to trust. Certainty measures the
risk of failure from the other part of the relationship. Considering the two variables, four
different relationships can be established depending on the power that a firm has in the
relationship with its supplier/buyer (see Figure 8). Adversarial strategies occur when both the
levels of dependency and certainty are low. Each part tries to get as much benefit as possible
because neither the customer nor the supplier is important for the other; they can change to
another one as soon as they want. This is the traditional relationship that existed in the past
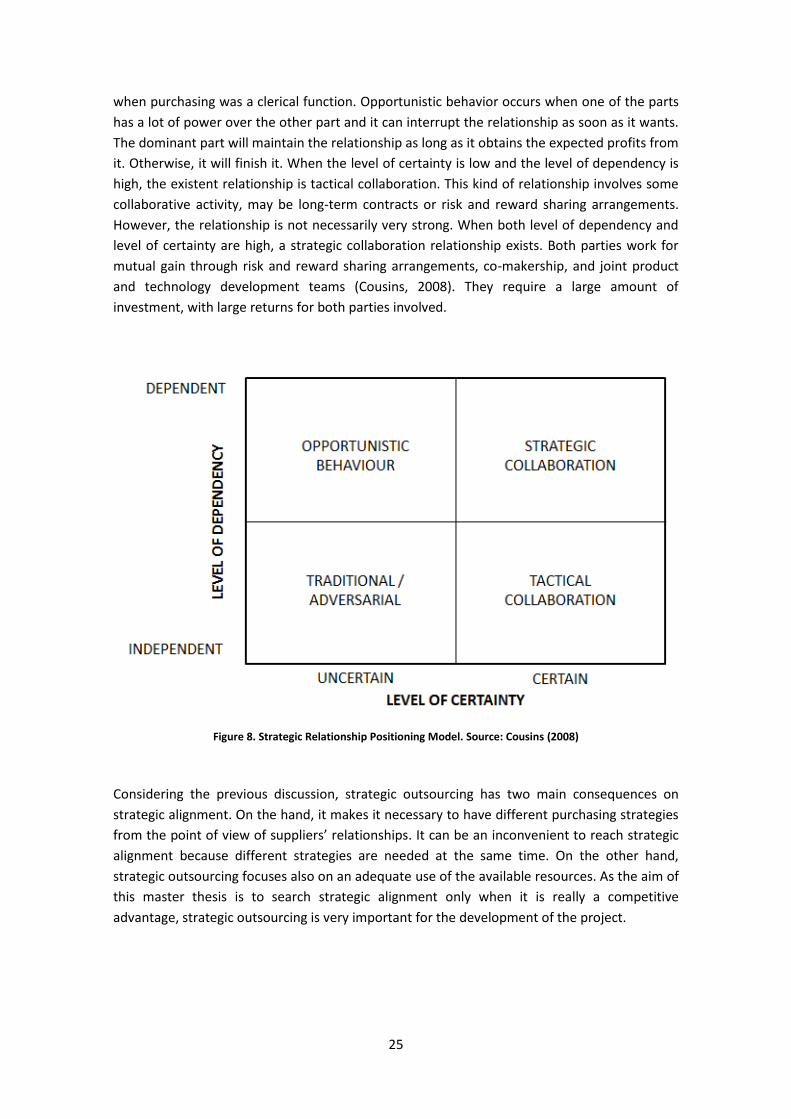
25
when purchasing was a clerical function. Opportunistic behavior occurs when one of the parts
has a lot of power over the other part and it can interrupt the relationship as soon as it wants.
The dominant part will maintain the relationship as long as it obtains the expected profits from
it. Otherwise, it will finish it. When the level of certainty is low and the level of dependency is
high, the existent relationship is tactical collaboration. This kind of relationship involves some
collaborative activity, may be long-term contracts or risk and reward sharing arrangements.
However, the relationship is not necessarily very strong. When both level of dependency and
level of certainty are high, a strategic collaboration relationship exists. Both parties work for
mutual gain through risk and reward sharing arrangements, co-makership, and joint product
and technology development teams (Cousins, 2008). They require a large amount of
investment, with large returns for both parties involved.
Figure 8. Strategic Relationship Positioning Model. Source: Cousins (2008)
Considering the previous discussion, strategic outsourcing has two main consequences on
strategic alignment. On the hand, it makes it necessary to have different purchasing strategies
from the point of view of suppliers’ relationships. It can be an inconvenient to reach strategic
alignment because different strategies are needed at the same time. On the other hand,
strategic outsourcing focuses also on an adequate use of the available resources. As the aim of
this master thesis is to search strategic alignment only when it is really a competitive
advantage, strategic outsourcing is very important for the development of the project.
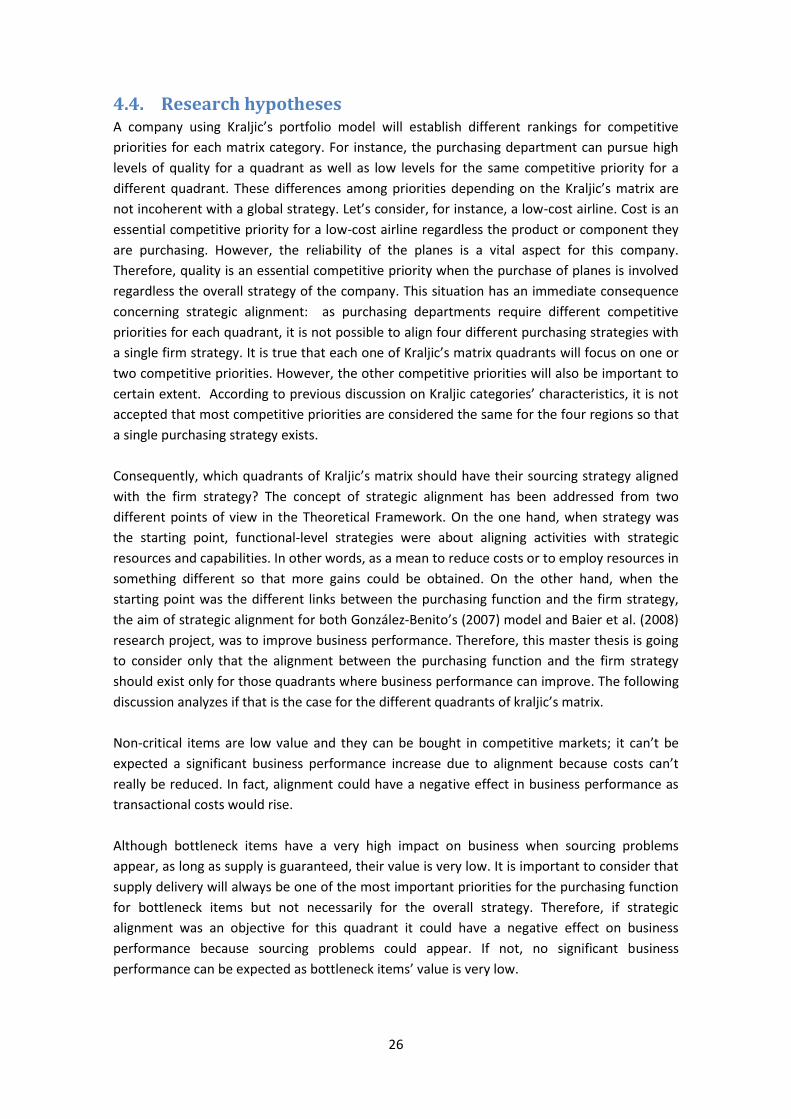
26
4.4. Research hypotheses A company using Kraljic’s portfolio model will establish different rankings for competitive
priorities for each matrix category. For instance, the purchasing department can pursue high
levels of quality for a quadrant as well as low levels for the same competitive priority for a
different quadrant. These differences among priorities depending on the Kraljic’s matrix are
not incoherent with a global strategy. Let’s consider, for instance, a low-cost airline. Cost is an
essential competitive priority for a low-cost airline regardless the product or component they
are purchasing. However, the reliability of the planes is a vital aspect for this company.
Therefore, quality is an essential competitive priority when the purchase of planes is involved
regardless the overall strategy of the company. This situation has an immediate consequence
concerning strategic alignment: as purchasing departments require different competitive
priorities for each quadrant, it is not possible to align four different purchasing strategies with
a single firm strategy. It is true that each one of Kraljic’s matrix quadrants will focus on one or
two competitive priorities. However, the other competitive priorities will also be important to
certain extent. According to previous discussion on Kraljic categories’ characteristics, it is not
accepted that most competitive priorities are considered the same for the four regions so that
a single purchasing strategy exists.
Consequently, which quadrants of Kraljic’s matrix should have their sourcing strategy aligned
with the firm strategy? The concept of strategic alignment has been addressed from two
different points of view in the Theoretical Framework. On the one hand, when strategy was
the starting point, functional-level strategies were about aligning activities with strategic
resources and capabilities. In other words, as a mean to reduce costs or to employ resources in
something different so that more gains could be obtained. On the other hand, when the
starting point was the different links between the purchasing function and the firm strategy,
the aim of strategic alignment for both González-Benito’s (2007) model and Baier et al. (2008)
research project, was to improve business performance. Therefore, this master thesis is going
to consider only that the alignment between the purchasing function and the firm strategy
should exist only for those quadrants where business performance can improve. The following
discussion analyzes if that is the case for the different quadrants of kraljic’s matrix.
Non-critical items are low value and they can be bought in competitive markets; it can’t be
expected a significant business performance increase due to alignment because costs can’t
really be reduced. In fact, alignment could have a negative effect in business performance as
transactional costs would rise.
Although bottleneck items have a very high impact on business when sourcing problems
appear, as long as supply is guaranteed, their value is very low. It is important to consider that
supply delivery will always be one of the most important priorities for the purchasing function
for bottleneck items but not necessarily for the overall strategy. Therefore, if strategic
alignment was an objective for this quadrant it could have a negative effect on business
performance because sourcing problems could appear. If not, no significant business
performance can be expected as bottleneck items’ value is very low.
27
Leverage items represent a high percentage of total sales so a business performance
improvement could be expected if sourcing was improved. However, leverage items belong to
very competitive marketplaces in which suppliers offer very similar products at very similar
prices. Therefore, a change in the supplier as a consequence of the strategic alignment can’t
be expected to improve significantly business performance.
Strategic items have both high economic impact and high supply risk. Moreover, decisions
regarding strategic items have long-term consequences because large amounts of investments
are required. If these items could were purchased strategically so that purchasing
requirements were the same as firm’s requirements, it looks logical that business performance
improvement would be achieved.
Figure 9. Alignment of strategies and relationships
Figures 5, 6 and 7 can be gathered in a single model that shows the overall sourcing process
(see Figure 9). This chapter has been divided into three sections. The first section which is
about strategic alignment highlights the importance of the link between the purchasing
function and the firm strategy in order to raise business performance. The second section
helps classify the different purchased items through Kraljic’s matrix. As it has just been
discussed, from a theoretical point of view strategic alignment only looks logical for strategic
items. The sourcing strategy recommended for those items is cooperation with the supplier.
That is linked with the strategic collaboration strategy of the Strategic Focused Outcome
Model (SFOM). Purchased components belonging to strategic category are very important and
very specific. They have to be aligned with the customer requirements because they are
essential for the final product and they require the exchange of technology and information
between the company and its supplier. Therefore, there is a link between strategic items in
Kraljic’s matrix and strategic collaboration relationship for the purchase of these items, in the
28
SFOM. Moreover, this relationship should take place in a high level of certainty environment
because of the large amount of information exchanged and with a high dependency between
the company and its supplier due to the large importance of the purchase. This kind of
relationship can be classified as strategic collaboration in the Strategic Relationship Positioning
Model (SRPM).
Considering the previous discussion, the following reasoning arises. Purchasing is a strategic
function. It is possible to obtain a competitive advantage if properly managed. Strategic
alignment can be a mean to gain that competitive advantage. That only looks feasible for
strategic items of Kraljic’s matrix. The importance of those components is coherent with the
strength of the relationships between buyers and suppliers: collaboration relationship. That
relationship is based in the alignment of firms and suppliers objectives as a mean to increase
business performance. Therefore, the following hypothesis is proposed:
Hypothesis 1. Strategic alignment between purchasing and firm strategies affects positively
business performance only for the purchase of strategic items.
This hypothesis, apparently supported from a theoretical point of view, is also supported by
research. Baier et al. (2008), in their study about strategic alignment and purchasing efficacy,
found out that if their study had not distinguished between the two generic business strategies
of cost leadership and differentiation, it would have reported no significant association
between strategic alignment and financial performance, thus making a type II error by not
detecting the "true" underlying relationship.
A question emerges at this point: is strategic alignment a consequence of the active
participation of the purchasing function in the overall firm strategy? González-Benito (2007)
argues that “strategic alignment reflects the extent to which the purchasing strategic
objectives considered important by the purchasing manager are actually those that fit with the
business strategy. Such fit is more likely in companies whose purchasing function is
strategically integrated, i.e., in companies that recognize the strategic importance of the
purchasing function and integrate it into the business strategic process”. In other words, he
asserts that the more the purchasing function is integrated within the firm the higher strategic
alignment. That happens because strategic alignment is a reflection of purchasing integration.
Therefore, González-Benito (2008) considers that strategic alignment is just a natural
consequence of purchasing integration. On the other hand, the definition that this master
thesis uses for purchasing integration is Narasimhan and Das’ (2001): “purchasing integration
refers to the integration and alignment of strategic purchasing practices and goals with that of
the firm”. They define purchasing practices as “activities that relate to the purchasing-supply
base interface”. On the one hand, purchasing goals have to be aligned with those of the firm.
On the other hand, certain key categories of purchasing practices such as supply base
leveraging, buyer-supplier relationship development and supplier performance evaluation
have to be developed to achieve purchasing integration (Monczka and Trent, 1995). Therefore,
purchasing’s involvement in a company’s strategic decision-making process might be a primary
requirement for achieving purchasing integration because it can help supply base leveraging,
buyer-supplier relationship development, etc. However, this master thesis, in opposition to
29
González-Benito (2008) doesn’t accept purchasing integration as a premise for strategic
alignment. Therefore, this study does not take for granted that purchasing involvement implies
strategic alignment. That is something that has to be proven.
It is also important to take into account that Hypothesis 1 considers strategic alignment
between the purchasing strategy and the firm strategy as a mean to improve business
performance. In other words, it is a mean to exploit the strategic character of the purchasing
function. Consequently, strategic alignment has also been considered an objective and how to
achieve it has been a field of study. According to the previous discussion, those companies that
have a purchasing function participating actively in the overall firm strategy are supposed to
achieve strategic alignment more easily.
Several practices have already been exposed as a mean to achieve strategic alignment:
purchasing representation in top-level management; business strategy properly
communicated to the purchasing professionals; purchasing encouraged to formalize its own
long-term plan to develop and support business strategy, purchasing given the same
organizational status as other functional areas, measurement and reward system based on
contributions to competitive goals (Ellram and Carr, 1994; Gadde and Hakansson, 1994;
Narasimhan and Das, 2001). It looks obvious that the more the purchasing function can
participate in the overall business strategy, the more opinions it can provide to decision-
making process and the more coherence between its strategy and firm strategy can exist.
Kraljic’s matrix classifies purchasing strategies according to profit impact and supply risk. Firm’s
attitude towards the purchasing department and purchasing involvement in overall firm
strategy are not specifically related to any of the two variables that constitute Kraljic’s matrix.
Therefore, it looks unlikely that a distinction according to Kraljic’s matrix can influence
purchasing function involvement. Considering this, a second hypothesis is proposed:
Hypothesis 2. Purchasing active participation in overall firm strategy affects positively
strategic alignment.
However, if it is possible to distinguish when strategic alignment affects positively business
performance, and the sole objective of promoting purchasing active participation is to achieve
strategic alignment, then, purchasing implication in overall firm strategy can be restricted to
those aspects in which its participation can improve business performance. Otherwise,
purchasing active participation could be considered resource waste and purchasing integration
would not be a strategic advantage at all.
On the one hand, it is not possible to establish a partial increased purchasing role to any
extent; purchasing function can have the same organizational status or not have it at all. On
the other hand, long-term plan to develop and support business strategy can be done for
those Kraljic’s categories with long-term sourcing strategies.
Therefore, practical information can be obtained from the analysis to test Hypothesis 2 if
Kraljic’s quadrants are considered because it can be linked to Hypothesis 1.
30
5. Empirical Study
5.1. Data To examine the hypotheses, primary data was collected from the IPS data base. 429
manufacturing companies from 9 European countries (Finland, France, Germany, Ireland, Italy,
Netherlands, Spain, Sweden and United Kingdom), USA and Canada constitute the data
sample. Data collection consisted of an Internet survey to which purchasing managers could
access directly through the website of IPS. As long as respondents were related to the
purchasing function, no initial exclusion existed.
IPS consists of five blocks of questions: the first one is about general characteristics of the
company and the respondent, such as firm size and respondent role in the company. The
second part is interested in finding information about the purchasing function characteristics,
such as different programs developed by this department or the status of this function
compared to other functions. Respondents are asked to choose a single group of purchased
items that are similar in the third part of the questionnaire and answer questions about their
characteristics. The forth part of the IPS asks respondents about different tools and techniques
used in the company to manage the purchase of these items. Finally, the last part is interested
on sales objectives and economic results of the company.
5.2. Measures
5.2.1. To characterize the data
5.2.1.1. Competitive priorities
According to Krause et al. (2000), “the concept of purchasing strategy and its functional
priorities must be fully operationalized before the relationships among the various parts of the
supply chain, such as operations and purchasing can be empirically examined”. In other words,
purchasing objectives and priorities have to be measured empirically if the purchasing function
wants to be compared to any other part of the company. Like González-Benito (2007) and
Baier et al. (2008), this master thesis will consider strategic objectives in terms of competitive
priorities. Hayes and Wheelwright (1984) defined competitive priorities as “strategic
preferences, as the dimensions along which a company choses to compete in the targeted
market”. They distinguished the four basic competitive priorities that are involved in the
manufacturing strategy: cost, quality, delivery and flexibility. Krause (2001) demonstrated that
these four competitive priorities can be used to quantify purchasing function’s objectives. On
the one hand, González-Benito (2007) used Krause’s four competitive priorities for his study.
On the other hand, Baier et al. (2008) used cost, quality and innovation as competitive
priorities. Moncza et al. (1998) asserted that these three competitive priorities “reflect the
major benefits to be achieved from superior PSM” which resemble the three competitive
priority factors derived by Narasimhan and Carter (1998). It is also important to consider that
Corporate Social Responsibility and Environmental Impact have increased greatly their
31
importance in recent years. Epstein (2008) asserts that “the issue of whether companies
should consider their social responsibility or the impact of their activities on their stakeholders
is no longer up for discussion”. Corporate sustainability has already become an objective so
the challenge has moved from “whether” to “how” to do it. In this sense, González-Benito
(2007) addressed possible improvements of his measures to the incorporation of additional
priorities such as innovation and the preservation of the natural environment. Cousins (2008)
used five competitive priorities: cost, quality, delivery, flexibility and others, which involve
sustainability, innovation, etc. Therefore, there is no agreement on this aspect by academics.
This master thesis is going to consider five competitive priorities: cost, quality, delivery,
innovation and corporate sustainability in order to follow mainly González-Benito’s (2008)
research.
5.2.1.2. Kraljic’s quadrants
The aim of this master thesis is to analyze how important strategic alignment is depending on
different purchasing strategies. In order to do so, it is necessary to have a wide portfolio of
different goods purchased following different strategies. As it has been previously mentioned,
respondents were asked to choose a group of items with similar characteristics and to answer
questions about them. The objective was to address these items to one of the four categories
of Kraljic’s matrix. A large portfolio was obtained with the answers of all respondents.
Andersson and Josefsson (2011) classified all these group of items into the four different
quadrants of Kraljic’s matrix in their master thesis. It is important to take into account that the
same product can occupy different categories for different companies because on the purpose
of the purchase. It was not the physical nature of the product what they classified; it was the
characteristics of the product from a sourcing point of view. The aim of their study was to
validate a variable that enabled further research regarding purchasing portfolio categories and
their implications using the data obtained from the IPS. Therefore, their previous research is
going to be used to classify the data in Kraljic’s matrix.
5.2.2. To assess hypotheses
5.2.2.1. Main variables
5.2.2.1.1. Business performance
Vickery (1991) highlighted the importance of measuring business performance in terms of
financial and commercial performance. He pointed out that financial indicators should not
overlap with the competitive priorities used to assess manufacturing performance.
Accordingly, respondents were asked to rate the net profit of their company/business unit in
comparison to their best competitors today. Business performance is rated in relative terms so
that the competitive advantage of strategic alignment can be easily measured; large net profits
do not imply that you are doing better than your competitors as they could have even larger
profits. A seven-point Likert scale was used: 1 = far worse, 4 = equal, 7 = far better.)
5.2.2.1.2. Strategic alignment
In order to measure the alignment between the purchasing strategy and the firm’s strategy, an
index is needed. As it has been previously asserted, it is advisable to establish purchasing goals
as objective data such as competitive priorities when the aim is an empirical comparison with
32
another part of the firm (Krause, 2001). Consequently, five competitive priorities (cost, quality,
delivery, innovation and corporate sustainability), broken down into seven objectives are used
in this study (See Appendix 1). Respondents were asked to rate the strategic relevance of each
objective, purchasing strategic importance (Pi), on a six-point Likert scale (1 = not at all, 6 =
completely). In order to relate the purchasing strategy to the firm strategy, the same
objectives were rated for the overall company strategy; the same competitive priorities were
broken down into seven objectives (See Appendix 2). Respondents were also asked to rate the
strategic relevance of each objective, firm’s strategic importance (Fi), on a six-point Likert scale
(1 = very unimportant, 6 = very important). It is important to consider that firm strategy can
involve more objectives but, as long as they don’t affect purchasing, strategic alignment is not
affected. Although some competitive priorities are broken down into two objectives, every
purchasing priority has the same relative weight. Appendix 3 shows how purchasing strategy’
answers are related to those about the firm strategy.
An index to measure strategic alignment can be created with the previous values. González-
Benito (2007) developed an index to analyze purchasing efficacy. As it has been previously
explained, strategic alignment and purchasing efficacy constitute both parts of purchasing
competence. As no evidence to reject this index exists and in order to give coherence to the
adaptation of the theory of production competence to purchasing, this index, strategic
alignment (SA), is going to be created following González-Benito’s (2007) model. It is important
to clarify that SA has been obtained following the same procedure as González-Benito’s (2007)
had for purchasing efficacy, not the same procedure as he did for purchasing integration. In
order to measure strategic alignment, he assimilated it to purchasing integration.
∑( | |
SA is an index that subtracts the absolute differences between each purchasing function
objective and each firm objective up to 48, which is the maximum value SA can reach. A firm
whose purchasing strategy and firm strategy are aligned, will have similar values of Pi and Fi for
each objective. As the difference between Pi and Fi will be low, it will score high for SA. By
contrast, companies without an aligned strategy will have dissimilar values of Pi and Fi, its
difference will be high and they will score low.
5.2.2.1.3. Purchasing role in the firm strategy
Respondents were asked to answer nine questions regarding purchasing role in the firm
strategy on a six-point Likert scale (1 = totally disagree, 6 = totally agree). The first three items
refer to the organizational status that the purchasing function possesses within the
organization. Next three items concern the active participation of the purchasing department
in the firm strategy. Finally, last three items refer to the importance that the purchasing
function has for the overall strategy. Confirmatory factory analysis is used to support this
approach. In order to develop factor analysis, no distinction has been made among the
different categories. It is due to the fact that the answers provided by respondents that have
been used to do the factor analysis belong to the second part of the questionnaire, which
involve the purchasing function as a whole. However, confirmatory factor analysis does not
agree with the model proposed (see Table 1).
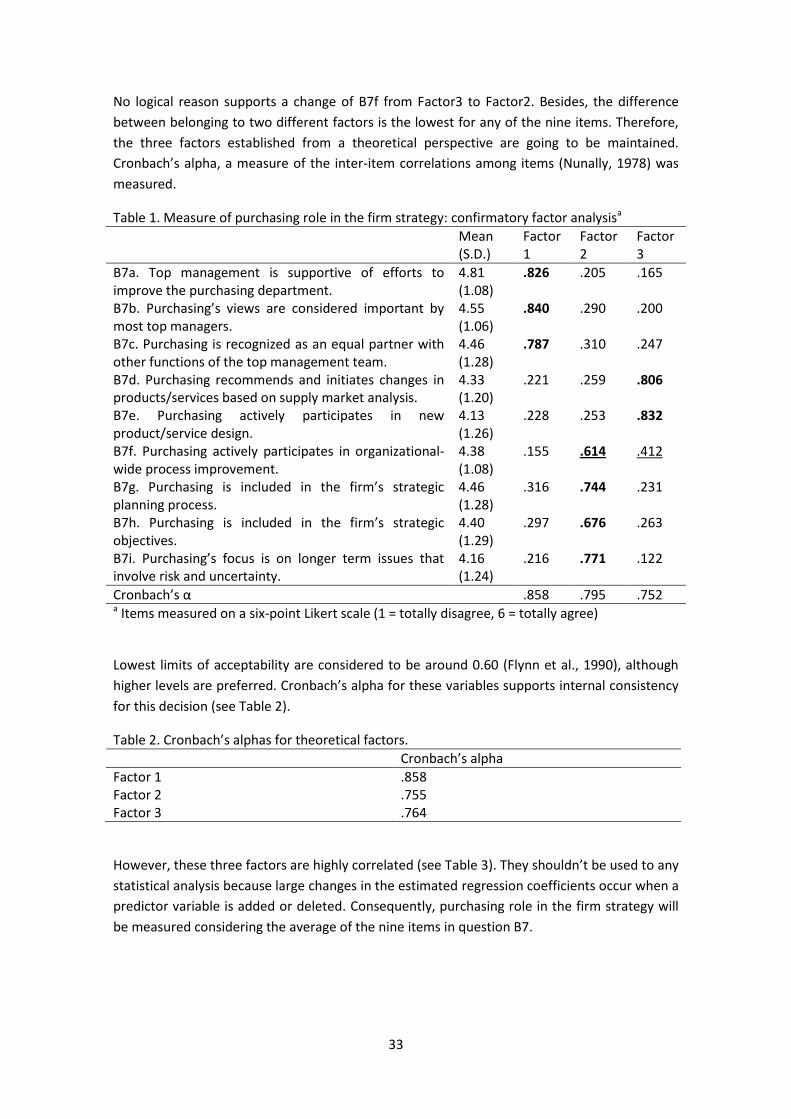
33
No logical reason supports a change of B7f from Factor3 to Factor2. Besides, the difference
between belonging to two different factors is the lowest for any of the nine items. Therefore,
the three factors established from a theoretical perspective are going to be maintained.
Cronbach’s alpha, a measure of the inter-item correlations among items (Nunally, 1978) was
measured.
Table 1. Measure of purchasing role in the firm strategy: confirmatory factor analysisa
Mean (S.D.)
Factor 1
Factor 2
Factor 3
B7a. Top management is supportive of efforts to improve the purchasing department.
4.81 (1.08)
.826 .205 .165
B7b. Purchasing’s views are considered important by most top managers.
4.55 (1.06)
.840 .290 .200
B7c. Purchasing is recognized as an equal partner with other functions of the top management team.
4.46 (1.28)
.787 .310 .247
B7d. Purchasing recommends and initiates changes in products/services based on supply market analysis.
4.33 (1.20)
.221 .259 .806
B7e. Purchasing actively participates in new product/service design.
4.13 (1.26)
.228 .253 .832
B7f. Purchasing actively participates in organizational-wide process improvement.
4.38 (1.08)
.155 .614 .412
B7g. Purchasing is included in the firm’s strategic planning process.
4.46 (1.28)
.316 .744 .231
B7h. Purchasing is included in the firm’s strategic objectives.
4.40 (1.29)
.297 .676 .263
B7i. Purchasing’s focus is on longer term issues that involve risk and uncertainty.
4.16 (1.24)
.216 .771 .122
Cronbach’s α .858 .795 .752 a Items measured on a six-point Likert scale (1 = totally disagree, 6 = totally agree)
Lowest limits of acceptability are considered to be around 0.60 (Flynn et al., 1990), although
higher levels are preferred. Cronbach’s alpha for these variables supports internal consistency
for this decision (see Table 2).
Table 2. Cronbach’s alphas for theoretical factors.
Cronbach’s alpha
Factor 1 .858 Factor 2 .755 Factor 3 .764
However, these three factors are highly correlated (see Table 3). They shouldn’t be used to any
statistical analysis because large changes in the estimated regression coefficients occur when a
predictor variable is added or deleted. Consequently, purchasing role in the firm strategy will
be measured considering the average of the nine items in question B7.
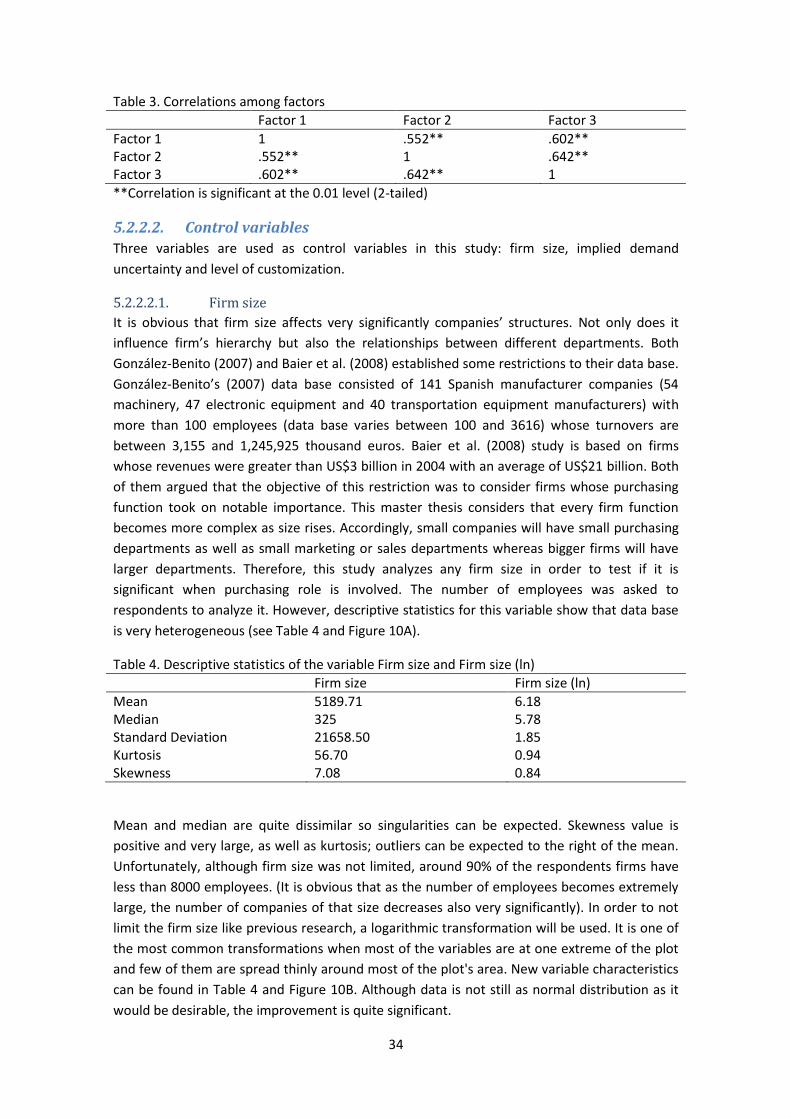
34
Table 3. Correlations among factors
Factor 1 Factor 2 Factor 3
Factor 1 1 .552** .602** Factor 2 .552** 1 .642** Factor 3 .602** .642** 1
**Correlation is significant at the 0.01 level (2-tailed)
5.2.2.2. Control variables
Three variables are used as control variables in this study: firm size, implied demand
uncertainty and level of customization.
5.2.2.2.1. Firm size
It is obvious that firm size affects very significantly companies’ structures. Not only does it
influence firm’s hierarchy but also the relationships between different departments. Both
González-Benito (2007) and Baier et al. (2008) established some restrictions to their data base.
González-Benito’s (2007) data base consisted of 141 Spanish manufacturer companies (54
machinery, 47 electronic equipment and 40 transportation equipment manufacturers) with
more than 100 employees (data base varies between 100 and 3616) whose turnovers are
between 3,155 and 1,245,925 thousand euros. Baier et al. (2008) study is based on firms
whose revenues were greater than US$3 billion in 2004 with an average of US$21 billion. Both
of them argued that the objective of this restriction was to consider firms whose purchasing
function took on notable importance. This master thesis considers that every firm function
becomes more complex as size rises. Accordingly, small companies will have small purchasing
departments as well as small marketing or sales departments whereas bigger firms will have
larger departments. Therefore, this study analyzes any firm size in order to test if it is
significant when purchasing role is involved. The number of employees was asked to
respondents to analyze it. However, descriptive statistics for this variable show that data base
is very heterogeneous (see Table 4 and Figure 10A).
Table 4. Descriptive statistics of the variable Firm size and Firm size (ln)
Firm size Firm size (ln)
Mean 5189.71 6.18 Median 325 5.78 Standard Deviation 21658.50 1.85 Kurtosis 56.70 0.94 Skewness 7.08 0.84
Mean and median are quite dissimilar so singularities can be expected. Skewness value is
positive and very large, as well as kurtosis; outliers can be expected to the right of the mean.
Unfortunately, although firm size was not limited, around 90% of the respondents firms have
less than 8000 employees. (It is obvious that as the number of employees becomes extremely
large, the number of companies of that size decreases also very significantly). In order to not
limit the firm size like previous research, a logarithmic transformation will be used. It is one of
the most common transformations when most of the variables are at one extreme of the plot
and few of them are spread thinly around most of the plot's area. New variable characteristics
can be found in Table 4 and Figure 10B. Although data is not still as normal distribution as it
would be desirable, the improvement is quite significant.
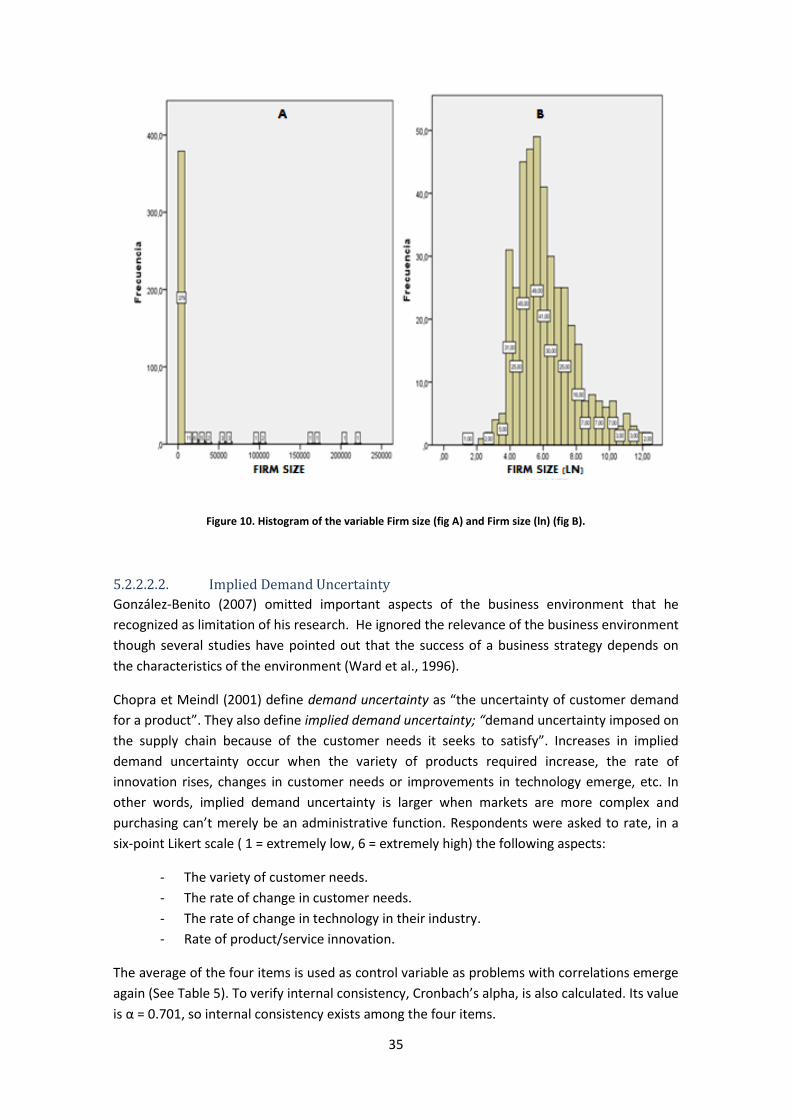
35
Figure 10. Histogram of the variable Firm size (fig A) and Firm size (ln) (fig B).
5.2.2.2.2. Implied Demand Uncertainty
González-Benito (2007) omitted important aspects of the business environment that he
recognized as limitation of his research. He ignored the relevance of the business environment
though several studies have pointed out that the success of a business strategy depends on
the characteristics of the environment (Ward et al., 1996).
Chopra et Meindl (2001) define demand uncertainty as “the uncertainty of customer demand
for a product”. They also define implied demand uncertainty; “demand uncertainty imposed on
the supply chain because of the customer needs it seeks to satisfy”. Increases in implied
demand uncertainty occur when the variety of products required increase, the rate of
innovation rises, changes in customer needs or improvements in technology emerge, etc. In
other words, implied demand uncertainty is larger when markets are more complex and
purchasing can’t merely be an administrative function. Respondents were asked to rate, in a
six-point Likert scale ( 1 = extremely low, 6 = extremely high) the following aspects:
- The variety of customer needs.
- The rate of change in customer needs.
- The rate of change in technology in their industry.
- Rate of product/service innovation.
The average of the four items is used as control variable as problems with correlations emerge
again (See Table 5). To verify internal consistency, Cronbach’s alpha, is also calculated. Its value
is α = 0.701, so internal consistency exists among the four items.
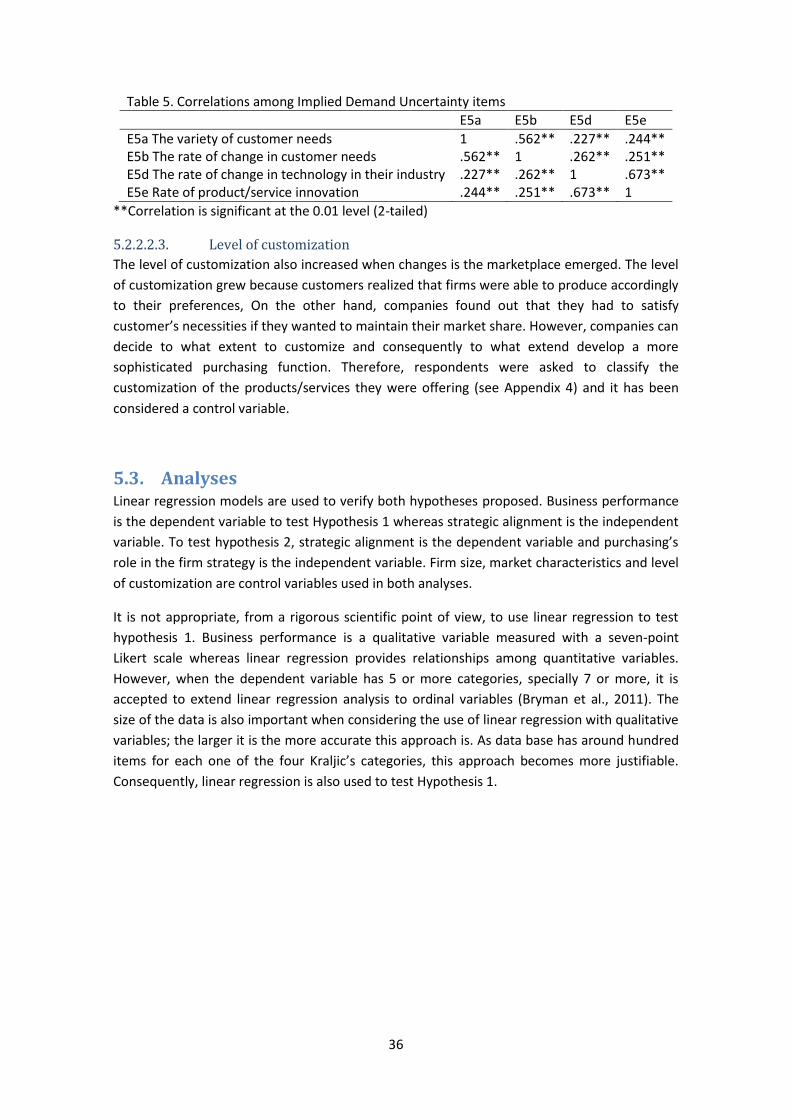
36
Table 5. Correlations among Implied Demand Uncertainty items
E5a E5b E5d E5e
E5a The variety of customer needs 1 .562** .227** .244** E5b The rate of change in customer needs .562** 1 .262** .251** E5d The rate of change in technology in their industry .227** .262** 1 .673** E5e Rate of product/service innovation .244** .251** .673** 1
**Correlation is significant at the 0.01 level (2-tailed)
5.2.2.2.3. Level of customization
The level of customization also increased when changes is the marketplace emerged. The level
of customization grew because customers realized that firms were able to produce accordingly
to their preferences, On the other hand, companies found out that they had to satisfy
customer’s necessities if they wanted to maintain their market share. However, companies can
decide to what extent to customize and consequently to what extend develop a more
sophisticated purchasing function. Therefore, respondents were asked to classify the
customization of the products/services they were offering (see Appendix 4) and it has been
considered a control variable.
5.3. Analyses Linear regression models are used to verify both hypotheses proposed. Business performance
is the dependent variable to test Hypothesis 1 whereas strategic alignment is the independent
variable. To test hypothesis 2, strategic alignment is the dependent variable and purchasing’s
role in the firm strategy is the independent variable. Firm size, market characteristics and level
of customization are control variables used in both analyses.
It is not appropriate, from a rigorous scientific point of view, to use linear regression to test
hypothesis 1. Business performance is a qualitative variable measured with a seven-point
Likert scale whereas linear regression provides relationships among quantitative variables.
However, when the dependent variable has 5 or more categories, specially 7 or more, it is
accepted to extend linear regression analysis to ordinal variables (Bryman et al., 2011). The
size of the data is also important when considering the use of linear regression with qualitative
variables; the larger it is the more accurate this approach is. As data base has around hundred
items for each one of the four Kraljic’s categories, this approach becomes more justifiable.
Consequently, linear regression is also used to test Hypothesis 1.
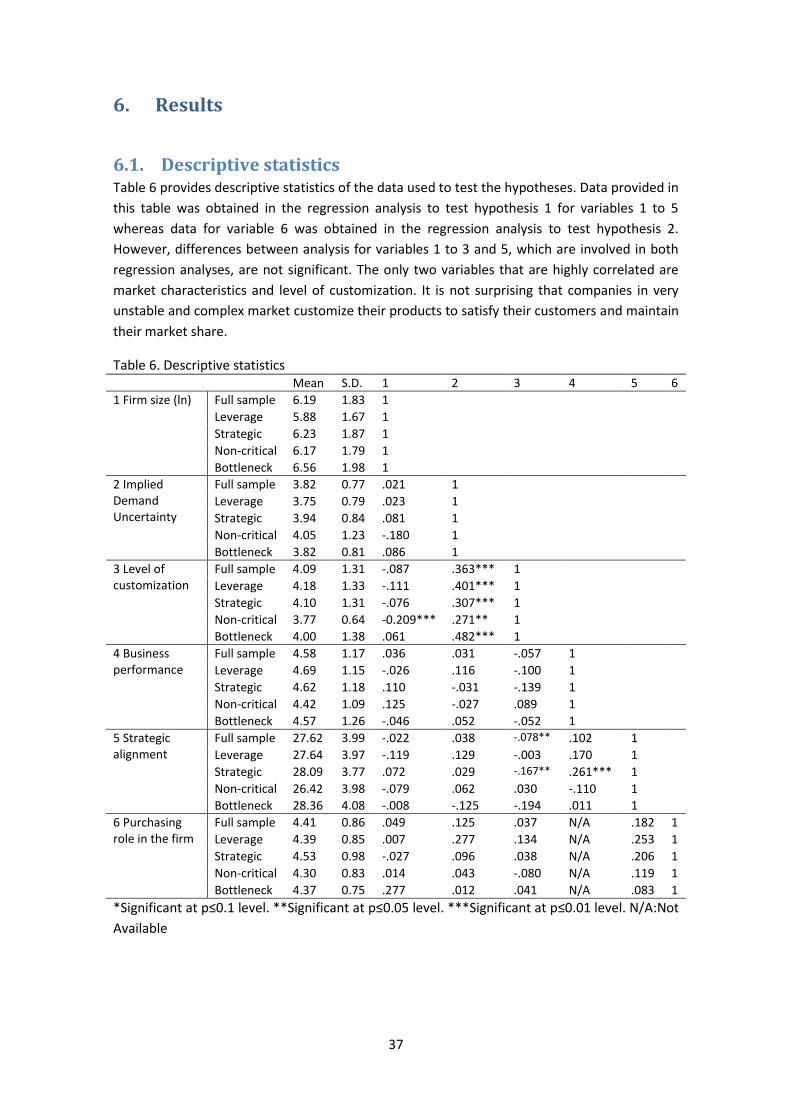
37
6. Results
6.1. Descriptive statistics Table 6 provides descriptive statistics of the data used to test the hypotheses. Data provided in
this table was obtained in the regression analysis to test hypothesis 1 for variables 1 to 5
whereas data for variable 6 was obtained in the regression analysis to test hypothesis 2.
However, differences between analysis for variables 1 to 3 and 5, which are involved in both
regression analyses, are not significant. The only two variables that are highly correlated are
market characteristics and level of customization. It is not surprising that companies in very
unstable and complex market customize their products to satisfy their customers and maintain
their market share.
Table 6. Descriptive statistics
Mean S.D. 1 2 3 4 5 6
1 Firm size (ln) Full sample 6.19 1.83 1
Leverage 5.88 1.67 1
Strategic 6.23 1.87 1
Non-critical 6.17 1.79 1
Bottleneck 6.56 1.98 1
2 Implied Demand Uncertainty
Full sample 3.82 0.77 .021 1
Leverage 3.75 0.79 .023 1
Strategic 3.94 0.84 .081 1
Non-critical 4.05 1.23 -.180 1
Bottleneck 3.82 0.81 .086 1
3 Level of customization
Full sample 4.09 1.31 -.087 .363*** 1
Leverage 4.18 1.33 -.111 .401*** 1
Strategic 4.10 1.31 -.076 .307*** 1
Non-critical 3.77 0.64 -0.209*** .271** 1
Bottleneck 4.00 1.38 .061 .482*** 1
4 Business performance
Full sample 4.58 1.17 .036 .031 -.057 1
Leverage 4.69 1.15 -.026 .116 -.100 1
Strategic 4.62 1.18 .110 -.031 -.139 1
Non-critical 4.42 1.09 .125 -.027 .089 1
Bottleneck 4.57 1.26 -.046 .052 -.052 1
5 Strategic alignment
Full sample 27.62 3.99 -.022 .038 -.078** .102 1
Leverage 27.64 3.97 -.119 .129 -.003 .170 1
Strategic 28.09 3.77 .072 .029 -.167** .261*** 1
Non-critical 26.42 3.98 -.079 .062 .030 -.110 1
Bottleneck 28.36 4.08 -.008 -.125 -.194 .011 1
6 Purchasing role in the firm
Full sample 4.41 0.86 .049 .125 .037 N/A .182 1
Leverage 4.39 0.85 .007 .277 .134 N/A .253 1
Strategic 4.53 0.98 -.027 .096 .038 N/A .206 1
Non-critical 4.30 0.83 .014 .043 -.080 N/A .119 1
Bottleneck 4.37 0.75 .277 .012 .041 N/A .083 1
*Significant at p≤0.1 level. **Significant at p≤0.05 level. ***Significant at p≤0.01 level. N/A:Not
Available
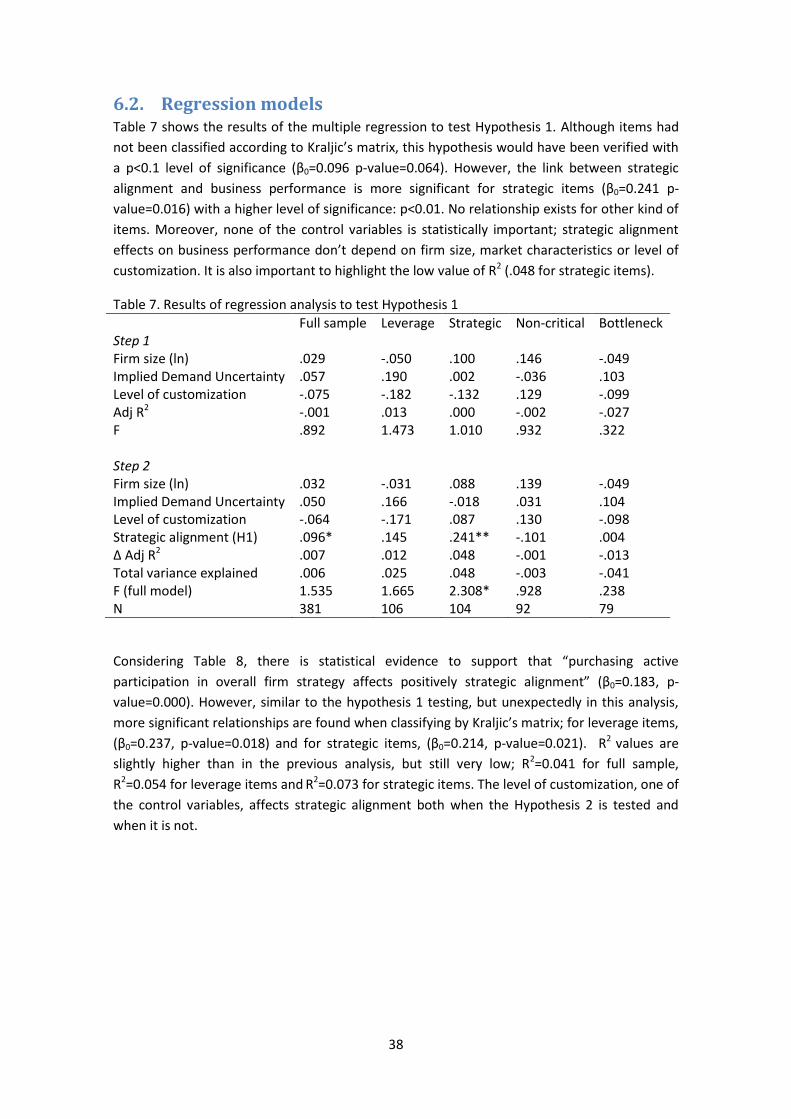
38
6.2. Regression models Table 7 shows the results of the multiple regression to test Hypothesis 1. Although items had
not been classified according to Kraljic’s matrix, this hypothesis would have been verified with
a p<0.1 level of significance (β0=0.096 p-value=0.064). However, the link between strategic
alignment and business performance is more significant for strategic items (β0=0.241 p-
value=0.016) with a higher level of significance: p<0.01. No relationship exists for other kind of
items. Moreover, none of the control variables is statistically important; strategic alignment
effects on business performance don’t depend on firm size, market characteristics or level of
customization. It is also important to highlight the low value of R2 (.048 for strategic items).
Table 7. Results of regression analysis to test Hypothesis 1
Full sample Leverage Strategic Non-critical Bottleneck Step 1 Firm size (ln) .029 -.050 .100 .146 -.049 Implied Demand Uncertainty .057 .190 .002 -.036 .103 Level of customization -.075 -.182 -.132 .129 -.099 Adj R2 -.001 .013 .000 -.002 -.027 F .892 1.473 1.010 .932 .322 Step 2 Firm size (ln) .032 -.031 .088 .139 -.049 Implied Demand Uncertainty .050 .166 -.018 .031 .104 Level of customization -.064 -.171 .087 .130 -.098 Strategic alignment (H1) .096* .145 .241** -.101 .004 ∆ Adj R2 .007 .012 .048 -.001 -.013 Total variance explained .006 .025 .048 -.003 -.041 F (full model) 1.535 1.665 2.308* .928 .238 N 381 106 104 92 79
Considering Table 8, there is statistical evidence to support that “purchasing active
participation in overall firm strategy affects positively strategic alignment” (β0=0.183, p-
value=0.000). However, similar to the hypothesis 1 testing, but unexpectedly in this analysis,
more significant relationships are found when classifying by Kraljic’s matrix; for leverage items,
(β0=0.237, p-value=0.018) and for strategic items, (β0=0.214, p-value=0.021). R2 values are
slightly higher than in the previous analysis, but still very low; R2=0.041 for full sample,
R2=0.054 for leverage items and R2=0.073 for strategic items. The level of customization, one of
the control variables, affects strategic alignment both when the Hypothesis 2 is tested and
when it is not.
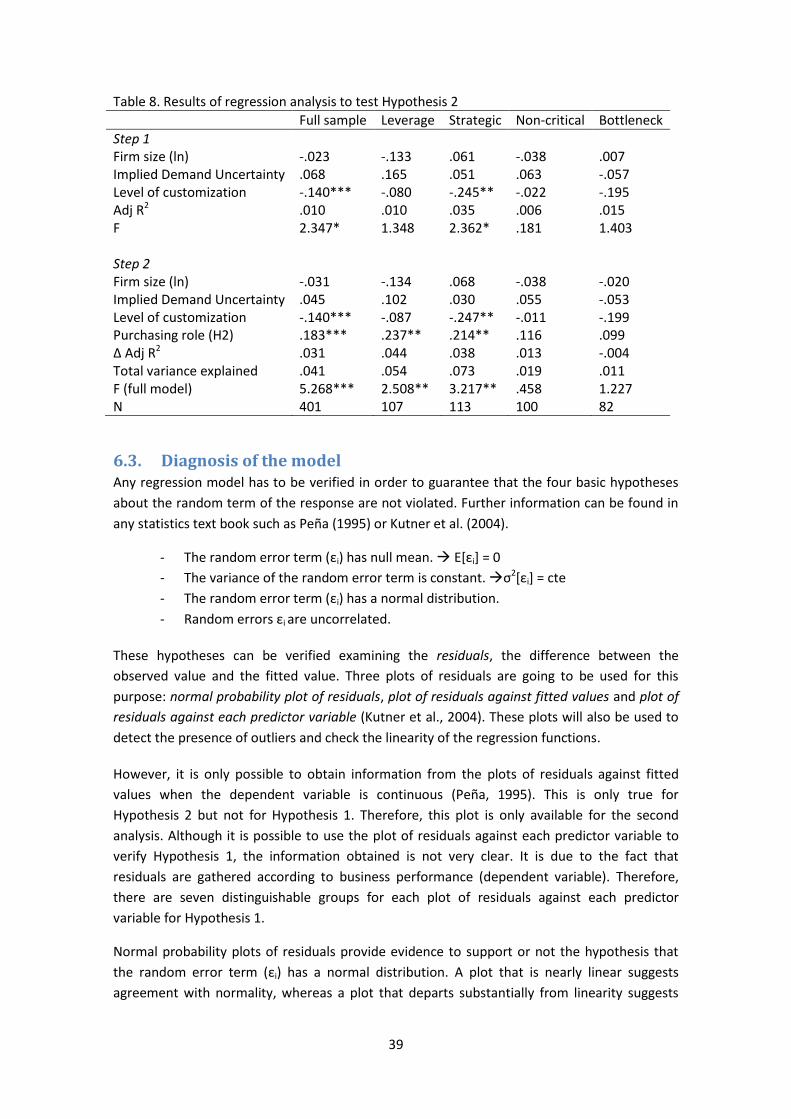
39
Table 8. Results of regression analysis to test Hypothesis 2
Full sample Leverage Strategic Non-critical Bottleneck
Step 1 Firm size (ln) -.023 -.133 .061 -.038 .007 Implied Demand Uncertainty .068 .165 .051 .063 -.057 Level of customization -.140*** -.080 -.245** -.022 -.195 Adj R2 .010 .010 .035 .006 .015 F 2.347* 1.348 2.362* .181 1.403 Step 2 Firm size (ln) -.031 -.134 .068 -.038 -.020 Implied Demand Uncertainty .045 .102 .030 .055 -.053 Level of customization -.140*** -.087 -.247** -.011 -.199 Purchasing role (H2) .183*** .237** .214** .116 .099 ∆ Adj R2 .031 .044 .038 .013 -.004 Total variance explained .041 .054 .073 .019 .011 F (full model) 5.268*** 2.508** 3.217** .458 1.227 N 401 107 113 100 82
6.3. Diagnosis of the model Any regression model has to be verified in order to guarantee that the four basic hypotheses
about the random term of the response are not violated. Further information can be found in
any statistics text book such as Peña (1995) or Kutner et al. (2004).
- The random error term (εi) has null mean. E[εi] = 0
- The variance of the random error term is constant. σ2[εi] = cte
- The random error term (εi) has a normal distribution.
- Random errors εi are uncorrelated.
These hypotheses can be verified examining the residuals, the difference between the
observed value and the fitted value. Three plots of residuals are going to be used for this
purpose: normal probability plot of residuals, plot of residuals against fitted values and plot of
residuals against each predictor variable (Kutner et al., 2004). These plots will also be used to
detect the presence of outliers and check the linearity of the regression functions.
However, it is only possible to obtain information from the plots of residuals against fitted
values when the dependent variable is continuous (Peña, 1995). This is only true for
Hypothesis 2 but not for Hypothesis 1. Therefore, this plot is only available for the second
analysis. Although it is possible to use the plot of residuals against each predictor variable to
verify Hypothesis 1, the information obtained is not very clear. It is due to the fact that
residuals are gathered according to business performance (dependent variable). Therefore,
there are seven distinguishable groups for each plot of residuals against each predictor
variable for Hypothesis 1.
Normal probability plots of residuals provide evidence to support or not the hypothesis that
the random error term (εi) has a normal distribution. A plot that is nearly linear suggests
agreement with normality, whereas a plot that departs substantially from linearity suggests
40
that the error distribution is not normal. Small departures from normality do not create any
serious problems. Major departures, should be concern.
None of the ten plots presents a normal probability of the error terms which departs
substantially from normality (see Appendixes 5a to 14a). All the distributions referred to
Hypothesis 2 are slightly skewed to the right. The model which fits best for the hypothesis of
normality is the one of strategic items. Those distributions referred to Hypothesis 1 have their
observations gathered in seven groups, one for each value of business performance.
Whether a linear regression function is appropriate for the analysis of the data can be studied
from a plot of residuals against fitted values (see Appendixes 10b to 14b) or from a plot of
residuals against each predictor variable (see Appendixes 5b to 9b and 10c to 14c). Both of
them also provide evidence about two other hypotheses: the variance of the random error
term and the random error term mean.
No special shape is detected in any of the plots of residuals against fitted values or plots of
residuals against each predictor variable which suggests nonlinearity.
None of the most typical shapes that support that the variance of the random error term is not
constant or that the random error term has null mean can be found; residuals fall within a
horizontal band centered on 0, displaying no systematic tendencies to be positive or negative.
However, it is possible to notice the presence of outliers from the analysis of the plots of
residuals against fitted values and of the plots of residuals against each predictor variable.
Some observations are quite far from the homogenous group of residuals although none of
them looks really isolated. Appendix 15 shows the largest deviations of the data base. The
statistical results inform us that no observation has larger deviation than three standard
deviations for Hypothesis 1 and six observations have larger deviation than three standard
deviations for Hypothesis 2: they are observations 1, 10, 71, 151, 340 and 425. Their residuals
are pointed out in plots of residuals against fitted values (see Appendixes 5b to 9b) and in plots
of residuals against each predictor variable (see Appendixes 5c to 9c and 10b to 14b). A safe
rule frequently suggested is to discard an outlier only if there is direct evidence that it
represents an error in recording, a miscalculation, a malfunctioning of equipment, or a similar
type of circumstance (Kutner et al., 2004). There is no evidence that suggests any of these
events. Moreover, they represent around 1% of the whole data base in any analyses as they
are distributed among the four Kraljic’s quadrants. They are the observations with the sixth
lowest values for strategic alignment but there are no more characteristics that they share.
Consequently, no outlier is going to be removed from the data sample.
Data base does not allow uncovering correlated random errors. However, there is no evidence
to presuppose any correlation as respondents could answer the survey whenever they want on
the IPS website.
Finally, it is important to remember that two aspects about model fit have already been
considered during the methodology chapter: multicollinearity, which forced to change a
variable (purchasing role in the firm strategy) and homogeneity which obliged to alter one
variable (firm size).
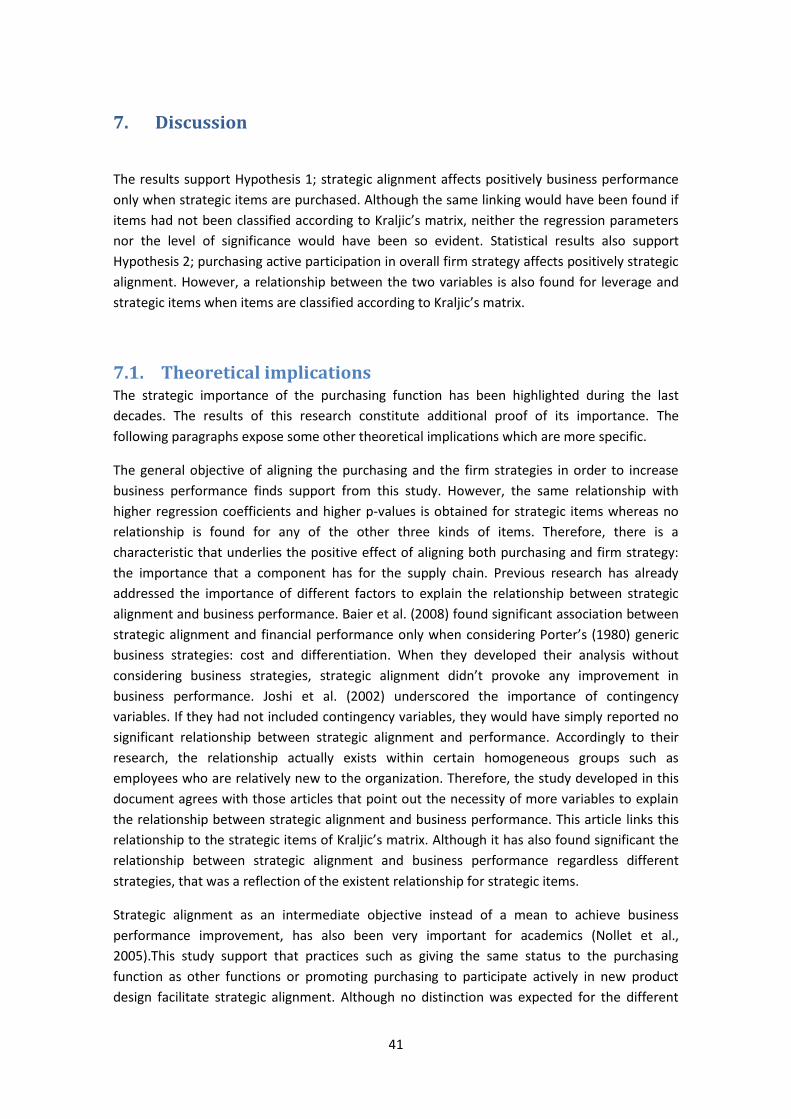
41
7. Discussion
The results support Hypothesis 1; strategic alignment affects positively business performance
only when strategic items are purchased. Although the same linking would have been found if
items had not been classified according to Kraljic’s matrix, neither the regression parameters
nor the level of significance would have been so evident. Statistical results also support
Hypothesis 2; purchasing active participation in overall firm strategy affects positively strategic
alignment. However, a relationship between the two variables is also found for leverage and
strategic items when items are classified according to Kraljic’s matrix.
7.1. Theoretical implications The strategic importance of the purchasing function has been highlighted during the last
decades. The results of this research constitute additional proof of its importance. The
following paragraphs expose some other theoretical implications which are more specific.
The general objective of aligning the purchasing and the firm strategies in order to increase
business performance finds support from this study. However, the same relationship with
higher regression coefficients and higher p-values is obtained for strategic items whereas no
relationship is found for any of the other three kinds of items. Therefore, there is a
characteristic that underlies the positive effect of aligning both purchasing and firm strategy:
the importance that a component has for the supply chain. Previous research has already
addressed the importance of different factors to explain the relationship between strategic
alignment and business performance. Baier et al. (2008) found significant association between
strategic alignment and financial performance only when considering Porter’s (1980) generic
business strategies: cost and differentiation. When they developed their analysis without
considering business strategies, strategic alignment didn’t provoke any improvement in
business performance. Joshi et al. (2002) underscored the importance of contingency
variables. If they had not included contingency variables, they would have simply reported no
significant relationship between strategic alignment and performance. Accordingly to their
research, the relationship actually exists within certain homogeneous groups such as
employees who are relatively new to the organization. Therefore, the study developed in this
document agrees with those articles that point out the necessity of more variables to explain
the relationship between strategic alignment and business performance. This article links this
relationship to the strategic items of Kraljic’s matrix. Although it has also found significant the
relationship between strategic alignment and business performance regardless different
strategies, that was a reflection of the existent relationship for strategic items.
Strategic alignment as an intermediate objective instead of a mean to achieve business
performance improvement, has also been very important for academics (Nollet et al.,
2005).This study support that practices such as giving the same status to the purchasing
function as other functions or promoting purchasing to participate actively in new product
design facilitate strategic alignment. Although no distinction was expected for the different
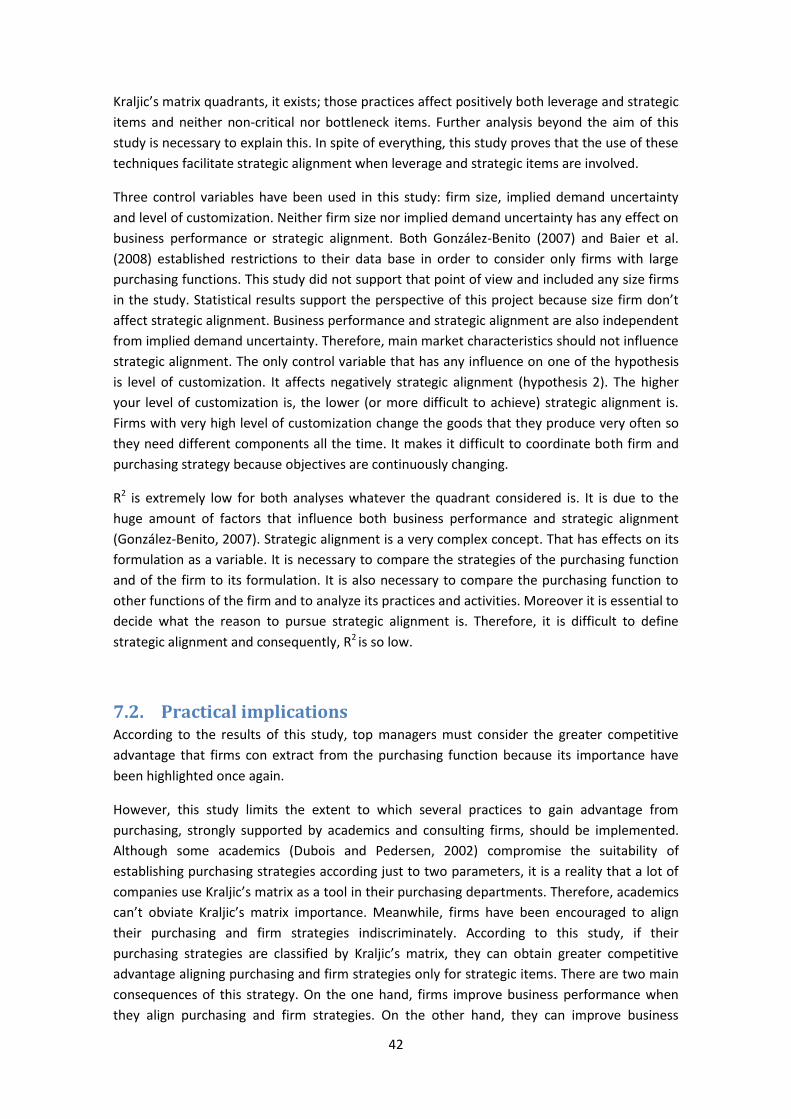
42
Kraljic’s matrix quadrants, it exists; those practices affect positively both leverage and strategic
items and neither non-critical nor bottleneck items. Further analysis beyond the aim of this
study is necessary to explain this. In spite of everything, this study proves that the use of these
techniques facilitate strategic alignment when leverage and strategic items are involved.
Three control variables have been used in this study: firm size, implied demand uncertainty
and level of customization. Neither firm size nor implied demand uncertainty has any effect on
business performance or strategic alignment. Both González-Benito (2007) and Baier et al.
(2008) established restrictions to their data base in order to consider only firms with large
purchasing functions. This study did not support that point of view and included any size firms
in the study. Statistical results support the perspective of this project because size firm don’t
affect strategic alignment. Business performance and strategic alignment are also independent
from implied demand uncertainty. Therefore, main market characteristics should not influence
strategic alignment. The only control variable that has any influence on one of the hypothesis
is level of customization. It affects negatively strategic alignment (hypothesis 2). The higher
your level of customization is, the lower (or more difficult to achieve) strategic alignment is.
Firms with very high level of customization change the goods that they produce very often so
they need different components all the time. It makes it difficult to coordinate both firm and
purchasing strategy because objectives are continuously changing.
R2 is extremely low for both analyses whatever the quadrant considered is. It is due to the
huge amount of factors that influence both business performance and strategic alignment
(González-Benito, 2007). Strategic alignment is a very complex concept. That has effects on its
formulation as a variable. It is necessary to compare the strategies of the purchasing function
and of the firm to its formulation. It is also necessary to compare the purchasing function to
other functions of the firm and to analyze its practices and activities. Moreover it is essential to
decide what the reason to pursue strategic alignment is. Therefore, it is difficult to define
strategic alignment and consequently, R2 is so low.
7.2. Practical implications According to the results of this study, top managers must consider the greater competitive
advantage that firms con extract from the purchasing function because its importance have
been highlighted once again.
However, this study limits the extent to which several practices to gain advantage from
purchasing, strongly supported by academics and consulting firms, should be implemented.
Although some academics (Dubois and Pedersen, 2002) compromise the suitability of
establishing purchasing strategies according just to two parameters, it is a reality that a lot of
companies use Kraljic’s matrix as a tool in their purchasing departments. Therefore, academics
can’t obviate Kraljic’s matrix importance. Meanwhile, firms have been encouraged to align
their purchasing and firm strategies indiscriminately. According to this study, if their
purchasing strategies are classified by Kraljic’s matrix, they can obtain greater competitive
advantage aligning purchasing and firm strategies only for strategic items. There are two main
consequences of this strategy. On the one hand, firms improve business performance when
they align purchasing and firm strategies. On the other hand, they can improve business
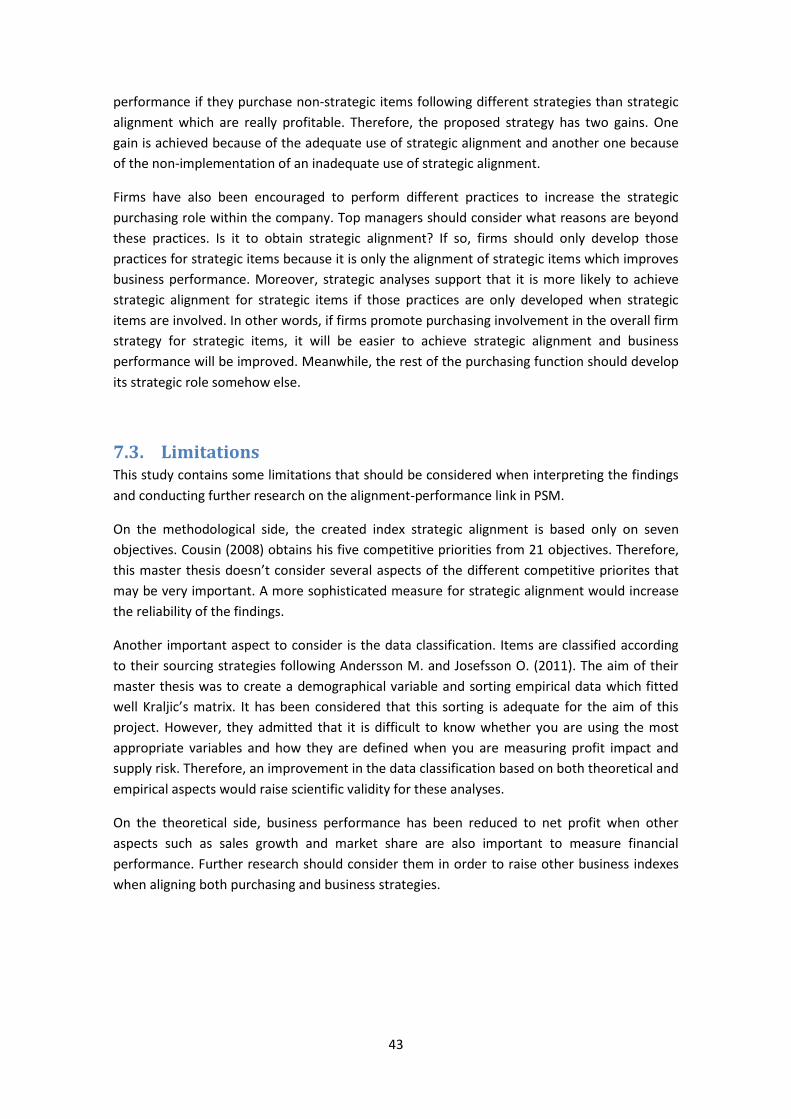
43
performance if they purchase non-strategic items following different strategies than strategic
alignment which are really profitable. Therefore, the proposed strategy has two gains. One
gain is achieved because of the adequate use of strategic alignment and another one because
of the non-implementation of an inadequate use of strategic alignment.
Firms have also been encouraged to perform different practices to increase the strategic
purchasing role within the company. Top managers should consider what reasons are beyond
these practices. Is it to obtain strategic alignment? If so, firms should only develop those
practices for strategic items because it is only the alignment of strategic items which improves
business performance. Moreover, strategic analyses support that it is more likely to achieve
strategic alignment for strategic items if those practices are only developed when strategic
items are involved. In other words, if firms promote purchasing involvement in the overall firm
strategy for strategic items, it will be easier to achieve strategic alignment and business
performance will be improved. Meanwhile, the rest of the purchasing function should develop
its strategic role somehow else.
7.3. Limitations This study contains some limitations that should be considered when interpreting the findings
and conducting further research on the alignment-performance link in PSM.
On the methodological side, the created index strategic alignment is based only on seven
objectives. Cousin (2008) obtains his five competitive priorities from 21 objectives. Therefore,
this master thesis doesn’t consider several aspects of the different competitive priorites that
may be very important. A more sophisticated measure for strategic alignment would increase
the reliability of the findings.
Another important aspect to consider is the data classification. Items are classified according
to their sourcing strategies following Andersson M. and Josefsson O. (2011). The aim of their
master thesis was to create a demographical variable and sorting empirical data which fitted
well Kraljic’s matrix. It has been considered that this sorting is adequate for the aim of this
project. However, they admitted that it is difficult to know whether you are using the most
appropriate variables and how they are defined when you are measuring profit impact and
supply risk. Therefore, an improvement in the data classification based on both theoretical and
empirical aspects would raise scientific validity for these analyses.
On the theoretical side, business performance has been reduced to net profit when other
aspects such as sales growth and market share are also important to measure financial
performance. Further research should consider them in order to raise other business indexes
when aligning both purchasing and business strategies.
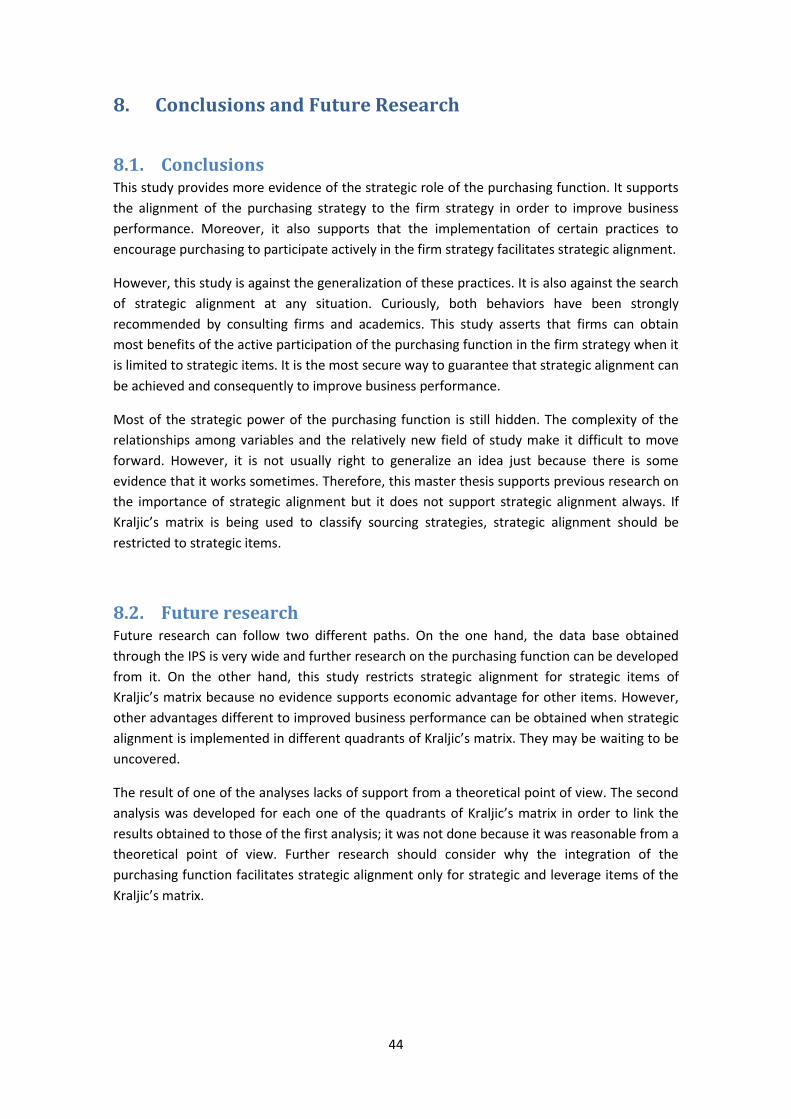
44
8. Conclusions and Future Research
8.1. Conclusions This study provides more evidence of the strategic role of the purchasing function. It supports
the alignment of the purchasing strategy to the firm strategy in order to improve business
performance. Moreover, it also supports that the implementation of certain practices to
encourage purchasing to participate actively in the firm strategy facilitates strategic alignment.
However, this study is against the generalization of these practices. It is also against the search
of strategic alignment at any situation. Curiously, both behaviors have been strongly
recommended by consulting firms and academics. This study asserts that firms can obtain
most benefits of the active participation of the purchasing function in the firm strategy when it
is limited to strategic items. It is the most secure way to guarantee that strategic alignment can
be achieved and consequently to improve business performance.
Most of the strategic power of the purchasing function is still hidden. The complexity of the
relationships among variables and the relatively new field of study make it difficult to move
forward. However, it is not usually right to generalize an idea just because there is some
evidence that it works sometimes. Therefore, this master thesis supports previous research on
the importance of strategic alignment but it does not support strategic alignment always. If
Kraljic’s matrix is being used to classify sourcing strategies, strategic alignment should be
restricted to strategic items.
8.2. Future research Future research can follow two different paths. On the one hand, the data base obtained
through the IPS is very wide and further research on the purchasing function can be developed
from it. On the other hand, this study restricts strategic alignment for strategic items of
Kraljic’s matrix because no evidence supports economic advantage for other items. However,
other advantages different to improved business performance can be obtained when strategic
alignment is implemented in different quadrants of Kraljic’s matrix. They may be waiting to be
uncovered.
The result of one of the analyses lacks of support from a theoretical point of view. The second
analysis was developed for each one of the quadrants of Kraljic’s matrix in order to link the
results obtained to those of the first analysis; it was not done because it was reasonable from a
theoretical point of view. Further research should consider why the integration of the
purchasing function facilitates strategic alignment only for strategic and leverage items of the
Kraljic’s matrix.
45
References
Anderson, J.C., Cleveland, G. and Schroeder, R.G., 1989. “Operations strategy: a literature
review”. Journal of Operations Management (13:4), 369-385.
Andersson M. and Josefsson O., 2011. “Operationalization of Kraljic: An explorative study of
portfolio models used for purchasing within the manufacturing industry”.
Baier, C., Hartmann, E., Moser, R., 2008. “Strategic alignment and purchasing efficacy: an
exploratory analysis of their impact on financial performance”, Journal of Supply Chain
Management (44:4).
Barney, J.B., 1991. “Firm resources and sustained competitive advantage”, Journal of
Management (17:1), 99-120.
Bryman A. and Bell E., 2011. “Business research methods”, Oxford University Press, New York.
Burgos Jiménez, J. and Céspedes Lorente, J.J., 2001. “Environmental performance as an
operations objective”. International Journal of Operations and Production Management
(21:12), 1553-1572.
Caniëls, M.C.J. and Gelderman, C.J., 2005. “Purchasing strategies in the Kraljic matrix – A
power and dependence perspective”, Journal of Purchasing & Supply Management (11), 141-
155.
Carr, A.S. and Pearson, J.N., 1999. “Strategically managed buyer-supplier relationships and
performance outcomes”, Journal of Operations Management (17:5), 497-519.
Chen, I.J., Paulraj, A., Lado, A.A., 2004. “Strategic purchasing, supply management and firm
performance”, Journal of Operations Management 22, 505-523.
Chopra, S. and Meindl, P., 2001. “Supply Chain Management: strategy, planning and
operation”, Pearson.
Cleveland, G., Schroeder, R.G., Anderson J.C., 1989. “A theory of production competence”.
Decision Sciences (20:4), 655-668.
Collis J. and Hussey R., 2009. “Business Research: a practical guide for undergraduate and
postgraduate students”, Palgrave Macmillan, Basingstokes, Hampsire, United Kingdom.
46
Cousins, P.D., 2005. “The Alignment of Appropriate Firm and Supply Strategies for Competitive
Advantage”, International Journal of Operations and Production Management (25:5), 403-428.
Cousins, P., Lamming R., Lawson B. and Squire, B., 2008. “Strategic Supply Management:
principles, theories and practice”, Prentice Hall, Edinburgh.
Dubois, A. and Pedersen, A.C., 2002. “Why relationships do not fit into purchasing portfolio
models-a comparison between the portfolio and industrial network approaches”, European
Journal of Purchasing & Supply Chain Management (8:1), 35-42.
Dwyer, F.R. and Tanner, J.F., 2001. “Business Marketing: Connecting Strategy, Relationships
and Learning”, McGraw-Hill, 2nd edition, New York.
Ellram, L.M., Carr, A., 1994. “Strategic purchasing: a history and review of the literature”.
International Journal of Purchasing & Materials Management (30:2), 10-18.
Ellram, L.M. and Billington, C., 2001. “Purchasing leverage considerations in the outsourcing
decision”, European Journal of Purchasing & Supply Management (7:1), 15-27.
Epstein, M.J., 2008. “Making Sustainability Work”, Berrett-Koehler Publishers, San Francisco.
Flynn, B.B., Sakakibara, S., Schroeder, R.G., Bates, K.A. and Flynn, E.J., 1990. “Empirical
research methods in operations management”, Journal of Operations Management (9:2), 250-
284.
Gadde, L.E. and Hakansson, H., 1994. “The changing role of purchasing: reconsidering three
strategic isssues”, European Journal of Purchasing and Supply Management (1:1), 27-35.
Gelderman, C.J. and Van Weele A.J., 2003. “Handling measurement issues and strategic
directions in Kraljic’s purchasing portfolio model”, Journal of Purchasing & Supply Management
9, 207-216.
Gelderman, C.J. and Van Weele A.J., 2003. “Purchasing Portfolio Models: A Critique and
Update”, Journal of Supply Chain Management 41, 19-28.
González-Benito, J., 2007. “A theory of purchasing’s contribution to business performance”.
Journal of Operations Management 25, 901-917.
Hamel, G., Doz, Y. and Prahalad, C.K., 1989. “Collaborate with your competitors and win”,
Harvard Business Review, Jan-Feb 1989.
47
Hayes, R.H., Schmenner, R.W., 1978. “How should you organize manufacturing?,. Harvard
Business Review (56:1), 105-118.
Hayes, R.H., Wheelwright, S.C., 1984. “Restoring our Competitive Edge: Competing Through
Manufacturing”. John Wiley & Sons, New York.
Holcomb, T.R. and Hitt, M.A., 2007. “Towards a model of strategic outsourcing”, Journal of
Operations Management (25:2), 464-481.
Joshi, M.P., Kathuria, R. and Porth, S.J., 2002. “Alignment of strategic priorities and
performance: an integration of operations and strategic management perspectives”, Journal of
Operations Management 21, 353-369.
Kraljic, P., 1983. “Purchasing must become supply management”. Harvard Business Review
(61:5), 109-117.
Krause, D.R., Pagell, M. and Curkovic, S., 2000. “Towards a measure of competitive priorities for
purchasing”. Journal of Operations Management 19, 497-512.
Kutner, M.H. et al., 2004. “Applied linear statistical models”, McGraw Hill, 4th edition, New
York.
Lambert, D., 2004. “Supply Chain Management: Processes, Partnerships, Performance”, Supply
Chain Management Institute.
Lamming, R., 1993. “Beyond Partnership. Strategies for innovation and lean supply”, Prentice
Hall, London, 1993.
Landeros, R. and Monczka, R.M., 1989. “Cooperative buyer/seller relationships and a firm’s
competitive posture”, Journal of Purchasing and Materials Management (25:3), 9-18.
Lilliecreutz, J. and Ydreskog, L., 1990. “Supplier Classification as an Enabler for a Differentiated
Purchasing Strategy”, Global Purchasing & Supply Chain Management 11, 66-74.
McIvor, R., 2008. “How the transaction cost and resource-based theories of the firm inform
outsourcing evaluation”, Journal of Operations Management 27, 45-63.
Monczka, R.M. and Trent, R.J., 1991. “Evolving sourcing strategies for the 1990s”, International
Journal of Physical Distribution and Logistics Management (21:5), 4-12.
48
Monczka, R.M., Trent, R.J. and Handfield, R.B., 1998. “Purchasing and Supply Chain
Management”, South-Western College Publications, Cincinnati.
Narasimhan, R. and Carter, J.R., 1998. “Linking Business Unit and Material Sourcing Strategies”,
Journal of Business Logistics (19:2), 155-171.
Narasimham, R. and Das, A., 2001. “The impact of purchasing integration and practices on
manufacturing performance”, Journal of Operations Management 19, 593-609.
Nunnally, J.D., 1978. “Psychometric Theory”, McGraw-Hill, New York.
Nollet, J., Ponce, S. and Campbell, M., 2005. “About “Strategy” and “Strategies” in Supply
Management”, Journal of Purchasing and Supply Management (11:2), 129-140.
Palmer, T.G., 2002. “Globalization is great”, Cato’s Letter (1:2)
Pearson, J.N. and Gritzmacher, K.J, 1990. “Integrating Purchasing into Strategic Management”,
Long Range Planning (23:3), 91-99.
Peña Sánchez de Rivera, D., 1995. “Estadística: modelos y métodos”, Alianza Universidad
Textos, 2nd edition, Madrid.
Peteraf, M.A., 1993. “The cornerstones of competitive advantage: a resource-based view”,
Strategic Management Journal 14, 179-191.
Ponce, E. and Prida, B., 2006. “La logística de aprovisionamientos para la integración de la
cadena de suministros”, Prentice Hall, Madrid.
Porter, M., 1985. “Competitive Advantage: creating and sustaining superior Performance”,
Free Press, New York.
Prahalad, C. and Hamel, G., 1990. “The Core Competencies of the Corporation”, Harvard
Business Review, 68, 79-91.
Prida, B., Gutiérrez, G., 1996. “Logística de aprovisionamiento. El cambio en las relaciones
proveedor-cliente, un nuevo desafío para la empresa del siglo XXI”, McGraw-Hill, Madrid.
Quinn, J.B., 1980. “Strategies for Change: Logistical Incrementalism”, The McGraw-Hill
Companies, Irwim, Homewood.
Quinn, J.B. and Hilmer, F.G., 1994. “Strategic Sourcing”, Sloan Management Review (35:4), 43-
55.
49
Spekman, R.E., Kamauff, J.W. and Salmond, D.J., 1994. “At Last Purchasing Is Becoming
Strategic”, Long Range Planning (27:2), 76-84.
Skinner, W., 1969. “Manufacturing – Missing Link in Corporate Strategy”, Harvard Business
Review, (47:3), 136-145.
Turnbull, P.W., 1990. “A Review of Portfolio Planning Models for Industrial Marketing and
Purchasing Management”, European Journal of Marketing (24:3), 7-22.
Van Weele, A.J., 2005. “Purchasing & Supply Chain Management: Analysis, Strategy, Planning
and Practice”, Thomson Learning, London.
Venkatesan, R., 1992. “Strategic sourcing: to make or not to make”, Harvard Business Review,
Nov-Dec 1992, 98-107
Vickery, S.K., 1991. “A theory of production competence revisited”, Decision Sciences (22:3),
635-643.
Ward, P.T., Bickford, D.J. and Leong, G.K., 1996. “Configurations of manufacturing strategy,
business strategy, environment and structure”, Journal of Management (22:4), 597-626.
Watts, C. A., Kim, K.Y. and Hahn, C.K., 1992. “Linking purchasing to corporate competitive
strategy”. International Journal of Purchasing & Materials
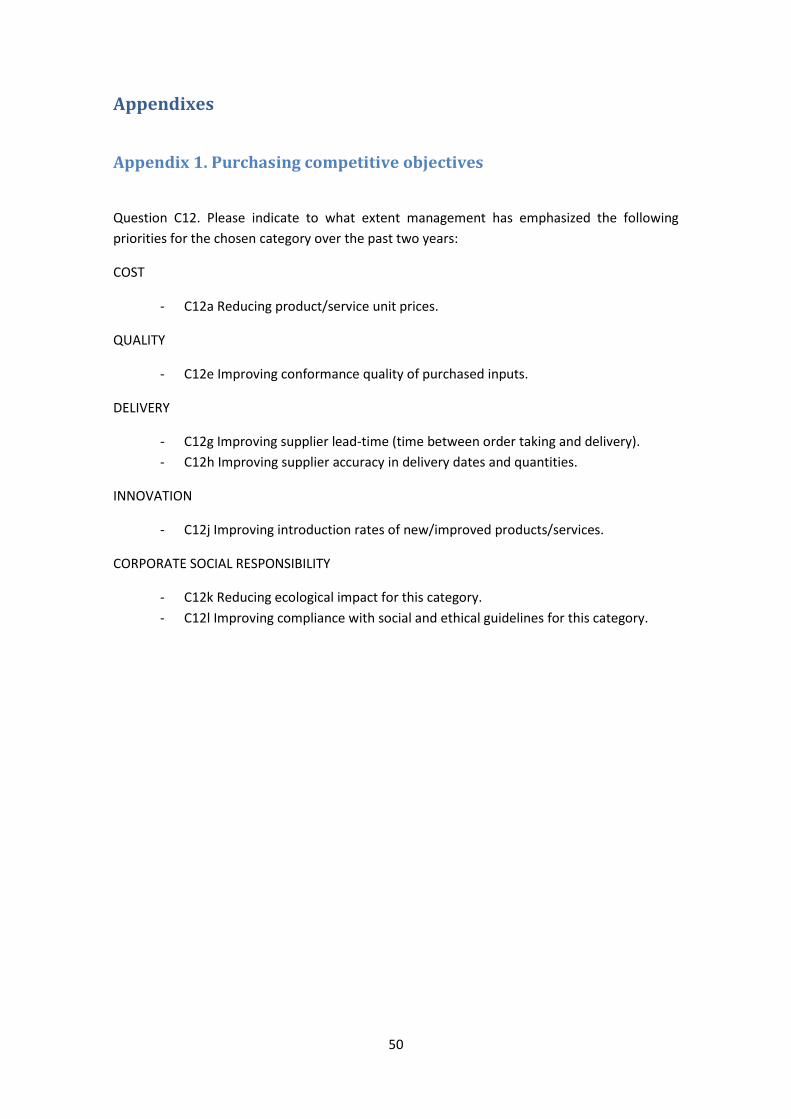
50
Appendixes
Appendix 1. Purchasing competitive objectives
Question C12. Please indicate to what extent management has emphasized the following
priorities for the chosen category over the past two years:
COST
- C12a Reducing product/service unit prices.
QUALITY
- C12e Improving conformance quality of purchased inputs.
DELIVERY
- C12g Improving supplier lead-time (time between order taking and delivery).
- C12h Improving supplier accuracy in delivery dates and quantities.
INNOVATION
- C12j Improving introduction rates of new/improved products/services.
CORPORATE SOCIAL RESPONSIBILITY
- C12k Reducing ecological impact for this category.
- C12l Improving compliance with social and ethical guidelines for this category.
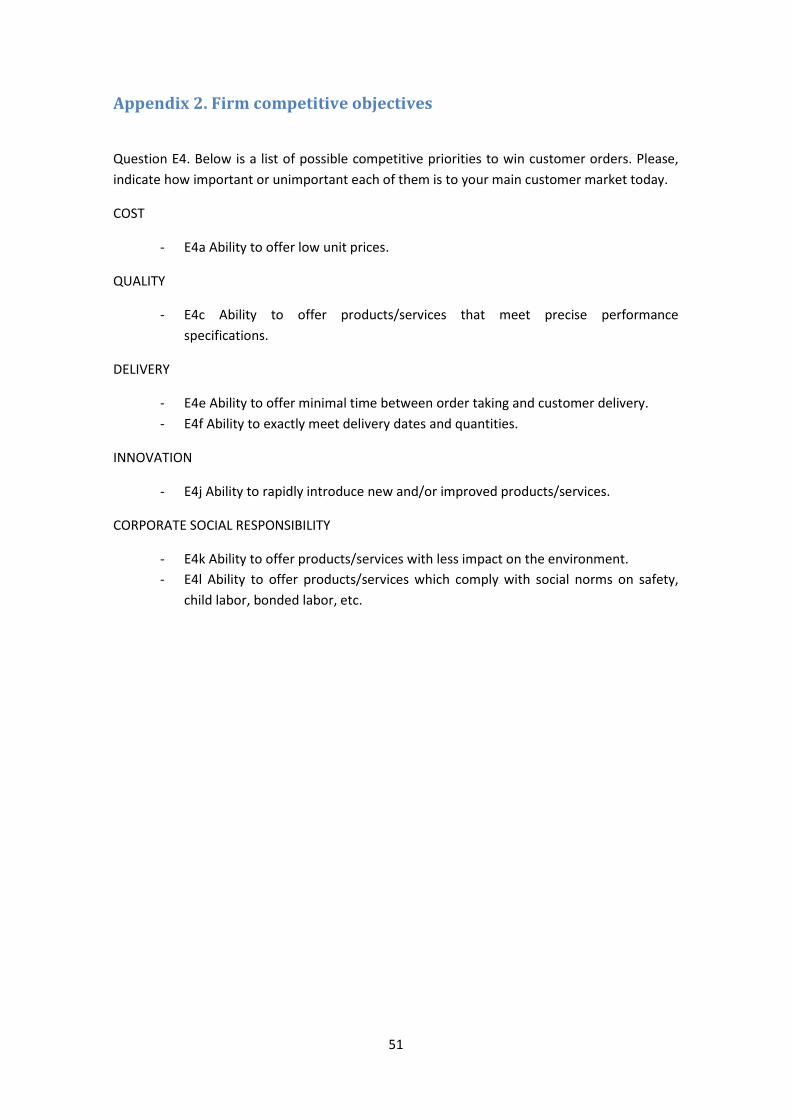
51
Appendix 2. Firm competitive objectives
Question E4. Below is a list of possible competitive priorities to win customer orders. Please,
indicate how important or unimportant each of them is to your main customer market today.
COST
- E4a Ability to offer low unit prices.
QUALITY
- E4c Ability to offer products/services that meet precise performance
specifications.
DELIVERY
- E4e Ability to offer minimal time between order taking and customer delivery.
- E4f Ability to exactly meet delivery dates and quantities.
INNOVATION
- E4j Ability to rapidly introduce new and/or improved products/services.
CORPORATE SOCIAL RESPONSIBILITY
- E4k Ability to offer products/services with less impact on the environment.
- E4l Ability to offer products/services which comply with social norms on safety,
child labor, bonded labor, etc.
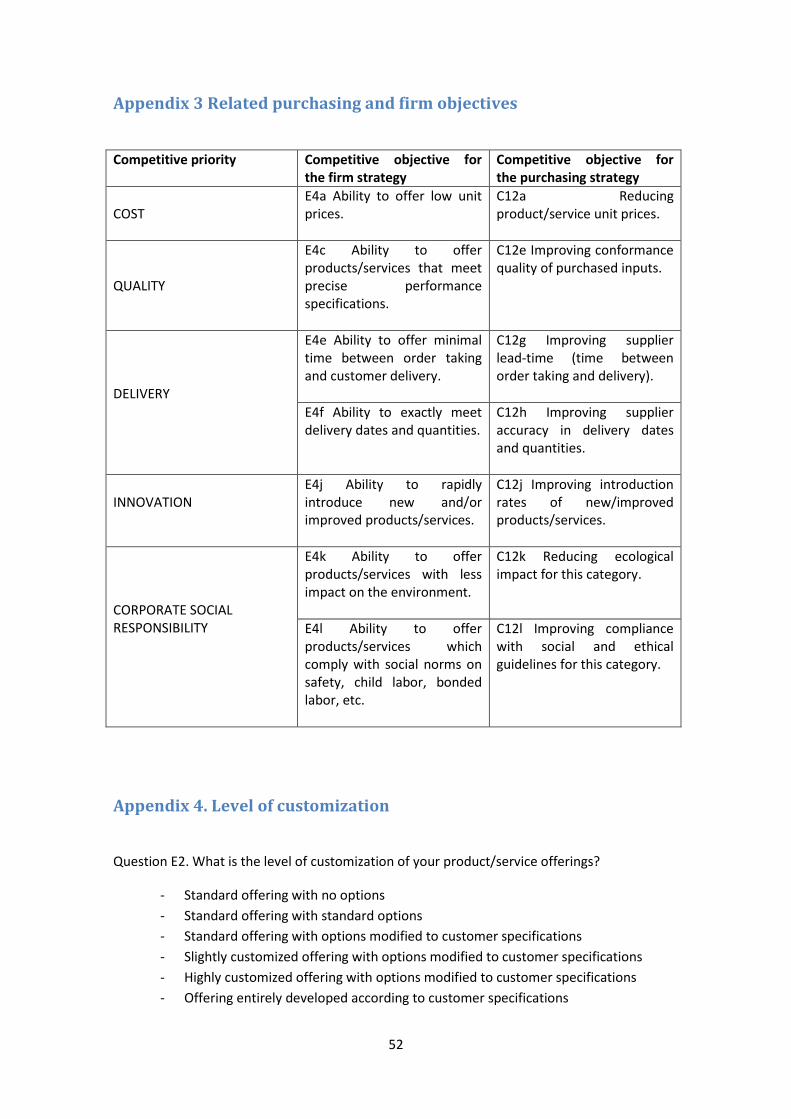
52
Appendix 3 Related purchasing and firm objectives
Competitive priority Competitive objective for the firm strategy
Competitive objective for the purchasing strategy
COST
E4a Ability to offer low unit prices.
C12a Reducing product/service unit prices.
QUALITY
E4c Ability to offer products/services that meet precise performance specifications.
C12e Improving conformance quality of purchased inputs.
DELIVERY
E4e Ability to offer minimal time between order taking and customer delivery.
C12g Improving supplier lead-time (time between order taking and delivery).
E4f Ability to exactly meet delivery dates and quantities.
C12h Improving supplier accuracy in delivery dates and quantities.
INNOVATION
E4j Ability to rapidly introduce new and/or improved products/services.
C12j Improving introduction rates of new/improved products/services.
CORPORATE SOCIAL RESPONSIBILITY
E4k Ability to offer products/services with less impact on the environment.
C12k Reducing ecological impact for this category.
E4l Ability to offer products/services which comply with social norms on safety, child labor, bonded labor, etc.
C12l Improving compliance with social and ethical guidelines for this category.
Appendix 4. Level of customization
Question E2. What is the level of customization of your product/service offerings?
- Standard offering with no options
- Standard offering with standard options
- Standard offering with options modified to customer specifications
- Slightly customized offering with options modified to customer specifications
- Highly customized offering with options modified to customer specifications
- Offering entirely developed according to customer specifications
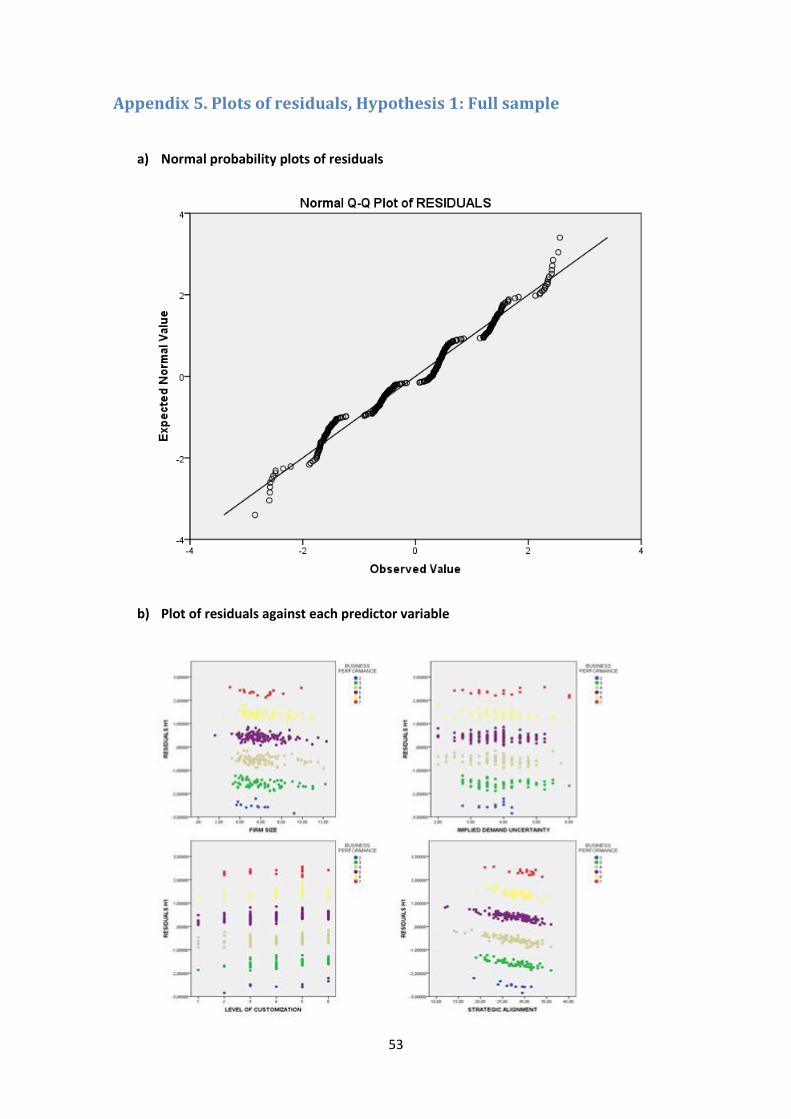
53
Appendix 5. Plots of residuals, Hypothesis 1: Full sample
a) Normal probability plots of residuals
b) Plot of residuals against each predictor variable
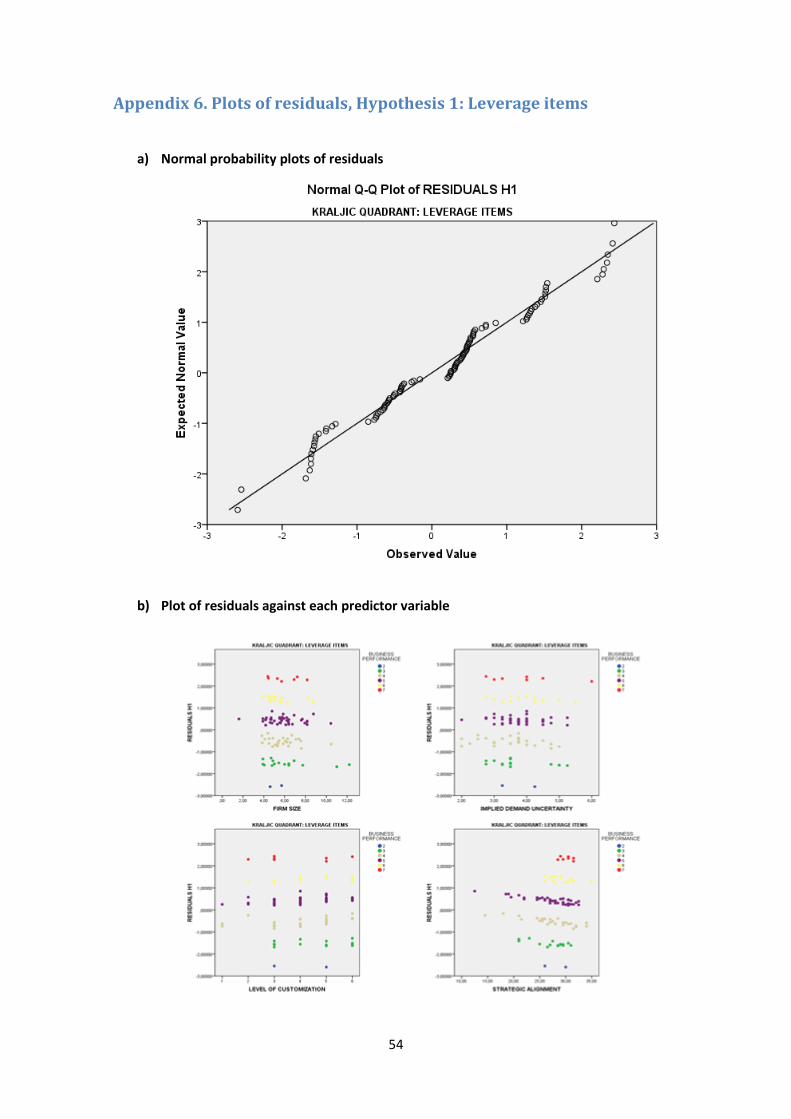
54
Appendix 6. Plots of residuals, Hypothesis 1: Leverage items
a) Normal probability plots of residuals
b) Plot of residuals against each predictor variable
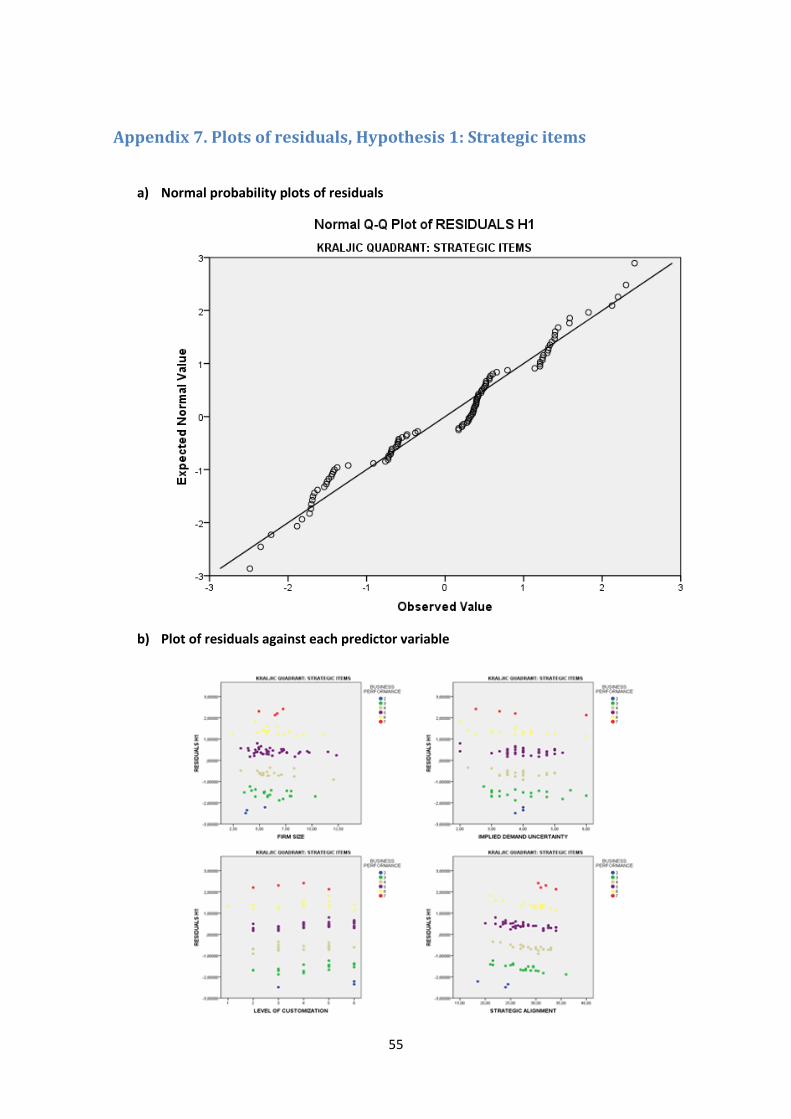
55
Appendix 7. Plots of residuals, Hypothesis 1: Strategic items
a) Normal probability plots of residuals
b) Plot of residuals against each predictor variable
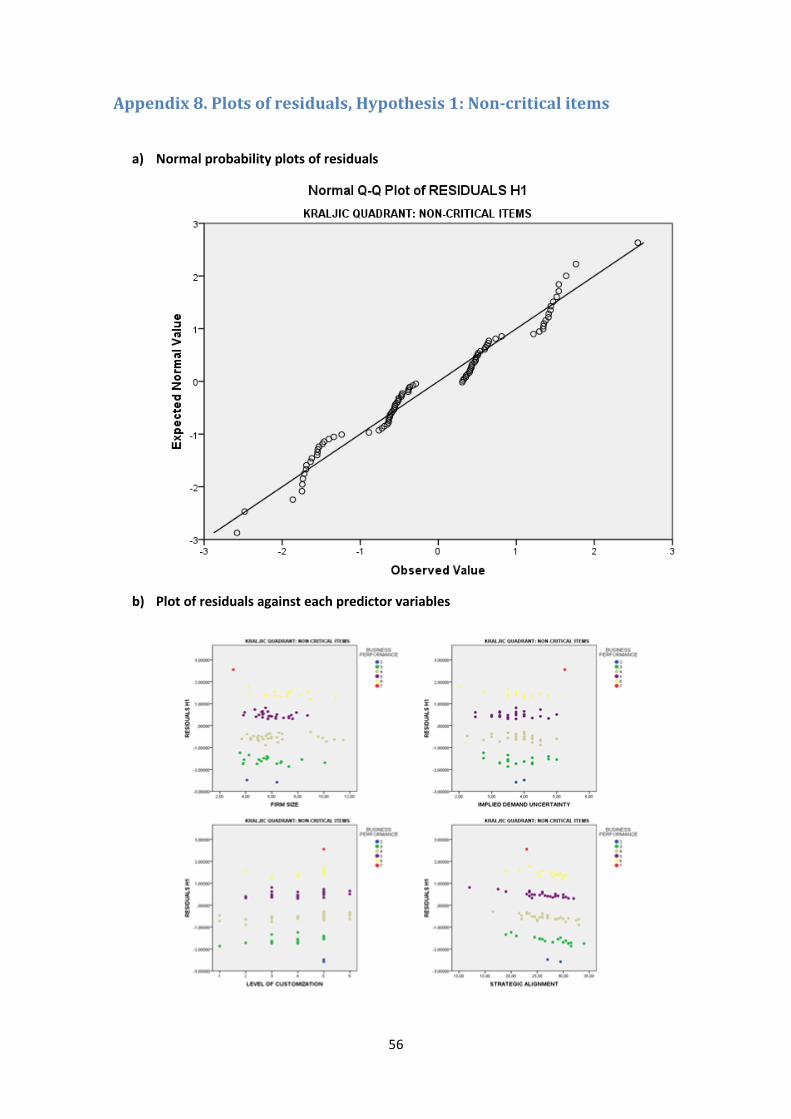
56
Appendix 8. Plots of residuals, Hypothesis 1: Non-critical items
a) Normal probability plots of residuals
b) Plot of residuals against each predictor variables
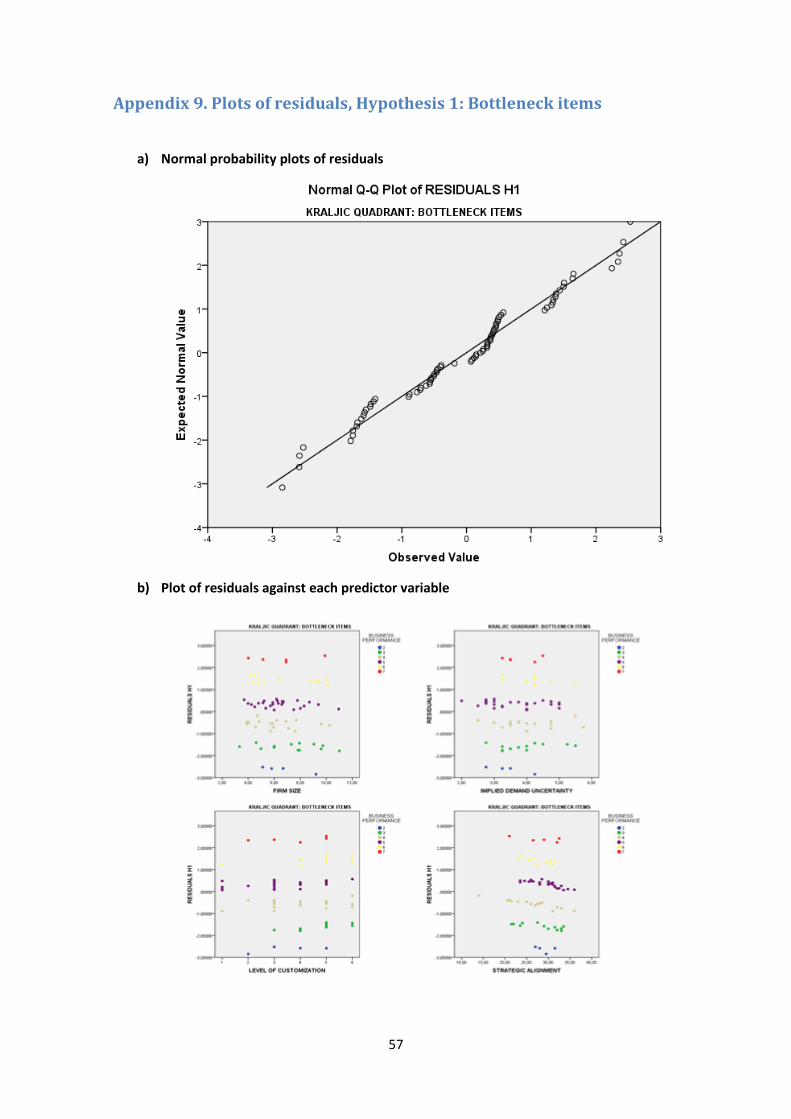
57
Appendix 9. Plots of residuals, Hypothesis 1: Bottleneck items
a) Normal probability plots of residuals
b) Plot of residuals against each predictor variable
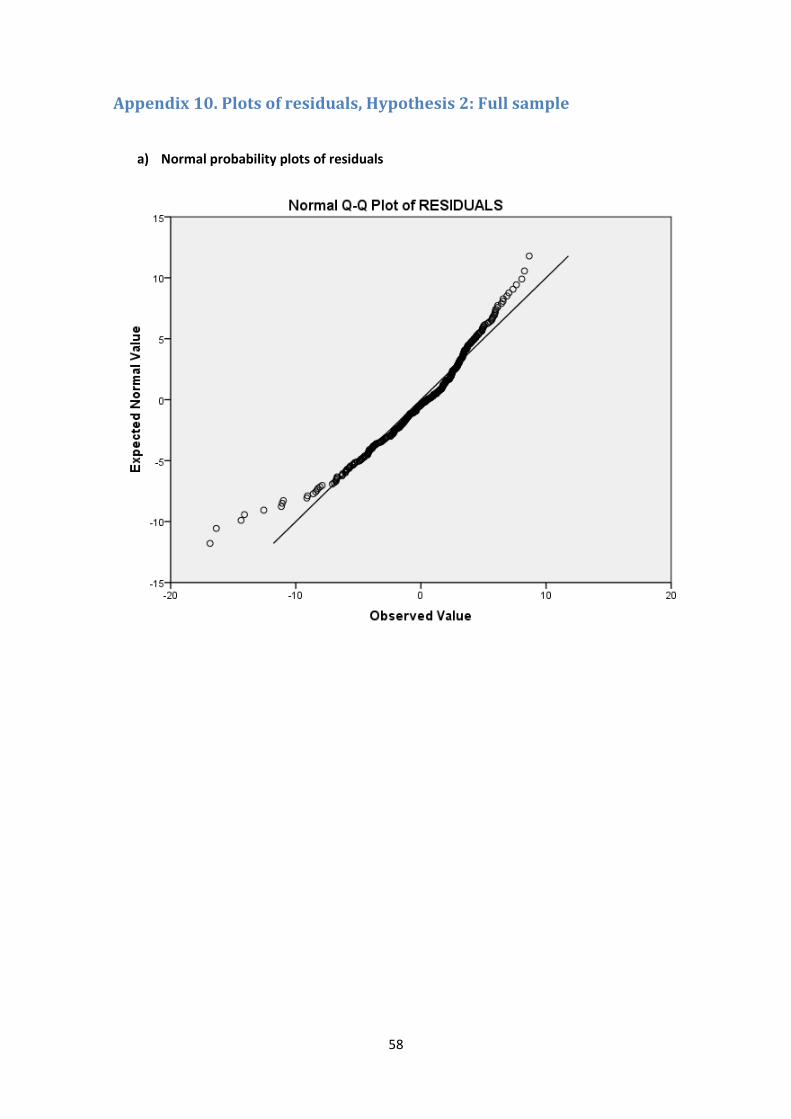
58
Appendix 10. Plots of residuals, Hypothesis 2: Full sample
a) Normal probability plots of residuals
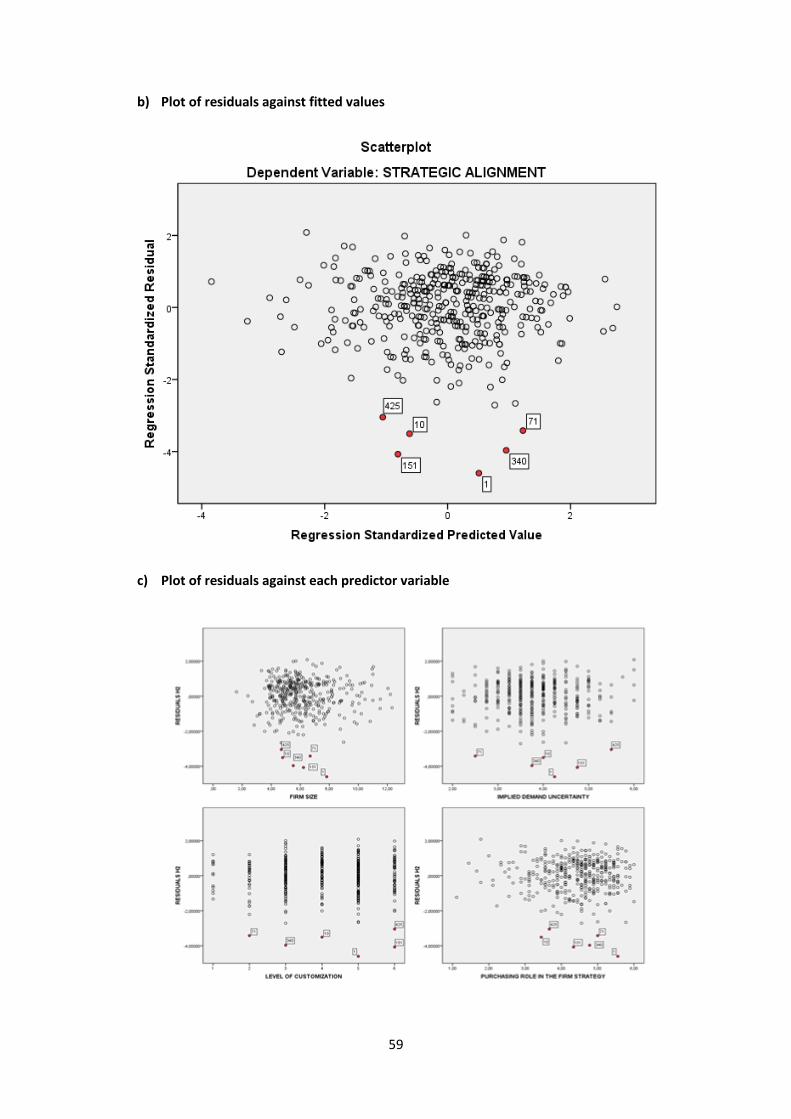
59
b) Plot of residuals against fitted values
c) Plot of residuals against each predictor variable
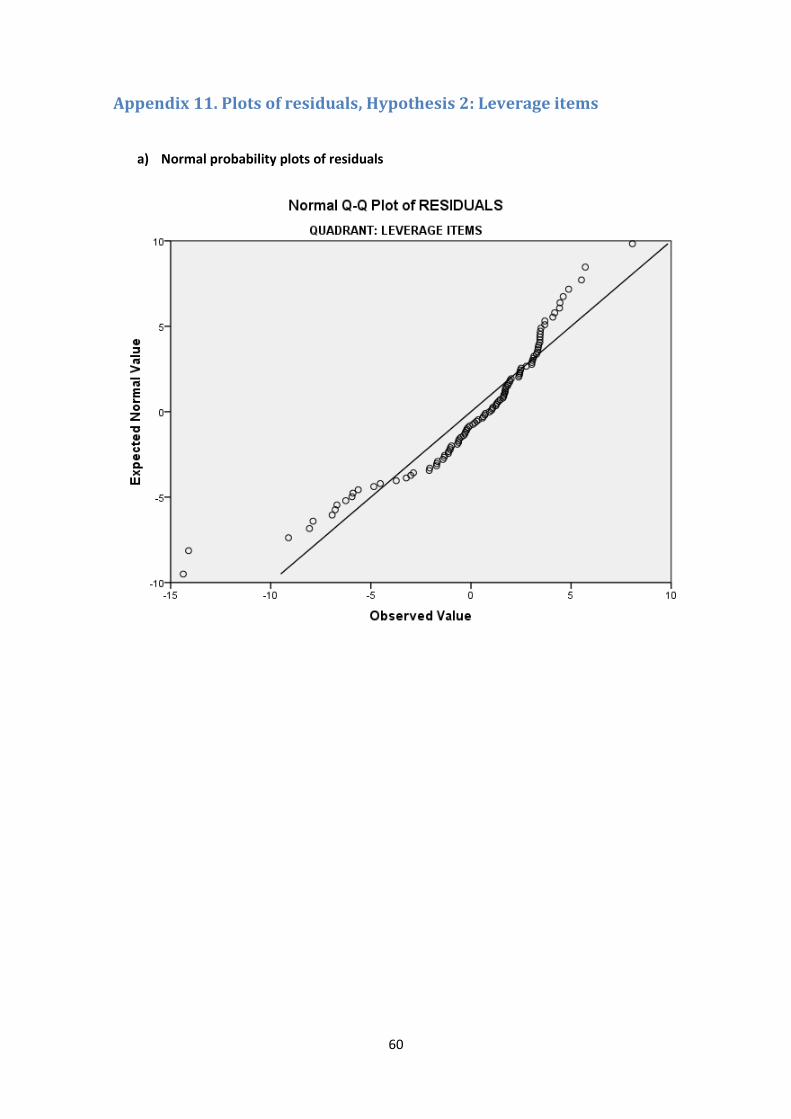
60
Appendix 11. Plots of residuals, Hypothesis 2: Leverage items
a) Normal probability plots of residuals
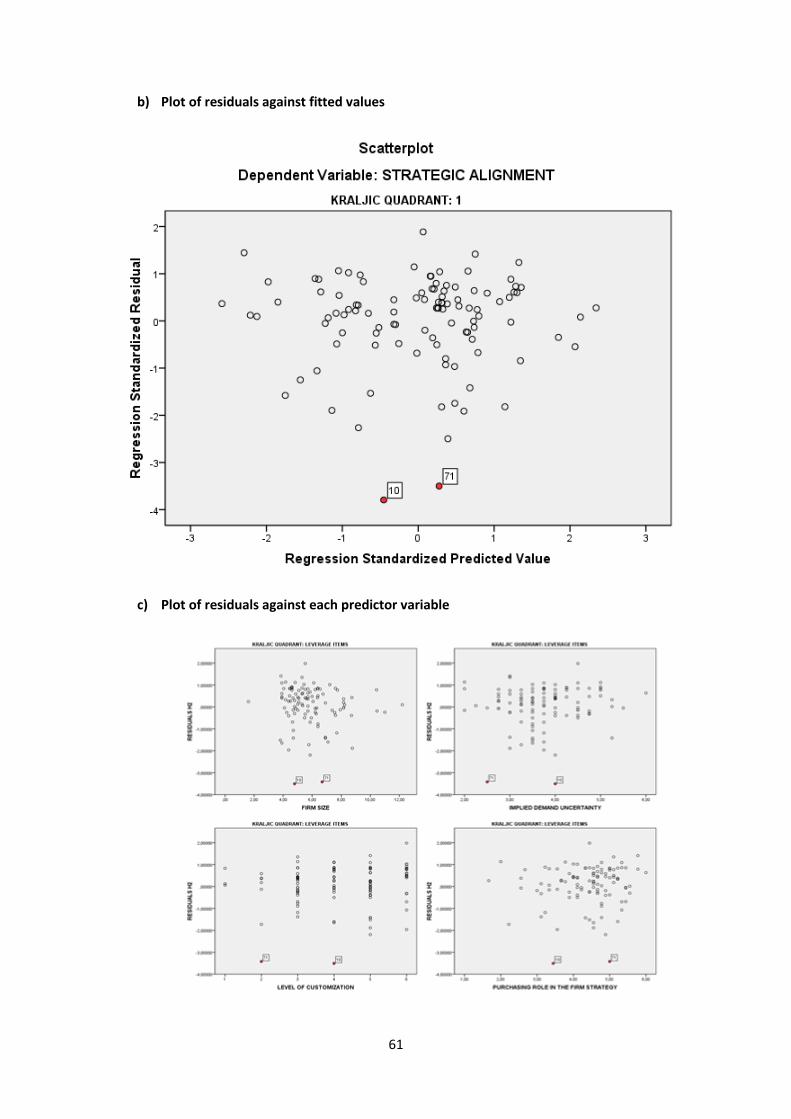
61
b) Plot of residuals against fitted values
c) Plot of residuals against each predictor variable
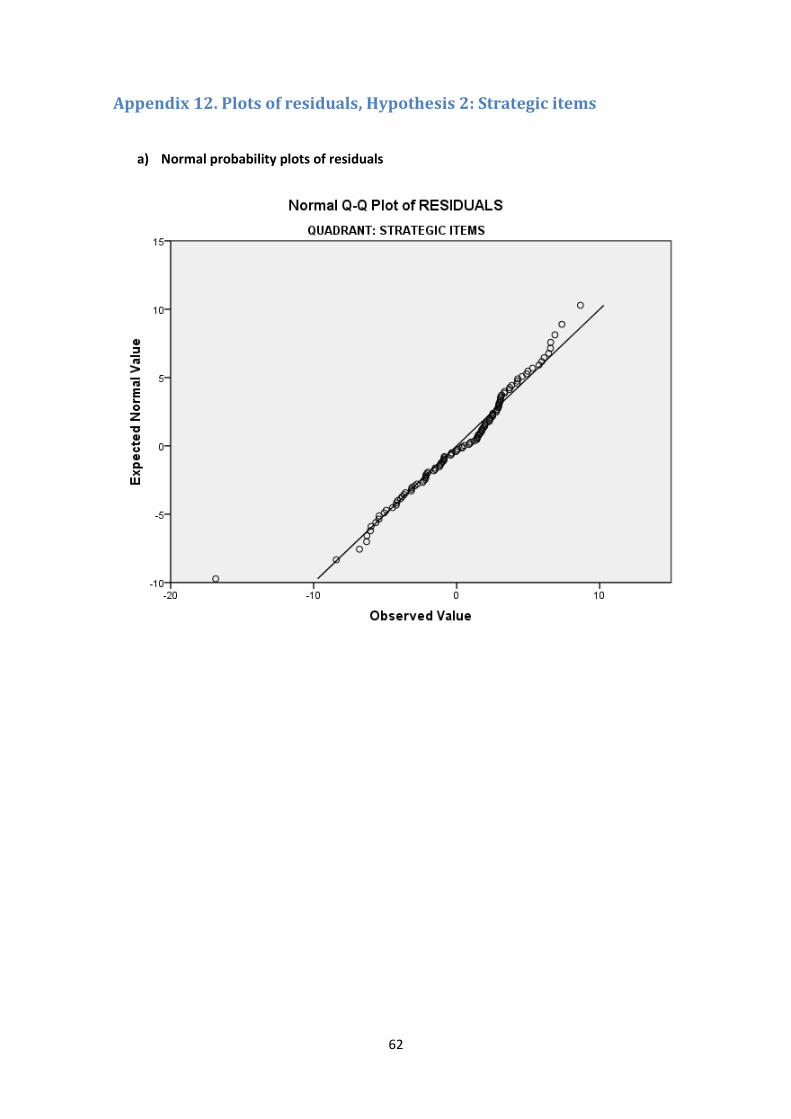
62
Appendix 12. Plots of residuals, Hypothesis 2: Strategic items
a) Normal probability plots of residuals
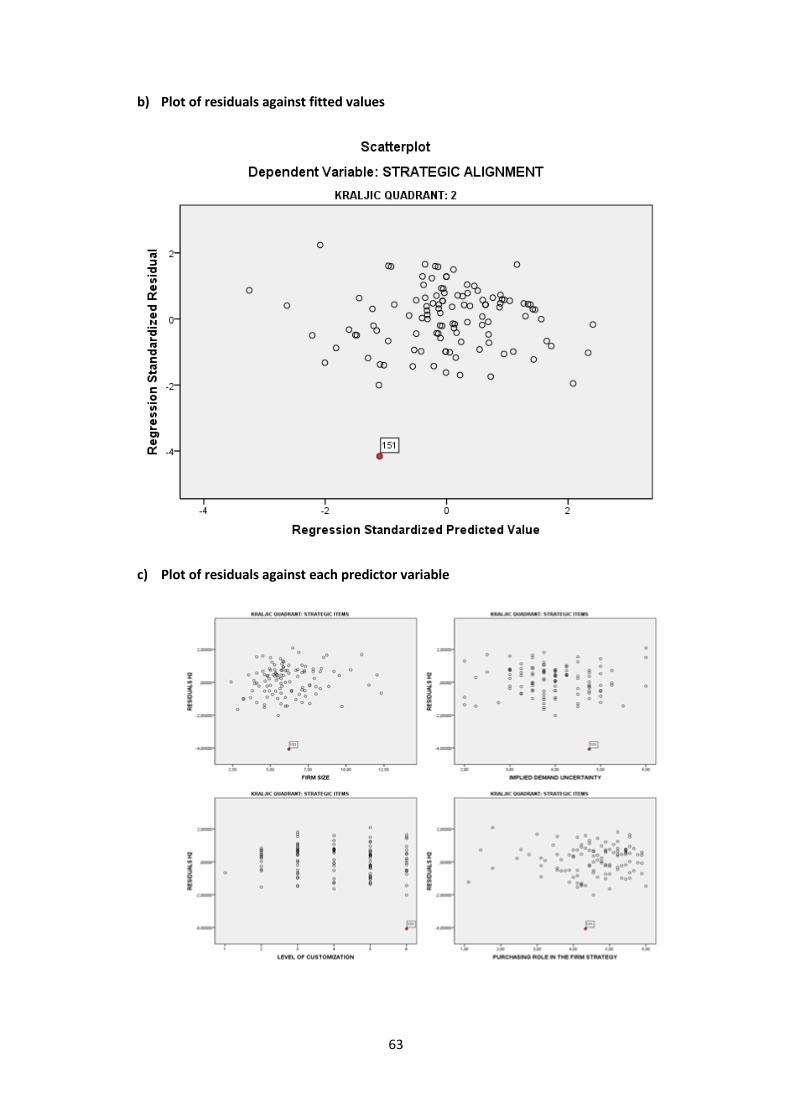
63
b) Plot of residuals against fitted values
c) Plot of residuals against each predictor variable
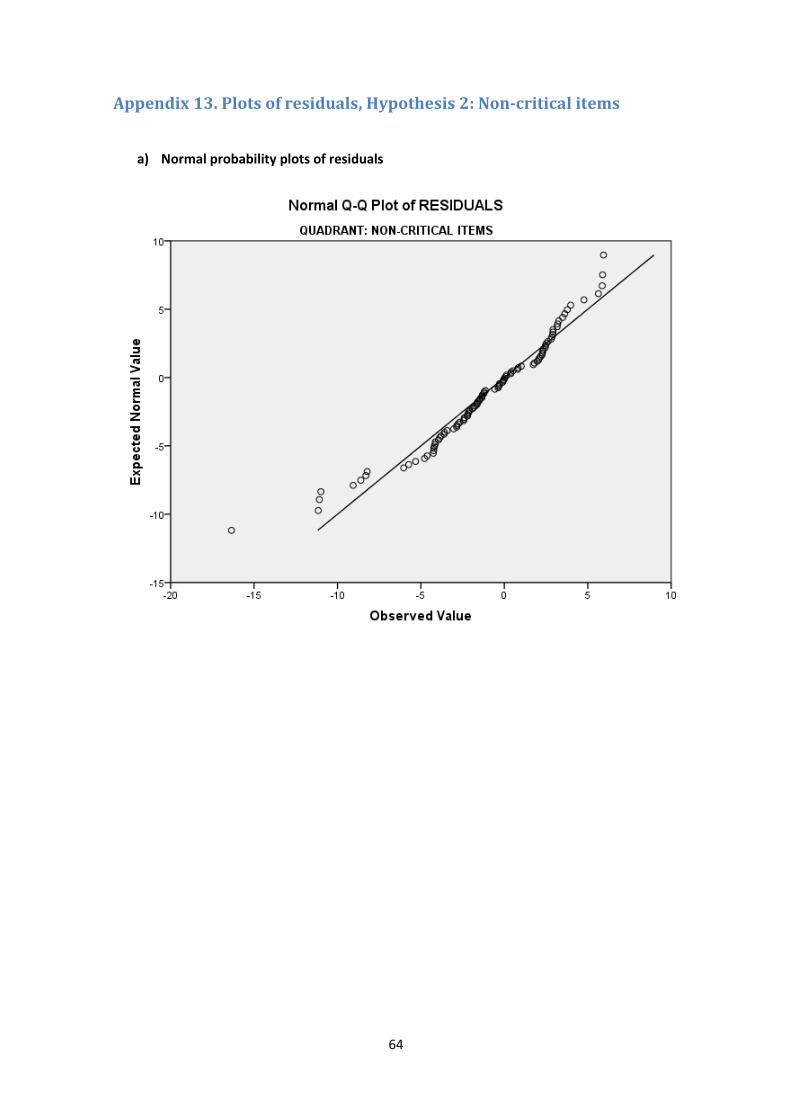
64
Appendix 13. Plots of residuals, Hypothesis 2: Non-critical items
a) Normal probability plots of residuals
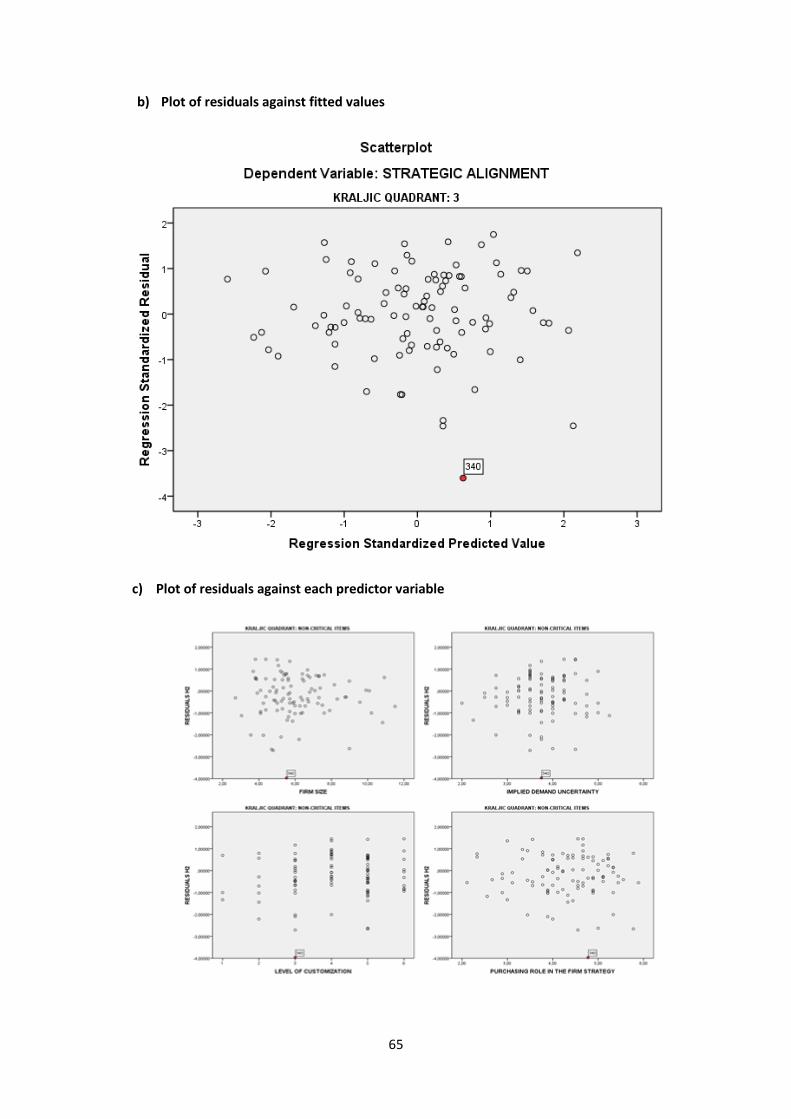
65
b) Plot of residuals against fitted values
c) Plot of residuals against each predictor variable
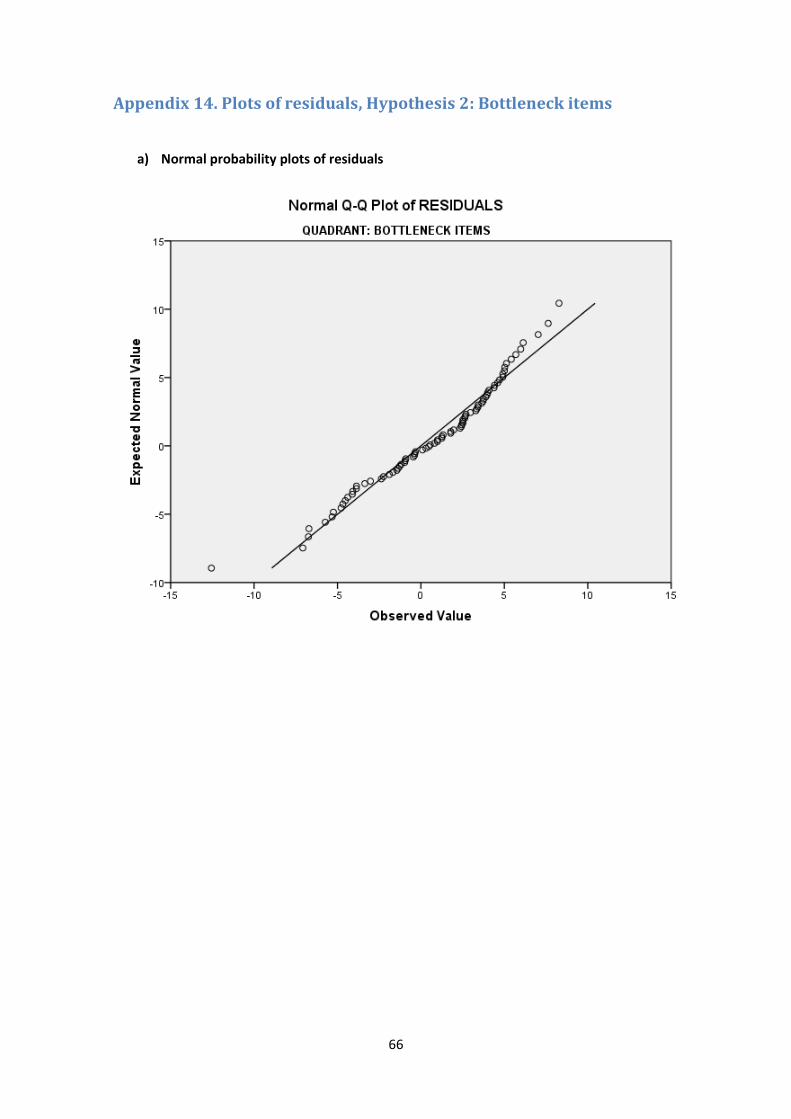
66
Appendix 14. Plots of residuals, Hypothesis 2: Bottleneck items
a) Normal probability plots of residuals
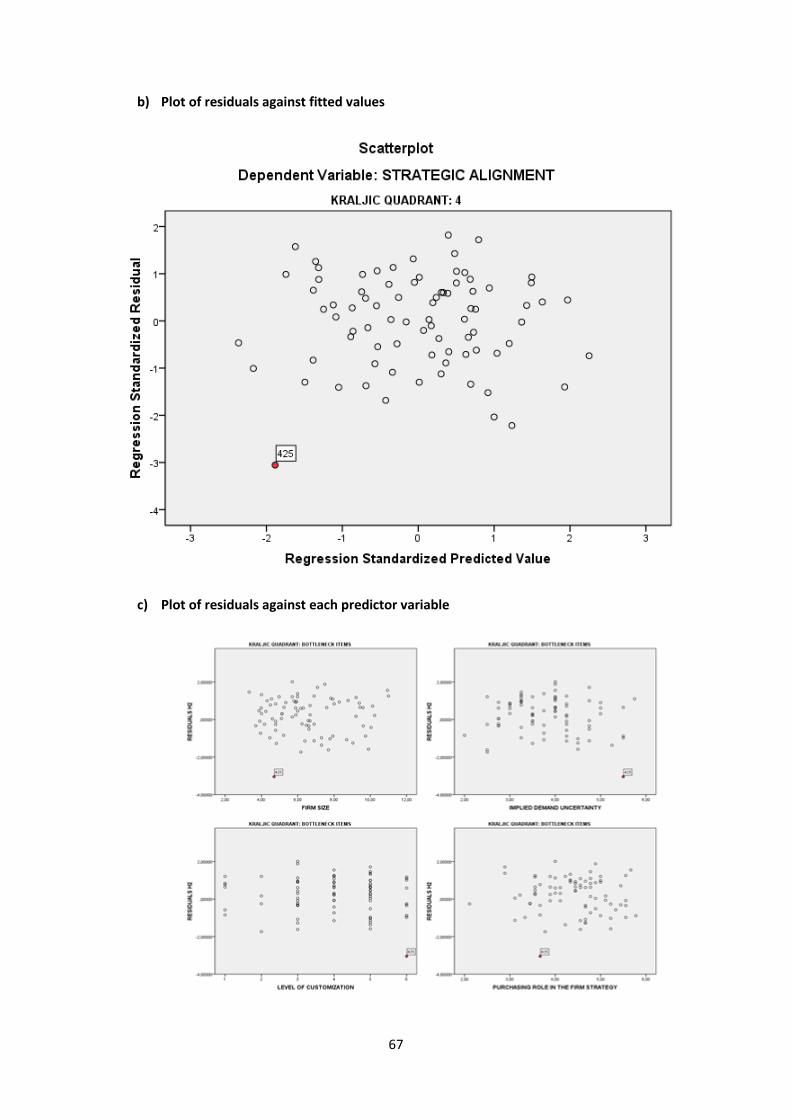
67
b) Plot of residuals against fitted values
c) Plot of residuals against each predictor variable
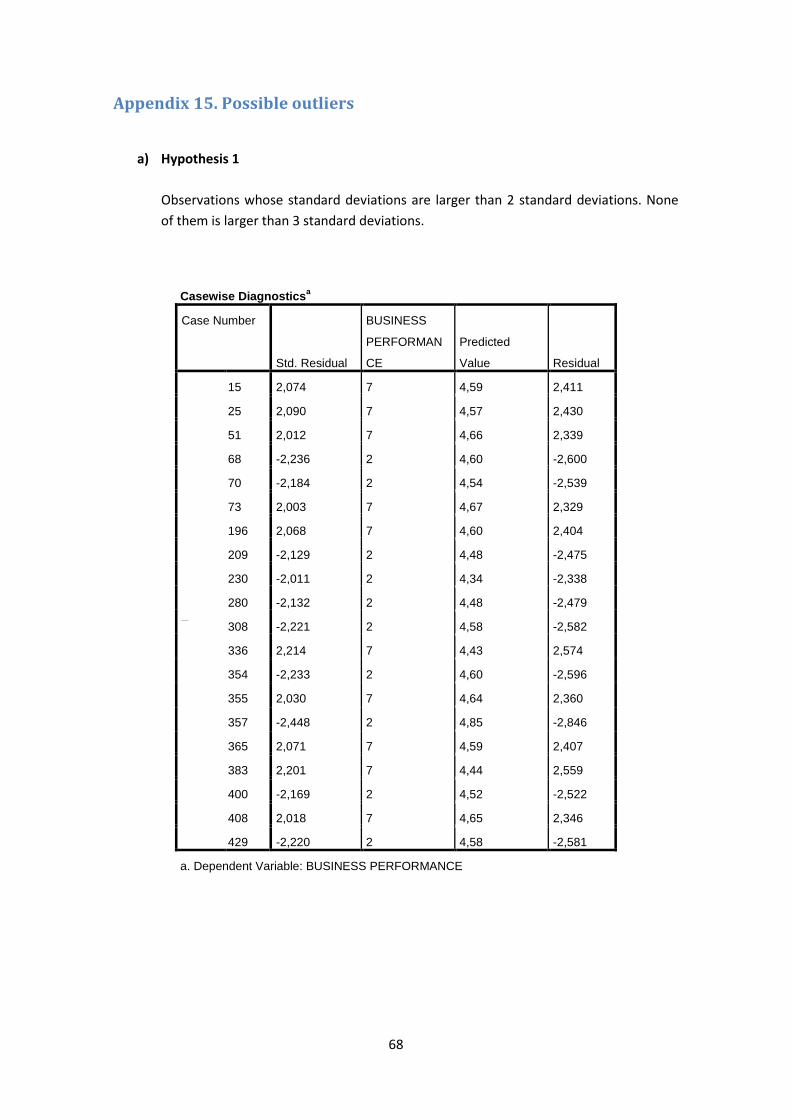
68
Appendix 15. Possible outliers
a) Hypothesis 1
Observations whose standard deviations are larger than 2 standard deviations. None
of them is larger than 3 standard deviations.
Casewise Diagnosticsa
Case Number
Std. Residual
BUSINESS
PERFORMAN
CE
Predicted
Value Residual
dimension0
15 2,074 7 4,59 2,411
25 2,090 7 4,57 2,430
51 2,012 7 4,66 2,339
68 -2,236 2 4,60 -2,600
70 -2,184 2 4,54 -2,539
73 2,003 7 4,67 2,329
196 2,068 7 4,60 2,404
209 -2,129 2 4,48 -2,475
230 -2,011 2 4,34 -2,338
280 -2,132 2 4,48 -2,479
308 -2,221 2 4,58 -2,582
336 2,214 7 4,43 2,574
354 -2,233 2 4,60 -2,596
355 2,030 7 4,64 2,360
357 -2,448 2 4,85 -2,846
365 2,071 7 4,59 2,407
383 2,201 7 4,44 2,559
400 -2,169 2 4,52 -2,522
408 2,018 7 4,65 2,346
429 -2,220 2 4,58 -2,581
a. Dependent Variable: BUSINESS PERFORMANCE
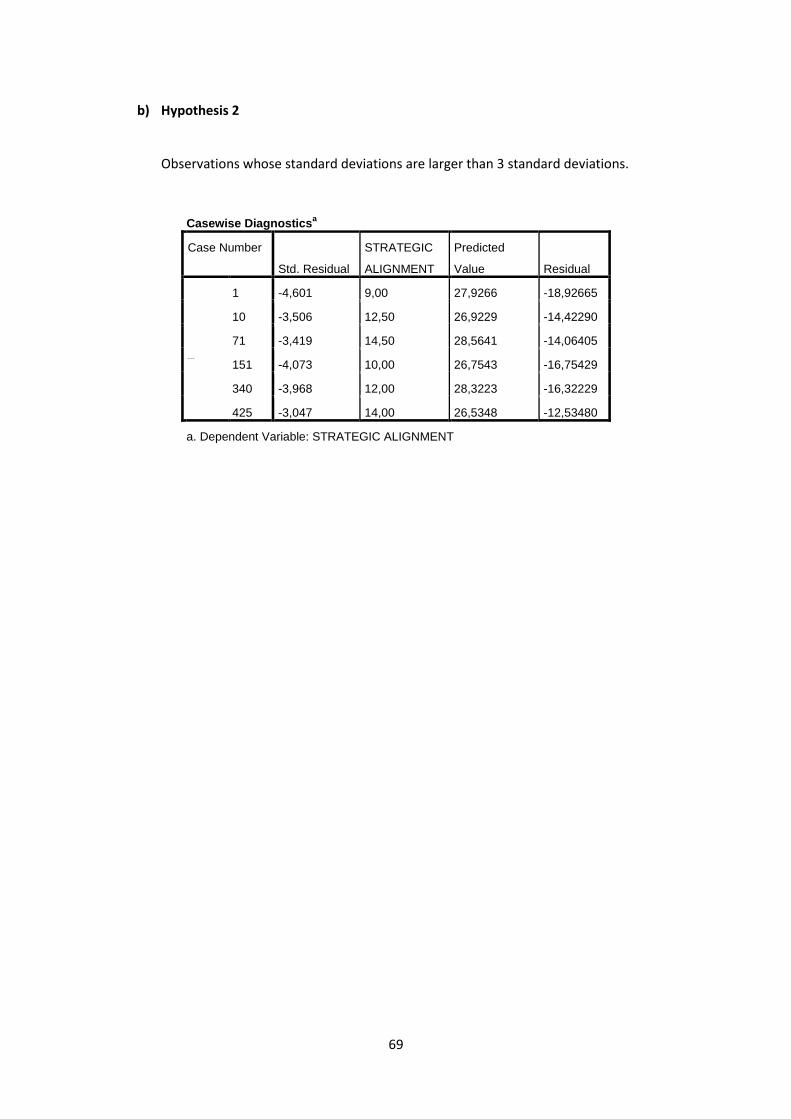
69
b) Hypothesis 2
Observations whose standard deviations are larger than 3 standard deviations.
Casewise Diagnosticsa
Case Number
Std. Residual
STRATEGIC
ALIGNMENT
Predicted
Value Residual
dimension0
1 -4,601 9,00 27,9266 -18,92665
10 -3,506 12,50 26,9229 -14,42290
71 -3,419 14,50 28,5641 -14,06405
151 -4,073 10,00 26,7543 -16,75429
340 -3,968 12,00 28,3223 -16,32229
425 -3,047 14,00 26,5348 -12,53480
a. Dependent Variable: STRATEGIC ALIGNMENT

70