Embed Size (px)
Citation preview
International Business Research; Vol. 8, No. 2; 2015
ISSN 1913-9004 E-ISSN 1913-9012
Published by Canadian Center of Science and Education
181
The Study of Measuring China’s Agricultural Export Cost to the
United States and Its Impact on Trade Growth
Aiping Yao1 & Liping Wan
1,2
1 College of Economics and Management, Southwest University, Chongqing, P.R. China
2 College of Medicine Information, Chongqing Medical University, Chongqing, P.R. China
Correspondence: Liping Wan, College of Medicine Information, Chongqing Medical University, Chongqing
400016, China. Tel: 86-139-8335-8586. E-mail: [email protected]
Received: November 8, 2014 Accepted: December 1, 2014 Online Published: January 25, 2015
doi:10.5539/ibr.v8n2p181 URL: http://dx.doi.org/10.5539/ibr.v8n2p181
Abstract
This paper is based on the studies of Andersen and Van Wincoop (2003) and Abulaiti Yiming (2013) to construct
unilateral trade model to analyze the trend of China’s agricultural export cost to the United States and its impact
on export growth. The results show that: After joining the WTO, the trend of China’s agricultural export cost to
the United States is the first dropping then rising. Although the overall magnitude of change is slow, its
contribution rate is great to China’s agricultural export growth to the United States.
Keywords: agriculture products, gravity model, export cost, trade growth
1. Introduction
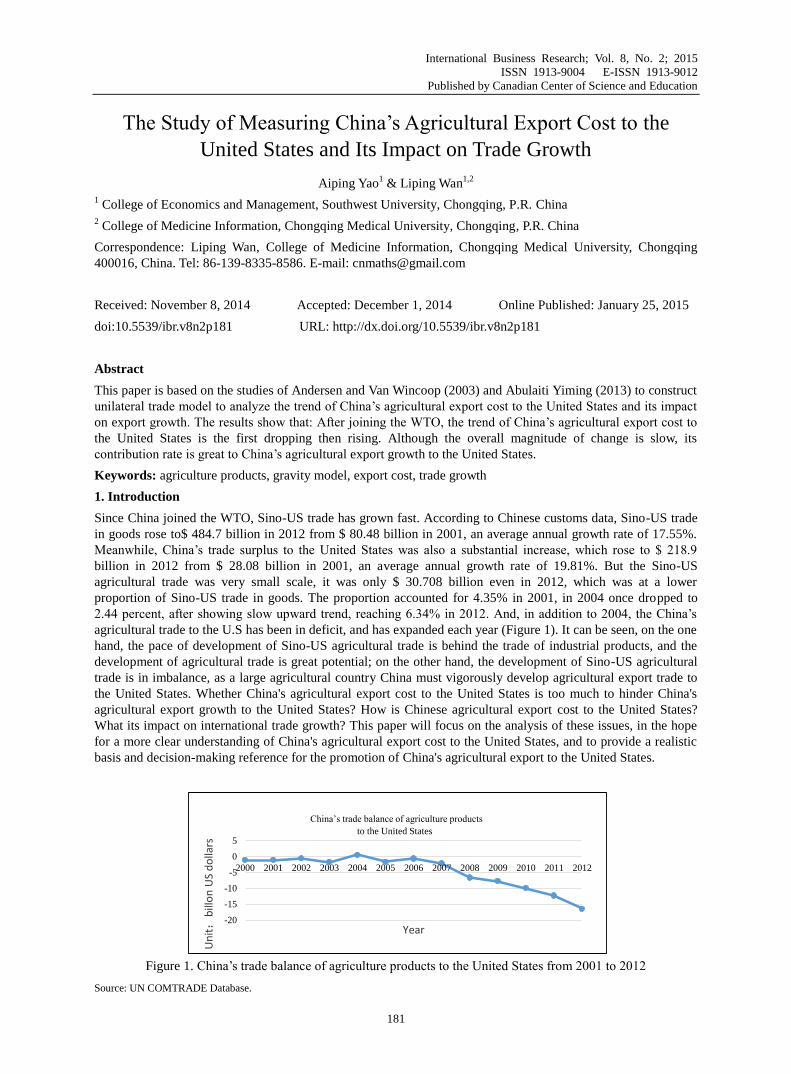
Since China joined the WTO, Sino-US trade has grown fast. According to Chinese customs data, Sino-US trade
in goods rose to$ 484.7 billion in 2012 from $ 80.48 billion in 2001, an average annual growth rate of 17.55%.
Meanwhile, China’s trade surplus to the United States was also a substantial increase, which rose to $ 218.9
billion in 2012 from $ 28.08 billion in 2001, an average annual growth rate of 19.81%. But the Sino-US
agricultural trade was very small scale, it was only $ 30.708 billion even in 2012, which was at a lower
proportion of Sino-US trade in goods. The proportion accounted for 4.35% in 2001, in 2004 once dropped to
2.44 percent, after showing slow upward trend, reaching 6.34% in 2012. And, in addition to 2004, the China’s
agricultural trade to the U.S has been in deficit, and has expanded each year (Figure 1). It can be seen, on the one
hand, the pace of development of Sino-US agricultural trade is behind the trade of industrial products, and the
development of agricultural trade is great potential; on the other hand, the development of Sino-US agricultural
trade is in imbalance, as a large agricultural country China must vigorously develop agricultural export trade to
the United States. Whether China's agricultural export cost to the United States is too much to hinder China's
agricultural export growth to the United States? How is Chinese agricultural export cost to the United States?
What its impact on international trade growth? This paper will focus on the analysis of these issues, in the hope
for a more clear understanding of China's agricultural export cost to the United States, and to provide a realistic
basis and decision-making reference for the promotion of China's agricultural export to the United States.
Figure 1. China’s trade balance of agriculture products to the United States from 2001 to 2012
Source: UN COMTRADE Database.
-20
-15
-10
-5
0
5
2000 2001 2002 2003 2004 2005 2006 2007 2008 2009 2010 2011 2012
Un
it:
bill
on
US
do
llars
Year
China’s trade balance of agriculture products
to the United States
www.ccsenet.org/ibr International Business Research Vol. 8, No. 2; 2015
182
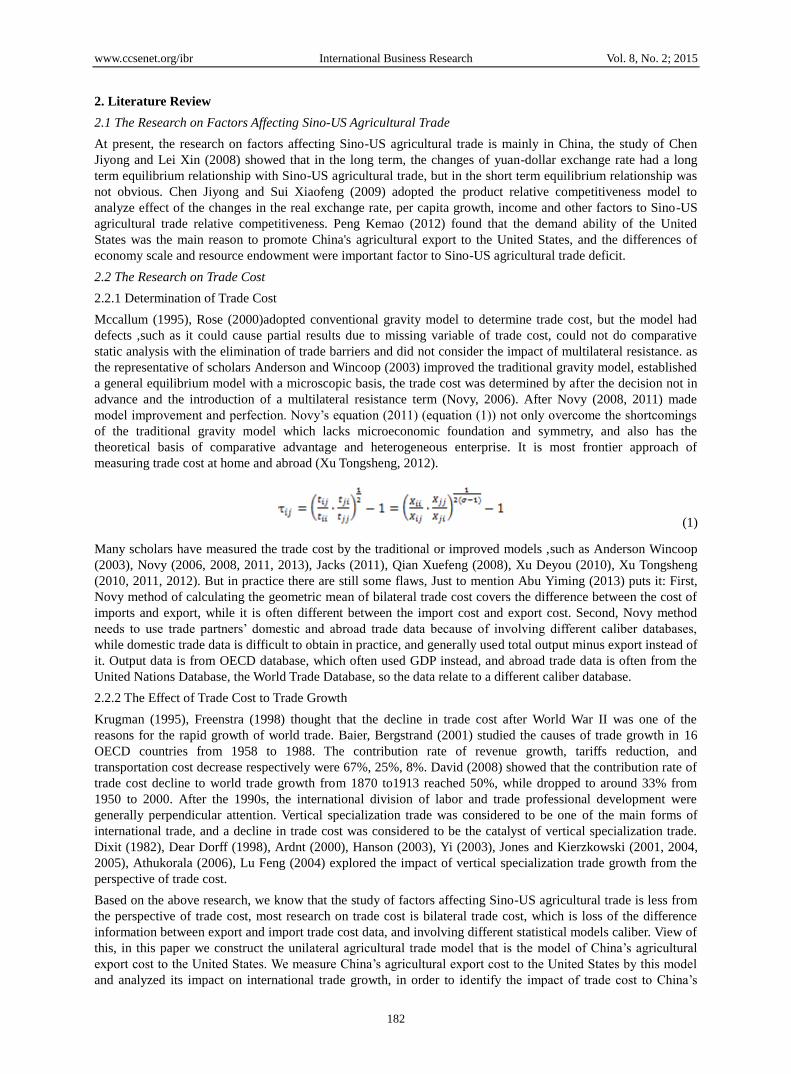
2. Literature Review
2.1 The Research on Factors Affecting Sino-US Agricultural Trade
At present, the research on factors affecting Sino-US agricultural trade is mainly in China, the study of Chen
Jiyong and Lei Xin (2008) showed that in the long term, the changes of yuan-dollar exchange rate had a long
term equilibrium relationship with Sino-US agricultural trade, but in the short term equilibrium relationship was
not obvious. Chen Jiyong and Sui Xiaofeng (2009) adopted the product relative competitiveness model to
analyze effect of the changes in the real exchange rate, per capita growth, income and other factors to Sino-US
agricultural trade relative competitiveness. Peng Kemao (2012) found that the demand ability of the United
States was the main reason to promote China's agricultural export to the United States, and the differences of
economy scale and resource endowment were important factor to Sino-US agricultural trade deficit.
2.2 The Research on Trade Cost
2.2.1 Determination of Trade Cost
Mccallum (1995), Rose (2000)adopted conventional gravity model to determine trade cost, but the model had
defects ,such as it could cause partial results due to missing variable of trade cost, could not do comparative
static analysis with the elimination of trade barriers and did not consider the impact of multilateral resistance. as
the representative of scholars Anderson and Wincoop (2003) improved the traditional gravity model, established
a general equilibrium model with a microscopic basis, the trade cost was determined by after the decision not in
advance and the introduction of a multilateral resistance term (Novy, 2006). After Novy (2008, 2011) made
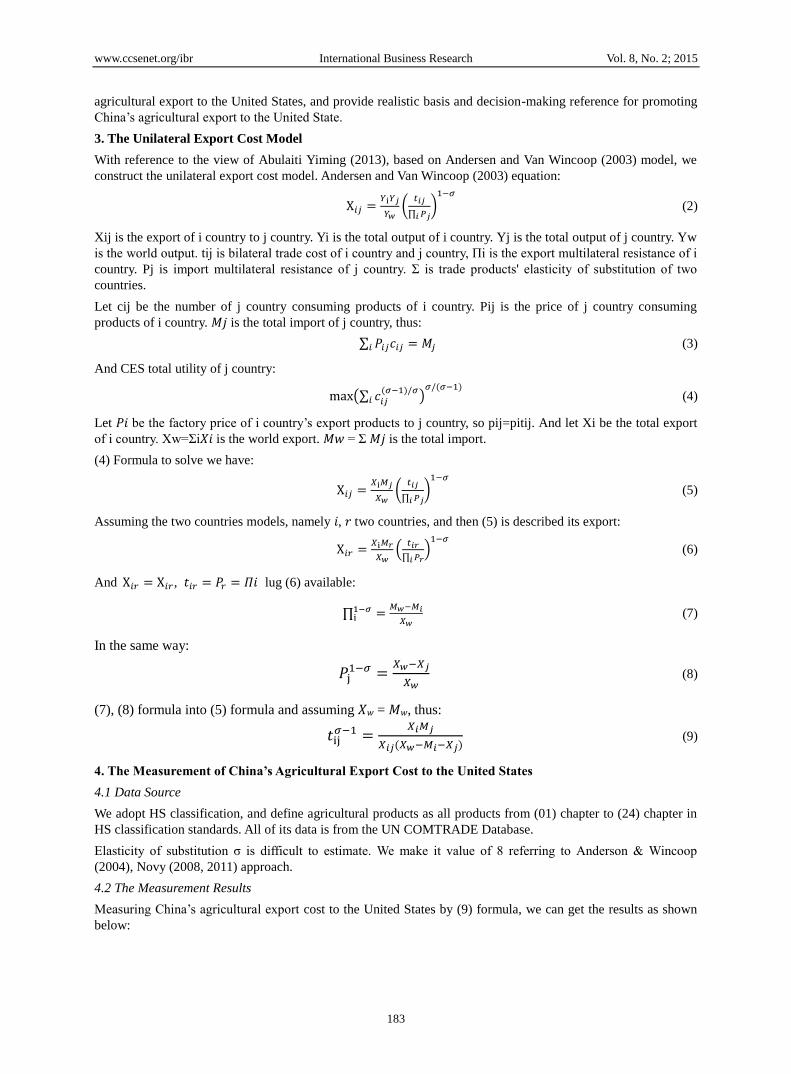
model improvement and perfection. Novy’s equation (2011) (equation (1)) not only overcome the shortcomings
of the traditional gravity model which lacks microeconomic foundation and symmetry, and also has the
theoretical basis of comparative advantage and heterogeneous enterprise. It is most frontier approach of
measuring trade cost at home and abroad (Xu Tongsheng, 2012).
(1)
Many scholars have measured the trade cost by the traditional or improved models ,such as Anderson Wincoop
(2003), Novy (2006, 2008, 2011, 2013), Jacks (2011), Qian Xuefeng (2008), Xu Deyou (2010), Xu Tongsheng
(2010, 2011, 2012). But in practice there are still some flaws, Just to mention Abu Yiming (2013) puts it: First,
Novy method of calculating the geometric mean of bilateral trade cost covers the difference between the cost of
imports and export, while it is often different between the import cost and export cost. Second, Novy method
needs to use trade partners’ domestic and abroad trade data because of involving different caliber databases,
while domestic trade data is difficult to obtain in practice, and generally used total output minus export instead of
it. Output data is from OECD database, which often used GDP instead, and abroad trade data is often from the
United Nations Database, the World Trade Database, so the data relate to a different caliber database.
2.2.2 The Effect of Trade Cost to Trade Growth
Krugman (1995), Freenstra (1998) thought that the decline in trade cost after World War II was one of the
reasons for the rapid growth of world trade. Baier, Bergstrand (2001) studied the causes of trade growth in 16
OECD countries from 1958 to 1988. The contribution rate of revenue growth, tariffs reduction, and
transportation cost decrease respectively were 67%, 25%, 8%. David (2008) showed that the contribution rate of
trade cost decline to world trade growth from 1870 to1913 reached 50%, while dropped to around 33% from
1950 to 2000. After the 1990s, the international division of labor and trade professional development were
generally perpendicular attention. Vertical specialization trade was considered to be one of the main forms of
international trade, and a decline in trade cost was considered to be the catalyst of vertical specialization trade.
Dixit (1982), Dear Dorff (1998), Ardnt (2000), Hanson (2003), Yi (2003), Jones and Kierzkowski (2001, 2004,
2005), Athukorala (2006), Lu Feng (2004) explored the impact of vertical specialization trade growth from the
perspective of trade cost.
Based on the above research, we know that the study of factors affecting Sino-US agricultural trade is less from
the perspective of trade cost, most research on trade cost is bilateral trade cost, which is loss of the difference
information between export and import trade cost data, and involving different statistical models caliber. View of
this, in this paper we construct the unilateral agricultural trade model that is the model of China’s agricultural
export cost to the United States. We measure China’s agricultural export cost to the United States by this model
and analyzed its impact on international trade growth, in order to identify the impact of trade cost to China’s
www.ccsenet.org/ibr International Business Research Vol. 8, No. 2; 2015
183
agricultural export to the United States, and provide realistic basis and decision-making reference for promoting
China’s agricultural export to the United State.
3. The Unilateral Export Cost Model
With reference to the view of Abulaiti Yiming (2013), based on Andersen and Van Wincoop (2003) model, we
construct the unilateral export cost model. Andersen and Van Wincoop (2003) equation:
(
∏ )
(2)
Xij is the export of i country to j country. Yi is the total output of i country. Yj is the total output of j country. Yw
is the world output. tij is bilateral trade cost of i country and j country, Πi is the export multilateral resistance of i
country. Pj is import multilateral resistance of j country. Σ is trade products' elasticity of substitution of two
countries.
Let cij be the number of j country consuming products of i country. Pij is the price of j country consuming
products of i country. 𝑀𝑗 is the total import of j country, thus:
∑ 𝑀 (3)
And CES total utility of j country:
(∑
)
(4)
Let 𝑖 be the factory price of i country’s export products to j country, so pij=pitij. And let Xi be the total export
of i country. Xw=Σi𝑋𝑖 is the world export. 𝑀𝑤 = Σ 𝑀𝑗 is the total import.
(4) Formula to solve we have:
(
∏ )
(5)
Assuming the two countries models, namely 𝑖, 𝑟 two countries, and then (5) is described its export:
(
∏ )
(6)
And , 𝑖 lug (6) available:
∏
(7)
In the same way:
(8)
(7), (8) formula into (5) formula and assuming 𝑋𝑤 = 𝑀𝑤, thus:
(9)
4. The Measurement of China’s Agricultural Export Cost to the United States
4.1 Data Source
We adopt HS classification, and define agricultural products as all products from (01) chapter to (24) chapter in
HS classification standards. All of its data is from the UN COMTRADE Database.
Elasticity of substitution σ is difficult to estimate. We make it value of 8 referring to Anderson & Wincoop
(2004), Novy (2008, 2011) approach.
4.2 The Measurement Results
Measuring China’s agricultural export cost to the United States by (9) formula, we can get the results as shown
below:
www.ccsenet.org/ibr International Business Research Vol. 8, No. 2; 2015
184
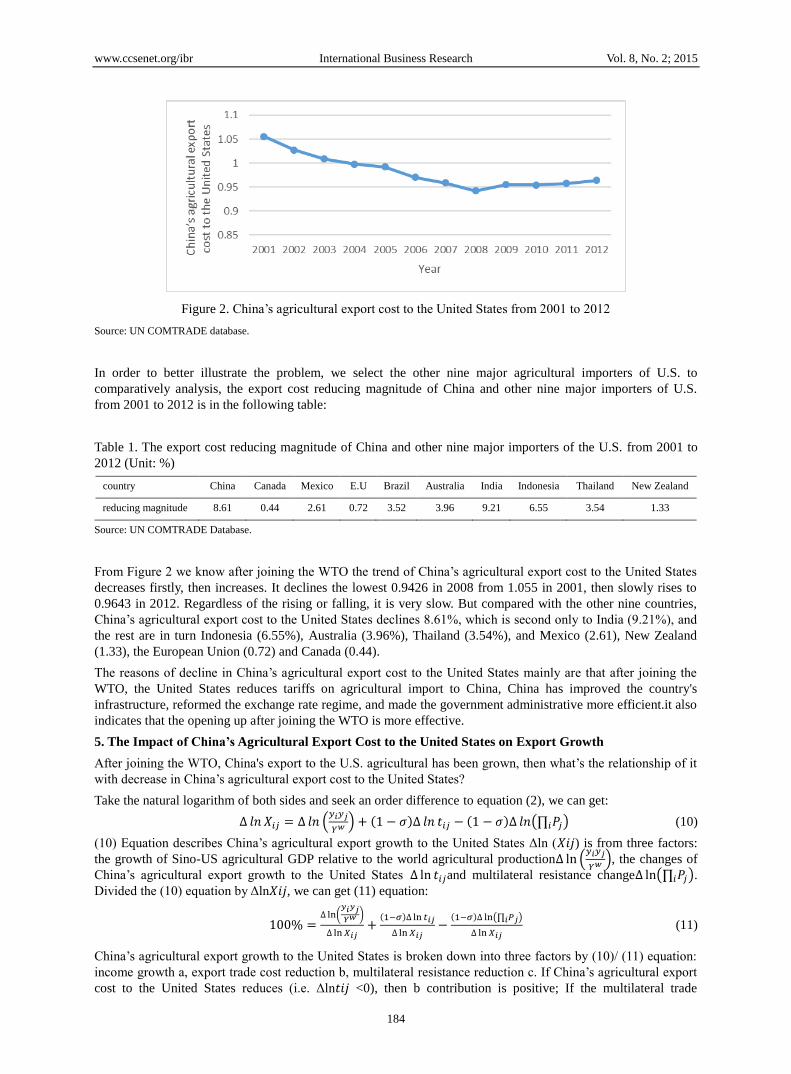
Figure 2. China’s agricultural export cost to the United States from 2001 to 2012
Source: UN COMTRADE database.
In order to better illustrate the problem, we select the other nine major agricultural importers of U.S. to
comparatively analysis, the export cost reducing magnitude of China and other nine major importers of U.S.
from 2001 to 2012 is in the following table:
Table 1. The export cost reducing magnitude of China and other nine major importers of the U.S. from 2001 to
2012 (Unit: %)
country China Canada Mexico E.U Brazil Australia India Indonesia Thailand New Zealand
reducing magnitude 8.61 0.44 2.61 0.72 3.52 3.96 9.21 6.55 3.54 1.33
Source: UN COMTRADE Database.
From Figure 2 we know after joining the WTO the trend of China’s agricultural export cost to the United States
decreases firstly, then increases. It declines the lowest 0.9426 in 2008 from 1.055 in 2001, then slowly rises to
0.9643 in 2012. Regardless of the rising or falling, it is very slow. But compared with the other nine countries,
China’s agricultural export cost to the United States declines 8.61%, which is second only to India (9.21%), and
the rest are in turn Indonesia (6.55%), Australia (3.96%), Thailand (3.54%), and Mexico (2.61), New Zealand
(1.33), the European Union (0.72) and Canada (0.44).
The reasons of decline in China’s agricultural export cost to the United States mainly are that after joining the
WTO, the United States reduces tariffs on agricultural import to China, China has improved the country's
infrastructure, reformed the exchange rate regime, and made the government administrative more efficient.it also
indicates that the opening up after joining the WTO is more effective.
5. The Impact of China’s Agricultural Export Cost to the United States on Export Growth
After joining the WTO, China's export to the U.S. agricultural has been grown, then what’s the relationship of it
with decrease in China’s agricultural export cost to the United States?
Take the natural logarithm of both sides and seek an order difference to equation (2), we can get:
𝑋 (
) (∏ ) (10)
(10) Equation describes China’s agricultural export growth to the United States Δln (𝑋𝑖𝑗) is from three factors:
the growth of Sino-US agricultural GDP relative to the world agricultural production (
), the changes of
China’s agricultural export growth to the United States and multilateral resistance change (∏ ).
Divided the (10) equation by Δln𝑋𝑖𝑗, we can get (11) equation:
(
)
(∏ )
(11)
China’s agricultural export growth to the United States is broken down into three factors by (10)/ (11) equation:
income growth a, export trade cost reduction b, multilateral resistance reduction c. If China’s agricultural export
cost to the United States reduces (i.e. Δln 𝑖𝑗 <0), then b contribution is positive; If the multilateral trade
www.ccsenet.org/ibr International Business Research Vol. 8, No. 2; 2015
185
resistance decreases (Δln (Π𝑖 𝑗) <0), then c contribution is negative. As a result, the agricultural export growth
of China and the main competitors in the U.S. market is decomposed, and the results are shown in Table 2:
Table 2. The decomposition of agricultural export growth of China and the main competitors in the U.S. market
(Unit: %)
country ETR RGR ETCR MTRR
China 490.64 43.35 85.37 -28.72
Canada 86.85 73.05 -1.42% 28.36
Brazil 152.67 66.55 32.93 0.52
Mexico 383.45 -163.76 30 233.77
Australia 45.76 90.98 159.9 -150.88
India 746.06 92.23 28.75 -20.98
Indonesia 224.11 60.03 -265.17 305.14
Thailand 88.09 264.06 -11.31 -152.75
New Zealand 112.76 202.96 7.15 -110.1
E.U 86.98 196.55 44.1 -140.64
Note. ETR- Export trade growth; RGR-Revenue growth rate; ETCR-The contribution rate of export trade cost ’reduction; MTRR- The
contribution rate of multilateral trade resistance ‘reduction.
As it can be seen from Table 2:
First, a decline in China’s agricultural export cost to the United States and revenue growth are mainly reasons.
The contribution rate of China’s agricultural export cost to the United States is higher, and it is 85.37 percent.
China's export trade grew 43.35% from revenue growth. A decline in China's multilateral trade resistance against
China’s agricultural export to the United States has a trade diversion effect, the contribution rate is -28.72%.
Despite the contribution rate of a decline in China’s agricultural export cost to the United States is 85.37%,
because of its multilateral resistance decreased significantly, ultimately the contribution rate of trade cost e is
37.06%. (85.37% -28.72% = 56.65%).
Second, compared with other major agricultural importers of U.S. except for India, China’s agricultural export
growth to the United States is the fastest, and the growth rate is 490.64%. However, the contribution rate of
revenue growth, a decline in agricultural export cost to the United States and a decline in multilateral trade
resistance of the United States are different to agricultural export growth to the United States. The agricultural
export growth to the United States of Australia and china are mainly from the decline in agricultural export cost
to the United States. Thailand, New Zealand, the EU, India, Canada, Brazil are mainly from revenue growth.
Mexico, Indonesia are mainly from a decline in multilateral trade resistance.
6. Discussion
From the above study, we can get:
First, after joining the WTO, the trend of China’s agricultural export cost to the United States decreases firstly,
then increases. Although the overall magnitude of change is slow, compared with other major importers of the
United States, China’s agricultural export cost to the United States decreases greatly, only inferior to India.
Second, after joining the WTO, more than half of China’s agricultural export growth to the United States are due
to a decline in agricultural export cost to the United States and a decline in multilateral trade resistance.
Third, compared with other major agricultural importers of the United States, the contribution rate of China’s
agricultural export cost to the United States is higher, second only to Australia.
Acknowledgments
The authors are very grateful to Professor Chen Jiyong’s guidance on this paper. And it is supported by the
Fundamental Research Funds for the Central Universities (SWU1209384, SWU1409432) and the National
Social Science Foundation (13CJY081).
www.ccsenet.org/ibr International Business Research Vol. 8, No. 2; 2015
186
References
Anderson, J. E., & Van Wincoop, E. (2003). Gravity with gravitas: A solution to the border puzzle. American
Economic Review, 93(1), 170–192. http://dx.doi.org/10.1257/000282803321455214
Anderson, J. E., & Van Wincoop, E. (2004). Trade costs. Journal of Economics Literature, 42(3), 691–751.
http://dx.doi.org/10.3386/w10480
Bin, J. (2012). The study of China's agricultural products trade barriers from the United States. Agriculture in the
World, (8), 30–32. http://dx.doi.org/10.3969/j.issn.1002-4433.2012.08.007
Hummels, D. (2001). Toward geography of trade Costs. Doctoral dissertation, Purdue University, Mimeo,
America. Retrieved from http://dx.doi.org/10.2139/ssrn.160533
Jacks, D. S., Christopher, M. M., & Novy, D. (2011). Trade Booms, Trade Busts and Trade Costs. Journal of
International Economics, 83(2), 185–201. http://dx.doi.org/10.3386/w15267
Jiyong, C., & Xiaofeng, S. (2009). The research on the Sino-US agricultural trade relatively competitive factors.
Journal of Capital Economic and Trade University, (1), 16–19.
http://dx.doi.org/10.3969/J.issn.1008-2700.2009.01.010
Jiyong, C., & Xin, L. (2008). The relationship of Sino-US agricultural trade balance and the Yuan against the
Dollar. The Asia-Pacific Economic, (3), 16–19. http://dx.doi.org/10.3969/j.issn.1000-6052.2008.03.010
Limão, N., & Venables, A. J. (2001). Infrastructure, geographical disadvantage, transport costs and trade. The
World Bank Economic Review, 15(3), 451–479. http://dx.doi.org/10.1093/wber/15.3.451
McCallum, J. (1995). Canada-U.S. regional trade patterns. American Economic Review, 85(3), 615–623.
http://dx.doi.org/10.1111/1467-9396.00158
Novy, D. (2006). Is the iceberg less quickly? International trade costs after World War II. Master’s thesis,
University of Warwick, Mimeo, America. http://dx.doi.org/10.2139/ssrn.944421
Novy, D. (2011). Gravity redux: Measuring international trade costs with panel data. Doctoral dissertation,
University of Warwick, Mimeo, America.
Rose, A. K. (2000). One money, one market: Estimating the effect of common currencies on trade. Economic
Policy, 15(30), 7–46. http://dx.doi.org/10.3386/w7432
Tongsheng, X. (2011). Measuring the trade cost of Chinese manufacturing industries. China Industrial
Economics, (7), 15–25. http://dx.doi.org 10.3969/j.issn.1004-518X.2013.01.008
Copyrights
Copyright for this article is retained by the author(s), with first publication rights granted to the journal.
This is an open-access article distributed under the terms and conditions of the Creative Commons Attribution
license (http://creativecommons.org/licenses/by/3.0/).