Embed Size (px)
Citation preview
6
The Support of Geomatics in Glacier Monitoring: The Contribution
of Terrestrial Laser Scanner
Danilo Godone1 and Franco Godone2 1Turin University, Faculty of Agriculture, Deiafa Department / NATRISK,
Research Centre on Natural Risks in Mountain and Hilly Environments 2National Research Council, Research Institute for Geo-Hydrological Protection
Italy
1. Introduction
Worldwide glacier monitoring was initiated more than a century ago and it is now
integrated into global climate-related observation systems. Glacier mass changes have been
clearly recognised as high-confidence climate indicators with respect to early detection
strategies of greenhouse effects on climate (Hoelze et al. 2003).
Combinations of in-situ observations with remotely sensed data, traditional measurements
with new technologies, are an integrated and multi-level strategy applied to the worldwide
glacier monitoring within major climatic zones by the international institution of the Global
Terrestrial Network for Glaciers (GTN-G) and Global Terrestrial Observing System (GTOS)
(Haeberli et al., 2005).
Many examples of successful applications of space-borne synthetic aperture radar
interferometry (InSAR) are available in the scientific literature of the last decades applied to
detection of ground surface deformations (induced by seismic or volcanic activities) and for
monitoring of glacier motion (Wasowski & Gostelow, 1999; Massonet & Feigl, 1998)
The applications of Ground Remote Monitoring techniques (Ground Based - Synthetic
Aperture Radar (GB-SAR) and Terrestrial Laser Scanner (TLS) for extraction of topography
and flow properties of glaciers are less frequent.
As reported by Sailer et al. (2005), the observational parameters include “accurate
topographic data of the observed target and its surroundings, as well as of the terrain that
may be affected down-streams of a glacier by floods or avalanches. Depending on the size
and accessibility of the area to be observed and on the repeat interval, satellite-borne,
airborne or ground based imaging sensors or scanners (InSAR, photogrammetry, GB-SAR,
terrestrial laser scanner - TLS) are the preferable observational tools”.
Even in the above mentioned work, three types of basic observational requirements for each
of the glacial hazard type are mentioned:
www.intechopen.com
Laser Scanner Technology
94
base maps (extent of glaciers, glacial lakes, surface morphology);
topographic data (DEM);
surface motion (of glacier and/or moraine).
This chapter shows the methodology and application results of the Terrestrial Laser Scanner for the extraction of topographic data and surface motion at the Belvedere Glacier, in Italian Alps.
The monitoring campaigns have been performed in Summer/Autumn 2006 and 2007 and they consist on measurements of the central/lower part of the glacial body, of the glacier snout and measurement of a landslide (the Locce landslides), affecting the terminal moraine of the Locce Glacier, tributary on the right side of the Belvedere Glacier.
2. The Belvedere glacier
The Belvedere Glacier (WGI code I4L01211009) is located in the Anzasca valley, Macugnaga (45°58′ N, 7°58′ E), in the north-eastern sector of Piemonte (Italy).
It is a rock covered glacier (Mazza, 1998) situated at the base of the gigantic Monte Rosa east face. According to the Glaciorisk database (GRIDABASE http://www.nimbus.it/glaciorisk/gridabasemainmenu.asp) the glacier elevation ranges from a maximum of 4520 m a.s.l. to a minimum of 1760 m a.s.l., its length is about 6 km and its maximum width is up to 500 m, with an average surface of 5.58 km². It’s oriented at 45° north with an average slope of 10°. The glacier main body is connected, in its upper part, with the Northern Locce, Signal and Monte Rosa Glaciers and it ends with a forked snout.
The glacier has been subject of scientific studies and expeditions from the end of the 18th
century, when its magnitude has been firstly described and highlighted (De Saussure, 1779 -
1796).
At the beginning of the present century - since 1999, according to Mazza (2003) - the glacier
has undergone a remarkable increase in horizontal displacement speed and surface
elevation. According to the displacement rate measurement, carried out by remote sensing
techniques, the speed of the glacier has increased from 32 – 43 m per year, recorded in the
last 5 years of the 20th century to 92 – 112 m per year (02/09/1999 – 06/09/2001); in the
autumn of the same year the speed had still increased to its maximum of 100 – 200 m per
year (Kaab et al., 2005).
According to the definition of Haeberli et al (2002) the Belvedere glacier has been subject to a “surge-type movement”, currently a unique phenomenon in the Alps; conversely Mazza (2003) have explained the phenomena with the kinematic waves theory due to the reduced horizontal displacement speed, the lack of the formation of a terminal moraine and the absence of the typical block-flow movement; in fact, due to the high displacement speed, the glacier is unable to keep a viscous flow and breaks into small ice blocks. Moreover, the kinematic wave theory is supported by previous events, though characterised by reduced magnitudes, occurred between 1984 and 1985 and at the end of 1992 (Mazza, 2003).
The surface elevation has shown a similar trend, with an increase in ice thickness of up to 20 m reaching the level of the Little Ice Age moraine (Mortara et al., 2003), with the consequent
www.intechopen.com
The Support of Geomatics in Glacier Monitoring: The Contribution of Terrestrial Laser Scanner
95
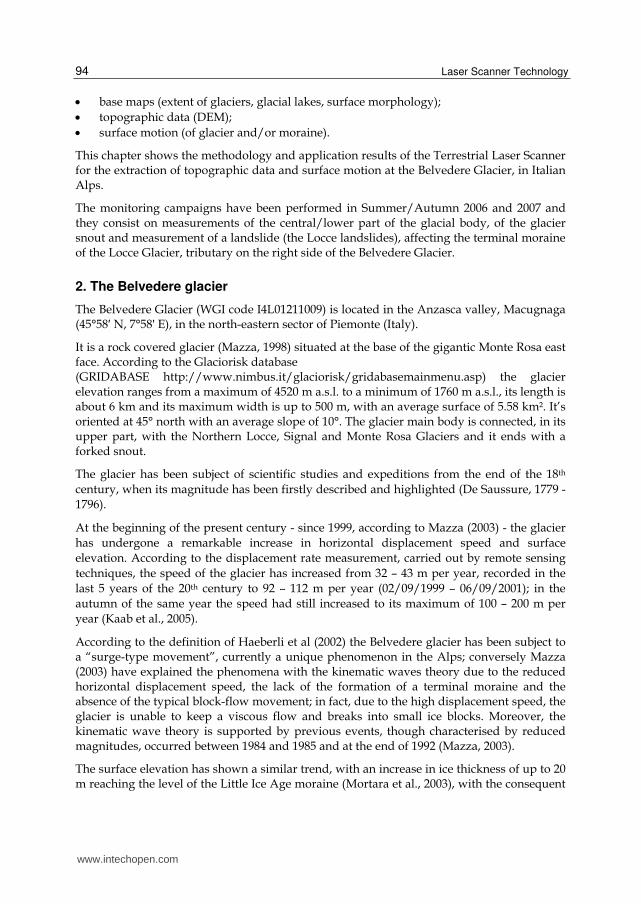
appearance of large crevasses on the whole glacier. Due to the described phenomena the formation of a new moraine has been observed. Contemporarily, in the upper part, the glacier surface has shown an opposite state, by lowering its elevation and in the originated depression a supraglacial lake has been observed. The lake has been identified as the “Effimero Lake” (Figure 1).
The lake has undergone different fillings until reaching its maximum volume of 3 · 106 m³
and a 57 m depth with evident risk of GLOF (Glacial Lake Outburst Flood) or jökulhlaup due
to termokarst processes or rockfall from Monte Rosa East Face. During the most critical
phase the lake level has been rising with a rate of 1 m/day so an overflow event was also
evaluated (Mercalli et al., 2002; Mortara et al., 2003; Mortara and Mercalli, 2002; Tamburini
and Mortara, 2004).
Fig. 1. The “Effimero lake”, in the left of the image the “Locce lake” (Photo G. Mortara)
In the past, similar events have been observed in Belvedere glacial basin. Due to intense
precipitation, the consequent outbursts of a water pocket inside the glacier have provoked
different collapses in the lateral moraines and the consequent trigger of debris flows (1868,
1896, 1904, 1922) as reported by Haeberli et al (2002).
Since 1990 (Fischer et al., 2006; Fischer et al, 2011) the Monte Rosa east face has also been
involved in several episodes of ice and rock avalanches, due to the permafrost degradation
in high mountain slopes caused by the increase of 0° C isotherm altitude (Beninston, 2003;
Carrasco et al., 2005).
Permafrost and ice play a key role in high mountains slope stability, the presence of ice in
discontinuities improves the bond between rocks by its adhesion effect. Melting results in
the loss of this factor and in the increase of flowing water, increasing the pressure in joints
and, consequently, lowering the shear strength (Davies et al., 2001). Unfortunately such
www.intechopen.com
Laser Scanner Technology
96
events have been observed in the rest of the Alps in the last years (Deline et al., 2002; Deline
et al., 2004a; Giani et al., 2001; Godone et al., 2007).
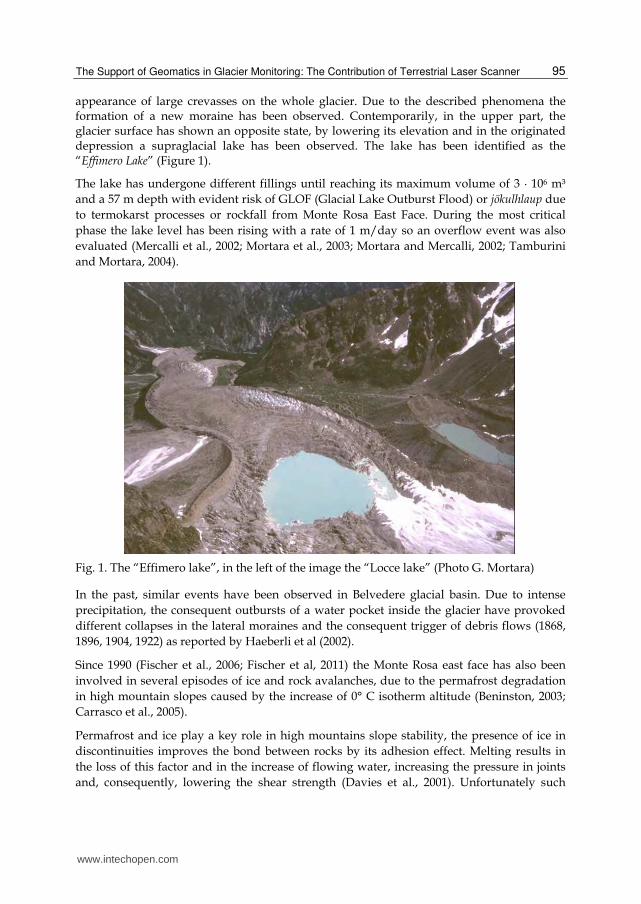
In the last years two main events have been observed: on 25 August 2005 a massive ice
avalanche has fallen down from the Monte Rosa east face with a total volume of up to 1.1 ·
106 m³; on 21 April 2007 a similar event has happened (Figure 2), with nearly halved volume
involved (~500000 m³) (Cat Berro et al., 2008). In every occasion, the debris has covered the
upper sector of Belvedere and due to its mixed composition, rocks and ice, can be
considered as a contribution in glacier mass balance (Federici et al., 2008).
Fig. 2. The 2007 ice avalanche deposit (photo G. Mortara)
Both phenomena, the changes in surface dynamics and the supraglacial lake, have triggered
a civil protection procedure in order to reduce risk related to the explained events for the
inhabitants of Macugnaga (Mercalli et al., 2002; Mortara et al., 2003; Mortara and Mercalli,
1999). Fortunately the lake has ended, by itself, the emergency state by two endoglacial
outbursts, due to the improvement in subglacial drainage system, finished without
consequences (Tamburini and Mortara, 2004; Tamburini et al., 2003). The two episodes
occurred on 19 and 20 June 2003 with a discharge of, respectively, 14 and 9 m³/s; among
them a marked discharge reduction has been observed, probably due to a temporary
obstruction in the drainage system.
3. Materials and methods
The traditional measurements carried out using GPS and ablatometric stakes provide only
punctual evaluations of the phenomena. In glacier monitoring an extensive approach could
be preferred in order to obtain a complete description of the surveyed object. According to
this statement, different Terrestrial Laser Scanner campaigns have been planned at different
sites of the glacier surface, in order to evaluate the most interesting geodynamical
phenomena during their evolution. The measurements includes the central body of the
glacier, the snouts and a landslides affecting the frontal moraine of the Lago delle Locce and
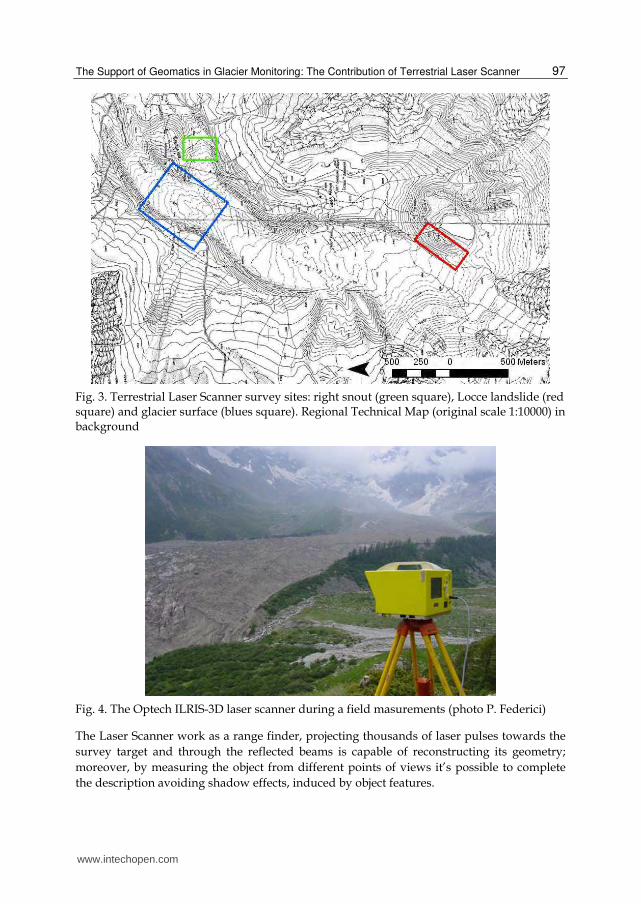
the right side of the Belvedere Glacier in its upper part (Figure 3).
www.intechopen.com
The Support of Geomatics in Glacier Monitoring: The Contribution of Terrestrial Laser Scanner
97
Fig. 3. Terrestrial Laser Scanner survey sites: right snout (green square), Locce landslide (red square) and glacier surface (blues square). Regional Technical Map (original scale 1:10000) in background
Fig. 4. The Optech ILRIS-3D laser scanner during a field masurements (photo P. Federici)
The Laser Scanner work as a range finder, projecting thousands of laser pulses towards the
survey target and through the reflected beams is capable of reconstructing its geometry;
moreover, by measuring the object from different points of views it’s possible to complete
the description avoiding shadow effects, induced by object features.
www.intechopen.com
Laser Scanner Technology
98
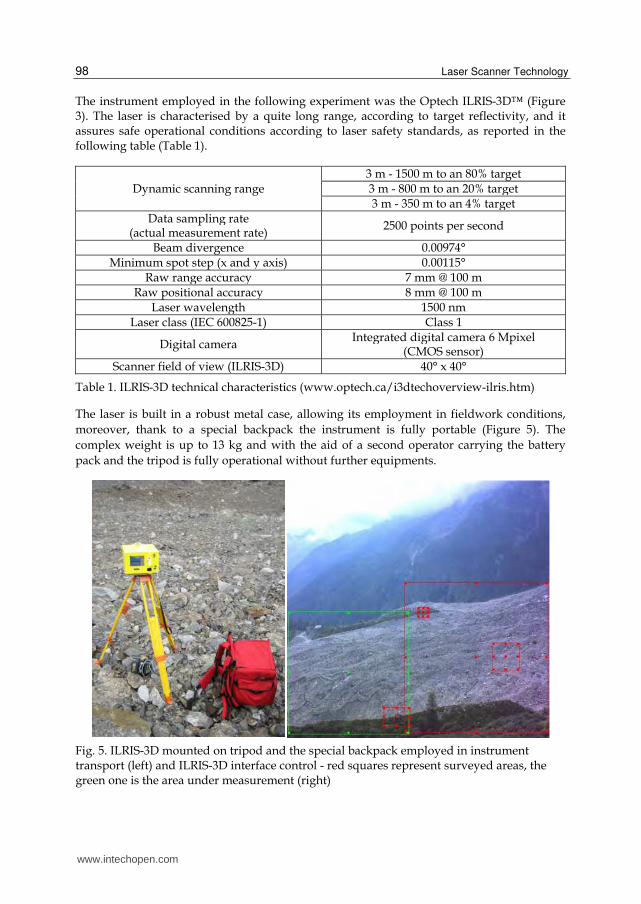
The instrument employed in the following experiment was the Optech ILRIS-3D™ (Figure 3). The laser is characterised by a quite long range, according to target reflectivity, and it assures safe operational conditions according to laser safety standards, as reported in the following table (Table 1).
Dynamic scanning range 3 m - 1500 m to an 80% target 3 m - 800 m to an 20% target 3 m - 350 m to an 4% target
Data sampling rate(actual measurement rate)
2500 points per second
Beam divergence 0.00974°Minimum spot step (x and y axis) 0.00115°
Raw range accuracy 7 mm @ 100 mRaw positional accuracy 8 mm @ 100 m
Laser wavelength 1500 nmLaser class (IEC 600825-1) Class 1
Digital camera Integrated digital camera 6 Mpixel
(CMOS sensor)Scanner field of view (ILRIS-3D) 40° x 40°
Table 1. ILRIS-3D technical characteristics (www.optech.ca/i3dtechoverview-ilris.htm)
The laser is built in a robust metal case, allowing its employment in fieldwork conditions,
moreover, thank to a special backpack the instrument is fully portable (Figure 5). The
complex weight is up to 13 kg and with the aid of a second operator carrying the battery
pack and the tripod is fully operational without further equipments.
Fig. 5. ILRIS-3D mounted on tripod and the special backpack employed in instrument transport (left) and ILRIS-3D interface control - red squares represent surveyed areas, the green one is the area under measurement (right)
www.intechopen.com
The Support of Geomatics in Glacier Monitoring: The Contribution of Terrestrial Laser Scanner
99
At the beginning of the survey, the instrument acquires a picture of the object with its incorporated digital camera, and displays it on the controller screen. This enables the operator to decide the area, or the areas – e.g. the objects and targets - of the picture to be scanned by simply drawing rectangular selection windows and by specifying acquisition parameters for each one.
The aim of the whole experiment was the comprehension of glacier dynamics in time, so a multitemporal approach has been adopted when planning the surveys. In order to maximize the productivity and avoid risks for the operators, the employment of targets placed on the object has been strongly limited. One advantage of the laser scanner is to work without contact with the surveyed objects, so allowing to measure dangerous or inaccessible places, too. This peculiarity has already been employed in landslide and volcanoes monitoring (Hunter et al., 2003; Oppikofer et al., 2008).
For each area under observation, two scan sessions have been executed with the aim of measuring changes in glacier features; during the third test on the central body of the glacier also measurements of some targets have been used in order to make a comparison with ablation stakes measurement accomplished with GPS, thus obtaining co-registered data.
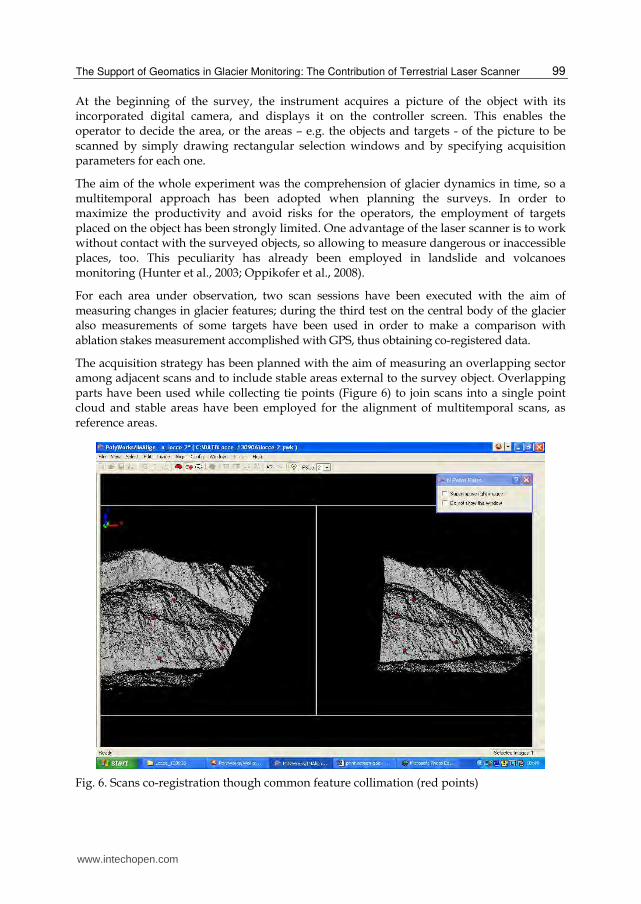
The acquisition strategy has been planned with the aim of measuring an overlapping sector among adjacent scans and to include stable areas external to the survey object. Overlapping parts have been used while collecting tie points (Figure 6) to join scans into a single point cloud and stable areas have been employed for the alignment of multitemporal scans, as reference areas.
Fig. 6. Scans co-registration though common feature collimation (red points)
www.intechopen.com
Laser Scanner Technology
100
Data processing have been performed using Innovmetric Polyworks™, the software is
subdivided in modules specifically designed for the different work phases. The ImAlign
module is dedicated to the alignment of different scans into a unique reference system, in
the described experiment this goal has been achieved by homologous feature collimation;
using an interactive closest point algorithm (Beinat, 2006; Besl and Mc Kay, 1992; Chen and
Medioni, 1992), the matching has been achieved with good results in alignment accuracy by
employing only few couples of selected points.
The point cloud is not really modified by the operation, as the software compiles a
rototranslation matrix used in locating the original data in the three dimensional reference
system. By comparing multitemporal matrix parameters a computation of object
displacement can be achieved, too.
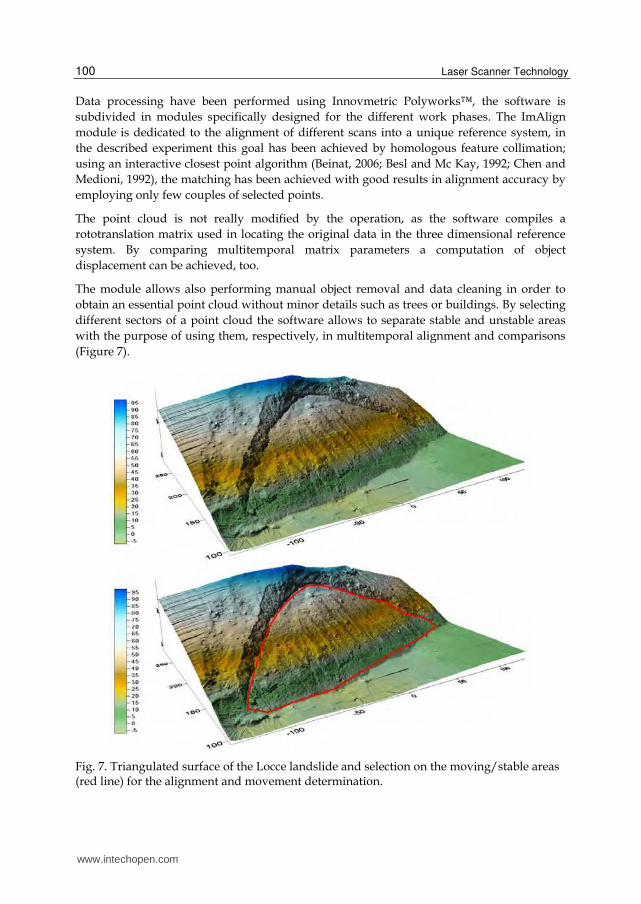
The module allows also performing manual object removal and data cleaning in order to
obtain an essential point cloud without minor details such as trees or buildings. By selecting
different sectors of a point cloud the software allows to separate stable and unstable areas
with the purpose of using them, respectively, in multitemporal alignment and comparisons
(Figure 7).
Fig. 7. Triangulated surface of the Locce landslide and selection on the moving/stable areas (red line) for the alignment and movement determination.
www.intechopen.com
The Support of Geomatics in Glacier Monitoring: The Contribution of Terrestrial Laser Scanner
101
The software processes 3D data according to their reference system so when a complex or
huge amount of data needs to be aligned, the operator may select only the usable sectors
and perform the alignment; then by applying the rototranslation matrix to the whole
dataset, the software computes the alignment parameters achieving the final results and
reducing computational time and efforts.
At the end of the alignment procedure, the software opens the second module, ImMerge,
where the point cloud is transformed into triangulated surfaces. Surfaces are computed
according to the Delaunay triangulation (De Smith et al, 2007) thus generating triangular
networks (Lambers et al, 2007). The meshing process is necessary as the comparison
algorithm need to compute differences between two continuous surfaces and not on point
clouds; the second option is however feasible but computation time is quite longer and the
success in the process conclusion is not guaranteed.
The computed surface may be edited in the following module, ImEdit, where volume
calculation and cross section extraction may be executed, too.
On the other hand the surface comparisons are carried out in the ImInspect module. This
one is dedicated to the inspection of meshes and the analysis of differences between them
according to predefined directions e.g. along one axis, along the shortest distance or along a
user specified vector.
The inspection could also be carried out manually, by vector plotting on homologous
features in two different, multitemporal, meshes. In this module the mesh georeferencing is
also achievable by assigning coordinates to point picked on the surface; the software has a
series of functions, that help the operator in finding the centre of the target by interpolation
algorithms, as usually target coordinates are referred to the target centre.
3.1 Moraine survey
The Locce Landslide has been measured according to the same approach adopted in the
snout survey, explained in details in the next paragraph; the first survey has been carried
out on 01/08/2006 and the second one on the 13/09/2006. Also in this experiment the
object has been measured by various scan positions.
Each scan session has been accomplished with a 7 cm resolution obtaining up to 9 million of
3D points (see again figure 7).
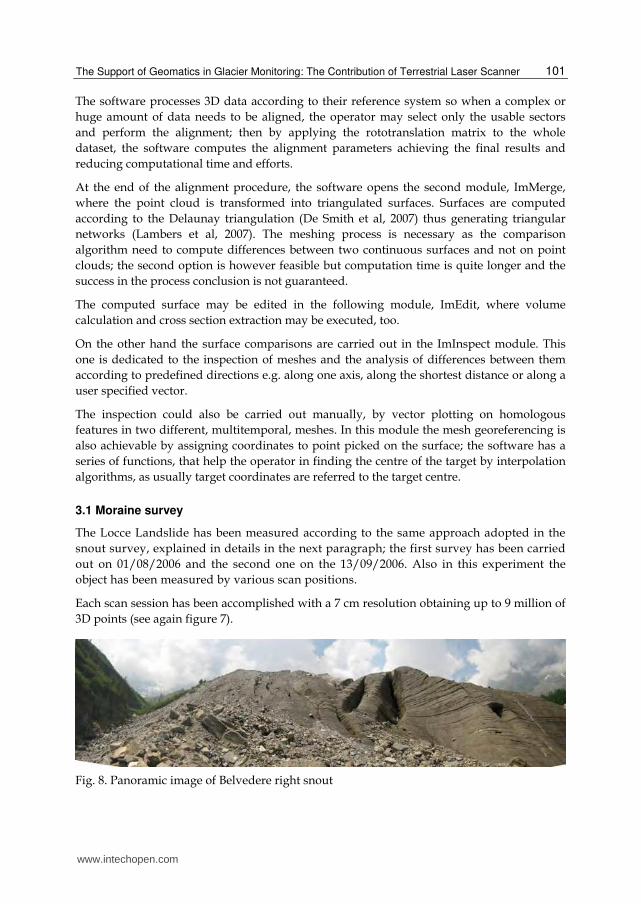
Fig. 8. Panoramic image of Belvedere right snout
www.intechopen.com
Laser Scanner Technology
102
3.2 Terminus survey
The right snout of the Belvedere Glacier (Figure 8) has been surveyed in two separated
sessions on the 02/08/2006 and on the 14/10/2006. Each session (Figure 9) has been
subdivided in different scan positions, in order to completely measure the glacier snout and
to include, in sessions, the mountainside and the Little Ice Age moraine, with the purpose of
employing their feature as reference areas.
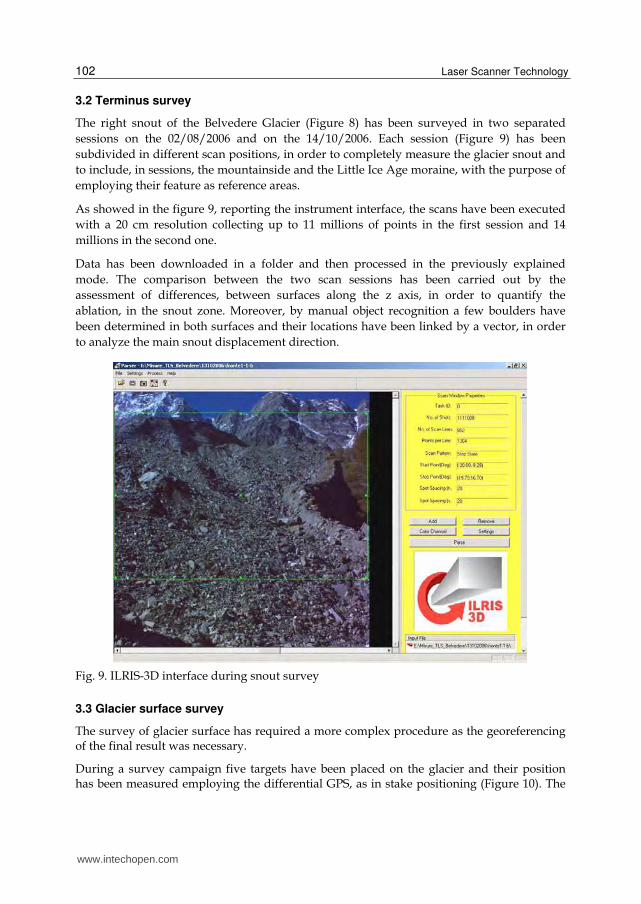
As showed in the figure 9, reporting the instrument interface, the scans have been executed
with a 20 cm resolution collecting up to 11 millions of points in the first session and 14
millions in the second one.
Data has been downloaded in a folder and then processed in the previously explained
mode. The comparison between the two scan sessions has been carried out by the
assessment of differences, between surfaces along the z axis, in order to quantify the
ablation, in the snout zone. Moreover, by manual object recognition a few boulders have
been determined in both surfaces and their locations have been linked by a vector, in order
to analyze the main snout displacement direction.
Fig. 9. ILRIS-3D interface during snout survey
3.3 Glacier surface survey
The survey of glacier surface has required a more complex procedure as the georeferencing of the final result was necessary.
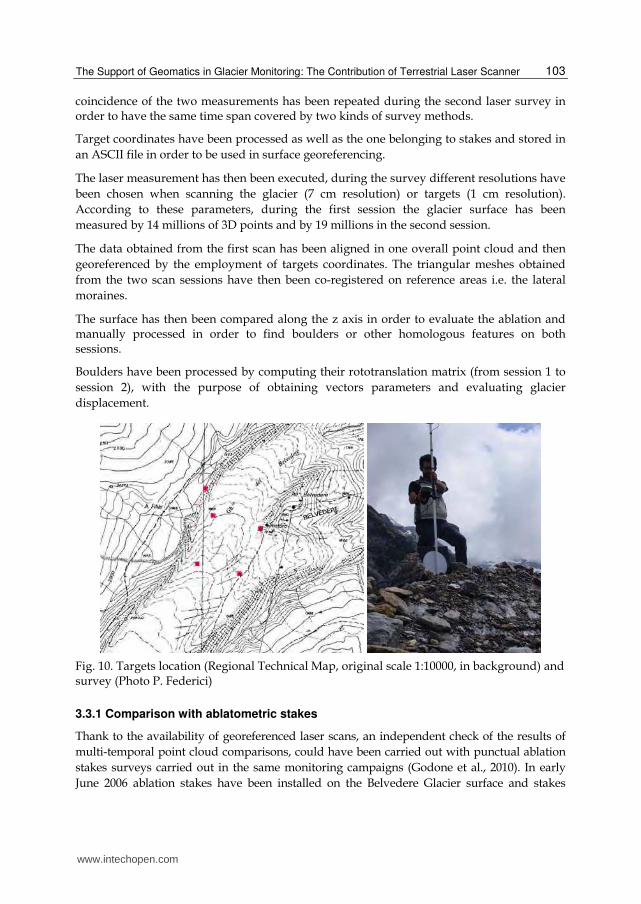
During a survey campaign five targets have been placed on the glacier and their position has been measured employing the differential GPS, as in stake positioning (Figure 10). The
www.intechopen.com
The Support of Geomatics in Glacier Monitoring: The Contribution of Terrestrial Laser Scanner
103
coincidence of the two measurements has been repeated during the second laser survey in order to have the same time span covered by two kinds of survey methods.
Target coordinates have been processed as well as the one belonging to stakes and stored in
an ASCII file in order to be used in surface georeferencing.
The laser measurement has then been executed, during the survey different resolutions have
been chosen when scanning the glacier (7 cm resolution) or targets (1 cm resolution).
According to these parameters, during the first session the glacier surface has been
measured by 14 millions of 3D points and by 19 millions in the second session.
The data obtained from the first scan has been aligned in one overall point cloud and then
georeferenced by the employment of targets coordinates. The triangular meshes obtained
from the two scan sessions have then been co-registered on reference areas i.e. the lateral
moraines.
The surface has then been compared along the z axis in order to evaluate the ablation and manually processed in order to find boulders or other homologous features on both sessions.
Boulders have been processed by computing their rototranslation matrix (from session 1 to
session 2), with the purpose of obtaining vectors parameters and evaluating glacier
displacement.
Fig. 10. Targets location (Regional Technical Map, original scale 1:10000, in background) and survey (Photo P. Federici)
3.3.1 Comparison with ablatometric stakes
Thank to the availability of georeferenced laser scans, an independent check of the results of
multi-temporal point cloud comparisons, could have been carried out with punctual ablation
stakes surveys carried out in the same monitoring campaigns (Godone et al., 2010). In early
June 2006 ablation stakes have been installed on the Belvedere Glacier surface and stakes
www.intechopen.com
Laser Scanner Technology
104
measurements have been repeated regularly during 2006 and 2007 ablation seasons (figure 9).
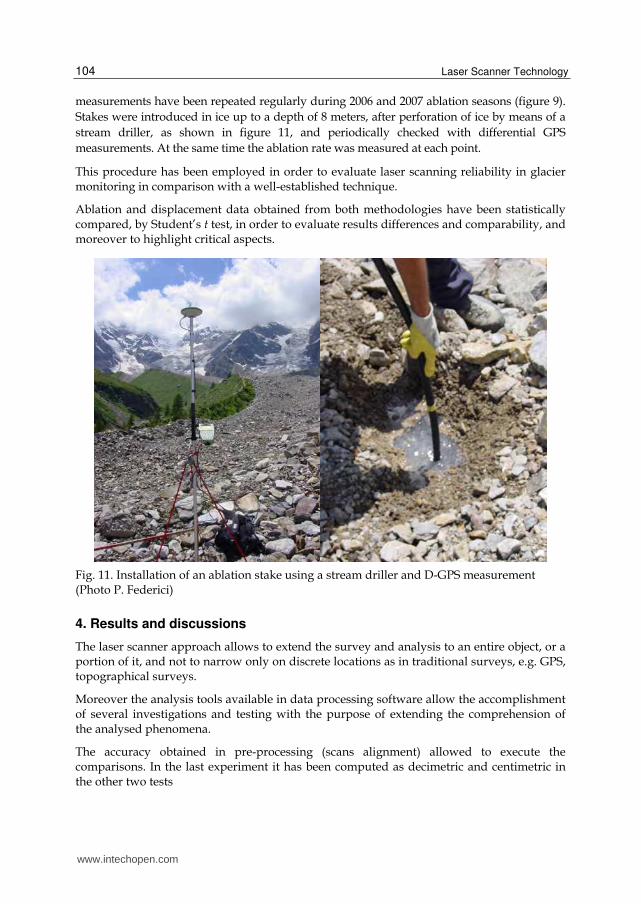
Stakes were introduced in ice up to a depth of 8 meters, after perforation of ice by means of a
stream driller, as shown in figure 11, and periodically checked with differential GPS
measurements. At the same time the ablation rate was measured at each point.
This procedure has been employed in order to evaluate laser scanning reliability in glacier monitoring in comparison with a well-established technique.
Ablation and displacement data obtained from both methodologies have been statistically compared, by Student’s t test, in order to evaluate results differences and comparability, and moreover to highlight critical aspects.
Fig. 11. Installation of an ablation stake using a stream driller and D-GPS measurement (Photo P. Federici)
4. Results and discussions
The laser scanner approach allows to extend the survey and analysis to an entire object, or a portion of it, and not to narrow only on discrete locations as in traditional surveys, e.g. GPS, topographical surveys.
Moreover the analysis tools available in data processing software allow the accomplishment of several investigations and testing with the purpose of extending the comprehension of the analysed phenomena.
The accuracy obtained in pre-processing (scans alignment) allowed to execute the comparisons. In the last experiment it has been computed as decimetric and centimetric in the other two tests
www.intechopen.com
The Support of Geomatics in Glacier Monitoring: The Contribution of Terrestrial Laser Scanner
105
4.1 Moraine landslide survey
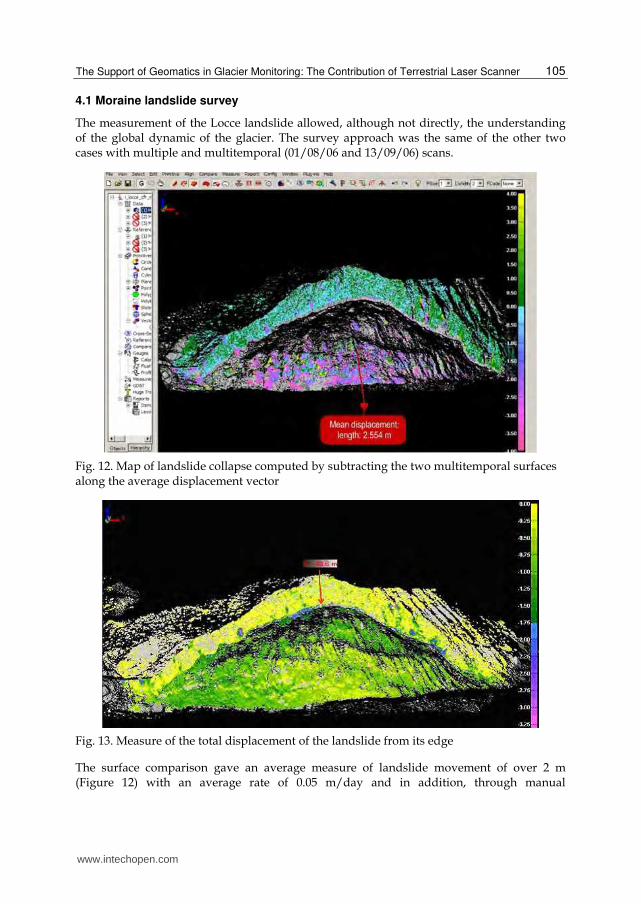
The measurement of the Locce landslide allowed, although not directly, the understanding of the global dynamic of the glacier. The survey approach was the same of the other two cases with multiple and multitemporal (01/08/06 and 13/09/06) scans.
Fig. 12. Map of landslide collapse computed by subtracting the two multitemporal surfaces along the average displacement vector
Fig. 13. Measure of the total displacement of the landslide from its edge
The surface comparison gave an average measure of landslide movement of over 2 m (Figure 12) with an average rate of 0.05 m/day and in addition, through manual
www.intechopen.com
Laser Scanner Technology
106
measurement, the total vertical shift of the landslide mass has been estimated in 36.62 m since the trigger of the event (Figure 13).
In this experiment the accuracy reached in the alignment phase was centimetric.
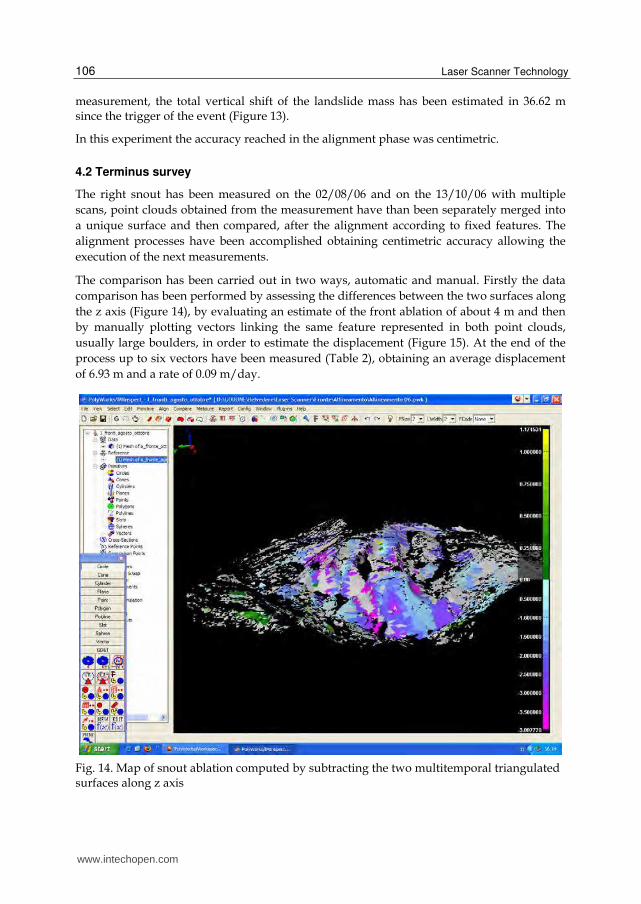
4.2 Terminus survey
The right snout has been measured on the 02/08/06 and on the 13/10/06 with multiple
scans, point clouds obtained from the measurement have than been separately merged into
a unique surface and then compared, after the alignment according to fixed features. The
alignment processes have been accomplished obtaining centimetric accuracy allowing the
execution of the next measurements.
The comparison has been carried out in two ways, automatic and manual. Firstly the data
comparison has been performed by assessing the differences between the two surfaces along
the z axis (Figure 14), by evaluating an estimate of the front ablation of about 4 m and then
by manually plotting vectors linking the same feature represented in both point clouds,
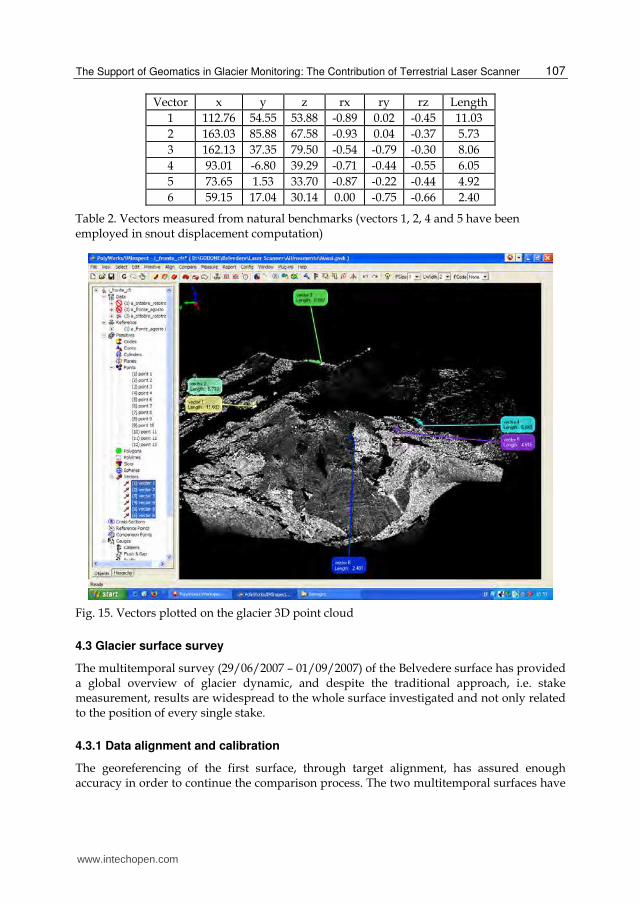
usually large boulders, in order to estimate the displacement (Figure 15). At the end of the
process up to six vectors have been measured (Table 2), obtaining an average displacement
of 6.93 m and a rate of 0.09 m/day.
Fig. 14. Map of snout ablation computed by subtracting the two multitemporal triangulated surfaces along z axis
www.intechopen.com
The Support of Geomatics in Glacier Monitoring: The Contribution of Terrestrial Laser Scanner
107
Vector x y z rx ry rz Length
1 112.76 54.55 53.88 -0.89 0.02 -0.45 11.03
2 163.03 85.88 67.58 -0.93 0.04 -0.37 5.73
3 162.13 37.35 79.50 -0.54 -0.79 -0.30 8.06
4 93.01 -6.80 39.29 -0.71 -0.44 -0.55 6.05
5 73.65 1.53 33.70 -0.87 -0.22 -0.44 4.92
6 59.15 17.04 30.14 0.00 -0.75 -0.66 2.40
Table 2. Vectors measured from natural benchmarks (vectors 1, 2, 4 and 5 have been employed in snout displacement computation)
Fig. 15. Vectors plotted on the glacier 3D point cloud
4.3 Glacier surface survey
The multitemporal survey (29/06/2007 – 01/09/2007) of the Belvedere surface has provided a global overview of glacier dynamic, and despite the traditional approach, i.e. stake measurement, results are widespread to the whole surface investigated and not only related to the position of every single stake.
4.3.1 Data alignment and calibration
The georeferencing of the first surface, through target alignment, has assured enough accuracy in order to continue the comparison process. The two multitemporal surfaces have
www.intechopen.com
Laser Scanner Technology
108
been aligned using the “natural benchmark” approach; in other words employing natural features such as boulders and rocks on glacier cover, with an accuracy of ± 0.2 m (Figure 16).
+ 0.2 m
- 0.2 m
+ 0.2 m
- 0.2 m
Fig. 16. Residuals of the alignment of the two surfaces computed on natural benchmarks
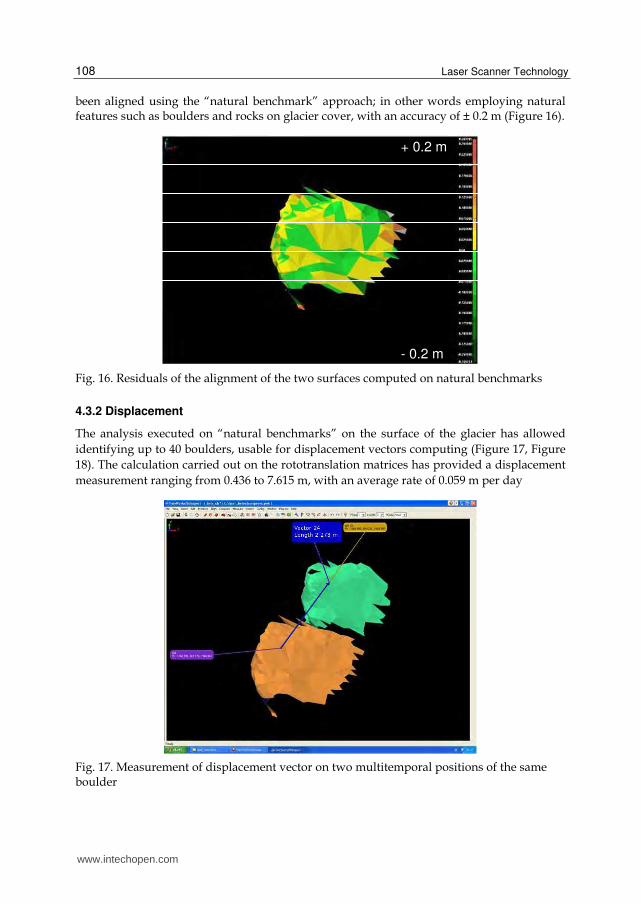
4.3.2 Displacement
The analysis executed on “natural benchmarks” on the surface of the glacier has allowed
identifying up to 40 boulders, usable for displacement vectors computing (Figure 17, Figure
18). The calculation carried out on the rototranslation matrices has provided a displacement
measurement ranging from 0.436 to 7.615 m, with an average rate of 0.059 m per day
Fig. 17. Measurement of displacement vector on two multitemporal positions of the same boulder
www.intechopen.com
The Support of Geomatics in Glacier Monitoring: The Contribution of Terrestrial Laser Scanner
109
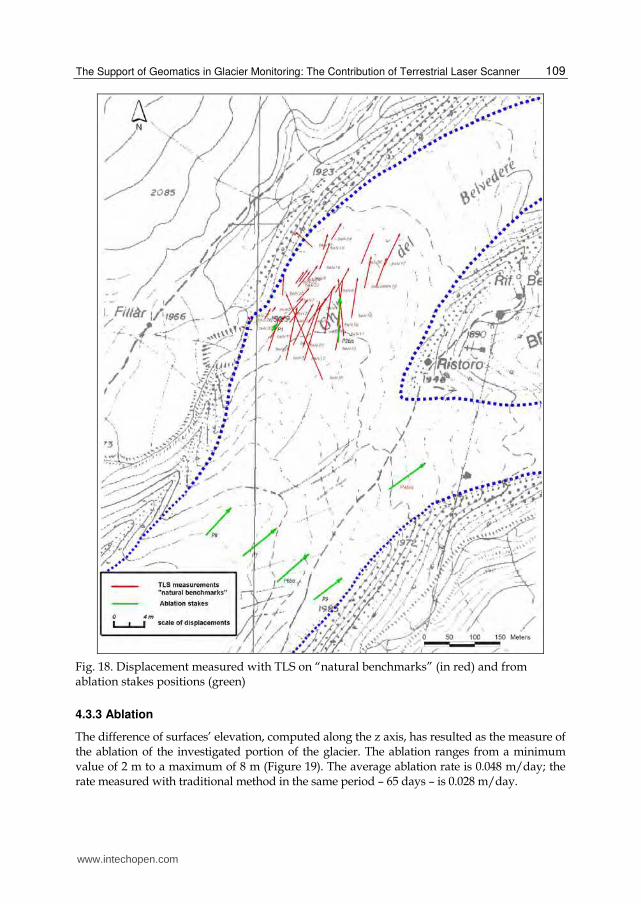
Fig. 18. Displacement measured with TLS on “natural benchmarks” (in red) and from ablation stakes positions (green)
4.3.3 Ablation
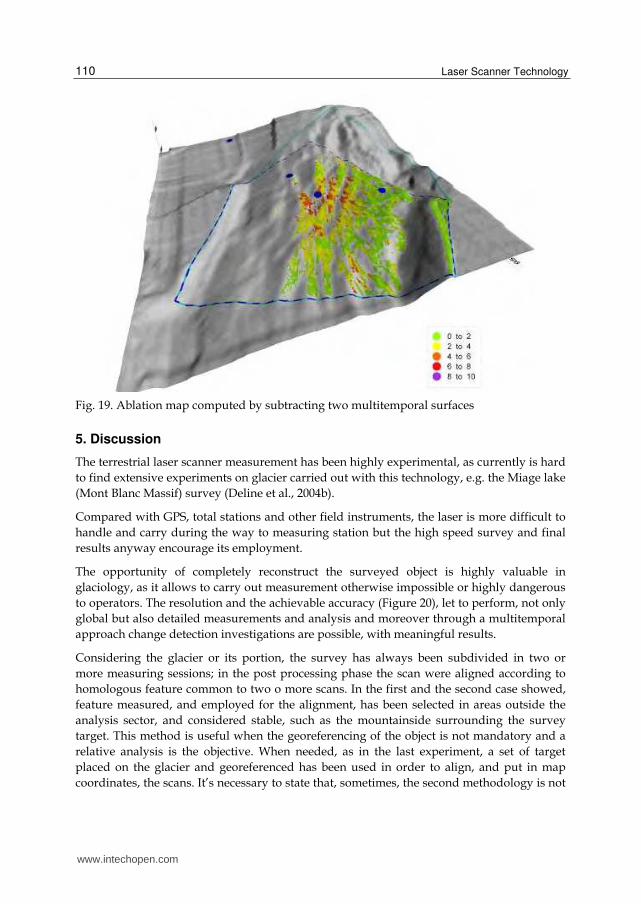
The difference of surfaces’ elevation, computed along the z axis, has resulted as the measure of the ablation of the investigated portion of the glacier. The ablation ranges from a minimum value of 2 m to a maximum of 8 m (Figure 19). The average ablation rate is 0.048 m/day; the rate measured with traditional method in the same period – 65 days – is 0.028 m/day.
www.intechopen.com
Laser Scanner Technology
110
Fig. 19. Ablation map computed by subtracting two multitemporal surfaces
5. Discussion
The terrestrial laser scanner measurement has been highly experimental, as currently is hard
to find extensive experiments on glacier carried out with this technology, e.g. the Miage lake
(Mont Blanc Massif) survey (Deline et al., 2004b).
Compared with GPS, total stations and other field instruments, the laser is more difficult to
handle and carry during the way to measuring station but the high speed survey and final
results anyway encourage its employment.
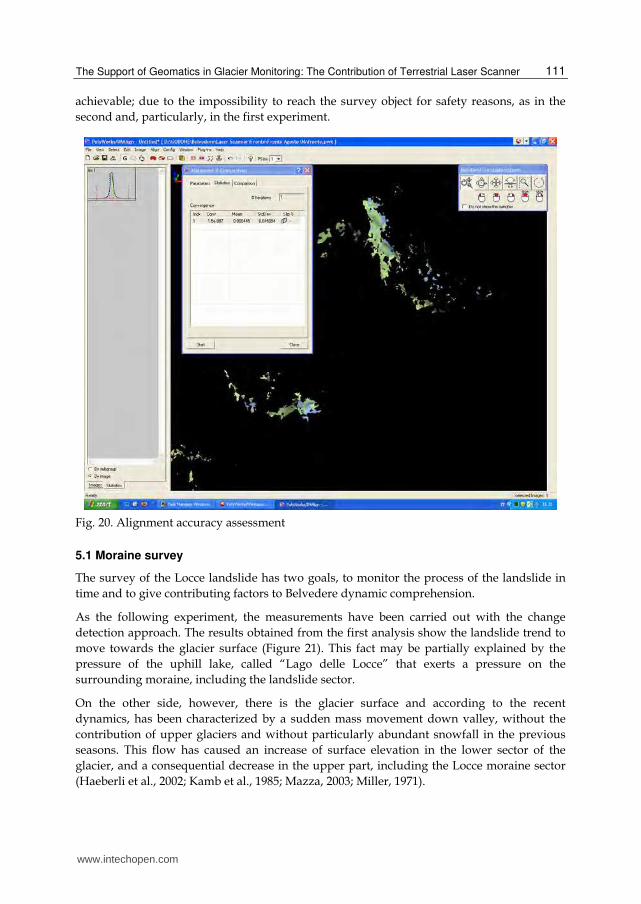
The opportunity of completely reconstruct the surveyed object is highly valuable in
glaciology, as it allows to carry out measurement otherwise impossible or highly dangerous
to operators. The resolution and the achievable accuracy (Figure 20), let to perform, not only
global but also detailed measurements and analysis and moreover through a multitemporal
approach change detection investigations are possible, with meaningful results.
Considering the glacier or its portion, the survey has always been subdivided in two or
more measuring sessions; in the post processing phase the scan were aligned according to
homologous feature common to two o more scans. In the first and the second case showed,
feature measured, and employed for the alignment, has been selected in areas outside the
analysis sector, and considered stable, such as the mountainside surrounding the survey
target. This method is useful when the georeferencing of the object is not mandatory and a
relative analysis is the objective. When needed, as in the last experiment, a set of target
placed on the glacier and georeferenced has been used in order to align, and put in map
coordinates, the scans. It’s necessary to state that, sometimes, the second methodology is not
www.intechopen.com
The Support of Geomatics in Glacier Monitoring: The Contribution of Terrestrial Laser Scanner
111
achievable; due to the impossibility to reach the survey object for safety reasons, as in the
second and, particularly, in the first experiment.
Fig. 20. Alignment accuracy assessment
5.1 Moraine survey
The survey of the Locce landslide has two goals, to monitor the process of the landslide in
time and to give contributing factors to Belvedere dynamic comprehension.
As the following experiment, the measurements have been carried out with the change
detection approach. The results obtained from the first analysis show the landslide trend to
move towards the glacier surface (Figure 21). This fact may be partially explained by the
pressure of the uphill lake, called “Lago delle Locce” that exerts a pressure on the
surrounding moraine, including the landslide sector.
On the other side, however, there is the glacier surface and according to the recent
dynamics, has been characterized by a sudden mass movement down valley, without the
contribution of upper glaciers and without particularly abundant snowfall in the previous
seasons. This flow has caused an increase of surface elevation in the lower sector of the
glacier, and a consequential decrease in the upper part, including the Locce moraine sector
(Haeberli et al., 2002; Kamb et al., 1985; Mazza, 2003; Miller, 1971).
www.intechopen.com
Laser Scanner Technology
112
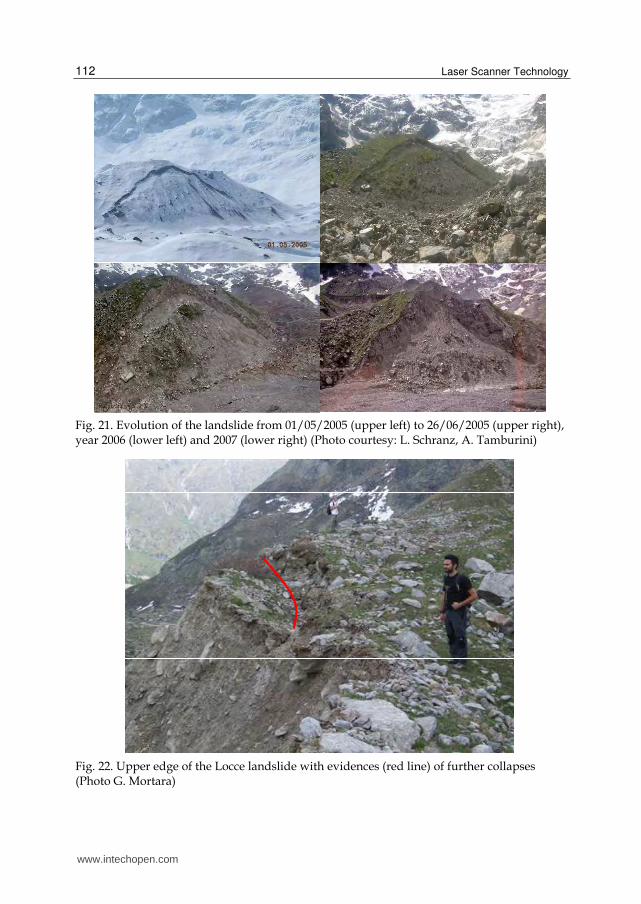
Fig. 21. Evolution of the landslide from 01/05/2005 (upper left) to 26/06/2005 (upper right), year 2006 (lower left) and 2007 (lower right) (Photo courtesy: L. Schranz, A. Tamburini)
Fig. 22. Upper edge of the Locce landslide with evidences (red line) of further collapses (Photo G. Mortara)
www.intechopen.com
The Support of Geomatics in Glacier Monitoring: The Contribution of Terrestrial Laser Scanner
113
The evidences, of these dynamic, are evident also on the top of the Locce moraine, where the
main ridge is still collapsing and a rotational movement is clearly recognizable (Figure 22).
The terrestrial laser scanner has allowed studying the phenomenon as it prevented the
operator to stay close to the object during measurement and provided a complete
reconstruction in order to perform every kind of analysis requested, in a virtual environment.
Due to the need of relative evaluations, the scans have been aligned on common features in
stable areas of the survey, in order to avoid target placement in dangerous places.
Notwithstanding the dimension of the landslide, every survey has been completed in one day,
with multiple scans, assuring an accurate and detailed description of the site.
The analysis has been carried out both automatically and manually, highlighting the
flexibility of the methodology when studying such events.
The magnitude of the phenomenon deserve further studies and deepening, as the Locce
sector has been already involved in several lake outbursts in ‘70 (Mortara and Mercalli,
2002) and the current trend of the landslide is not leading to a safe and stable situation, if
considering Belvedere glacier reduction, too.
5.2 Terminus survey
Measurement of glacier front, usually, are based on repeated surveys (often along
predefined bearings) from a reference point placed at a certain distance form the glacier, in
order to measure fluctuations in time (Bonardi et al., 2006). Obviously, this approach tends
to excessively simplify the complexity of the front, with a single or discrete representation,
however this approach is highly convenient as it requires cheap instrumentations. It is really
fast to perform, but results are only referred to few point measured on the glacier. On the
other hand, the employment of laser scanner requires skilled operators and the availability
of such equipment, but the results are nearly impressive both under visual and geometrical
point of view.
With terrestrial laser scanner, not only displacement evaluation have been executed, also
ablation data are available after the scans alignment, by differentiating the obtained surface,
a global evaluation is feasible; another advantage of this technique. In this case is more
appropriate to refer the measurement to the snout rather than to the simple front.
The entire measurement has been completed in two session of one day duration, including the reaching of the site. As explained above, the snout has been measured from three different positions in order to scan the entire ice cliff and the surrounding mountainsides. The post processing phase has been subdivided in three phases; at the beginning the scans have been aligned, reconstructing the front in the two epochs, then the two surfaces have been aligned thank to external features and then, finally, the multitemporal analysis has been carried out. The two surfaces have then been compared globally along the z axis with the aim of obtaining an estimate of the ablation in the front sector. These data, compared with those measured in the, traditional, stake approach, in the same period, have shown similar values (p = 0.380) confirming the reliability of the method.
The ablation estimation has been carried out in a completely automatic way; on the contrary
the measure of glacier displacement needs to be performed manually, as it is based on object
www.intechopen.com
Laser Scanner Technology
114
recognition on both surfaces. In order to measure the displacement on the two surfaces,
features common to the two multitemporal scan have been searched. When a rock or a
boulder was recognized, in both scans, was then used to manually generate a displacement
vector, linking the two objects in the two scans.
Moreover the vector obtained needs to be checked in order to exclude those characterized
by anomalous directions, probably due to falling of rocks and not strictly related to glacier
displacement
Due to the 2.5 month period, only 6 vectors were traced and, among them, only 4 were then
used in order to compute the displacement speed. The selection has been carried out based
on vector direction in comparison with the glacier main flow direction. The methodology
has allowed measuring glacier surface displacement rate, without risks for the survey
operators, but due to the time span between the two surveys the number of available
features on the glacier was nearly scarce, in order to measure the displacement in a more
detailed way, measurement should be repeated at an interval never greater than one month.
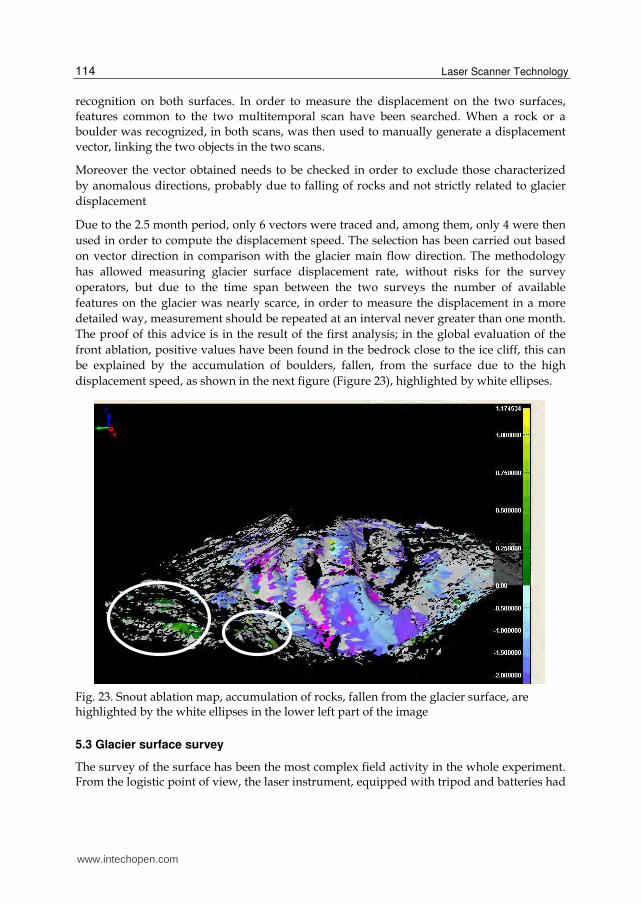
The proof of this advice is in the result of the first analysis; in the global evaluation of the
front ablation, positive values have been found in the bedrock close to the ice cliff, this can
be explained by the accumulation of boulders, fallen, from the surface due to the high
displacement speed, as shown in the next figure (Figure 23), highlighted by white ellipses.
Fig. 23. Snout ablation map, accumulation of rocks, fallen from the glacier surface, are highlighted by the white ellipses in the lower left part of the image
5.3 Glacier surface survey
The survey of the surface has been the most complex field activity in the whole experiment. From the logistic point of view, the laser instrument, equipped with tripod and batteries had
www.intechopen.com
The Support of Geomatics in Glacier Monitoring: The Contribution of Terrestrial Laser Scanner
115
to be transported to a raised position, over the glacier surface, and due to the location of the measuring station the entire equipment has been moved only by instruments operators.
The survey has also been georeferenced, in order to analyze glacier displacement according to its bearing and to compare it with stakes measures. In order to accomplish the georeferencing, 4 targets have been placed on the glacier during the first survey and their positions have been measured with differential GPS. In order to optimize the stake and target survey, one GPS campaign has been performed with both aims.
The employment of targets comprises additional tasks to achieve, in fact every single target need to be measured in a separate scan session; this detail suggest that targets should be used only when strictly needed as they require quite a lot of operational time, to spend in measurement of their position, in their scanning and computational time in data processing.
5.3.1 Data alignment and calibration
Every measurement has been characterized by multiple scans in order to survey the largest part of the glacier, each scan has been then aligned thank to targets.
The alignment, between the two surveys, has been performed easily as in previous experiments. In this one, the “natural benchmark” approach has been used in a twofold way; during the alignment phase, as already described in the two previous tests, the two scans have been aligned on features tracked down in glacier surroundings; and during the analysis phase as described below.
5.3.2 Displacement
The glacier displacement has been measured according to the new approach, already tested on Liligo Glacier, Karakoram, Pakistan (Diolaiuti et al., 2003) and on Belvedere snout, which considers as reference points boulder and rocks placed on glacier surface. By recognizing the relative positions of these “natural benchmark” a vector computation is possible, allowing measuring local glacier displacements, limited only by the number of recognizable features. In spite of the scarce results obtained on the right snout of the glacier, in this experiment up to 40 features, and consequently, displacement vectors have been computed with a highly detailed analysis of the phenomenon (Figure 18). Displacement data, compared with those measured by GPS at stakes positions are comparable with no significant differences (p = 0.245) and similar variances (p = 0.323), as shown in the same figure.
5.3.3 Ablation
Laser data offers also the chance to measure the glacier ablation in the scanned area. In this case the automatic comparison of the two surfaces along z axis, as already performed on snout experiment, have proven its effectiveness providing a fast and accurate measurement extended to the entire scanned area. The comparison between laser data and stake measurement has provided an unexpected result: the two datasets have shown significant differences in variances (p = 4.700 · 10-3) and highly significant differences in their values (p = 7.000 · 10-4), according to t test. The analysis have been repeated, by comparing laser data with the glacier elevation losses, measured with GPS at stake locations; in this second test
www.intechopen.com
Laser Scanner Technology
116
the two datasets have shown non significant differences (p = 0.751). This different test results suggest the importance of the correct interpretation of the laser survey results, due the high complexity of a glacier system, several factor (e.g. debris cover or bare ice…) should be taken into account before identifying the correct meaning of a new technique results.
6. Conclusions
The cryosphere is characterized by undoubtedly remarkable phenomena with meaningful magnitudes. Hazards related to these events may endanger human life and settlements, as already stated by different authors (Huggel, 2004; Rott et al., 2005). The monitoring of these phenomena should assure enough accuracy as they have to describe complex phenomena and their potential hazards. Contemporarily, they should be characterised by a handy employment and management due to the difficult environment of application.
The geomatic methodologies employed in the monitoring and analysis of cryospheric
phenomena has provided a satisfactory response to the briefly listed requirements.
GPS and Terrestrial Laser Scanner have confirmed their effectiveness in the research. The ease in their field employment has allowed the execution of fast and reliable surveys.
The Terrestrial Laser Scanner, thank to its high acquisition frequency, provides a complete
description of the glacier surface in short time. The output point cloud is immediately ready
to process and allows the extraction of geometrical features of the object.
As a remote technique, the accessibility of the survey object is not needed so measurement
of unsafe areas is feasible (Biasion et al., 2005). When the object georeferencing is not
requested also the target positioning is not necessary, point cloud processing and
comparison may be executed in a relative approach, with no loss in the final accuracy. The
proposed “natural benchmark” approach has proved its applicability introducing a new
method in the processing of data.
In both cases the accuracies obtained by the two techniques has assured their applicability to cryosphere monitoring reaching the requirement specified for this kind of measurements (Rott et al., 2005).
The fast execution of measurement has allowed completing a survey session in few hours
enabling their repetition during the season. A high frequency monitoring is highly
recommendable in these events in order to achieve the maximum number of information on
the phenomenon dynamics. Moreover, due to the phenomena complexity, multidisciplinary
approaches are recommendable (Zublin et al, 2008) in order to achieve the maximum detail
in the survey object reconstruction and consequent analyses.
The measurements are still in progress as the explained phenomena deserve a continual
monitoring to deepen the comprehension of their dynamics.
Other techniques are developing, like the GB-SAR (Ground Based Synthetic Aperture
Radar), in cryosphere monitoring and the integration with the other methodologies is highly
recommended in order to obtain data from different sources, integrate and cross validate
them. This multi disciplinary approach should lead to the definition of the optimal method
in the monitoring of these phenomena.
www.intechopen.com
The Support of Geomatics in Glacier Monitoring: The Contribution of Terrestrial Laser Scanner
117
7. Acknowledgment
Lamberto Schranz, alpine guide, who assisted and cooperated during field surveys.
Andrea Tamburini (IMAGEO SrL), Giovanni Mortara (Italian Glaciological Committee) and Paolo Federici (RSE SpA – Research on Energy Systems) for their valuable cooperation during field works, data analyses and for their helpful comments in the preparation of this chapter.
The project has been partially funded by “Comitato Scientifico Centrale del Club Alpino Italiano”.
8. References
Beinat, A., 2006. Tecniche di Registrazione. In: F. Crosilla and S. Dequal (Editors), Laser
Scanning Terrestre. Collana di Geodesia e Cartografia. International Centre for
Mechanical Sciences,, Udine, pp. 39 - 53.
Beninston, M., 2003. Climatic Changes in Mountain Regions: a Review of Possible Impacts.
Climatic Changes, 59: 5 - 31.
Besl, P.J., Mc Kay, N.D., 1992. A Method for Registration of 3D Shapes. IEEE Transactions on
Pattern Analysis and Machine Intelligence, 14(2): 239 - 256.
Biasion, A., Bornaz, L., Rinaudo, F., 2005. Laser Scanning Applications on Disaster
Management. In: P. Van Oosterom, S. Zlatanova and E.M. Fendel (Editors), Geo-
information for Disaster Management. Earth and Environmental Science. Springer,
Berlin, pp. 19 - 33.
Bonardi, L., Catasta, G., Righetti, F., D'Adda, S., 2006. Manuale di Osservazioni
Glaciologiche. I Quaderni del Servizio Glaciologico Lombardo, 5. Servizio
Glaciologico Lombardo, Milano, 47 pp.
Carrasco, J.F., Cassassa, G., Quimtana, J., 2005. Changes of the 0 C Isotherm and the
Equilibrium Line Altitude in Central Chile During the Last Quarter of the
Twentieth Century. Hydrological Sciences Journal, 50: 933 - 948.
Chen, Y., Medioni, G.G., 1992. Objec Modeling by Registration of Multiple Range Images.
Images and Vision Computing, 10(3): 145 - 155.
Davies, M.C.R., Hamza, O., Harris, C., 2001. The Effect of Rise in Mean Annual Temperature
on the Stability of Rock Slopes Containing Ice-Filled Discontinuities. Permafrost
and Periglacial Processes, 12: 137 - 144.
De Smith, M.J., Goodchild, M.F., Longley, P.A., 2007. Geospatial Analysis: A Comprehensive
Guide to Principles, Techniques and Software Tools, 414 pp.
Deline, P., Chiarle, M., Mortara, G., 2002. The Frontal Ice Avalanche of Frebouge Glacier
(Mont Blanc Massif, Valley of Aosta, NW Italy) on 18 September 2002. Geografia
Fisica e Dinamica Quaternaria, 25: 101 - 104.
Deline, P., Chiarle, M., Mortara, G., 2004a. the July 2003 Frebouge Debris Flow (Mont Blanc
Massif, Valley of Aosta, Italy): Water Pocket Outburst Flood and ice Avalanche
Damming. Geografia Fisica e Dinamica Quaternaria, 27: 107 - 111.
Deline, P., Diolaiuti, G., Kirkbride, M.P., Mortara, G., Pavan, M., Smiraglia, C., Tamburini,
A., 2004b. Drainage of Ice-Contact Miage Lake (Mont Blanc Massif, Italy) in
September 2004. Geografia Fisica e Dinamica Quaternaria, 27: 113 - 119.
www.intechopen.com
Laser Scanner Technology
118
De Saussure, H.B., 1779 - 1796. Voyages dans les Alpes, 4, Neuchatel.
Diolaiuti, G., Pecci, M., Smiraglia, C., 2003. Liligo Glacier (Karakoram): reconstruction of the
recent history of a surge-type glacier. Annals of Glaciology, 36: 168 - 172.
Federici, P., Luzi, G., Noferini, L., Mecatti, D., Macaluso, G., Tamburini, A., Martelli, D.,
2008. Report on Use of Ground Remote Monitoring (GB-SAR and TLS) for
Extraction of Topography and Flow Properties of Glaciers. Deliverable D8.1, Project
Galahad, EC FP6 project no. 018409, www.galahad.eu.
Fischer, L., Kaab, A., Huggel, C., Noetzli, J., 2006. geology, Glacier Retreat and Permafrost
Degradation as Controlling Factors of Slope Instabilities in a High-mountain Rock
Wall: the Monte Rosa East Face. Natural Hazards and Hearth System Sciences, 6:
761 - 772.
Fischer L.,Eisenbeiss H., Kaab A., Huggel C., Haeberli W.,2011 Monitoring Topographic
Changes in a Periglacial High-mountain Face using High-resolution DTMs, Monte
Rosa East Face, Italian Alps Permafrost and Periglacial Processes, 22 (2), pp. 140–
152, April/June 2011
Giani, G.P., Silvano, S., Zanon, G., 2001. Avalanche of 18 January 1997 on Brenva glacier,
Mont Blanc Group, Western Italian Alps: an unusual process of formation. Annals
of Glaciology, 32: 333 - 338.
Godone, F., Godone, D., Tamburini, A., Mortara, G., 2007. La valanga di roccia della Cima
Thurwieser (SO): determinazione del volume con tecniche di fotogrammetria
digitale., 11a Conferenza Nazionale ASITA, Centro Congressi Lingotto, Torino 6 -
9/11/2007.
Godone D., Godone F., Tamburini A., 2010. Belvedere glacier monitoring: a
multidisciplinary approach, GI4DM 2010 Conference "Geomatics for Crisis
Management", 2 - 4/02/2010, Torino, Italy.
Haeberli, W., Kaab, A., Paul, F., Chiarle, M., Mortara, G., Mazza, A., Deline, P., Richardson,
S., 2002. A Surge-type Movement at Ghiacciaio del Belvedere and a Developing
Slope Instability in the East Face of Monte Rosa, Macugnaga, Italian Alps. Norsk
Geografisk Tidsskrift - Norwegian Journal fo Geography, 56: 104 - 111.
Haeberli, W., Noetzli, J., Zemp, M., Baumann, S., Frauenfelder, R., Hoelzle M., 2005. Glacier
Mass Balance Bulletin No. 8 (2002-2003). Compiled by the World Glacier
Monitoring Service (WGMS). IUGG (CCS)/UNEP/UNESCO.
Hoelzle M., Haeberli W., Dischl, M., Peschke, W., 2003. Secular glacier mass balances
derived from cumulative glacier length changes. Global and Planetary Change, Vol.
36, Issue 4, May 2003, pp. 295-306.
Huggel, C., 2004. Assessment of Glacial Hazards Based on Remote Sensing and GIS
Modeling, Matematisch-Naturwissenschftlichen Fakultat, Zurich, 75 pp.
Hunter, G., Pinkerton, H., Airey, R., Calvari, S., 2003. The Application of a Long-range Laser
Scanner for Monitoring Volcanic Activity on Mount Etna. Journal of Volcanology
and Geothermal Research, 123: 203 - 210.
Kaab, A., Huggel, C., Fischer, L., Guex, S., Paul, F., Roer, I., Salzmann, N., Schlaeffi, S.,
Schmutz, K., Schneider, D., Strozzi, T., Weidmann, Y., 2005. Remote Sensing of
Glacier- and Permafrost-related Hazards in High Mountains an Overview. Natural
Hazards and Hearth System Sciences, 5: 527 - 554.
www.intechopen.com
The Support of Geomatics in Glacier Monitoring: The Contribution of Terrestrial Laser Scanner
119
Kamb, B., Raymond, C.F., Harrison, W.D., Engelhardt, H., Echelmeyer, K.A., Humprey, N.,
Brugman, M.M., Pfeffer, T., 1985. Glacier Surge Mechanism: 1982-1983 Surge of
Variegated Glacier. Science, New Series, 227(4686): 469 - 479.
Lambers, K., Eisenbeiss, H., Sauerbier, M., Kupferschmidt, D., Gaisecker, T., Sotoodeh, S.,
Hanusch, T., 2007. Combining photogrammetry and laser scanning for the
recording and modelling of the Late Intermediate Period site of Pinchango Alto,
Palpa, Peru, Journal of Archaeological Science, 34(10):1702 - 1712.
Massonet, D., Feigl, K.L. ,1998. Radar interferometry and its application to changes in the
Earth’s surface. Rev. Geophys., 36, 441-500.
Mazza, A., 1998. Evolution and Dynamics of Ghiacciaio Nord delle Locce (Valle Anzasca,
Western Alps) from 1854 to the Present. Geografia Fisica e Dinamica Quaternaria,
21: 233 - 243.
Mazza, A., 2003. La Teoria delle Onde Cinematiche: Possibile Applicazione al Ghiacciaio del
Belvedere (Valle Anzasca, Alpi italiane). Ipotesi Preliminari. Terra Glacialis, 6: 23 -
33.
Miller, M.M., 1971. glaciers and Glaciology. Encyclopedia of Science & Technology.
Mcgraw-Hill, pp. 218 - 229.
Mortara, G., Chiarle, M., Tamburini, A., 2003. The Emergency Caused by the "Effimero"
Lake on the Belvedere Glacier (Macugnaga, Monte Rosa Group, Italian Alps). In: D.
Richard and M. Gay (Editors), Glaciorisk EVG1 2000 00512 Deliverable.
Oppikofer, T., Jaboydeoff, M., Blikra, L.H., Derron, M., 2008. Characterization and
Monitoring of the Aknes Rockslide using Terrestrial Laser Scanning. In: J. Locat, D.
Perret, D. Turmel, D. Demers and S. Leroueil (Editors), 4th Canadian Conference
on Geohazards: From Causes to Management. Presse de l'Université, Laval,
Québec, pp. 211 - 218.
Rott, H., Nagler, T., 2005. Observational requirements for improving monitoring and
forecasting - Glaciers. In: R. Sailer (Editor), Technical Report on User Requirements
for Improved Monitoring of Landslide, Glaciers and Avalanche Hazards and on
Recommendations for Methodological and Technical Development in the Project.
GALAHAD Deliverable, pp. 28 - 30.
Sailer, R, Schaffhauser, A., Fromm R., Jörg P., Herrera G., Bardasano L., Ponce de León D.,
Rott, H., Nagler, T., 2005. Technical report on user requirements for improved
monitoring of landslides, glaciers and avalanche hazards and on recommendations
for methodological and technical developments in the project. Deliverable D1-1.
Project Galahad:, EC FP6 project no. 018409, www.galahad.eu.
Somigliana, C., 1917. Primi Rilievi del Ghiacciaio di Macugnaga. Rivista Club Alpino
Italiano, 36(3 - 4): 65 - 67.
Tamburini, A., Mortara, G., 2004. The Case of the "Effimero" Lake at Monte Rosa (Italian
Western Alps): Studies, Field Surveys, Monitoring. In: F. Maraga and M. Arratano
(Editors), Progress in Surface and Subsurface Water Studies at Plot and Small basin
Scale. Technical Documents in Hydrology. Unesco - International Hydrology
Programme, Turin, pp. 179 - 184.
Tamburini, A., Mortara, G., Belotti, M., Federici, P., 2003. The emergency caused by the
“Short-lived Lake” of the Belvedere Glacier in the summer 2002 (Macugnaga,
www.intechopen.com

Laser Scanner Technology
120
Monte Rosa, Italy). Studies, survey techniques and main results. Terra Glacialis, 6:
37 - 54.
Wasowski, J., Gostelow P., 1999. Engineering geology landslide investigations and SAR
interferometry. Proc. of FRINGE’99, Liege, Belgium, November 1999,
http://esrin.esa.it/fringe99.
Züblin M., Fischer L., Eisenbeissa H., 2008 COMBINING PHOTOGRAMMETRY AND
LASER SCANNING FOR DEM GENERATION IN STEEP HIGH-MOUNTAIN
AREAS The International Archives of the Photogrammetry, Remote Sensing and
Spatial Information Sciences. Vol. XXXVII. Part B6b. Beijing 2008
www.intechopen.com
Laser Scanner TechnologyEdited by Dr. J. Apolinar Munoz Rodriguez
ISBN 978-953-51-0280-9Hard cover, 258 pagesPublisher InTechPublished online 28, March, 2012Published in print edition March, 2012
InTech EuropeUniversity Campus STeP Ri Slavka Krautzeka 83/A 51000 Rijeka, Croatia Phone: +385 (51) 770 447 Fax: +385 (51) 686 166www.intechopen.com
InTech ChinaUnit 405, Office Block, Hotel Equatorial Shanghai No.65, Yan An Road (West), Shanghai, 200040, China
Phone: +86-21-62489820 Fax: +86-21-62489821
Laser scanning technology plays an important role in the science and engineering arena. The aim of thescanning is usually to create a digital version of the object surface. Multiple scanning is sometimes performedvia multiple cameras to obtain all slides of the scene under study. Usually, optical tests are used to elucidatethe power of laser scanning technology in the modern industry and in the research laboratories. This bookdescribes the recent contributions reported by laser scanning technology in different areas around the world.The main topics of laser scanning described in this volume include full body scanning, traffic management, 3Dsurvey process, bridge monitoring, tracking of scanning, human sensing, three-dimensional modelling, glaciermonitoring and digitizing heritage monuments.
How to referenceIn order to correctly reference this scholarly work, feel free to copy and paste the following:
Danilo Godone and Franco Godone (2012). The Support of Geomatics in Glacier Monitoring: The Contributionof Terrestrial Laser Scanner, Laser Scanner Technology, Dr. J. Apolinar Munoz Rodriguez (Ed.), ISBN: 978-953-51-0280-9, InTech, Available from: http://www.intechopen.com/books/laser-scanner-technology/the-support-of-geomatics-in-glacier-monitoring-the-contribution-of-terrestrial-laser-scanner

© 2012 The Author(s). Licensee IntechOpen. This is an open access articledistributed under the terms of the Creative Commons Attribution 3.0License, which permits unrestricted use, distribution, and reproduction inany medium, provided the original work is properly cited.


![Monitoring Glacier Surface Seismicity in Time and Space ... · observed seismic signals with glacier dynamic events (e.g., a draining glacier lake as in Walter et al. [2008] and Roux](https://img.pdfslide.net/doc/110x75/5e856d9aeed7230f6f4f0d14/monitoring-glacier-surface-seismicity-in-time-and-space-observed-seismic-signals.jpg)


![ADVANCES IN MODELLING, HEALTH-MONITORING, … · 2020. 8. 11. · [ultimo aggiornamento: 26 luglio 2019 ore 15:00] advances in modelling, health-monitoring, infrastructures, geomatics,](https://img.pdfslide.net/doc/110x75/608160f3be0b001b35590e4a/advances-in-modelling-health-monitoring-2020-8-11-ultimo-aggiornamento.jpg)