Embed Size (px)
Citation preview

Graduate School of Development Studies
A Research Paper presented by:
Yustinus Edy Pramono Indonesia
in partial fulfillment of the requirements for obtaining the degree of MASTERS OF ARTS IN DEVELOPMENT STUDIES
Specialisation: Economic of Development
(ECD)
Members of the examining committee:
Dr. Peter de Valk (supervisor) Dr. Arjun Bedi (reader)
The Hague, The Netherlands August, 2008
The SWOT Analysis of Exports Activities of Shrimp Products: The Case of Indonesia
2
Disclaimer:
This document represents part of the author’s study programme while at the Institute of Social Studies. The views stated therein are those of the author and not necessarily those of the Institute.
Research papers are not made available for circulation outside of the Institute.
Inquiries:
Postal address: Institute of Social Studies P.O. Box 29776 2502 LT The Hague The Netherlands
Location: Kortenaerkade 12 2518 AX The Hague The Netherlands
Telephone: +31 70 426 0460
Fax: +31 70 426 0799
3
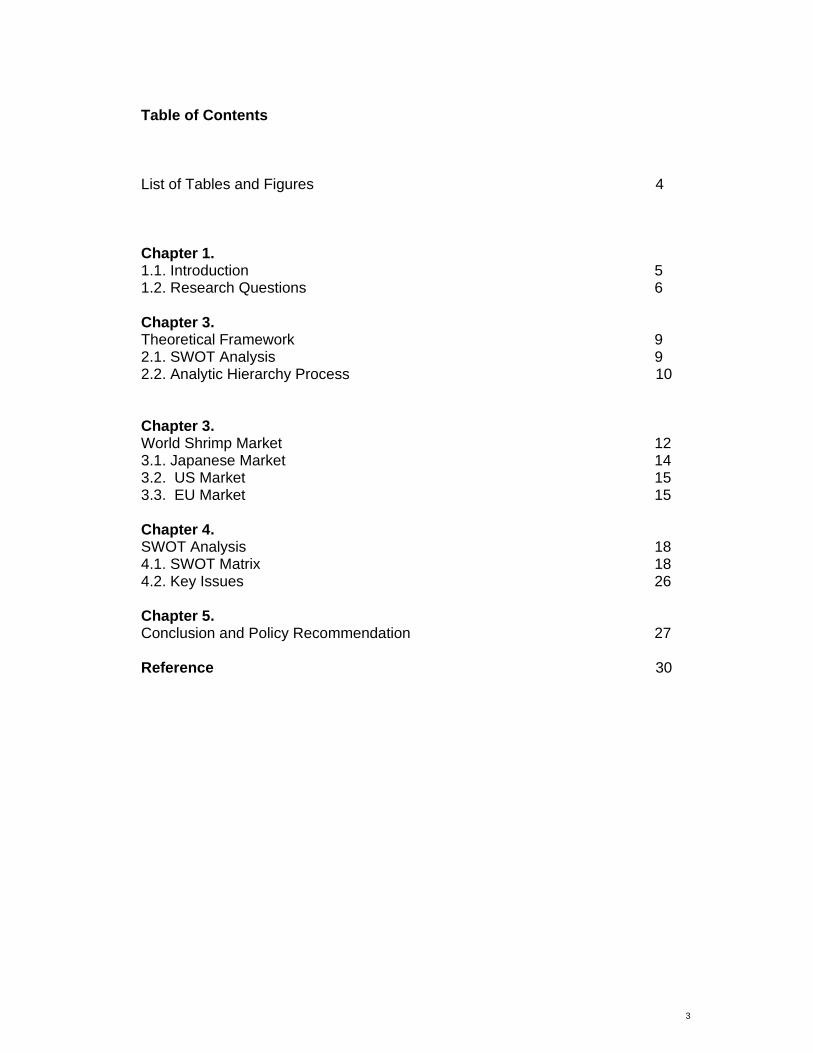
Table of Contents
List of Tables and Figures 4
Chapter 1. 1.1. Introduction 5 1.2. Research Questions 6 Chapter 3. Theoretical Framework 9 2.1. SWOT Analysis 9 2.2. Analytic Hierarchy Process 10
Chapter 3. World Shrimp Market 12 3.1. Japanese Market 14 3.2. US Market 15 3.3. EU Market 15 Chapter 4. SWOT Analysis 18 4.1. SWOT Matrix 18 4.2. Key Issues 26 Chapter 5. Conclusion and Policy Recommendation 27 Reference 30

4
List of Tables and Figures
Table 1. World Shrimp Production 13
Table 2. Potential Area and Effective Area for Shrimp Culture 19
Table 3. Thailand Shrimp Ponds Area 20
Table 4. China Shrimp Ponds Area 20

5
Chapter I
Introduction
1.1. Introduction
Indonesia as the biggest archipelagic country in the world has huge
resources in marine sectors. One of the most promising marine resources
which can be exploited for the continuation of economical development of
Indonesia is the exploitation on fishery. The fishery sector has absorbed 6.1
million people. In the fishery processing industry, the manpower absorbed in
2006 reached 310,000 people. If added to those engaged in marketing
activities (i.e. transportation, distribution, wholesaler and retailer handling) the
total manpower absorbed in the fishery processing and marketing is 600,000
people. The commodity value of fisheries and oceanic products are
considerable. Despite the fact that it is not yet being fully explored, currently,
this sector is capable of contributing as much as 2.51% to the GDP in 2006.
The export value of fishery products in 1996 was substantial, reaching US$
2.1 billion. This indicates a rise of 9.1% compared to that of 2005. In the
meantime, the world’s consumption of sea fish is increasing from time to time.
Demand for fish in 2010 was projected to reach a figure of 7.5 million tonnes
per year, while the supply was well below. (Bank export Indonesia, 2007)
Shrimp, with an upward trend in its export volume, is undeniably one of
the prime export commodities in the fishery sector. Based on the data of the
Ministry of Marine Affairs and Fisheries, in the year 2003, the export volume of
Indonesian shrimps in the global market reached an amount of 139,450 tons

6
valuing at US$ 887.13 million per year. In the year 2004, the export volume
increased to 143,550 tons, valuing at US$ 1,086 billion per year. While in
2006, it has been estimated to increase up to 300,000 tons per year. In fact,
by 2009, the government has targeted the export volume of domestic shrimps
to break the 540,000 tons-per year level.
So far, Indonesian shrimps have been exported to Japan, European
Union and the United States. These countries are known to be the world’s
major consumers of seafood, especially those originating from Indonesia.
Nevertheless, it does not imply that the export of Indonesian shrimps thereto
can run smoothly without any obstacles. On the contrary, many local
government policies seem to be the hindrance. For instance, Japan and
European Union have now started to enforce a tight policy on Indonesian
shrimps. Export of fishery product to Japan should comply with the new
implemented regulation which is 1 mg per tons (1 part per billion/ppb)
maximum limit of antibiotics and residue floating rate. This tight prerequisite
started to be demanded by Japan upon their rejection of Indonesian shrimps
at the end of 2005. Those rejected frozen shrimps were indicated to have
contained antibiotics and residue higher than 1 ppb. Actually, this prerequisite
was a follow-up of their previous policy. As of January 1, 2004, Japan had
tightened their import policies by requiring the antibiotics content in shrimps to
be less than 0.01 part per million (ppm) as compared to the preceding level of
0.05 ppm. The tightening of import policies undertaken by Japan was then
followed suit by the European Union. The European countries now also
enforce the standard maximum limit of antibiotics and residue floating rate of
1 ppb instead of 1 ppm (part per million). This prerequisite has been

7
announced by the European Union, upon completion of their inspection in
several fishery ports, laboratories and 12 fishery processing units in Indonesia.
The above regulation perfected the previous European Union’s import policies
on shrimps. In 2001, the European Union countries required that the imported
shrimps ought to be free from any antibiotics element. As regards the local
policies imposed by governments of the export destination countries, domestic
shrimp’s producers should not sit on their laurels on the account of the
opportunities still open for them. A consistent production of shrimps with high
quality standard should always be maintained. More researches and
cultivation technologies should be performed and more laboratory testing tools
should be added. These actions should be taken to prevent any possible
obstacles in the sales of shrimps in the global market. The domestic shrimp
production rate is considered quite high and the growing trend from year to
year is impressive. For instance, in the year 2003, the production of cultivated
shrimps amounted only to 192,935 tons per year. This annual quantity rose to
238,843 tons, 281,049 tons and 327,260 tons in 2004, 2005 and 2006
accordingly. Even this year, the shrimp production has been estimated to
reach the 410,000 tons-per year level. In view of the above facts, this high
potential should not be foregone. (Bank Ekspor Indonesia, 2007)
1.2. Research Question:
What policy recommendation should be taken to increase the export of shrimp
product in the global market?
Sub questions:
- What is strengths, weaknesses, opportunity and cost of the shrimp export

8
production to the global market?
- What internal and external factor influencing the export of shrimp
production to global market?
9
Chapter II:
Theoretical Framework
2.1. SWOT Analysis
The SWOT analysis approach (also referred to as the “design school
model”; Mintzberg 1994) seeks to address the question of strategy formation from
a two-fold perspective: from an external appraisal (of threats and opportunities in
an environment) and from an internal appraisal (of strengths and weaknesses in
an organisation). The two perspectives can be differentiated by the different
degree of control attainable within each. The dynamic and unrestricted nature of
the external environment can seriously hamper the process of detailed strategic
planning, whilst internal factors are – or at least should be – more easily
manageable for the organisational entity in question. The model originally stems
from the business management literature, where such an analysis has a clearly
identifiable, strategic goal, as it is intended to shed light on outside opportunities
and threats that can affect the future of a business, thereby suggesting some
possible remedial actions that might be appropriate in certain circumstances. The
internal analysis of a company’s strengths and weaknesses is in turn intended to
highlight certain strategies that the company can exploit, in particular, drawing
attention to certain practices that the company may need to correct. (Kotler 1988:
80.) Analogous to this business strategy, public institutions may also use a similar
method to outline the internal and external factors relevant to their strategic
planning process. During the 1980s, public administration embraced this classical
model of strategic planning, adopting the basic managerial model across such
areas as regional development and municipal planning (Sotarauta & Linnamaa
1997: 75, European Commission 1999, Bryson and Roaring 1987).

10
Four Elements of a SWOT analysis:
A strength = a resource or capacity the organisation can use effectively to achieve
its objectives
A weaknesses = a limitation, fault or defect in the organisation that will keep it from
achieving its objectives
An opportunity = any favourable situation in the organisation’s environment
A threat = any unfavourable situation in the organisation’s environment that is
potentially damaging to its strategy
The actions to be undertaken that can be deduced from these four elements are:
· Build on strengths
· Eliminate weaknesses
· Exploit opportunities
· Mitigate the effect of threats (Dealtry 1992: 2).
2.2. Analytic Hierarchy Process
Analytical Hierarchy Process (AHP) is an approach to decision making that
involves structuring multiple choice criteria into a hierarchy, assessing the relative
importance of these criteria, comparing alternatives for each criterion, and
determining an overall ranking of the alternatives. (Saaty, 1982)
11
Steps of the analytical hierarchy process
1. Decomposing
The goal is to structure the problem into humanly-manageable sub-problems.
Iterating from top (the more general) to bottom (the more specific), split the
problem, which is unstructured at this step, into sub-modules that will become
sub-hierarchies. Navigating through the hierarchy from top to bottom, the AHP
structure comprises goals (systematic branches and nodes), criteria
(evaluation parameters) and alternative ratings (measuring the adequacy of the
solution for the criterion).
Each branch is then further divided into an appropriate level of detail. At the
end, the iteration process transforms the unstructured problem into a
manageable problem organized both vertically and horizontally under the form
of a hierarchy of weighted criteria.
By increasing the number of criteria, the importance of each criterion is thus
diluted, which is compensated by assigning a weight to each criterion.
2. Weighing
Assign a relative weight to each criterion, based on its importance within the
node to which it belongs. The sum of all the criteria belonging to a common
direct parent criterion in the same hierarchy level must equal 100% or 1. A
global priority is computed that quantifies the relative importance of a criterion
within the overall decision model.
3. Evaluating
Score alternatives and compare each one to others. A relative score for each
alternative is assigned to each leaf within the hierarchy, then to the branch the
leaf belongs to, and so on, up to the top of the hierarchy, where an overall

12
score is computed.
4. Selecting
Compare alternatives and select the one that best fits the requirements.

13
Chapter III
World Market
Study of shrimp marketing conducted by ADB, FAO and INFOFISH, 1993
shows that most of the shrimp producer country consuming about 50% form their
production. in Indonesia the consumption per-capita of shrimp is low, because of
the low income and the price of the shrimp relatively high compared to the other
substitute commodities. The domestic consumption of shrimp usually the tiny
types shrimp and not for export market.
For the export market, Indonesia exporting commodity of shrimp to several
countries. The majority of Indonesia shrimp commodity are exported to Japan,
European countries and United States. The others market for Indonesian shrimp
are Hong Kong, and Singapore. (FAO, 1999)
Table I. World Shrimp Production
Country 1992 1993 1994 1995 1996 1997 1998 1999 2000 China 574.10 488.70 603.40 665.60 751.80 829.60 970.90 1,222.70 1,241.90India 290.40 363.00 446.60 406.10 415.60 366.60 413.10 423.30 405.70Thailand 300.60 343.10 385.00 389.30 370.80 350.80 345.40 370.90 398.50Indonesia 312.10 300.70 317.10 334.70 343.30 382.20 345.50 384.50 398.40USA 156.50 137.90 130.20 140.20 145.00 132.90 128.00 140.10 153.00Vietnam 86.20 94.60 111.70 138.10 135.90 147.70 148.40 148.90 151.10Canada 43.10 47.40 53.20 63.10 65.70 82.10 113.10 120.00 130.60Malaysia 129.40 109.80 106.40 99.60 108.00 101.00 57.10 102.70 111.90Mexico 66.20 79.80 77.30 85.90 78.90 88.50 90.30 95.60 95.10Greenland 81.90 76.50 79.80 81.90 72.00 63.90 69.60 79.20 81.50Philippines 118.80 130.10 126.60 127.50 113.20 74.50 72.30 73.10 79.40Norway 49.10 49.00 38.20 39.30 41.50 42.00 57.10 64.20 66.20Bangladesh 21.00 28.50 28.80 34.00 49.30 56.50 66.10 81.10 58.20Brazil 44.00 38.40 38.50 43.00 38.90 44.10 42.80 47.70 56.60Ecuador 127.00 97.50 98.70 112.10 112.90 137.20 147.40 121.00 51.40KoreaRep. 67.10 68.00 58.10 42.50 40.90 41.10 47.60 44.70 37.20Others 529.30 542.00 551.70 594.50 622.90 633.70 647.40 599.20 651.70 Total 2,996.80 2,995.00 3,251.30 3,397.40 3,506.60 3,574.40 3,762.10 4,118.90 4,168.40
Source: Globefish, 2000
14
Shrimp production that is capture and aquaculture has expanded over the
past decade from 2.9 million MT in 1992 to 4.2 million MT in 2000. In this level,
shrimp production has stabilized. The world main shrimp producing country is
China with 1.2 million MT. This country is the main responsible for the strong
increase. The other three major shrimp producing countries: Indonesia, India and
Thailand have experienced many up-and-downs during the period with production
oscillating between 300 000 and 400 000 MT each. (Helga Josupeit, GLOBEFISH,
2004). The share of aquaculture production in total shrimp production grew during
the 1980s. In 1988 this share already exceeded 20%, and the positive trend
continued until 1992, when farmed shrimp accounted for almost 30% of total
shrimp output. Since then, disease problems and the positive trend of shrimp
capture fisheries led to a decline in the role the aquaculture plays. At present, only
25% of total shrimp production comes from aquaculture, and this share has been
stable over the past years.
Total shrimp exports have increased almost steadily in the last 15 years,
Thailand is the world’s major shrimp exporter, however in 1997, Thailand
shipments declined as a result of disease problems. In 1998, the disease problem
came under control, and Thailand exports were back to normal which is 240 000
MT. In recent years, Thailand exports have been negatively influenced by EU bans
on antibiotics found in shrimp. Indian shrimp exports are about stable at 100 000
MT.
Shrimp imports have also grown strongly in the last three years. Value of
shrimp trade was quite stable at US$ 10 billion over the past 6 years, which
indicates a steady decline in shrimp prices. The main shrimp importing countries
have always been Japan and the USA, with the USA taking over in recent years.
15
In the last years, Japanese imports have declined, due to the low demand caused
by economical un-certainty. The shift from Japan to the USA as main importer
created substantial problems for the main traditional exporters to the Japanese
market, mainly from Asia. Shrimp imports into Europe continues to grow, with
Spain as the main market, followed by France and UK. The Danish shrimp imports
are mainly re-exported. (Helga Josupeit, GLOBEFISH, 2004).
3.1. Japanese Market
Japanese shrimps imports in 2004 more than 300,000 tons (240,000 of
frozen unprocessed shrimp). The market focused on imports of high quality large
P. monodon which has favored Indonesia given its production of this larger sized
species of shrimp. Indonesia was the second most important exporter to Japan
with 48.6 thousand tons in 2004, but its share has been falling since 2001, with
China, Thailand and Vietnam all showing rapid penetration into the Japanese
market.
3.2. US Market
Despite anti-dumping tariffs, imports in 2004 at 518,000 tons were up 3%
compared to 2003, largely due to lower unit values boosting domestic demand in
the US. The imposition of tariffs against China, Thailand, Ecuador, India, Vietnam,
and Brazil following the anti-dumping case, had a significant impact on individual
countries. China, Brazil, and India, that hit with the highest tariffs from the anti-
dumping case, had declines of 80%, 68% and 18% respectively in shipments of
raw shell on shrimp to the US. But Thailand, Ecuador, and Vietnam, all with
relatively low tariffs, had increases for shell on headless shrimp of 55%, 39% and

16
32% respectively. The anti-dumping tariffs have also had an impact on product
types in the US market. The major category that saw a large increase was in
breaded product, which is exempt from anti-dumping duties, mostly coming from
China. Indonesia was the third largest exporter of shrimp to the US market in
200436, after Thailand and China. The decline in Indonesian exports to Japan was
more than made up for by an increase in Indonesian exports to the USA in 2004.
However, Indonesia did not perform as well as would have been expected in the
US market in 2005. Because of relatively little Indonesian value-added production
in breaded products compared to other producers, exports to the US were virtually
unchanged in 2005. And raw headless shipments were up only 3%, which is of
concern given its favorable position with respect to higher tariffs and Continuous
Bond Policy in the US that Thailand, Ecuador, China, India and Vietnam have to
comply with. (FIAS-World Bank, 2006.)
3.3. EU Market
Shrimp consumption in 2004 was boosted in EU markets by lower Euro
prices, and the first half of 2005 showed similar import volumes to 2004. Key
markets are Spain, Germany, Italy, France, and the UK. Thailand, Ecuador, Brazil,
Madagascar, India and Bangladesh are especially important exporters of shrimp to
EU markets. Noticeable is the relative lack of penetration into the EU market by
Indonesian suppliers. With the reinstatement of Thailand’s GSP privileges, and the
diversion of Chinese, India, Brazilian shrimp exports from US markets due to
effects of antidumping duties, Indonesian shrimp farmers can expect a lot more
competition in the EU market. Thai firms expect to increase their exports to EU
17
markets by about 7 - 8% up to 450,000 tons in 2006, with particular emphasis on
improvements in compliance to food quality and safety standards.
In other emerging markets (Canada, Australia) Indonesia also faces rising
degree of competition – especially from Vietnam. Vietnam’s exports to Australia,
for example, showed strong growth increased by 60% in 2004 and by 37% in 2005
– partly driven by trade diversion effects of US anti-dumping tariffs imposed on
Vietnam. Demand within the industry is very responsive to changes in price, hence
more efficient producers that can charge lower prices are able to increase market
share. This might be beneficial to Indonesia because of its comparative advantage
in farmed shrimp production due to its access to all year-round warmer water that
prevent outbreaks of White Spot Syndrome Virus.
In the medium to longer-term, both demand and prices of shrimp are
expected to rise. Based on the most likely set of assumptions, global food fish
production will increase slightly faster than global population through 2020, with
per capita consumption projected to rise, and real prices are also expected to rise
by 16 percent for crustaceans. Demand for shrimp is determined by many factors,
but especially important are both population and income. While population in the
key markets of EU, USA and Japan may not rise significantly in the coming years,
other countries’ populations will do so providing expanding markets in other areas,
and income increases in the USA, EU and Japan are also likely to increase
demand and prices. This is especially true for a high value product such as
shrimp. Indonesia can position itself well to take advantage of these opportunities,
if certain constraints and challenges confronting the industry are promptly
addressed (FIAS-World Bank, 2006.)
18
Chapter IV
SWOT Analysis
Shrimp is Indonesia prime commodity in aquaculture and contributes 80%
of total fishery export commodities. This fact has made the shrimp commodity as
the favourite business investment in Indonesia, and also for traditional farming for
Small and Medium Scale Enterprises.
Shrimp industry in Indonesia relies on the comparative advantages. The
Japanese market not impose high requirement for Indonesia shrimp which is most
of the shrimps are exported in frozen and fresh. Therefore most of Indonesian
shrimp are exported to Japan, while the USA and the European markets were not
easy to export the shrimps product, because USA and European countries impose
high requirement for the products imported.
The objective of this study was to formulate the strategies to find out
alternatives solutions that can be applied to solve the Indonesian shrimp industry
problems by the Government of Indonesia and the shrimp entrepreneurs. SWOT
analysis was used to identify the environmental assessment of shrimp industry to
evaluate strengths, weaknesses, opportunities and threats. Meanwhile, in order to
obtain the priority or weight for each element in internal and external factors using
analytical hierarchy process.
4.1. SWOT Matrix
Strengths
1. Indonesia has big resources in shrimp production in aquaculture.
In aquaculture the total of shrimp ponds farming 1,224,076 ha, spreading in

19
almost all provinces in Indonesia. This area are only 20% of the total areas
that potential for shrimp farming. Currently 64,21% of the total potential ponds
area still available to be developed as shrimp ponds.
The main producers of shrimp farming in Indonesia are South Sulawesi
province with the effective area 142,255 ha and more than 711,000 ha are
potential to be developed as shrimp farming. Aceh province and East
Kalimantan province are also has more than 100,000 ha effective area and
areas about 600,000 ha can be developed as shrimp ponds. The others area
that productive province are Lampung, provinces in Java Island and in
Kalimantan Island.
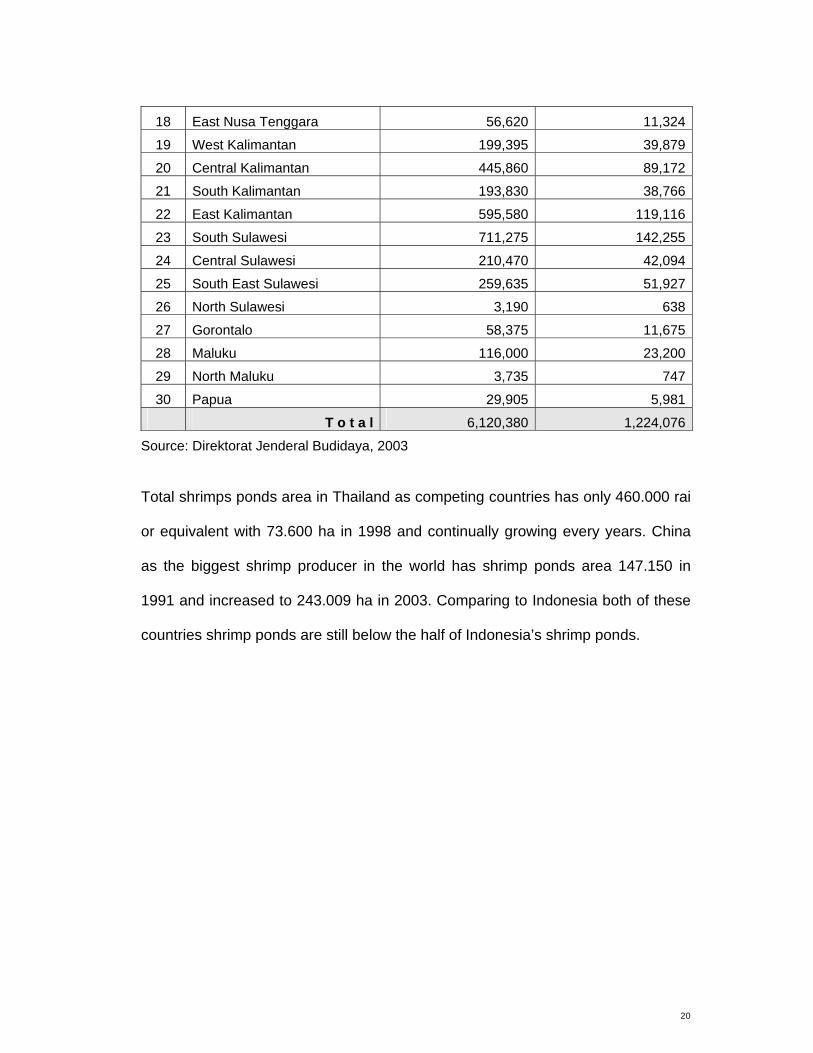
Table-2. Potential Area and Effective Area for Shrimp Culture
NO Provinces Potential Areas (Ha) Effective Areas (Ha) 1 Nangroe Aceh Darusalam 601,545 120,309
2 North Sumatera 222,840 44,568
3 West Sumatera 164,945 32,989
4 Riau 114,975 22,995
5 Jambi 108,355 21,671
6 South Sumatera 143,370 28,674
7 Bangka Belitung 275,420 55,084
8 Bengkulu 12,860 2,572
9 Lampung 498,480 99,696
10 DKI Jakarta 1,250 250
11 West Java 260,345 52,069
12 Banten 97,555 19,511
13 Central Java 160,140 32,028
14 DI Yogyakarta 3,375 675
15 East Java 311,035 62,207
16 Bali 13,215 2,643
17 West Nusa Tenggara 246,805 49,361
20
18 East Nusa Tenggara 56,620 11,324
19 West Kalimantan 199,395 39,879
20 Central Kalimantan 445,860 89,172
21 South Kalimantan 193,830 38,766
22 East Kalimantan 595,580 119,116
23 South Sulawesi 711,275 142,255
24 Central Sulawesi 210,470 42,094
25 South East Sulawesi 259,635 51,927
26 North Sulawesi 3,190 638
27 Gorontalo 58,375 11,675
28 Maluku 116,000 23,200
29 North Maluku 3,735 747
30 Papua 29,905 5,981
T o t a l 6,120,380 1,224,076
Source: Direktorat Jenderal Budidaya, 2003
Total shrimps ponds area in Thailand as competing countries has only 460.000 rai
or equivalent with 73.600 ha in 1998 and continually growing every years. China
as the biggest shrimp producer in the world has shrimp ponds area 147.150 in
1991 and increased to 243.009 ha in 2003. Comparing to Indonesia both of these
countries shrimp ponds are still below the half of Indonesia’s shrimp ponds.

21
Table 3. Thailand Shrimp Ponds Area
Year Farmers Area (rai) 1988 11,838.00 417,071.00 1989 14,253.00 474,551.00 1990 15,072.00 403,787.00 1991 18,998.00 470,826.00 1992 19,403.00 454,975.00 1993 20,027.00 449,292.00 1994 22,197.00 448,000.00 1995 26,145.00 468,386.00 1996 16,000.00 500,000.00 1997 15,500.00 450,000.00 1998 12,800.00 460,000.00
Source : Thailand Department of Fisheries (1998)
Table 4. China Shrimp Ponds Area
Northern China 1991 108.5702003 131.824Sourthern China 1991 38.5802003 111.185Source: Wang Qingyin, 2005
2. Big resources of manpower in Indonesia.
Fishery sector in Indonesia mostly used the human power in processing the
shrimp product. This conditions will absorb large number up employment in
fishery processing industry in Indonesia. In total, fishery sector has absorbed
6.1 million people. In the fishery processing industry, the manpower absorbed
in 2006 reached 310,000 people. If added to those who engaged in marketing
activities such as transportation, distribution, wholesaler and retailer handling
22
the total manpower absorbed in the fishery processing and marketing is more
than 600,000 people. The total employment rate in Indonesia has reached
108,13 million people in all sectors. (BPS, 2007). Increasing need of manpower
in the shrimp industry will be fully covered, in fact that the manpower absorbed
in the fishery sector is not highly skilled or educated people.
Weaknesses
1. The small production due to the limited technology, especially for small scale
and medium farmers.
The number of shrimp farmer in Indonesia is 2,459,356 in 2004, increasing
from 1,877,814 in 1999. (Statistik Perikanan, 2005). But, most of these farmer
are traditionally used their ponds for cultivating shrimp, causing the low output
of shrimp production. Only few medium and big company using the highly
technology on their farming. Most of the biggest shrimp farming company in
Indonesia doing their activities in Lampung province, East Java province and
South Sulawesi province. This company has integrated farming and processing
industry. This company has also absorb the shrimp production from traditional
farmers to be processed in their processing unit.
2. Small asset to expand and increase the production
Most of the shrimp farmer in Indonesia are doing their farming traditionally
because of the lack access to the finance or credit. There are limited farmer
that can access the formal capital from the banking sector in Indonesia, this

23
caused by:
(1) Inability of farmers to provide required collateral,
(2) Inability of farmers to provide full proof of tax payments and other
documentation
(3) The fishery sectors previously has poor performance and risk profile and
this may have slowed down the ability of traditional farmers to change to the
modern farming practices
3. Cost of shrimp feed is high relative to competing countries
Costs for feed used about 60% of the variable costs of operating a shrimp farm
in Indonesia. The use of feed and fertilizers is higher in countries such as
China, Indonesia, Thailand and Philippines, compared to Bangladesh, India,
and Vietnam because of high stocking density practices (Madan Dey et al,
2006). Furthermore, feed prices are higher compared to many other key
farmed-shrimp producers in other countries.
Table. 5 : Cost of shrimps feed
Country Cost/ton Indonesia $900/ ton Panama $440/ton Honduras $460/ton Vietnam $1000/ton Thailand $780/ton China $650/ton
Source: FIAS, 2006
Highly relative feed price comparing to others countries has an impact to the
selling prices of the shrimp product. This condition also has an impact for
competing in international market.

24
4. Poor quality and diversification of the product and value added product.
The poor quality of the shrimp farming industry is related to the poor of the
farmers and the investment problem. This also cause by the lack of the farmer
to access the financial credit to the banks sector, that slow down the ability to
increased or expand the their farming industry.
Opportunity
1. Shrimp business is profitable and has potential in export that attracts related
people to get involved.
In fact that the shrimp industry is highly risk and need a lot of capital in their
production, the shrimp businesses are profitable especially for export market
and value added product. This profitable industry can attract other people to
involved in this sector, and also attract foreign investor to invest in the shrimp
farming and processing industry.
2. Demands for shrimp product are increasing significantly each year
Demand for shrimp for consumption is increasing over time, the most valuable
markets for shrimp product are Japan, USA and European Market.
World demand for shrimp in 1999 has reached 2.1 million metric tons per years
against the supply that only 800,000 tons. (Bangkok Bank Research
Department, 2000). The demand for fish is also increasing, in 2010 demand
for fish was projected to reach a figure of 7.5 million tonnes per year, while the
supply was well below. (Bank Export Indonesia, 2007)
25
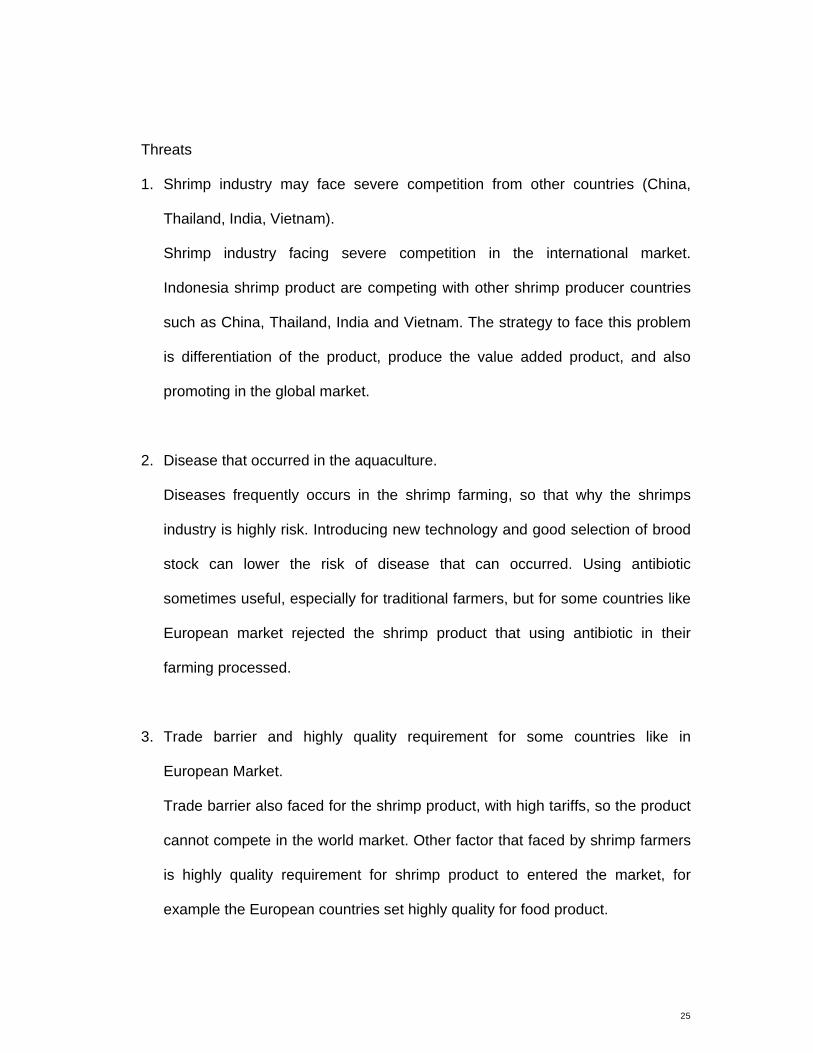
Threats
1. Shrimp industry may face severe competition from other countries (China,
Thailand, India, Vietnam).
Shrimp industry facing severe competition in the international market.
Indonesia shrimp product are competing with other shrimp producer countries
such as China, Thailand, India and Vietnam. The strategy to face this problem
is differentiation of the product, produce the value added product, and also
promoting in the global market.
2. Disease that occurred in the aquaculture.
Diseases frequently occurs in the shrimp farming, so that why the shrimps
industry is highly risk. Introducing new technology and good selection of brood
stock can lower the risk of disease that can occurred. Using antibiotic
sometimes useful, especially for traditional farmers, but for some countries like
European market rejected the shrimp product that using antibiotic in their
farming processed.
3. Trade barrier and highly quality requirement for some countries like in
European Market.
Trade barrier also faced for the shrimp product, with high tariffs, so the product
cannot compete in the world market. Other factor that faced by shrimp farmers
is highly quality requirement for shrimp product to entered the market, for
example the European countries set highly quality for food product.

26
4.2. Key issues:
1. Weak enforcement of existing product and process standards, technical and
other regulations
At present there is concern about the potential for food safety and
environmental standards, traceability, etc to marginalize poor/small-scale
producers due to the associated costs involved. Certainly, increasing standard
of production by importing countries on the quality of product originating from
shrimp farms, affecting to the farmers, shrimp processing industry and also
exporters to pay increasing attention to the quality of their products if they are
to maintain their access to diverse markets. But requirements in importing
countries apply to all exporters (traders and processors), and if health/hygiene
and environmental standards can be maintained/improved, then higher
standards can help in maintaining current markets, and access to the others
market. The country can not be competing to others countries that has applied
new standard that the importer has set up.
2. Poor quality of domestic brood stock used by domestic hatcheries to produce
shrimp, significantly lower the survival rates of the shrimp that cultivated, and
will also lower the productivity and quality of output from many farms.
Production form bad quality brood stock usually have higher mortality rate that
can lower the ouput of the production. That usually occurred in the small scale
shrimp farmers industry, because they cannot provide the good brood stock in
their farming.
27
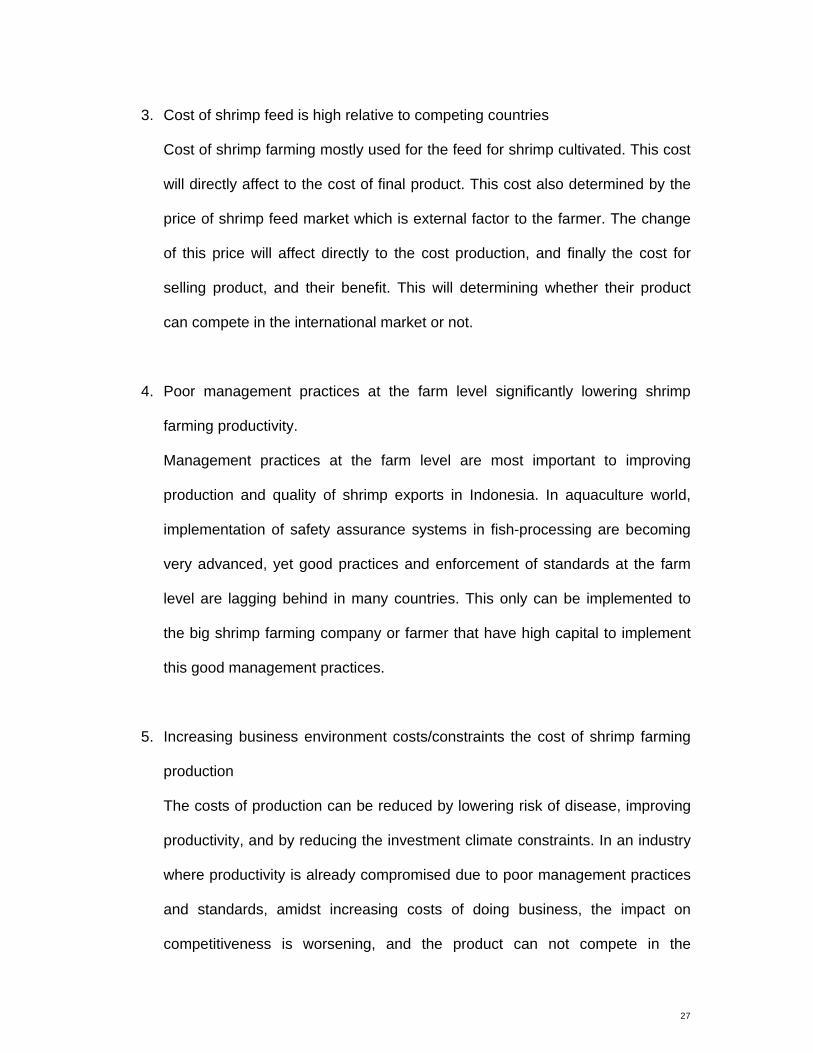
3. Cost of shrimp feed is high relative to competing countries
Cost of shrimp farming mostly used for the feed for shrimp cultivated. This cost
will directly affect to the cost of final product. This cost also determined by the
price of shrimp feed market which is external factor to the farmer. The change
of this price will affect directly to the cost production, and finally the cost for
selling product, and their benefit. This will determining whether their product
can compete in the international market or not.
4. Poor management practices at the farm level significantly lowering shrimp
farming productivity.
Management practices at the farm level are most important to improving
production and quality of shrimp exports in Indonesia. In aquaculture world,
implementation of safety assurance systems in fish-processing are becoming
very advanced, yet good practices and enforcement of standards at the farm
level are lagging behind in many countries. This only can be implemented to
the big shrimp farming company or farmer that have high capital to implement
this good management practices.
5. Increasing business environment costs/constraints the cost of shrimp farming
production
The costs of production can be reduced by lowering risk of disease, improving
productivity, and by reducing the investment climate constraints. In an industry
where productivity is already compromised due to poor management practices
and standards, amidst increasing costs of doing business, the impact on
competitiveness is worsening, and the product can not compete in the

28
international market.
6. Need to develop a stronger image and market information and promotion
strategy
The important thing in marketing the shrimp production is that shrimp product
can be accept by the buyers. The good product will easily entered the market,
even they faced a lot of competitors. The marketing system and promotion
activities can help the producer to sell or introduce their product the
international market.
29
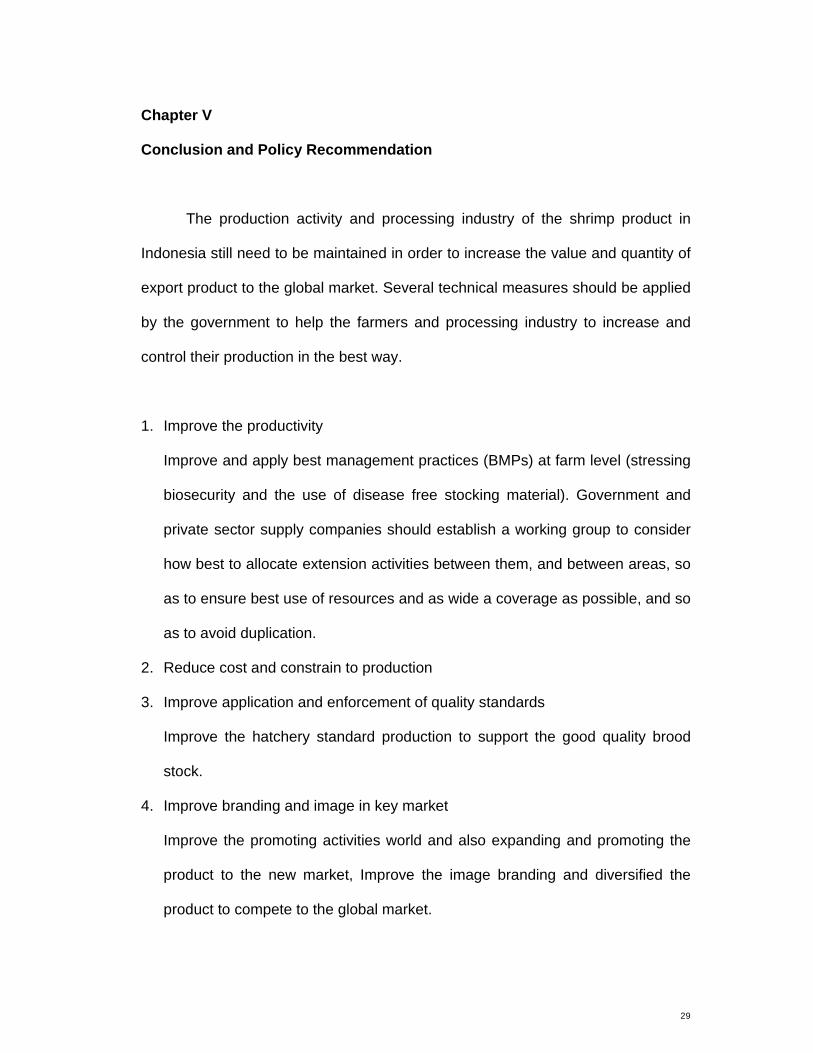
Chapter V
Conclusion and Policy Recommendation
The production activity and processing industry of the shrimp product in
Indonesia still need to be maintained in order to increase the value and quantity of
export product to the global market. Several technical measures should be applied
by the government to help the farmers and processing industry to increase and
control their production in the best way.
1. Improve the productivity
Improve and apply best management practices (BMPs) at farm level (stressing
biosecurity and the use of disease free stocking material). Government and
private sector supply companies should establish a working group to consider
how best to allocate extension activities between them, and between areas, so
as to ensure best use of resources and as wide a coverage as possible, and so
as to avoid duplication.
2. Reduce cost and constrain to production
3. Improve application and enforcement of quality standards
Improve the hatchery standard production to support the good quality brood
stock.
4. Improve branding and image in key market
Improve the promoting activities world and also expanding and promoting the
product to the new market, Improve the image branding and diversified the
product to compete to the global market.
30
References:
Antle. M.J et all. 1998. Agriculture, Trade and The Environment. Edward Elgar
Publishing Limited. UK.
Bank Ekspor Indonesia, 2007, Si Bungkuk Tebar Pesona, 2007, Jakarta.
Branson, W.H and J.M Litvack. Macroeconomics. Herper International Edition.
New York.
Ditjen Budidaya, 2003. Profil Perikanan Budidaya, Direktorat Jenderal
Perikanan Budidaya
FAO - United Nation, Fishery Statistic 2008, Roma
Foreign Investment Advisory Service, 2006. Case Study of Textile and Farmed
Shrimp Industries, World Bank.
Helga Josupeit, GLOBEFISH, 2004, World Shrimp Markets 2004, Madrid,
Spain
Kindleberger, C.P and P.H Lindert. 1983. International Economics. Richard D.
Irwin, Incoporated. Illinois. USA.
Milner Chris. and Read Robert. 2002. Trade Liberalization, Competition and
the WTO. Edward Elgar Publishing Limited. UK.
Ministry of Marine Affairs and Fisheries. 2003. Program Teknologi
Peningkatan Produksi Perikanan (PROTEKAN) 2003. Jakarta.
Statistic Ministry of Marine Affairs and Fisheries, 2006 Jakarta
Thailand Department of Fisheries (1998), Shrimp Farming Experiences in

31
Thailand, Bangkok
Wang Qingyin, 2005, Performance and Impacts on shrimp Production and
Biodiversity Yellow Sea Fisheries Research Institute, Beijing.