Embed Size (px)
Citation preview
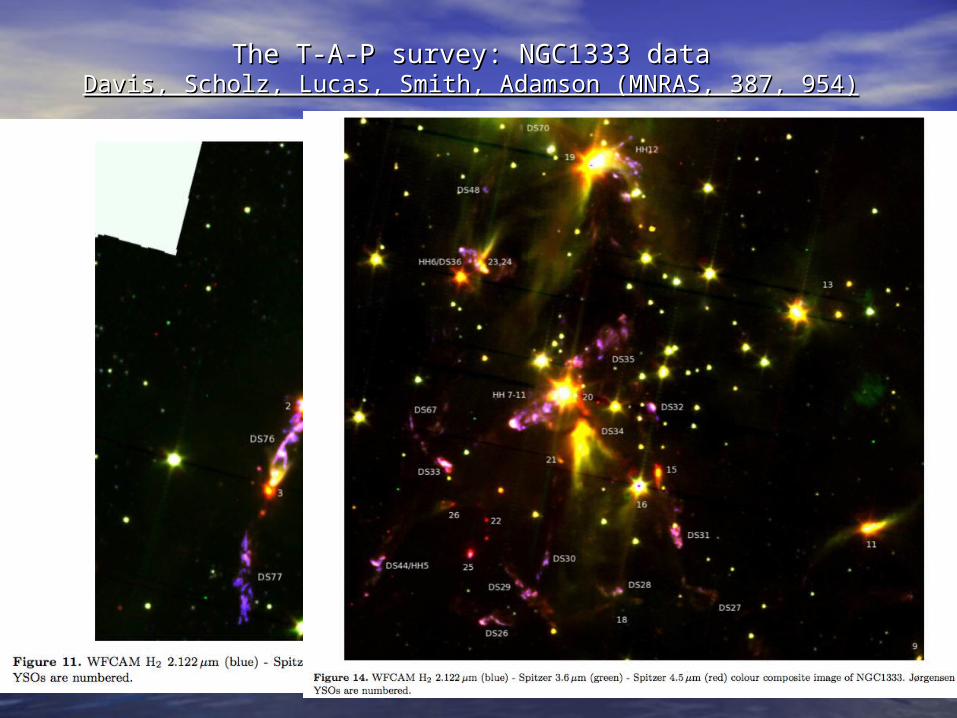
The T-A-P survey: NGC1333 dataThe T-A-P survey: NGC1333 dataDavis, Scholz, Lucas, Smith, Adamson (MNRAS, 387, 954)Davis, Scholz, Lucas, Smith, Adamson (MNRAS, 387, 954)
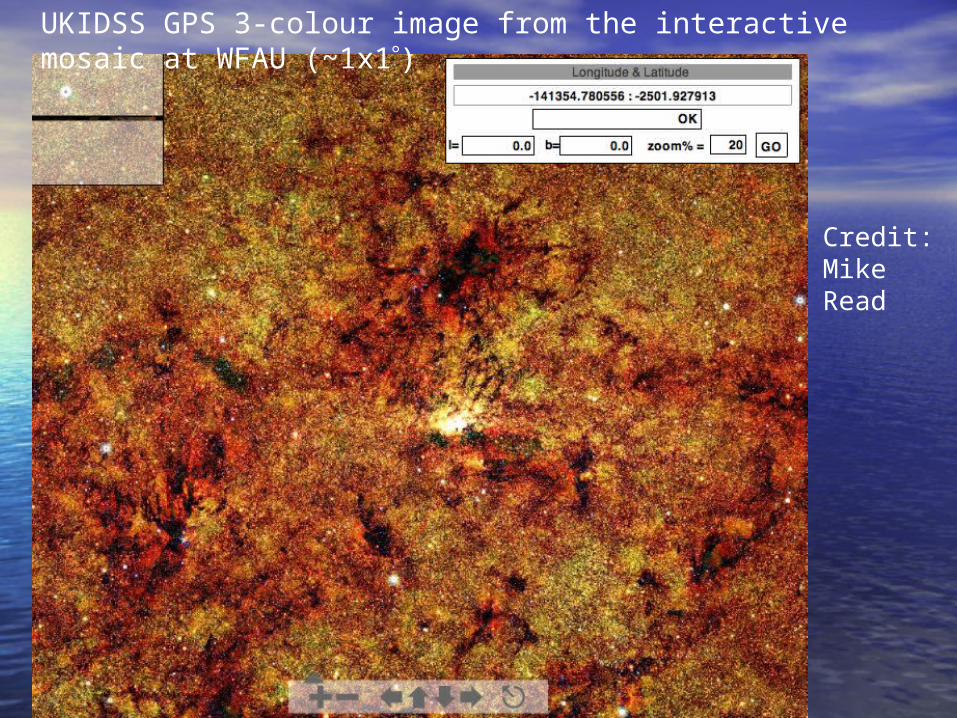
Credit: Mike Read
2MASS JHK
UKIDSS GPS 3-colour image from the interactive mosaic at WFAU (~1x1)
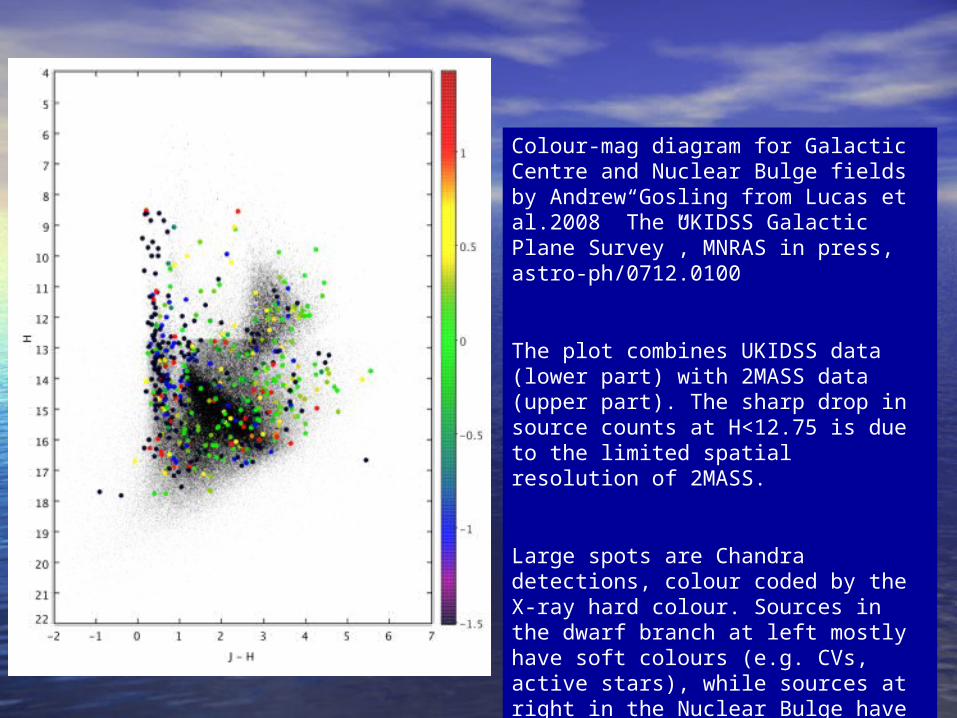
Colour-mag diagram for Galactic Centre and Nuclear Bulge fields by Andrew Gosling from Lucas et al.2008 ”The UKIDSS Galactic Plane Survey”, MNRAS in press, astro-ph/0712.0100
The plot combines UKIDSS data (lower part) with 2MASS data (upper part). The sharp drop in source counts at H<12.75 is due to the limited spatial resolution of 2MASS.
Large spots are Chandra detections, colour coded by the X-ray hard colour. Sources in the dwarf branch at left mostly have soft colours (e.g. CVs, active stars), while sources at right in the Nuclear Bulge have hard colours (e.g. X-ray binaries).


![MNRAS ATEX style file v3.0 Moonfalls: Collisions between ...arXiv:1805.00019v1 [astro-ph.EP] 30 Apr 2018 MNRAS 000, 1–12 (2018) Preprint 2 May 2018 Compiled using MNRAS LATEX style](https://img.pdfslide.net/doc/110x75/5ed3b7b8c1bc7732fe50c6b1/mnras-atex-style-ile-v30-moonfalls-collisions-between-arxiv180500019v1.jpg)