Embed Size (px)
Citation preview

1
AGMA Webinar: How To Read and Interpret A Gear Inspection Report: Slide 1
How To Read and InterpretA Gear Inspection Report
AGMA WebinarCopyrighted 2016
William M. McVea, Ph.D., P.E.President and Principal Engineer
KBE+, Inc.
AGMA Webinar: How To Read and Interpret A Gear Inspection Report: Slide 2
The Three Parts of Gears
• The Form
• The Tooth
• The Teeth
AGMA Webinar: How To Read and Interpret A Gear Inspection Report: Slide 3
The Three Parts of Gears
• The Form

2
AGMA Webinar: How To Read and Interpret A Gear Inspection Report: Slide 4
The Three Parts of Gears
• The Form
• The Tooth
AGMA Webinar: How To Read and Interpret A Gear Inspection Report: Slide 5
The Three Parts of Gears
• The Form
• The Tooth
• The Teeth
AGMA Webinar: How To Read and Interpret A Gear Inspection Report: Slide 6
Definition of an Involute
3
AGMA Webinar: How To Read and Interpret A Gear Inspection Report: Slide 7
Base Circle
AGMA Webinar: How To Read and Interpret A Gear Inspection Report: Slide 8
Involute Helicoid
• Paper Cut as Parallelogram Shape
AGMA Webinar: How To Read and Interpret A Gear Inspection Report: Slide 9
Involute Helicoid
2pr
H
Cylinder
Axis
4
AGMA Webinar: How To Read and Interpret A Gear Inspection Report: Slide 10
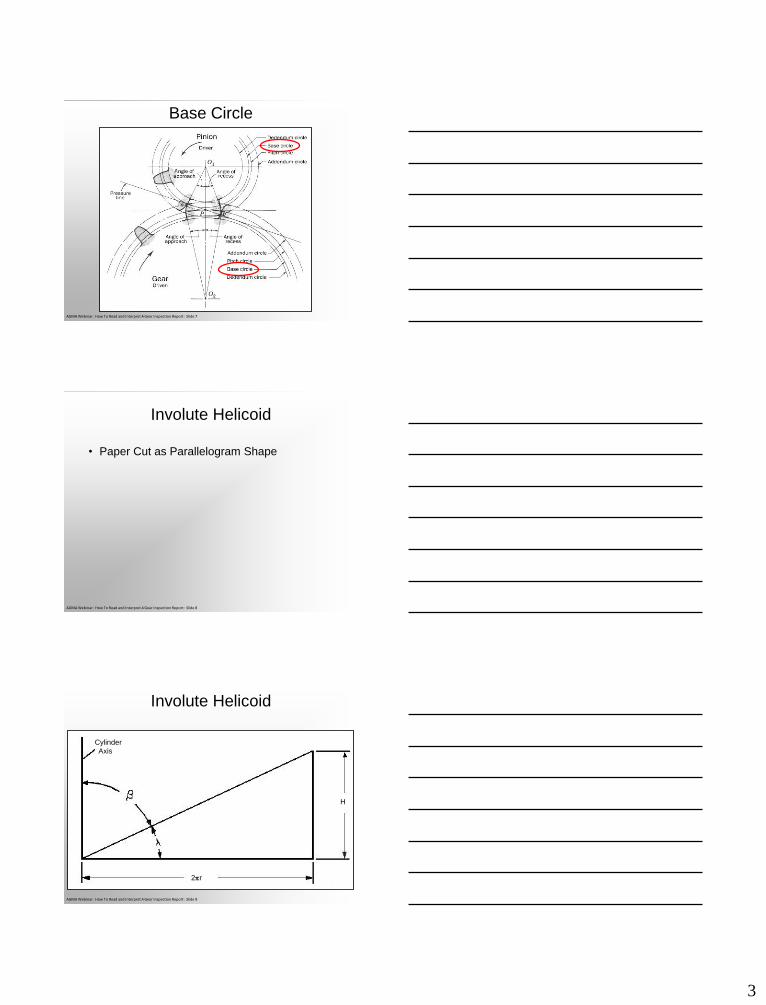
Involute Helicoid
• Paper Cut as Parallelogram Shape
• Wrapped Around Base Cylinder
AGMA Webinar: How To Read and Interpret A Gear Inspection Report: Slide 11
Involute
Helicoid
H
r
l
Helix
Helix
Tangent
AGMA Webinar: How To Read and Interpret A Gear Inspection Report: Slide 12
Involute Helicoid
• Paper Cut as Parallelogram Shape
• Wrapped Around Base Cylinder
• Unwrapped as to Generate Involute
• Paper Edge Defines Involute Helicoid
5
AGMA Webinar: How To Read and Interpret A Gear Inspection Report: Slide 13
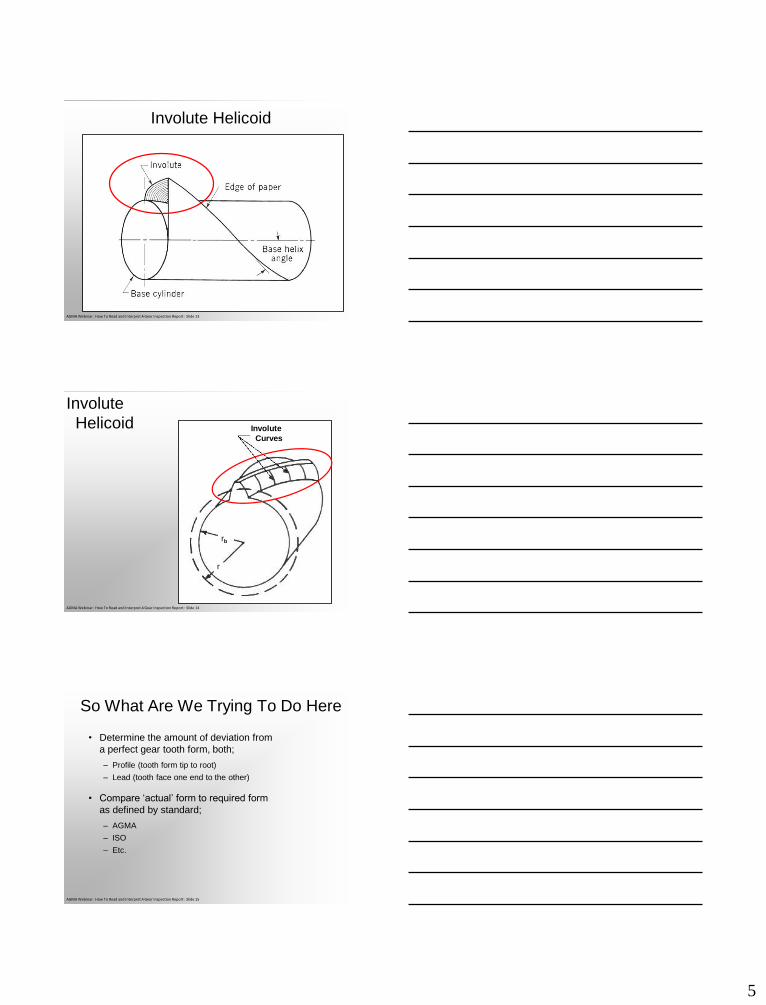
Involute Helicoid
AGMA Webinar: How To Read and Interpret A Gear Inspection Report: Slide 14
Involute
Helicoid Involute
Curves
rb
r
AGMA Webinar: How To Read and Interpret A Gear Inspection Report: Slide 15
So What Are We Trying To Do Here
• Determine the amount of deviation from
a perfect gear tooth form, both;
– Profile (tooth form tip to root)
– Lead (tooth face one end to the other)
• Compare ‘actual’ form to required form
as defined by standard;
– AGMA
– ISO
– Etc.
6
AGMA Webinar: How To Read and Interpret A Gear Inspection Report: Slide 16
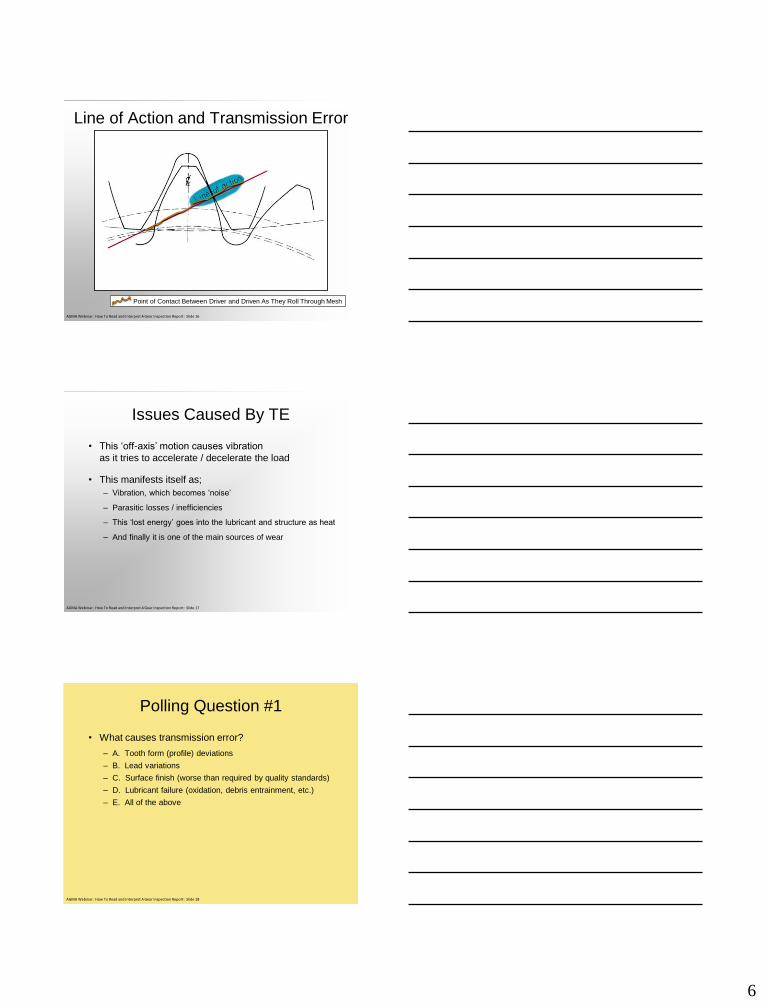
Line of Action and Transmission Error
Point of Contact Between Driver and Driven As They Roll Through Mesh
AGMA Webinar: How To Read and Interpret A Gear Inspection Report: Slide 17
Issues Caused By TE
• This ‘off-axis’ motion causes vibration
as it tries to accelerate / decelerate the load
• This manifests itself as;
– Vibration, which becomes ‘noise’
– Parasitic losses / inefficiencies
– This ‘lost energy’ goes into the lubricant and structure as heat
– And finally it is one of the main sources of wear
AGMA Webinar: How To Read and Interpret A Gear Inspection Report: Slide 18
Polling Question #1
• What causes transmission error?
– A. Tooth form (profile) deviations
– B. Lead variations
– C. Surface finish (worse than required by quality standards)
– D. Lubricant failure (oxidation, debris entrainment, etc.)
– E. All of the above
7
AGMA Webinar: How To Read and Interpret A Gear Inspection Report: Slide 19
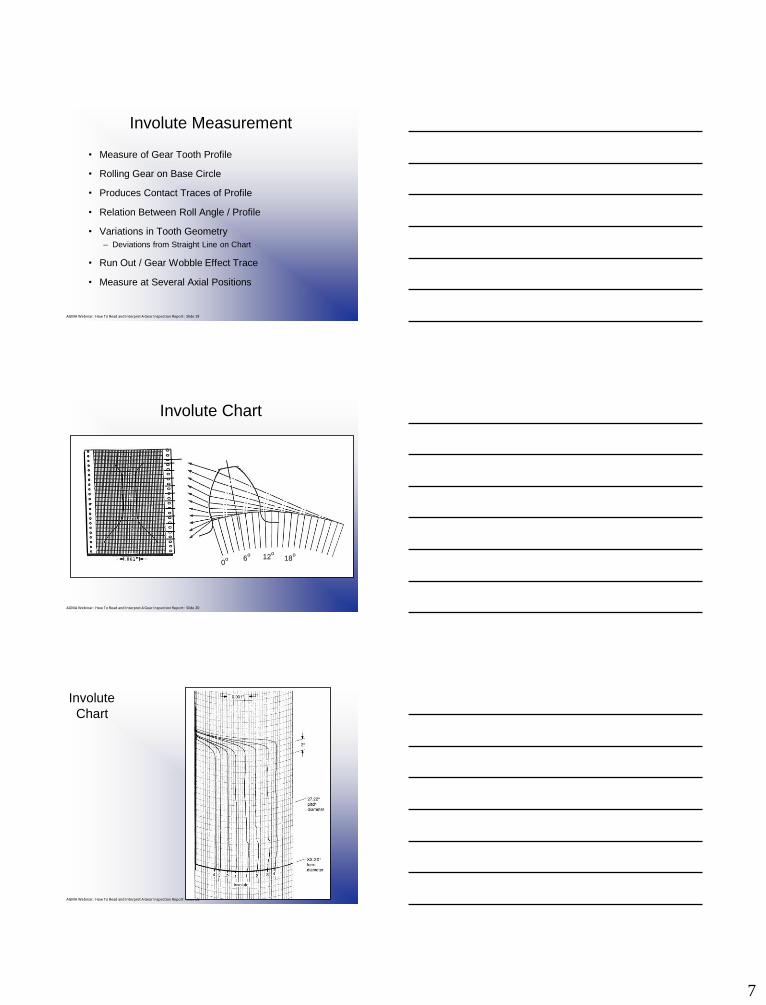
Involute Measurement
• Measure of Gear Tooth Profile
• Rolling Gear on Base Circle
• Produces Contact Traces of Profile
• Relation Between Roll Angle / Profile
• Variations in Tooth Geometry
– Deviations from Straight Line on Chart
• Run Out / Gear Wobble Effect Trace
• Measure at Several Axial Positions
AGMA Webinar: How To Read and Interpret A Gear Inspection Report: Slide 20
Involute Chart
0o 6
o 12o
18o
AGMA Webinar: How To Read and Interpret A Gear Inspection Report: Slide 21
Involute
Chart
8
AGMA Webinar: How To Read and Interpret A Gear Inspection Report: Slide 22
Red Liner
• Double Flank Tester
• Master Gear
AGMA Webinar: How To Read and Interpret A Gear Inspection Report: Slide 23
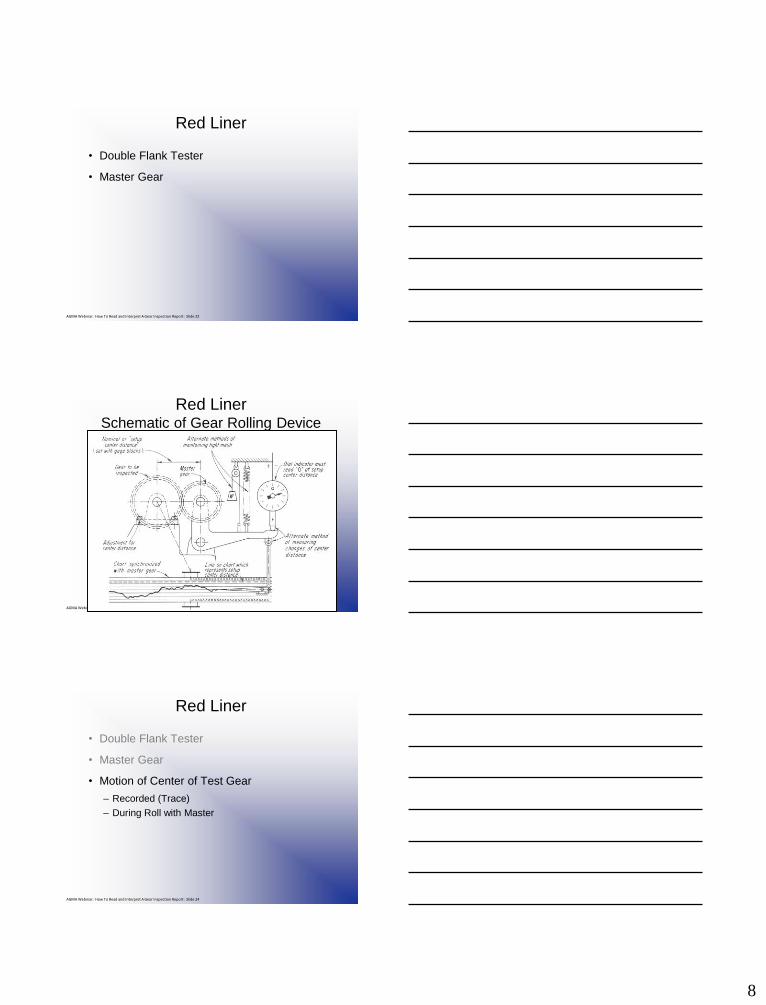
Red LinerSchematic of Gear Rolling Device
AGMA Webinar: How To Read and Interpret A Gear Inspection Report: Slide 24
Red Liner
• Double Flank Tester
• Master Gear
• Motion of Center of Test Gear
– Recorded (Trace)
– During Roll with Master
9
AGMA Webinar: How To Read and Interpret A Gear Inspection Report: Slide 25
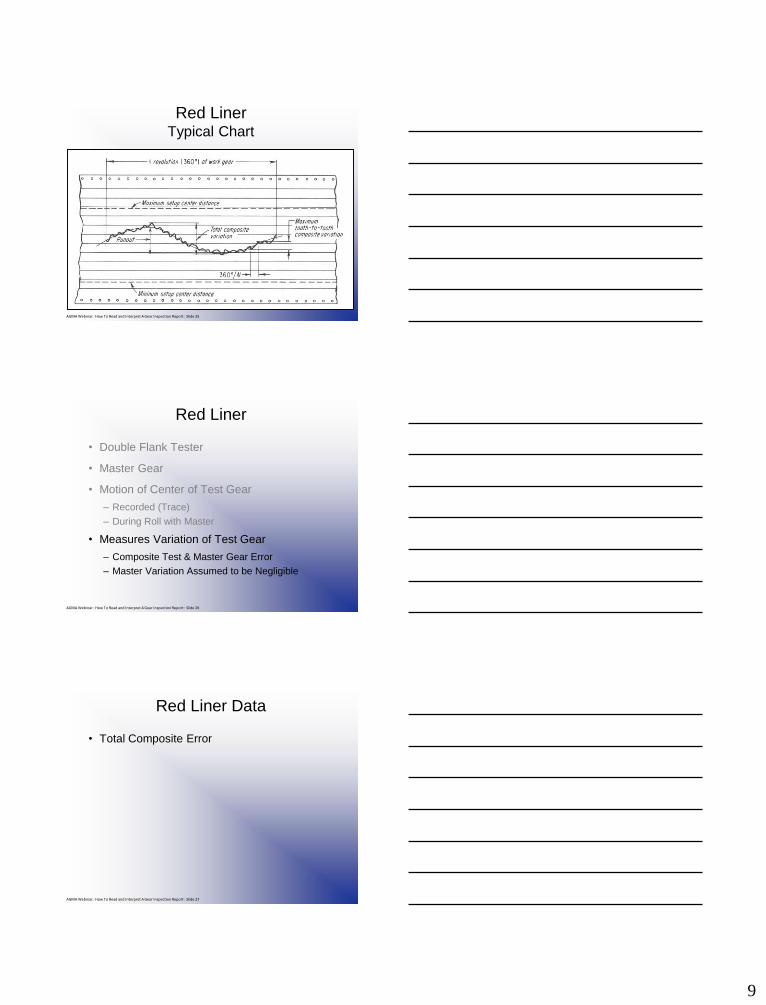
Red LinerTypical Chart
AGMA Webinar: How To Read and Interpret A Gear Inspection Report: Slide 26
Red Liner
• Double Flank Tester
• Master Gear
• Motion of Center of Test Gear
– Recorded (Trace)
– During Roll with Master
• Measures Variation of Test Gear
– Composite Test & Master Gear Error
– Master Variation Assumed to be Negligible
AGMA Webinar: How To Read and Interpret A Gear Inspection Report: Slide 27
Red Liner Data
• Total Composite Error
10
AGMA Webinar: How To Read and Interpret A Gear Inspection Report: Slide 28
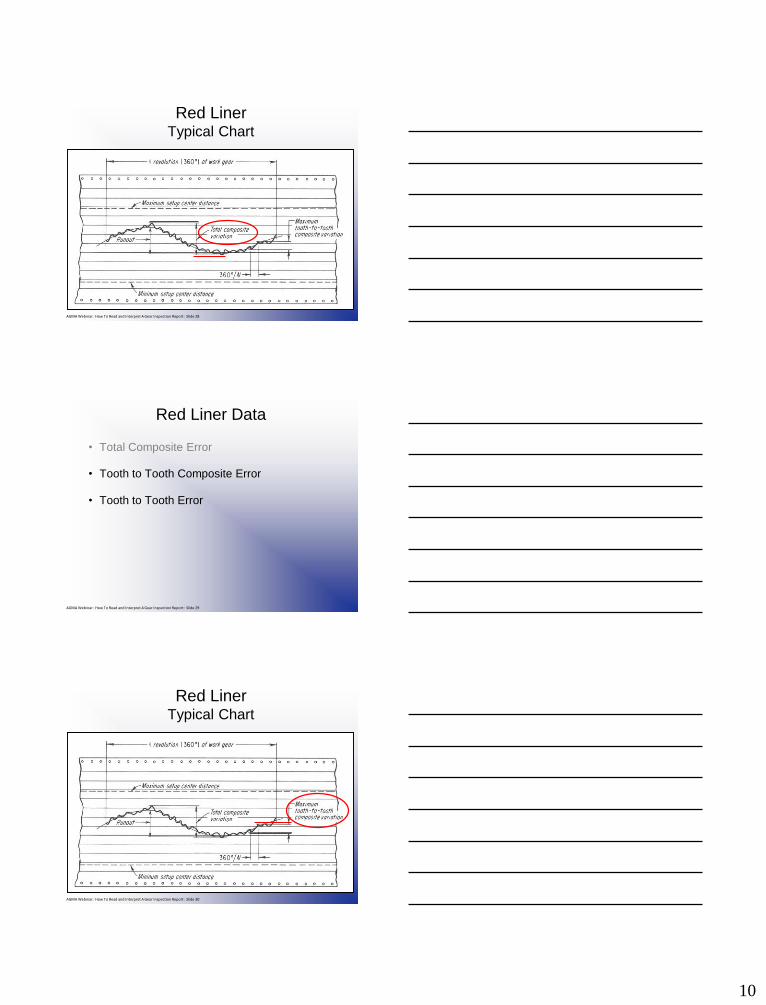
Red LinerTypical Chart
AGMA Webinar: How To Read and Interpret A Gear Inspection Report: Slide 29
Red Liner Data
• Total Composite Error
• Tooth to Tooth Composite Error
• Tooth to Tooth Error
AGMA Webinar: How To Read and Interpret A Gear Inspection Report: Slide 30
Red LinerTypical Chart
11
AGMA Webinar: How To Read and Interpret A Gear Inspection Report: Slide 31
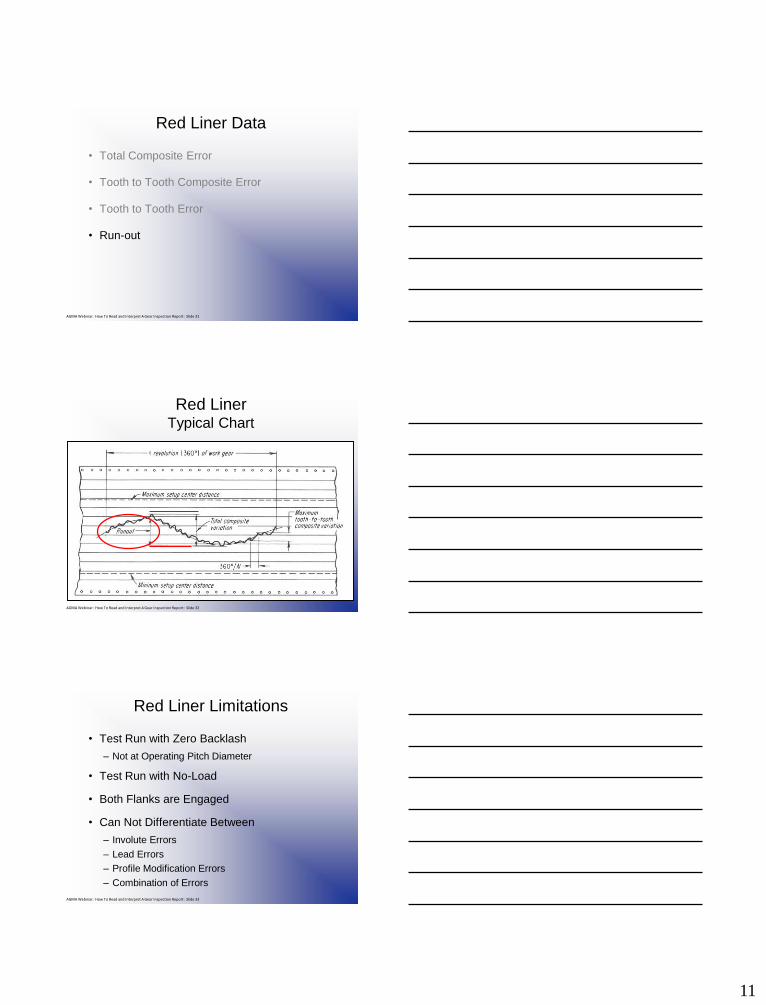
Red Liner Data
• Total Composite Error
• Tooth to Tooth Composite Error
• Tooth to Tooth Error
• Run-out
AGMA Webinar: How To Read and Interpret A Gear Inspection Report: Slide 32
Red LinerTypical Chart
AGMA Webinar: How To Read and Interpret A Gear Inspection Report: Slide 33
Red Liner Limitations
• Test Run with Zero Backlash
– Not at Operating Pitch Diameter
• Test Run with No-Load
• Both Flanks are Engaged
• Can Not Differentiate Between
– Involute Errors
– Lead Errors
– Profile Modification Errors
– Combination of Errors
12
AGMA Webinar: How To Read and Interpret A Gear Inspection Report: Slide 34
Single Flank Gear Tester
• Measures Similar Parameters
– With Backlash
– On Operating Pitch Diameters
AGMA Webinar: How To Read and Interpret A Gear Inspection Report: Slide 35
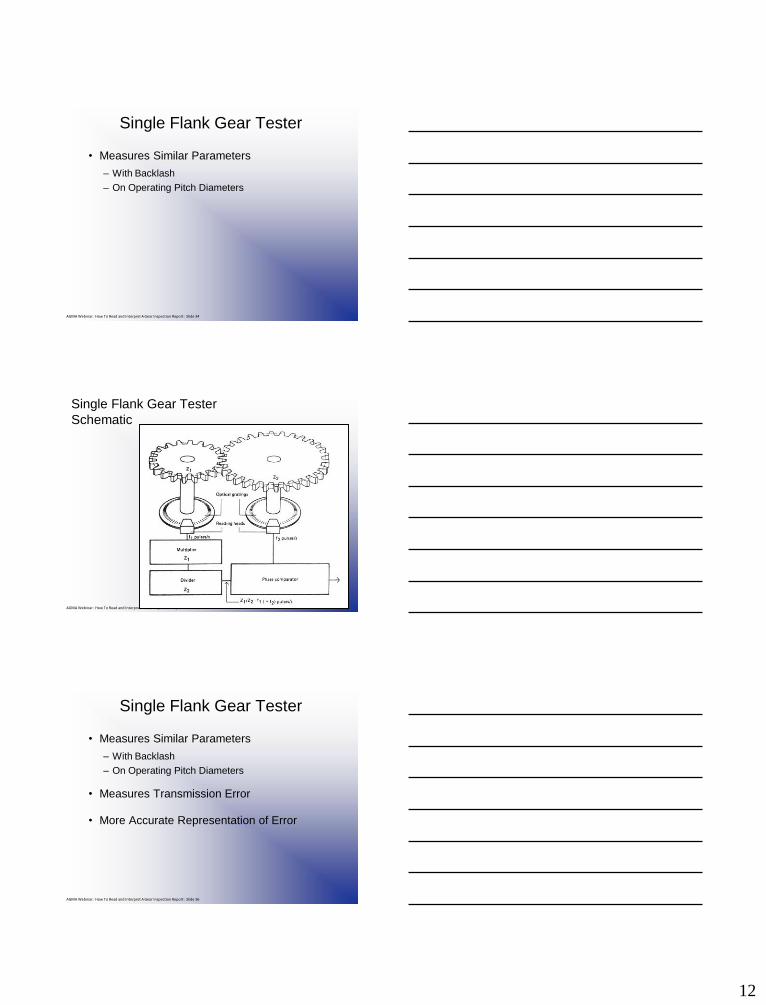
Single Flank Gear Tester
Schematic
AGMA Webinar: How To Read and Interpret A Gear Inspection Report: Slide 36
Single Flank Gear Tester
• Measures Similar Parameters
– With Backlash
– On Operating Pitch Diameters
• Measures Transmission Error
• More Accurate Representation of Error
13
AGMA Webinar: How To Read and Interpret A Gear Inspection Report: Slide 37
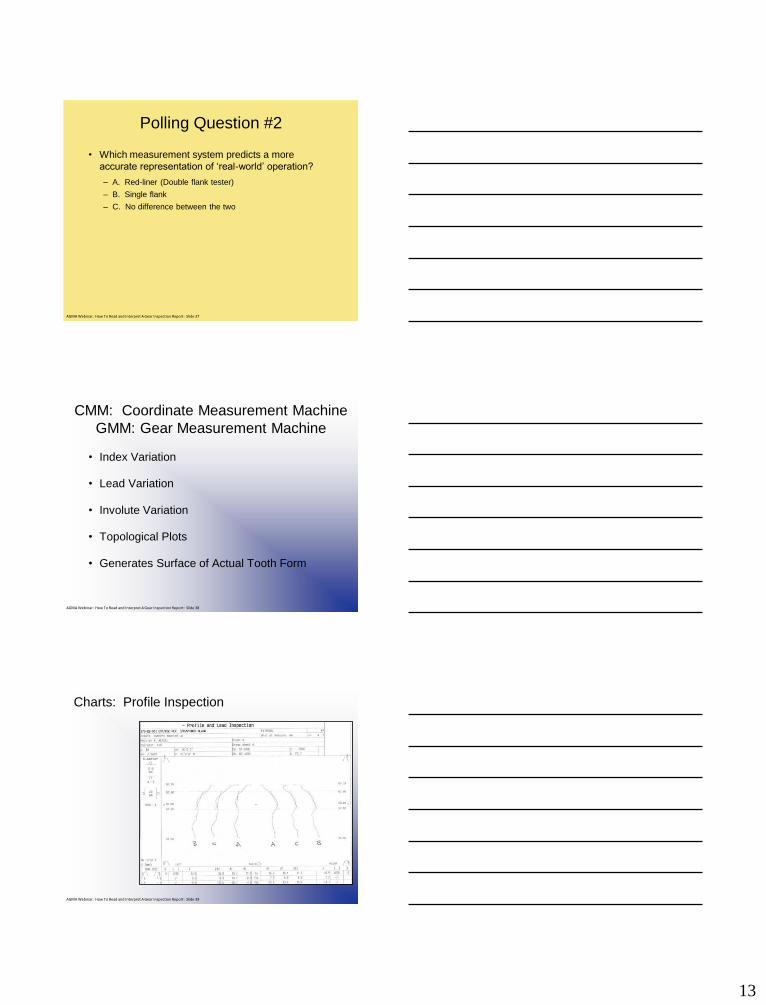
Polling Question #2
• Which measurement system predicts a more
accurate representation of ‘real-world’ operation?
– A. Red-liner (Double flank tester)
– B. Single flank
– C. No difference between the two
AGMA Webinar: How To Read and Interpret A Gear Inspection Report: Slide 38
CMM: Coordinate Measurement Machine
GMM: Gear Measurement Machine
• Index Variation
• Lead Variation
• Involute Variation
• Topological Plots
• Generates Surface of Actual Tooth Form
AGMA Webinar: How To Read and Interpret A Gear Inspection Report: Slide 39
Charts: Profile Inspection
14
AGMA Webinar: How To Read and Interpret A Gear Inspection Report: Slide 40
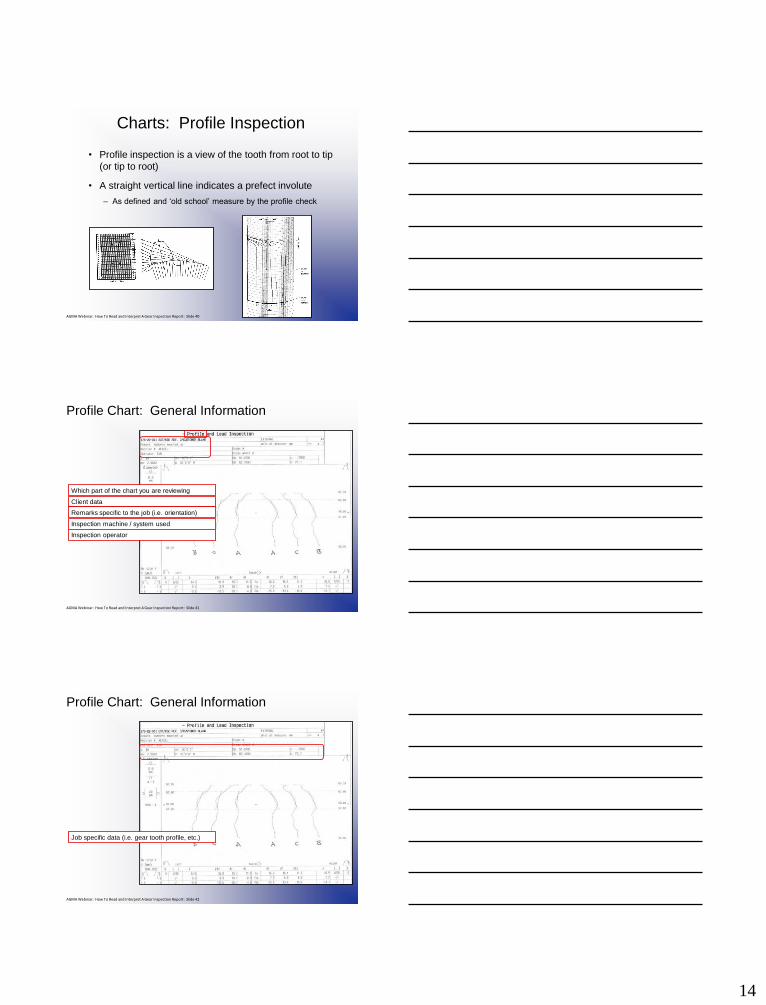
Charts: Profile Inspection
• Profile inspection is a view of the tooth from root to tip
(or tip to root)
• A straight vertical line indicates a prefect involute
– As defined and ‘old school’ measure by the profile check
AGMA Webinar: How To Read and Interpret A Gear Inspection Report: Slide 41
Profile Chart: General Information
Which part of the chart you are reviewing
Client data
Remarks specific to the job (i.e. orientation)
Inspection machine / system used
Inspection operator
AGMA Webinar: How To Read and Interpret A Gear Inspection Report: Slide 42
Profile Chart: General Information
Job specific data (i.e. gear tooth profile, etc.)
15
AGMA Webinar: How To Read and Interpret A Gear Inspection Report: Slide 43
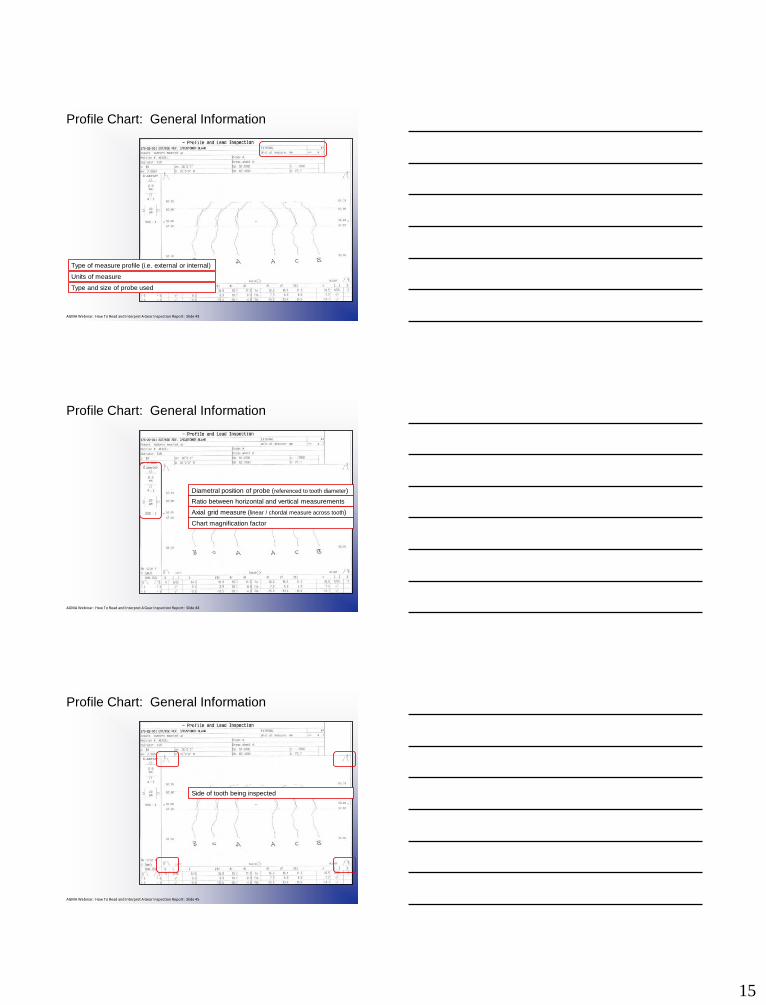
Profile Chart: General Information
Type of measure profile (i.e. external or internal)
Units of measure
Type and size of probe used
AGMA Webinar: How To Read and Interpret A Gear Inspection Report: Slide 44
Profile Chart: General Information
Diametral position of probe (referenced to tooth diameter)
Ratio between horizontal and vertical measurements
Axial grid measure (linear / chordal measure across tooth)
Chart magnification factor
AGMA Webinar: How To Read and Interpret A Gear Inspection Report: Slide 45
Profile Chart: General Information
Side of tooth being inspected
16
AGMA Webinar: How To Read and Interpret A Gear Inspection Report: Slide 46
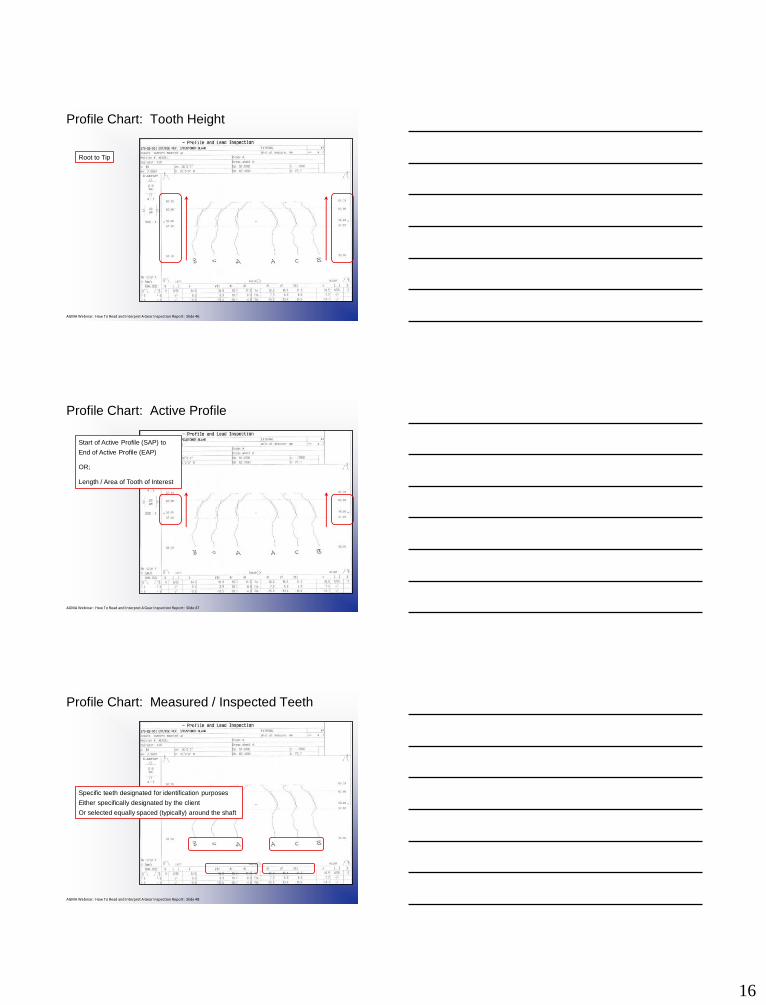
Profile Chart: Tooth Height
Root to Tip
AGMA Webinar: How To Read and Interpret A Gear Inspection Report: Slide 47
Profile Chart: Active Profile
Start of Active Profile (SAP) to
End of Active Profile (EAP)
OR;
Length / Area of Tooth of Interest
AGMA Webinar: How To Read and Interpret A Gear Inspection Report: Slide 48
Profile Chart: Measured / Inspected Teeth
Specific teeth designated for identification purposes
Either specifically designated by the client
Or selected equally spaced (typically) around the shaft
17
AGMA Webinar: How To Read and Interpret A Gear Inspection Report: Slide 49
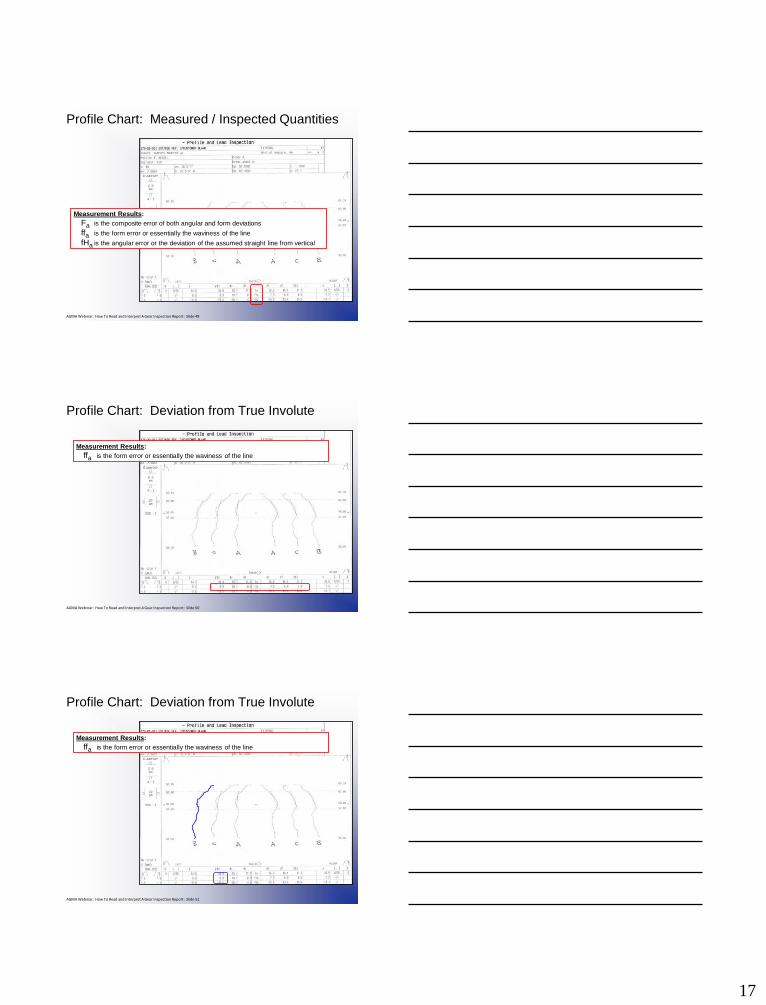
Profile Chart: Measured / Inspected Quantities
Measurement Results:
Fa is the composite error of both angular and form deviations
ffa is the form error or essentially the waviness of the line
fHa is the angular error or the deviation of the assumed straight line from vertical
AGMA Webinar: How To Read and Interpret A Gear Inspection Report: Slide 50
Profile Chart: Deviation from True Involute
Measurement Results:
ffa is the form error or essentially the waviness of the line
AGMA Webinar: How To Read and Interpret A Gear Inspection Report: Slide 51
Profile Chart: Deviation from True Involute
Measurement Results:
ffa is the form error or essentially the waviness of the line
18
AGMA Webinar: How To Read and Interpret A Gear Inspection Report: Slide 52
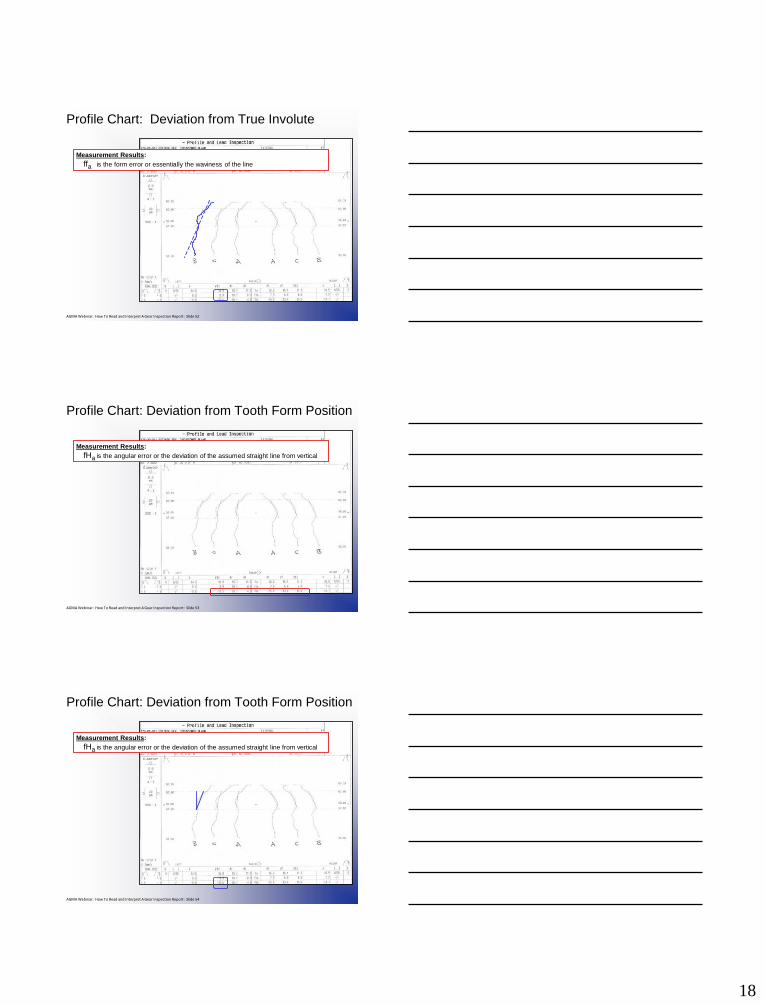
Profile Chart: Deviation from True Involute
Measurement Results:
ffa is the form error or essentially the waviness of the line
AGMA Webinar: How To Read and Interpret A Gear Inspection Report: Slide 53
Profile Chart: Deviation from Tooth Form Position
Measurement Results:
fHa is the angular error or the deviation of the assumed straight line from vertical
AGMA Webinar: How To Read and Interpret A Gear Inspection Report: Slide 54
Profile Chart: Deviation from Tooth Form Position
Measurement Results:
fHa is the angular error or the deviation of the assumed straight line from vertical
19
AGMA Webinar: How To Read and Interpret A Gear Inspection Report: Slide 55
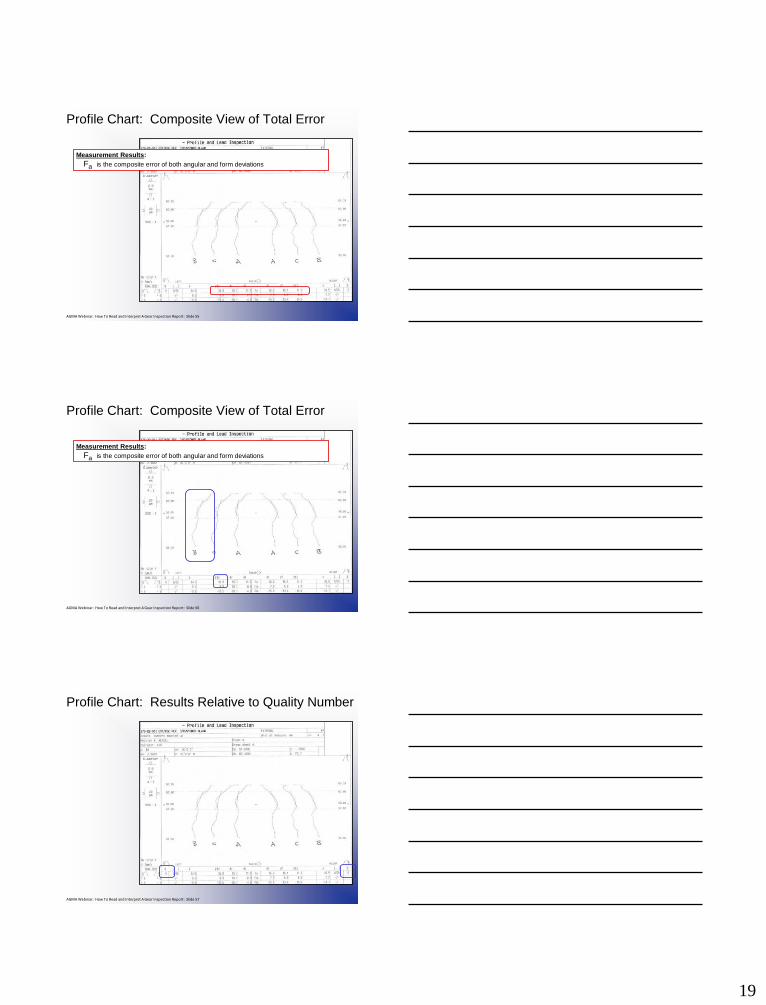
Profile Chart: Composite View of Total Error
Measurement Results:
Fa is the composite error of both angular and form deviations
AGMA Webinar: How To Read and Interpret A Gear Inspection Report: Slide 56
Profile Chart: Composite View of Total Error
Measurement Results:
Fa is the composite error of both angular and form deviations
AGMA Webinar: How To Read and Interpret A Gear Inspection Report: Slide 57
Profile Chart: Results Relative to Quality Number
20
AGMA Webinar: How To Read and Interpret A Gear Inspection Report: Slide 58
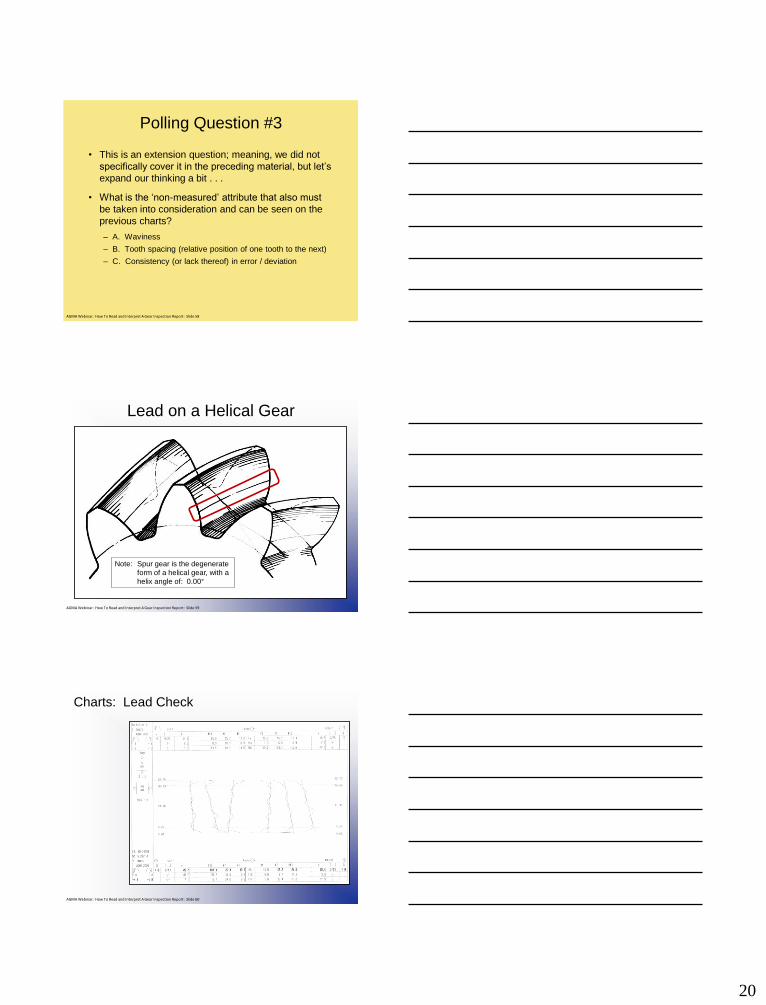
Polling Question #3
• This is an extension question; meaning, we did not
specifically cover it in the preceding material, but let’s
expand our thinking a bit . . .
• What is the ‘non-measured’ attribute that also must
be taken into consideration and can be seen on the
previous charts?
– A. Waviness
– B. Tooth spacing (relative position of one tooth to the next)
– C. Consistency (or lack thereof) in error / deviation
AGMA Webinar: How To Read and Interpret A Gear Inspection Report: Slide 59
Lead on a Helical Gear
Note: Spur gear is the degenerate
form of a helical gear, with a
helix angle of: 0.00°
AGMA Webinar: How To Read and Interpret A Gear Inspection Report: Slide 60
Charts: Lead Check
21
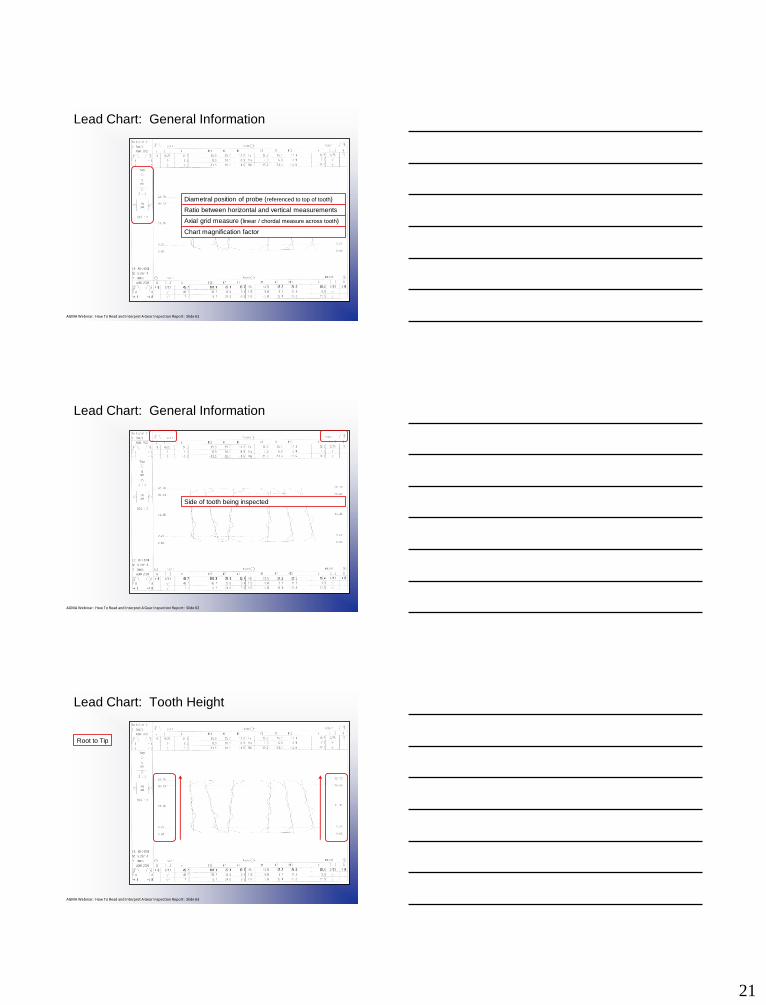
AGMA Webinar: How To Read and Interpret A Gear Inspection Report: Slide 61
Lead Chart: General Information
Diametral position of probe (referenced to top of tooth)
Ratio between horizontal and vertical measurements
Axial grid measure (linear / chordal measure across tooth)
Chart magnification factor
AGMA Webinar: How To Read and Interpret A Gear Inspection Report: Slide 62
Lead Chart: General Information
Side of tooth being inspected
AGMA Webinar: How To Read and Interpret A Gear Inspection Report: Slide 63
Lead Chart: Tooth Height
Root to Tip
22
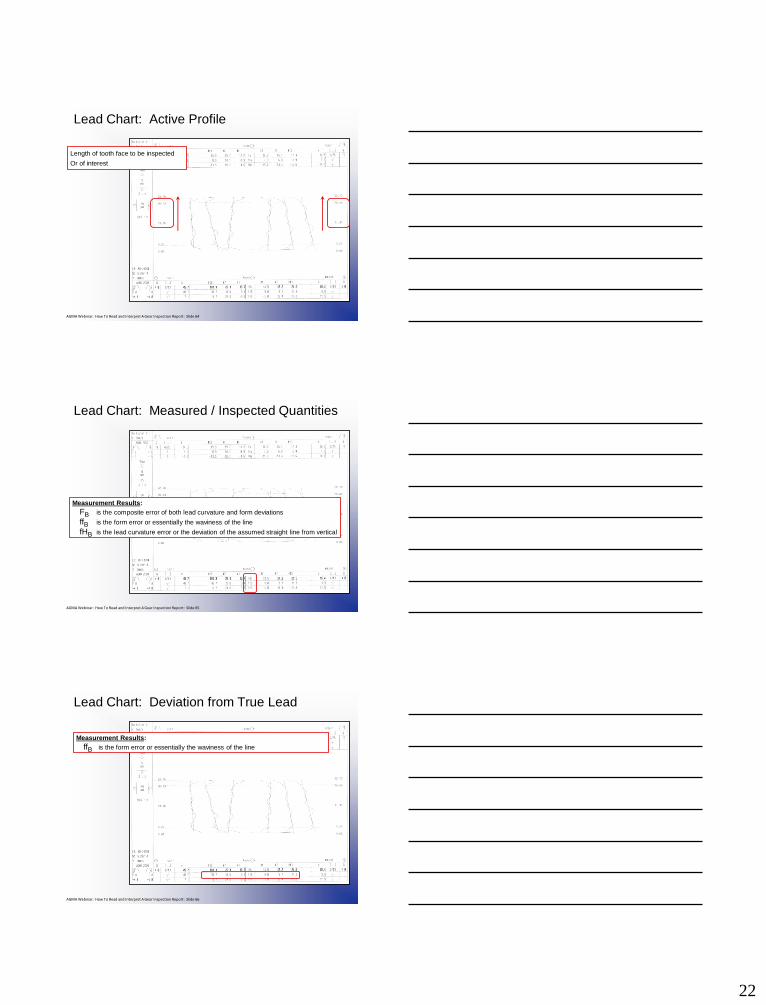
AGMA Webinar: How To Read and Interpret A Gear Inspection Report: Slide 64
Lead Chart: Active Profile
Length of tooth face to be inspected
Or of interest
AGMA Webinar: How To Read and Interpret A Gear Inspection Report: Slide 65
Lead Chart: Measured / Inspected Quantities
Measurement Results:
FB is the composite error of both lead curvature and form deviations
ffB is the form error or essentially the waviness of the line
fHB is the lead curvature error or the deviation of the assumed straight line from vertical
AGMA Webinar: How To Read and Interpret A Gear Inspection Report: Slide 66
Lead Chart: Deviation from True Lead
Measurement Results:
ffB is the form error or essentially the waviness of the line
23
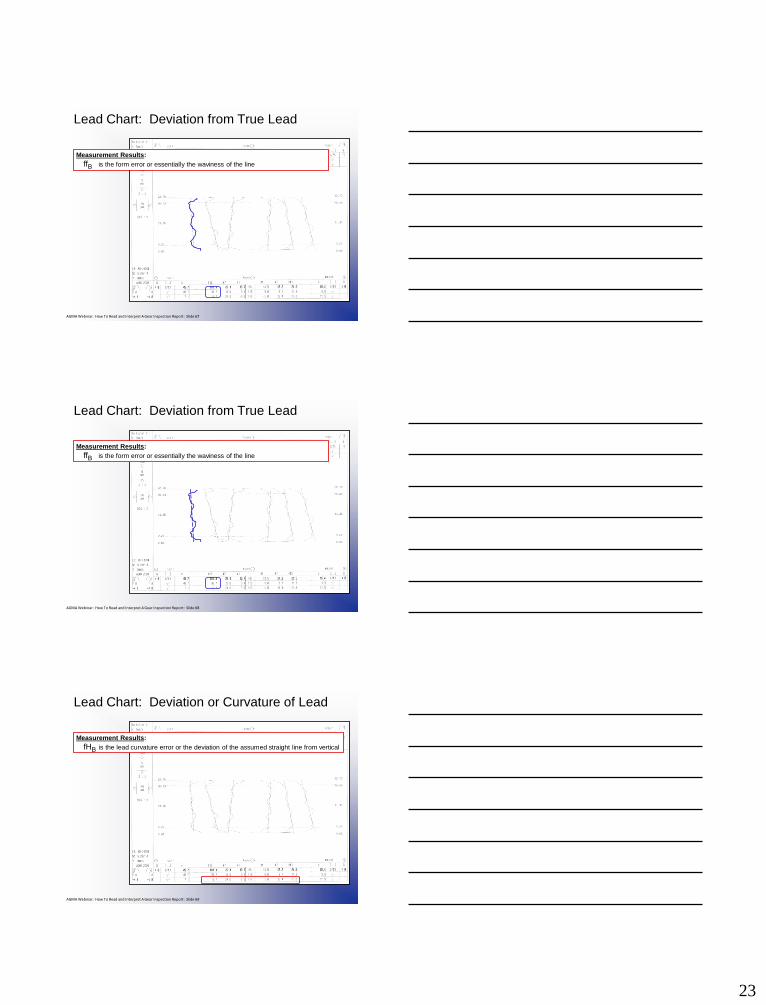
AGMA Webinar: How To Read and Interpret A Gear Inspection Report: Slide 67
Lead Chart: Deviation from True Lead
Measurement Results:
ffB is the form error or essentially the waviness of the line
AGMA Webinar: How To Read and Interpret A Gear Inspection Report: Slide 68
Lead Chart: Deviation from True Lead
Measurement Results:
ffB is the form error or essentially the waviness of the line
AGMA Webinar: How To Read and Interpret A Gear Inspection Report: Slide 69
Lead Chart: Deviation or Curvature of Lead
Measurement Results:
fHB is the lead curvature error or the deviation of the assumed straight line from vertical
24
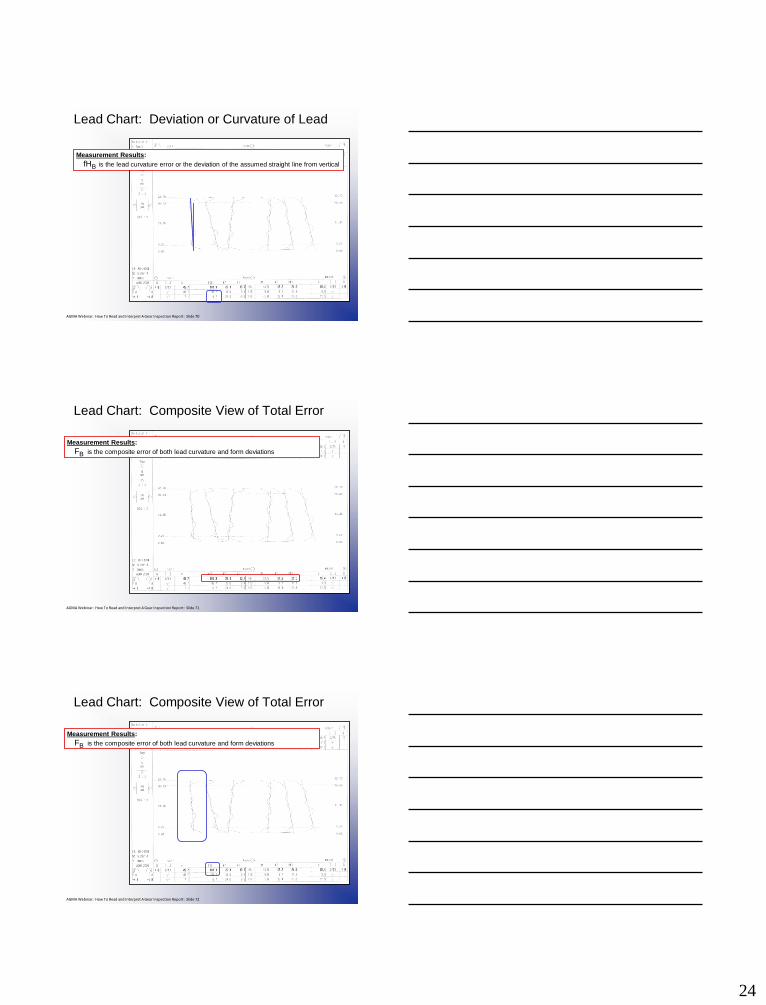
AGMA Webinar: How To Read and Interpret A Gear Inspection Report: Slide 70
Lead Chart: Deviation or Curvature of Lead
Measurement Results:
fHB is the lead curvature error or the deviation of the assumed straight line from vertical
AGMA Webinar: How To Read and Interpret A Gear Inspection Report: Slide 71
Lead Chart: Composite View of Total Error
Measurement Results:
FB is the composite error of both lead curvature and form deviations
AGMA Webinar: How To Read and Interpret A Gear Inspection Report: Slide 72
Lead Chart: Composite View of Total Error
Measurement Results:
FB is the composite error of both lead curvature and form deviations
25
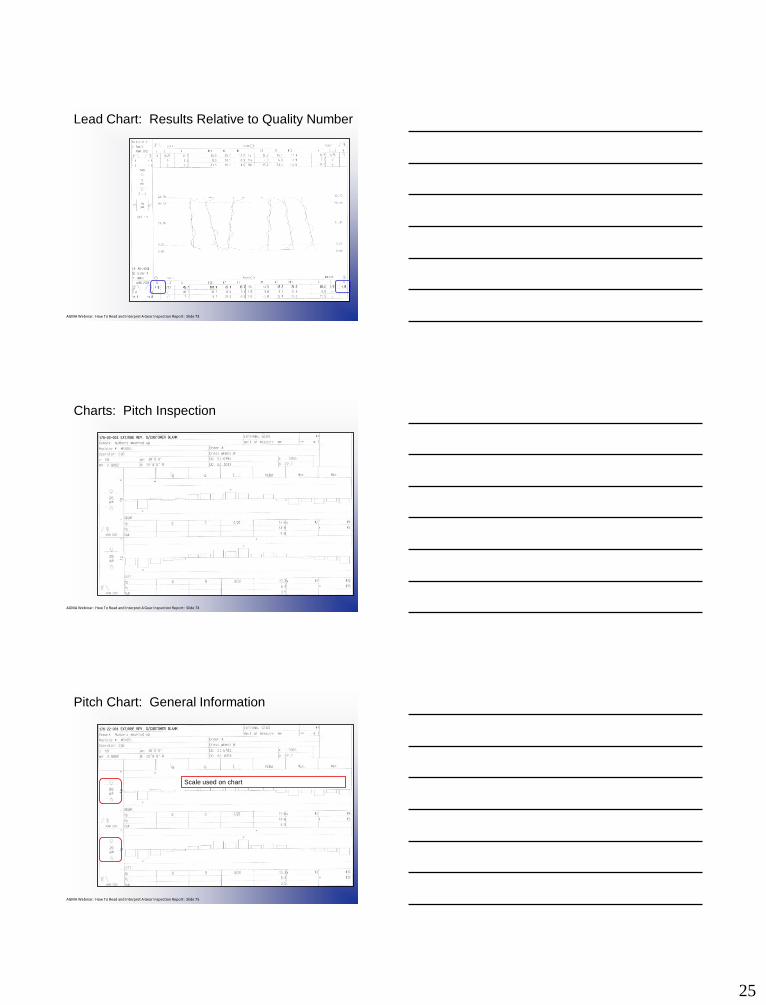
AGMA Webinar: How To Read and Interpret A Gear Inspection Report: Slide 73
Lead Chart: Results Relative to Quality Number
AGMA Webinar: How To Read and Interpret A Gear Inspection Report: Slide 74
Charts: Pitch Inspection
AGMA Webinar: How To Read and Interpret A Gear Inspection Report: Slide 75
Pitch Chart: General Information
Scale used on chart
26
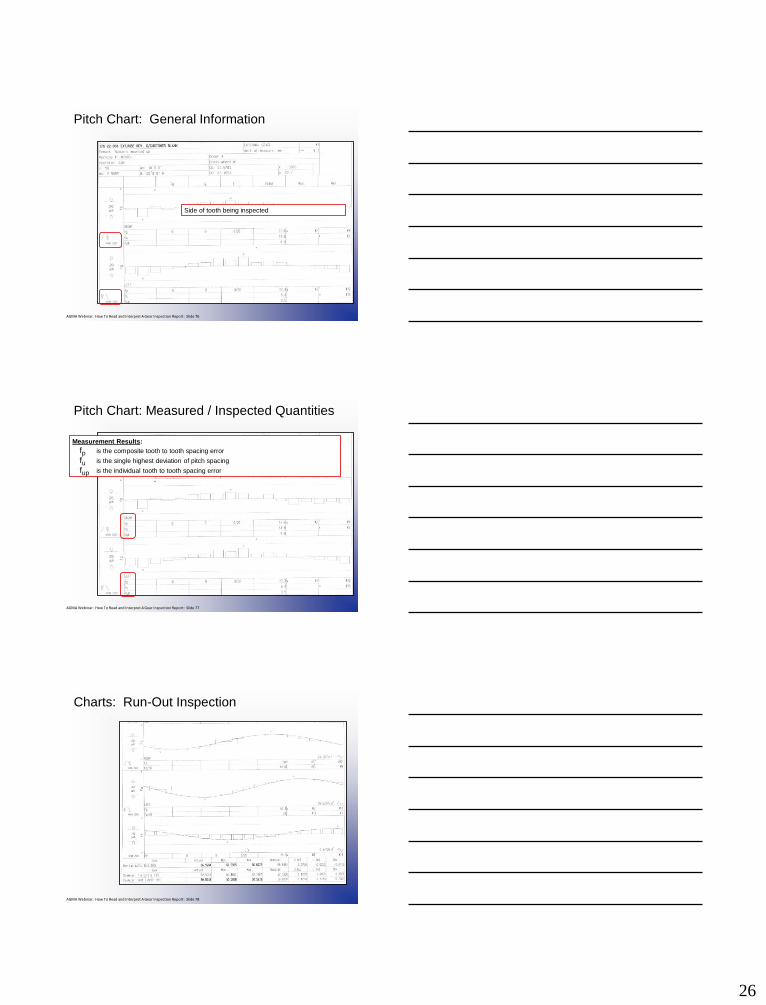
AGMA Webinar: How To Read and Interpret A Gear Inspection Report: Slide 76
Pitch Chart: General Information
Side of tooth being inspected
AGMA Webinar: How To Read and Interpret A Gear Inspection Report: Slide 77
Pitch Chart: Measured / Inspected Quantities
Measurement Results:
fp is the composite tooth to tooth spacing error
fu is the single highest deviation of pitch spacing
fup is the individual tooth to tooth spacing error
AGMA Webinar: How To Read and Interpret A Gear Inspection Report: Slide 78
Charts: Run-Out Inspection
27
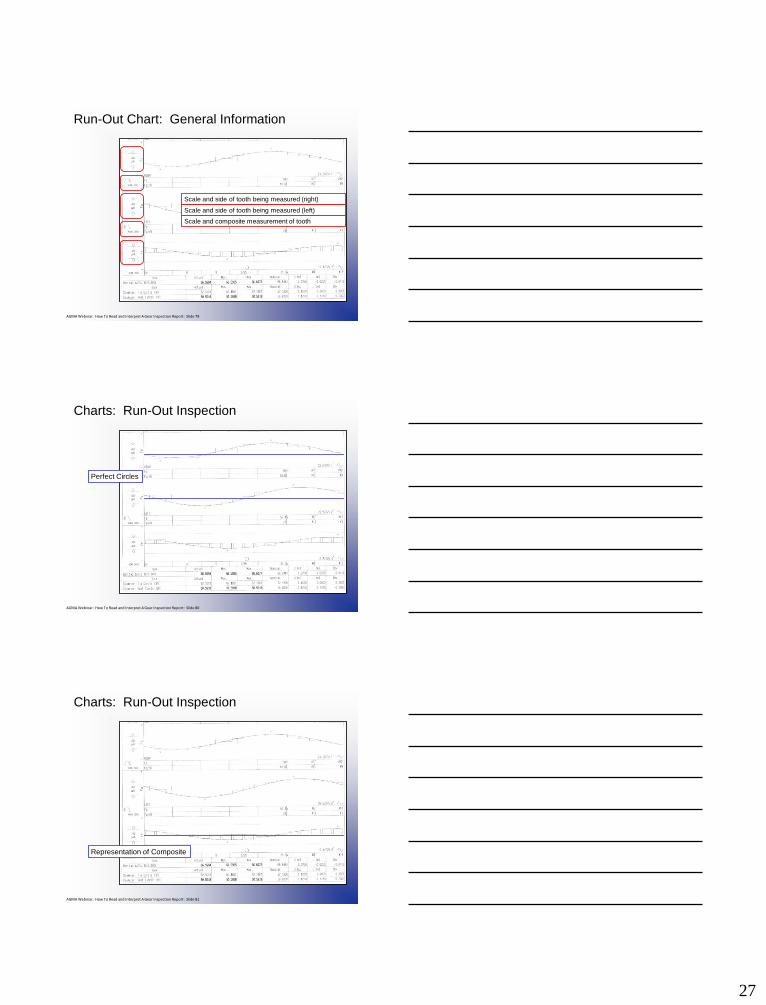
AGMA Webinar: How To Read and Interpret A Gear Inspection Report: Slide 79
Run-Out Chart: General Information
Scale and side of tooth being measured (right)
Scale and side of tooth being measured (left)
Scale and composite measurement of tooth
AGMA Webinar: How To Read and Interpret A Gear Inspection Report: Slide 80
Charts: Run-Out Inspection
Perfect Circles
AGMA Webinar: How To Read and Interpret A Gear Inspection Report: Slide 81
Charts: Run-Out Inspection
Representation of Composite

28
AGMA Webinar: How To Read and Interpret A Gear Inspection Report: Slide 82
Reference List
1. “Gear Handbook” by Darle W. Dudley. First Edition, McGraw-Hill, Inc. 1962.
2. “Dudley’s Gear Handbook, Second Edition” by Dennis P. Townsend. McGraw-Hill, Inc. 1992. (ISBN: 0-07-017903-4)
3. “Spur Gears” by Earle Buckingham. First Edition, McGraw-Hill, Inc. 1928.
4. “Handbook of Practical Gear Design” by Darle W. Dudley. First Edition, Technomic Publication,
Inc. 1994. (ISBN: 1-56676-218-9)
5. “A Treatise of Gear Wheels” by George B. Grant. Twenty-First Edition, Philadelphia GEAR
Works Inc. 1899. Reprinted 1980.
6. “Gear Geometry and Applied Theory” by Faydor Litvin. First Ed, Prentice-Hall, Inc. 1994.(ISBN: 0-13-211095-4)
7. “The Internal Gear”, by The Fellows Corporation. Seventh Ed, Fellows Corporation. 1978.
8. “Encyclopedic Dictionary of Gears and Gearing” by D.W. South and R.H. Ewert. McGraw-Hill,
Inc., New York, New York. 1994. (ISBN: 0-07-059795-0)
9. “MAAG Gear Book” by MAAG Gear Company Ltd. 1990.
10. “Gleason Fachworter” by The Gleason Works. Alfred Wentzky & Co. 1967.
AGMA Webinar: How To Read and Interpret A Gear Inspection Report: Slide 83
Reference List
11. “Mechanical Engineers Reference Handbook” by Edward H. Smith. Twelfth Edition, Society of
Automotive Engineers, Inc. 1994. (ISBN: 1-56091-450-5)
12. “Machinery’s Handbook” by Erik Oberg, Franklin Jones, and Holbrook Horton. Twenty-third
Edition, Industrial Press, Inc. 1914. Revised 1989. (ISBN: 0-8311-1200-X)
13. “Engineering Unit Conversions” by Micheal Lindeburg. Professional Publications, Inc. 1988.
(ISBN: 0-932276-89-X)
14. “Mechanics of Materials” by E. P. Popov. Second Edition, Prentice-Hall, Inc. 1976.
15. “Formulas for Stress and Strain” by Raymond Roark and Warren Young. Fifth Edition,
McGraw-Hill, Inc. 1975. (ISBN: 0-07-053031-9)
16. “Mechanical Engineering Design” by Joseph Shigley. Third Edition, McGraw-Hill, Inc. 1977.(ISBN: 0-07-056881-2)
17. “Mechanical Designs and Systems Handbook”, by Harold Rothbart. Second Edition, McGraw-
Hill Inc. 1985. (ISBN: 0-07-054020-9)
18. “Mark’s Standard Handbook for Mechanical Engineers ” by Eugene Avallone and Theodore
Baumeister. McGraw-Hill Inc. 1978. (ISBN:0-07-004127-X)
AGMA Webinar: How To Read and Interpret A Gear Inspection Report: Slide 84
Reference List
19. “Rules of Thumb for Mechanical Engineers” by J. Edward Pope. Gulf Publishing Company.
1997.
20. “Mechanisms and Mechanical Devices Sourcebook” by Nicholas Chironis and Neil Sclater.
Second Edition, McGraw-Hill, Inc. 1996. (ISBN: 0-07-011256-4)
21. “Stress Concentration Factors” by R. E. Peterson. John Wiley and Sons, Inc. 1974.

29
AGMA Webinar: How To Read and Interpret A Gear Inspection Report: Slide 85
Reference List – URL Information 1. http://www.flying-pig.co.uk/mechanisms/pages/crank.htm
2. http://www.arrowgear.com/products/zerol_bevel_gears.htm
3. http://en.wikipedia.org/wiki/Spiral_bevel_gear
4. http://materialhandling.globalspec.com/LearnMore/Motion_Controls/Power_Transmission/Gears/
Worms_Worm_Gears
5. http://www.mekanizmalar.com/worm_gear.shtml
6. http://www.flying-pig.co.uk/mechanisms/pages/worm.html
7. http://en.wikipedia.org/wiki/Hypoid_Gear
8. http://en.wikipedia.org/wiki/Involute_gear
9. http://upload.wikimedia.org/wikipedia/commons/c/c2/Involute_wheel.gif
10. http://www.qtcgears.com/Q410/QTC/Q410P342.htm
11. http://www.gears-manufacturers.com/cycloidal-gears.html
12. http://www.csparks.com/watchmaking/CycloidalGears/index.jhtml
13. http://www.youtube.com/watch?v=UayBAHJQE_k
14. http://upload.wikimedia.org/wikipedia/commons/a/a0/CycloidAnim04.gif
AGMA Webinar: How To Read and Interpret A Gear Inspection Report: Slide 86
Reference List – URL Information 15. http://www.engineeringletters.com/issues_v15/issue_1/EL_15_1_4.pdf
16. http://www.zakgear.com/WN.html
17. http://www.gearsolutionsonline.com/article/detail/5393/title/william-crosher-tooth-tips
18. http://gltrs.grc.nasa.gov/reports/2007/TM-2007-215032.pdf
19. http://upload.wikimedia.org/wikipedia/commons/c/c2/Involute_wheel.gif
20. http://upload.wikimedia.org/wikipedia/commons/4/4e/Hertz_contact_animated.gif
21. http://www.toolingu.com/definition-560100-25038-helical-gear.html
22. http://www.rushgears.com/Gear_Types/helicalGears.php
23. http://en.wikipedia.org/wiki/Face_gear
24. http://www.gears-manufacturers.com/face-gear.html