Embed Size (px)
Citation preview
Government of Tonga
Ministry of Education and Training (MET)TVET Support Program (TSP)
The Tonga and Regional Labour MarketReview 2012: A study to identify the demand
for skills training in Tonga
Final
5 March 2013

5 March 2013 - Final 2 of 122
Table of Contents
Executive summary .................................................................................................................... 8
Chapter One: Overview of the Tongan labour market ...................................................... 11
The state of the economy and prospects for the future........................................................ 11
Changes in the population profile........................................................................................ 13
The occupation profile of Tonga in 2011 ............................................................................ 14
Conclusion ........................................................................................................................... 18
Annex 1.1 ................................................................................................................................. 20
Annex 1.2: Analysis of Job Advertisements in Tonga............................................................. 23
Chapter Two: The Supply of Skills and Employment Outcomes ...................................... 27
General education ................................................................................................................ 27
Overseas scholarships.......................................................................................................... 28
Foundation and generic skills .............................................................................................. 28
Behavioural and social skills ............................................................................................... 29
Post-school qualifications by occupation ............................................................................ 30
Conclusion ........................................................................................................................... 33
Annex 2.1 ................................................................................................................................. 34
Annex 2.2: Tonga Graduate Tracer Survey 2011 employment outcomes ............................... 42
Chapter Three: Domestic Demand for Middle-Level Skills............................................... 47
The context .......................................................................................................................... 47
What types of skills are needed by employers .................................................................... 49
Technical skills in current demand...................................................................................... 51
Type of training needed....................................................................................................... 57
Need for short courses ......................................................................................................... 57

5 March 2013 - Final 3 of 122
Extent of skills gaps in the workforce ................................................................................. 58
Annex 3 .................................................................................................................................... 59
Chapter Four: Needs of the Informal Economy and the Rôle of Training....................... 62
Outline of this chapter ......................................................................................................... 63
Survey of people earning income in the informal economy................................................ 63
Women and the informal economy ..................................................................................... 66
Women in business.............................................................................................................. 68
Conclusion ........................................................................................................................... 69
Chapter Five: Forecasting future demand for middle skills .............................................. 70
Difficulties with forecasting the future based on past trends .............................................. 72
Estimating the potential of replacement demand for middle-level skills ............................ 73
Demand based on filling skills gaps in middle-skill occupations ....................................... 73
Estimates of potential replacement demand and demand to fill skills gaps ........................ 74
Identifying emerging skills needs........................................................................................ 75
Conclusion ........................................................................................................................... 79
Annex 5 .................................................................................................................................... 80
Chapter Six: Tongan participation in regional and international labour markets ......... 85
Tongans living in New Zealand .......................................................................................... 85
Tongans living in Australia ................................................................................................. 86
Profile of Tongan migrants to New Zealand ....................................................................... 87
Tongan migration to Australia............................................................................................. 88
Current demand for skilled labour in Australia and New Zealand...................................... 90
Tongans living in the United States..................................................................................... 92
Maritime work for Tongans................................................................................................. 93
Annex 6 .................................................................................................................................... 96

5 March 2013 - Final 4 of 122
Chapter Seven: Indicators of capacity for the Tongan labour market ........................... 104
Key considerations ............................................................................................................ 104
Capacity indicators for whom?.......................................................................................... 105
Attachment 1: Scope of the Review .................................................................................... 110
Defining the focus ............................................................................................................. 111
Skills supplied by TVET ................................................................................................... 112
Key principles to underpin the review............................................................................... 112
Risks and limitations of the available data ........................................................................ 112
Making the most of available data..................................................................................... 114
Attachment 2: A profile of the occupations in the major sectors of the economy.......... 115
Middle Occupations - public administration ..................................................................... 115
Middle Occupations - Health............................................................................................. 115
Main occupations - Accommodation, food & beverage, tourist travel agency services ... 115
Main occupations - Wholesale & retail trade & repair of motor vehicles & motorcycles 115
Main occupations - Construction & specialised construction industries........................... 115
Main occupations - repair machinery ................................................................................ 116
Main occupations - Electricity gas steam & air conditioning supply................................ 116
Main occupations - Financial & Insurance Services plus activities auxiliary to financialservice & insurance activities ............................................................................................ 116
Main occupations - Communications ................................................................................ 116
Main occupations - Land, Water & Air transport; Warehousing & support activities fortransportation ..................................................................................................................... 116

5 March 2013 - Final 5 of 122
Acknowledgements
This labour market review breaks new ground for the kingdom of Tonga. It provides for thefirst time comprehensive information and extensive analysis of the rôle of middle-level skillsin the Tongan labour market and in overseas labour markets where large communities ofTongans reside. It also breaks new ground for the Pacific, as no similar comprehensive reviewof the labour market for middle-level skills has been undertaken in any other Pacific islandcountry.
Extensive use has been made of the data on occupations from the 2011 national census. Thesedata have provisional status only, pending the official release of the census results. Thanks toThe Government Statistician, Mr Ata Ata Finau, and census director, Mr Sione Lolohea, fortheir approval to use the data and help in accessing it. Mr David Smith, Director, Surveys &Reporting, Economic Analysis Unit, Australian Department of Immigration and Citizenship,kindly responded to a request for data from the 2011 Australian census on Tongans resident inAustralia. Ms Karen McGuigan, Director, Migration Modelling and Statistics, AustralianDepartment of Immigration and Citizenship, provided the data on recent Tongan migrants toAustralia. Ms Nicola Hogg, General Manager, Visa Services, Immigration New Zealand, alsoprovided valuable feedback on analysis of data on Tongan migrants to New Zealand.
Three special surveys provide the primary data for the review. The Tonga Graduate TracerSurvey 2011 was carried out by the Ministry of Training, Employment, Youth & Sports(MoTEYS). I am grateful to Mrs Fatai Soakai for her help in giving me full access to the dataand for providing helpful background information. The surveys of enterprise skills andincome earners in the informal economy were funded by the TVET Support Program (TSP)and were carried out under the supervision of Dr Masasso Paunga (USP), a consultantengaged for the review. He received support from Mr Siaosi Enosi (TSP), Ms Luseane Aho(TSP), Ms Kepreen Ve'etutu (TSP), MET staff members, the USP staff who were responsiblefor data entry, Ms Mele Vunipola (MCTL), Ms Tangini Tuifua (MCTL). Mr Eric Jurmooffered his services as an intern and gave valuable assistance by coding and preparing theresults of the informal economy survey for further analysis. Ms Luseane Aho (TSP) alsoprovided valuable help by collecting and coding the job advertisements from threenewspapers for three months, and compiling available data on TVET enrolments andgraduates. She also presented the results of the Graduate Tracer Survey to TVET providersand got feedback about the relevance of the results to their institutions.
Mr Geoff Penhall, the team leader for the TVET Support Program (TSP), took a major part inthe design of the survey of the informal economy, conducted a number of interviews anddeveloped a template for analysing the results. He also made sure that all available resourceswere allocated to meet the demanding workload that these surveys involved. He has alsoworked hard to ensure that all available data were identified and made use of where possible.Thanks also to the participants to the two presentations on 19 and 21 February who providedfeedback through the evaluation forms, highlighting the issues they thought were importantand saying where they wanted information. A special thanks also to Peter Morris for hiscomments on the report.
Richard CurtainShort-term Adviser, Tonga labour market Study26 February 2013

5 March 2013 - Final 6 of 122
Abbreviations
ICT Information & communication technology
ILO International Labour Organisation
ISCOInternational Standard Classification ofOccupations
IT Information technology
LAME/AMELicensed aircraft maintenance engineer/AircraftMaintenance Engineer
MCTL Ministry of Commerce, Tourism & Labour
MET Ministry of Education and Training (MET)
MLECCNRMinistry of Land, Environment, Climate Changeand Natural Resources
MoTEYS Ministry of Training, Employment, Youth & Sports
NZ New Zealand
OECDOrganisation for Economic Cooperation andDevelopment
PUMA Planning and Urban Management Agency
STAT Standardised Test Of Achievement Tonga
TOP Tongan Pa'anga
TSP TVET Support Program
TVET Technical and vocational education and training
UNITECUnitec Institute of Technology, Auckland, NewZealand

5 March 2013 - Final 7 of 122
Executive summary
Key questions
How big is the labour market for middle-level skills in Tonga (defined as skills recognised byqualifications below a degree)? Does Tonga have enough jobs requiring middle-level skills tojustify the Government’s and community’s investment in technical and vocational educationand training (TVET)? How important are middle-skill jobs for skilled migrant entry toAustralia and New Zealand? Is this large investment in TVET cost-effective? How do TVETgraduates fare in terms of employment outcomes in Tonga and in labour markets overseas?
Report focus
This report provides information on the current supply and demand for middle-level skills inTonga and in three countries where large communities of the Tongan diaspora live and work.It also identifies, where possible, the future need for middle-level skills in Tonga and in themajor overseas destinations for Tongans. The report breaks new ground for Tonga, in terms ofunderstanding the labour market for middle skills. It also gives Tonga the opportunity to takethe lead ahead of other Pacific countries in matching skills to jobs.
Audiences for the report
The audiences for this report are several. They include include the Government of Tonga,churches, donors, students and parents because they fund TVET. Enterprises too are a keyaudience because they are seeking the skills TVET provides. The report also speaks to theneeds of Tongans in the informal economy.
Pressures for change to deliver better skills outcomes
A range of push and pull factors are pressuring the Government and TVET providers to makemore effective use of skills. The youth bulge in the population is a leading push factor. Largernumbers of young people are reaching age 18 each year. Linked to this is the growing numberof young people with higher levels of formal education and the high expectations about paidwork that go with that.
Government, in a new age of austerity, has to make hard decisions about how to get bettervalue from the services it funds. Also, Tongan faith-based communities and households, nolonger able to expect the same level of remittances as in past years, have to work out how toget better TVET results with fewer resources.
Another source of pressure for change is the pull of well-paid jobs overseas. Tonganmigration to these countries in the past has been largely family-driven with a relatively lowproportion of migrants getting skilled jobs in the USA, New Zealand and Australia. Two ofthese countries now increasingly demanding recognised skills as the basis for migrant entry.This means an increased need for TVET providers in Tonga to provide internationallyrecognised skills. Also required of skilled migrants is relevant work experience and workskills based on the requirements of high-performance workplaces.

5 March 2013 - Final 8 of 122
The demand for different and higher quality skills training also comes with new technologyand new ways of working. Finally, new emerging industries are demanding new sets of skills.The demand for new ‘green skills’ to operate and maintain the new forms of renewableenergy generation is a good example.
Framework for the report
The report uses a simple framework based on the supply of and demand for skills. Theoverview discusses the changes in occupations between 2006 and 2011, and makes use of theresults of 2011 census to identify middle-level occupations relevant to Tonga. Attention isalso given to the share of job holders with post-school qualifications. Information is alsopresented on the providers by type of qualification and field of study, the number of studentsthey are training and the graduates they have produced, where the data are available.
It is estimated that in 2012, some 2,300 young people left secondary school at Form 5 andabove. The number of job vacancies is estimated to be between 180 and 300 a year.
Differing employment outcomes for TVET graduates
Information on the employment outcomes of TVET graduates in twelve skill areas orindustries is presented and discussed. Three types of employment outcomes are evident.Graduates in nursing and in teaching have good employment rates, varying from 90 to near to100 per cent. The employment rates for TVET graduates in fields of study as accounting andbusiness studies are also reasonably high, about 70 to 75 per cent.
However, several fields of study have weak employment outcomes. This applies especially toCertificate in Information Technology where only one-in-five graduates are in paid work. Theemployment rate for the diploma graduates of information technology is better at near to two-in-three in jobs but still below expectations. The certificate holders in secretarial studies alsofind it hard to get paid work. Only one-in-three is employed, with half of these graduateslooking for work.
Two qualifications aimed at employers in tourism & hospitality have weak employmentoutcomes as well. Less than half of the certificate holders in cooking and hospitality are inpaid work and over half are looking for work. The same picture holds for the diplomagraduates in tourism & management with half employed and half of the graduates looking forwork. The employment outcomes of graduates with maritime qualifications are also weakwith between a third and a half of these graduates looking for work. Possible reasons for thesedifferent outcomes are discussed in the report.
Types of skills sought by employers
Nine out-of-ten employers in the formal sector have been surveyed for this report. Over halfof all employers surveyed said it was hard or very hard for them to recruit workers with theskills they need. Employers also identified skills gaps in their existing workers, with only athird of employers able to say that all their workers have the skills to do their job. Employersoften identified their need for skills as broader than the technical skills associated with TVETprovision. They wanted a foundation of basic literacy & numeracy and English languageskills. Also important are a range of social or behavioural skills.

5 March 2013 - Final 9 of 122
Needs of the informal economy
More people in Tonga earn an income from the informal economy than the formal economy.However, most countries only fund skills training to prepare people for work in the formaleconomy. Providing training for the informal economy suffers from a number of challenges.One is the lack of adequate resources allocated to supporting activities in the informaleconomy. Another is the lack of suitable trainers. Another challenge is the low literacy andnumeracy of many of those making a living in the informal economy. The results of a specialsurvey of Tongans seeking better ways to generate a reliable livelihood are reported.
Forecasting future demand for middle-level skills
In an economy where the private sector services the needs of a small domestic market and atourist trade with variable demand, government and donor priorities for infrastructureinvestment provide the best guide to the future demand for skills. Current and future proposedlarge projects require skills over and above the normal requirements of a low-growtheconomy. However, it is not possible to apply a set template to work out the domestic skillneeds of a specific project. These will depend, among other factors, on the opportunitiesenterprises provide for skills transfer to the domestic workforce.
Future opportunities for skills formation may also require a change in government policy tomaximise the skills transfer opportunities. One way for the government to do this is tostipulate in a request for tenders that opportunities for skills transfer be provided such as theemployment of apprentices. Government can also specify the ‘green jobs’ and competenciesneeded to implement its policy statements on renewable energy and responses to climatechange.
Opportunities for Tongans in Australia, New Zealand and USA
Tongans have a strong migrant presence in three countries: New Zealand, Australia and theUSA. The report presents detailed information on the job profiles of Tongans in NewZealand, and Australia. The report also highlights the changing nature of the skills migrationpolices of Australia and New Zealand and presents information on the types of skills expectedof migrants to these countries. For the USA, more general data are available on the jobs heldby Pacific Islanders, a group which includes the 57,000 Tongans.
The main conclusion is that migrants need higher levels of education to obtain secure work inthe main overseas destinations for Tongans. The shift to employer demand-led immigration inAustralia and New Zealand means authorities are placing greater emphasis on meetingemployer requests for recognised skills matched to job requirements. In the USA, the demandfor nurses is also emphasising the importance of having a degree geared to US requirements.
Indicators of capacity
A key issue in developing appropriate indicators is to know for whom they are intended. Thereport discusses three approaches to the use of indicators of labour market capacity. A numberof indicators are proposed which cover the supply of skills, the demand for skills and skillsmatching.

5 March 2013 - Final 10 of 122
Chapter One: Overview of the Tongan labour market
The state of the economy and prospects for the future
Tonga has a small, open, island-based economy of just over 100,000 people. The servicessector dominates, contributing 63 per cent of Gross Domestic Product (GDP). Agriculturecontributes 20 per cent, and the industrial sector accounts for 17 per cent of GDP. Theservices sector accounts for the remainder of the economy. The country is dependent onexternal aid and remittances from Tongan communities overseas to offset its trade deficit.1
Tourism is the second-largest source of hard currency earnings followed by remittances,agricultural exports, including fish, make up two-thirds of total exports. Squash, coconuts,bananas, yams, watermelons and vanilla beans are important crops. The country imports ahigh proportion of its food, mainly from New Zealand.
Tonga is said to have a reasonably sound basic infrastructure and well-developed socialservices. However, there is high unemployment among young people, a continuing upturn ininflation, and rising civil service expenditures. The government wants to develop the privatesector more through foreign investment and has committed increased funds for health andeducation.2
Current economic conditions
Tonga, as an open economy, has been affected by the global recession with declines intourism, remittances, and exports. Financial conditions remained tight as banks raised lendingstandards following a large rise in non-performing loans. In 2011, growth in the economy wasachieved by a recovery in tourism and expansionary fiscal policy financed by donor aid.3
However, Tonga’s economy grew by only 1.3 per cent in the financial year to end June 2012,down from 4.7 per cent in the previous year.4 Growth for the current financial year isprojected to fall slightly to 1 per cent as infrastructure projects are completed. Capitalexpenditure by the Government of Tonga fell by half in the financial year 2011-2012. Thiswas due to the winding down of donor-funded construction projects. The Governmentextended its freeze on filling civil service positions to the end of 2012 in an effort to reduceits wages bill.5 Private sector credit continues to decline. Lending to businesses fell by 19 percent in July 2012. Remittances, which are equivalent to around 30 per cent of GDP, continueda prolonged decline by 23 per cent financial year 2011-2012.6 Tourism receipts fell by 8 percent for the year, despite slightly increased numbers, because of shorter stays and pricediscounting.
The World Bank’s end of 2012 assessment notes that the Government of Tonga faces majoreconomic challenges. This is due to ‘sluggish growth prospects, weak revenue performance,
1 https://www.cia.gov/library/publications/the-world-factbook/geos/tn.html2 https://www.cia.gov/library/publications/the-world-factbook/geos/tn.html3 IMF, 2011, Tonga: IMF Country Report No.11/110, International Monetary Fund, Is hington DC, p 3.4 World Bank, 2012, East Asia and Pacific Economic Update December 2012, Volume 2, p 92.5 Tonga: ADB Pacific Economic Monitor December 2012, p 14 www.adb.org/pacmonitor6 Tonga: ADB Pacific Economic Monitor December 2012, p 14 www.adb.org/pacmonitor

5 March 2013 - Final 11 of 122
possible permanent declines in remittances, and growing debt-repayment obligations’.7 Thisassessment has been confirmed by the Governor of the National Reserve Bank of Tonga whonoted on 4 February 2013. She stated in an address to the Tongan Chamber of Commerce &Industry that falling exports and remittances, along with other struggling sectors, haveweakened Tonga's economy. The global financial crisis has resulted in a ‘steep andcontinuous decline’ of cash remittances to Tonga since 2008. Tonga received about US$13million less in remittances in 2012.8 Real GDP growth is also projected to slow down. Tonga'spublic debt has risen by TOP$172 million [US$99.5 million] in four years.9
Outlook for the future
The International Monetary Fund undertook a detailed assessment of the state of the economyin March 2011. Its assessment noted that:
Over the medium term, growth is expected to remain at around 1¾ per cent-in line with the average of the past 15 years but about ¾ per centage pointsabove the average of the past 10 years. This medium-term outlook assumesimplementation of the government's plans, including stepped up capitalspending, structural reform, improved fiscal management to support fiscalconsolidation, as well as continued high emigration. Growth is expected tobe mainly driven by tourism and agriculture, consistent with medium-termdevelopment priorities.10
This information suggests that domestic jobs growth in the future will be slow in both thepublic and private sectors. The main source of new jobs will be from government and donorinvestment in infrastructure projects. Emigration will remain an important outlet for Tongansseeking paid work, especially for those with internationally recognised skills.
The jobs challenge facing Pacific island countries
The jobs challenge facing Tonga is best summarised by the World Bank’s profile of smallisland nations in its World Development Report 2013 on Jobs.11 According to the WorldBank, small island nations, especially in the Pacific, are unable to reap the benefits from aconcentration of businesses and skills available to large economies because of their size.Remoteness from the main trade routes and the high cost of transport also means they cannotbenefit from being close to high-income markets except through tourism. Employmentopportunities are limited apart from working for government and in providing basic services.12
However, the World Bank emphasises that for these countries outmigration is a major waypeople can improve their living standards. Also return migration and overseas communities
7 World Bank, 2012, East Asia and Pacific Economic Update December 2012, Volume 2, p 928 ‘Bank Governor: Tongan Economy Continues To Weaken: GDP projected to slow, overseas remittances insharp decline’. Pacific Islands Report, www.pireport.org9 See Note 810 IMF, 2011, Tonga: IMF Country Report No.11/110, International Monetary Fund, Washington DC, p 5.11 World Bank 2012, ‘Overview: Moving Jobs to Center Stage’, World Development Report 2013: Jobs,Washington DC; p 19.12 Only three out of the 78 job advertisements in a three-month period in Tonga 2012 were from the privatesector. Nearly three-in-four job advertisements (72 per cent) were for positions funded by government or publicenterprises. The remainder were for jobs in non-government organisations or in regional organisations.

5 March 2013 - Final 12 of 122
through remittances can boost business opportunities in the domestic economy.13
Changes in the population profile
The population of Tonga between 2006 and 2011 increased by 1,045, an increase of 1 percent, with an annual rate of 0.02 per cent. Applying a higher annual population growth rate tothe 2006 population count gives an estimate of the number of people who are likely to haveleft Tonga between 2006 and 2011. If an annual compound growth rate of 2.3 is used14, thepopulation in Tonga in 2011 would have been 114,272, a difference of 11,236 compared withactual count of 103,036. About 10,000 Tongans have emigrated since 2006.
Youth bulge and what it means for the demand for jobs
Tonga has a youth bulge in its population as the age pyramid below shows, with more youngpeople on the way. The best measure of a youth bulge is the share of young people in theadult working population. This shows the competition for jobs. A third of the adult workingage population in 2011 are young people aged 15-24 years.15
13 See Note 1114 An annual growth rate based on the Melanesian countries is used to estimate the possible size of the Tonganpopulation without emigration as these countries have much lower emigration rates. The SPC records an annualgrowth rate of 2.1 for Papua new Guinea, 2.7 for Solomon Islands and 2.6 for Vanuatu.15 These data are based on United Nations Population Division estimates from its World Population Prospects:The 2010 Revision. The estimated total population in 2010 is 104,000 which is close to the census total of103,036. The projected population figures, therefore, are based on past emigration rates. The adult working agepopulation is defined as 15-59 years.

5 March 2013 - Final 13 of 122
In actual numbers, young people in this age group now number an estimated 19,000. Theyouth share in the working age population is projected to reach 36 per cent in 2015, 38 percent in 2020 and will fall slightly to 37 per cent by 2025 and return to a third share in 2030. Interms of actual numbers of young people entering the labour force, their numbers willincrease from the current level of 19,000 to 22,000 in 2015, 24,000 in 2020, 25,000 in 2025and will fall off to 24,000 in 2030. These UN projections assume past rates of emigration willcontinue.
These increased numbers of young people put pressure on Tonga’s economy is to providemore jobs in the domestic economy than it is doing now. If the current rate of employment isapplied to the working age population in the future, the economy will have to create over1,100 additional jobs by 2015 and 1,700 by 2020 to keep the same rate of employment asnow. Alternatively, young people need clear pathways to skilled work overseas.
Data presented in Chapter 2 below show that altogether some 2,300 young people entered thelabour market in 2012 after leaving secondary school with Form 5 or above. Other data on jobadvertisements show that an estimated 180 to 190 jobs were advertised in August to end ofOctober 2012 that required less than a degree. Employers in the enterprise survey said theyhad 118 job vacancies in November 2012 although there may be a hiring delay imposed onpositions funded by the government budget. It is not known what the extent of the overlap isbetween these vacancies and the advertised jobs. So the range of available jobs in a year islikely to be between 180 and 310. Nevertheless, the gap between the number of young peoplewith formal education and the number of available jobs in the formal sector is large.
The occupation profile of Tonga in 2011
Tonga has a total population of 103,036 on 30 November 2011, according to the preliminaryresults of the Tonga National Population and Housing Census 2011. This figure is an increaseof 1,045 people only since 2006, a growth rate of 1 per cent over the five year period or 0.2per cent annual growth rate. However, the changes in the occupations of Tongans between2006 and 2011 are much more marked.
The 2011 national census for Tonga provides the most comprehensive source of informationon the occupations of Tongans aged 15 years and over. The following broad occupationalgroupings are based on the International Standard Classification of Occupations (ISCO).Slightly less than a third of the population is employed. This means working for pay,producing goods mainly for sale, or working to support a household by producing goodsmainly for their own consumption.
The census identifies three broad types of employment. The first type is based on jobs in theformal economy. The second type of employment is based on work in the informal economy.The third type of employment is based on producing goods mainly for householdconsumption. The jobs in the formal economy are usually for pay and the employer is aregistered business. Work for the informal economy usually involves an individual or ahousehold producing goods or services mainly for sale. Work based on mainly producingfood to subsist has little engagement with the cash economy.
According to the census, the formal economy accounts for 16,183 or near to half of thoseaged 15 years and over in work (Table A1.1 in the annex to this chapter). One third of thosein employment are in the informal economy. Over one-in-six (17 per cent) are subsistence
5 March 2013 - Final 14 of 122
farmers, fishers, hunters & gatherers
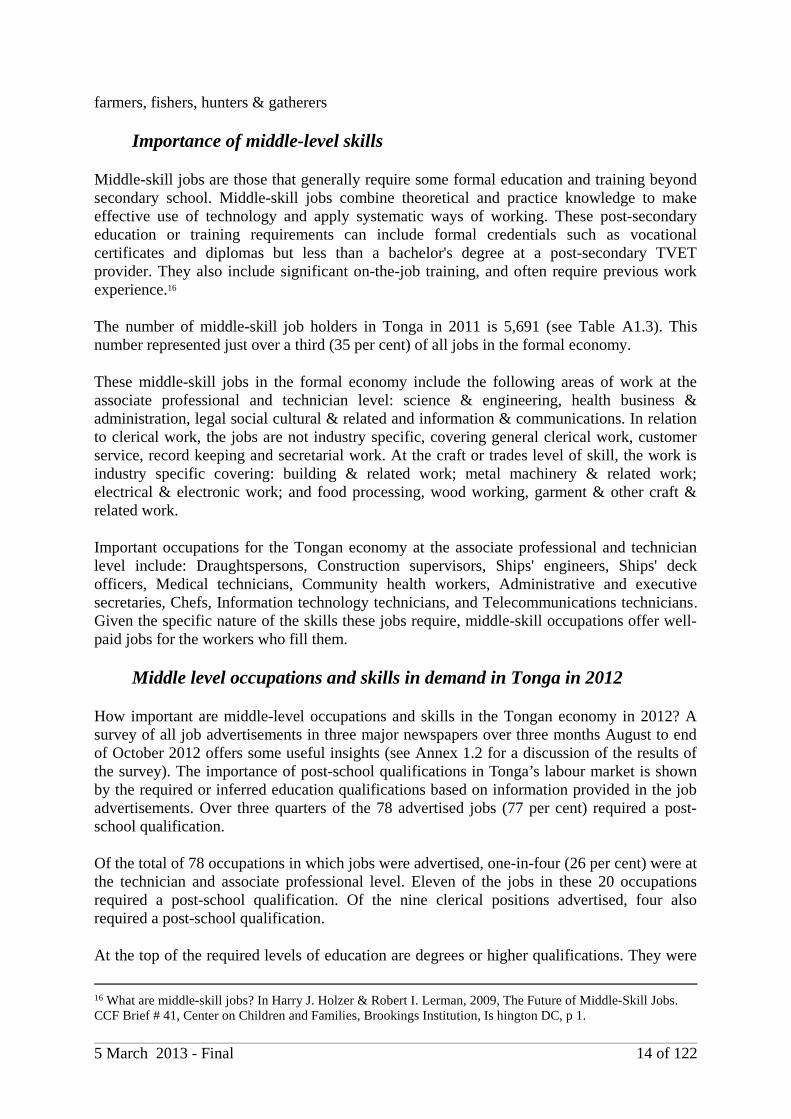
Importance of middle-level skills
Middle-skill jobs are those that generally require some formal education and training beyondsecondary school. Middle-skill jobs combine theoretical and practice knowledge to makeeffective use of technology and apply systematic ways of working. These post-secondaryeducation or training requirements can include formal credentials such as vocationalcertificates and diplomas but less than a bachelor's degree at a post-secondary TVETprovider. They also include significant on-the-job training, and often require previous workexperience.16
The number of middle-skill job holders in Tonga in 2011 is 5,691 (see Table A1.3). Thisnumber represented just over a third (35 per cent) of all jobs in the formal economy.
These middle-skill jobs in the formal economy include the following areas of work at theassociate professional and technician level: science & engineering, health business &administration, legal social cultural & related and information & communications. In relationto clerical work, the jobs are not industry specific, covering general clerical work, customerservice, record keeping and secretarial work. At the craft or trades level of skill, the work isindustry specific covering: building & related work; metal machinery & related work;electrical & electronic work; and food processing, wood working, garment & other craft &related work.
Important occupations for the Tongan economy at the associate professional and technicianlevel include: Draughtspersons, Construction supervisors, Ships' engineers, Ships' deckofficers, Medical technicians, Community health workers, Administrative and executivesecretaries, Chefs, Information technology technicians, and Telecommunications technicians.Given the specific nature of the skills these jobs require, middle-skill occupations offer well-paid jobs for the workers who fill them.
Middle level occupations and skills in demand in Tonga in 2012
How important are middle-level occupations and skills in the Tongan economy in 2012? Asurvey of all job advertisements in three major newspapers over three months August to endof October 2012 offers some useful insights (see Annex 1.2 for a discussion of the results ofthe survey). The importance of post-school qualifications in Tonga’s labour market is shownby the required or inferred education qualifications based on information provided in the jobadvertisements. Over three quarters of the 78 advertised jobs (77 per cent) required a post-school qualification.
Of the total of 78 occupations in which jobs were advertised, one-in-four (26 per cent) were atthe technician and associate professional level. Eleven of the jobs in these 20 occupationsrequired a post-school qualification. Of the nine clerical positions advertised, four alsorequired a post-school qualification.
At the top of the required levels of education are degrees or higher qualifications. They were
16 What are middle-skill jobs? In Harry J. Holzer & Robert I. Lerman, 2009, The Future of Middle-Skill Jobs.CCF Brief # 41, Center on Children and Families, Brookings Institution, Is hington DC, p 1.

5 March 2013 - Final 15 of 122
required for two-in-five (41 per cent) of the advertised jobs. One-in-ten positions (9 per cent)required a nursing diploma or higher. Over one-in-four (27 per cent) jobs required a sub-degree post-school qualification other than a nursing qualification. Altogether over a third (36per cent) of all jobs advertised required a post-school qualification below a degree. Only asmall share of jobs are directed at secondary school leavers. Just over one-in-ten (13 per cent)of advertised jobs required a secondary school leaving certificate.
Occupational profile in 2011
Four main occupations groups are the focus of this review due to the rôle that TVET does orcould play in their skills acquisition process. They are: Technicians & AssociateProfessionals; Clerical workers; Service workers, Shop & Market Sales Workers, and Craft &Trades Workers. Plant and machine operators are excluded because their skills are learnt on-the-job, through learning by doing or more formally through in-house training. The trainingneeds of Skilled Agricultural & Fishery Workers are addressed in a separate chapter.
Table A1.3 provides a more detailed listing of occupations at the two-digit ISCO level. Thetraditional focus of technical and vocational education and training in Tonga has been ontraining people for the associate professionals/technician occupations, and less so for clericalwork and for trade skills. Some training has been provided for work in agriculture and little orno training for personal service work. Handicraft workers and market-oriented agriculture andfishing workers are considered part of the informal economy and as such, require trainingarrangements that suit the different conditions in that economy.
Occupation change between 2006 & 2011
Tables A1.4 & A1.5 show which broad occupation groups have increased or decreasedbetween 2006 and 2011. This is despite an overall fall in the number of people inemployment. The two top occupational groups (Legislators, Senior Officials & Managers, andProfessionals) have increased their numbers by 380 and 927 respectively. The largest increaseof 54 per cent is for Legislators, Senior Officials & Managers, followed by Professionals (31per cent). Service Workers and Shop & Market Sales Workers have increased by 368 or 12per cent (see Table A1.5).
However, the number of jobs requiring middle-level skills has fallen over the five years to2011. The numbers of Technicians & Associate Professionals have decreased by 419 or 21per cent. Skilled Agricultural & Fishery Workers have decreased by 798 or 8 per cent. Craft& Trades Workers have decreased by 1,982 or 17 per cent. This follows a trend noted inmany other countries. It has been called the hollowing out of middle-skilled jobs in favour ofa growth in both high skilled and low skilled work.
Occupational trends over time
A closer look at the occupations within each broader grouping shows considerable change istaking place. Science & engineering associate professionals have decreased their number,health associate professionals have remained about the same and information &communications technicians have increased in importance. In relation to clerical work,customer services clerks have become less important over time while the ability to work withnumerical data has become important. The number of jobs in both personal and protectiveservices as well as sales has increased.

5 March 2013 - Final 16 of 122
These trends noted for Tonga also reflect a pattern identified over a thirty-year period for theUSA and confirmed by recent evidence from 16 European countries and Australia.17 As notedabove, the pattern in most countries has been for jobs to grow at both ends of the skillsspectrum with a decrease in middle-level skills. This is confirmed by a recent analysis ofoccupational change in 16 European countries over the period 1993-2006. This analysisshows rising employment shares for high-paid professionals and managers as well as for low-paid personal services workers. However, the employment shares of manufacturing androutine office workers have fallen.18
Job skills in demand
The US research covering the period 1969 to 1999 has shown that jobs based on ‘expertthinking’ and ‘complex communication’ skills have grown the most. ‘Expert thinking’ refersto the capacity to solve new problems for which there are no routine solutions. ‘Complexcommunication’ refers to the capacity to observe, listen, connect with, persuade and negotiate.These problem-solving or communication skills are required not only within the professionsand by managers. They are also important in the trade and service occupations.
Job skills in decline
In contrast, jobs based on routine thinking tasks are in decline. Since the beginning of the1980s in the USA, jobs involving basic, repetitive thinking tasks have fallen the most sharplyof all jobs. This trend indicates that jobs which apply routine rules or procedures are undersevere threat because they can be replaced by software. Alternatively, they can be performedat lower cost in a central location such as call centres in India or the Philippines.
As consumers can themselves now perform routine tasks such as withdrawing money from amachine, many clerical jobs such as bank tellers are no longer needed. Many other examplesexist of how face-to-face customer service gives way to consumer-driven use of technology tocarry out routine tasks. The new skills required now are more specialised and are limited to asmaller number of more highly skilled people who have to problem solve when thetechnology fails.
Low-skilled jobs are also growing
Jobs performing routine manual tasks are also under threat because they can be replaced bymachines or by redesigned work. However, jobs that require carrying out non-routine physicaltasks show a different trend. The work done by sales workers, housekeepers, hotel staff andcaterers, personal care workers such as nursing aids, security guards, hairdressers, truckdrivers and cleaners will remain essential. This is because these jobs require the ability torecognise and respond to changing situations and differing personal needs. The constantchanges to these tasks mean that only humans have the capacity to bring together the differenttypes of information needed to respond.
17 See Levy, F and Murnane, R; 2004, The New Division of Labor: How Computers are Creating the New JobMarket. Princeton University Press, Princeton and Oxford; Goos, M, Manning, A & Salomons, 2010,'Explaining Job Polarisation in Europe: The Roles of Technology, Globalisation and Institutions', CEPDiscussion Paper No 1026, November , Centre for Economic Performance, London School of Economics; andKelly, R and Lewis, P; 2010, 'The change in Labour Skills in the Australia over the Business Cycle', AustralianBulletin of Labour, Vol 36, No 3, pp 260-277.18 Goos, M, Manning, A & Salomons, A; 2010, p 42.

5 March 2013 - Final 17 of 122
Implications
The implications for this review are that clerical support jobs based on simple, routine taskswill continue to decline because computers are becoming more capable of performing thiswork. However, jobs based on problem-solving and high-level communication skills willgrow the most. Also increasing will be low-skilled service jobs because they are respondingto changing personal needs and situations.
The number of middle-skill jobs in Tonga has declined between 2006 and 2011. However,these middle-skill jobs still account for just over a third of all jobs in the formal economy.Some middle-skill jobs will expand in the future due to their link to new technology. Otherjob vacancies in middle occupations will come from normal job turnover. Many job holders inmiddle occupations will also need to upgrade their skills to enable them to perform the workexpected of them.
Opportunities for work in high-income labour markets will follow the same pattern. The needto have recognised skills is a key selection criterion in the immigration entry requirements ofNew Zealand and Australia. However, without post-school qualifications and relevant workexperience, it will be difficult for emigrants to enter the technician/associate professionaloccupations. Recognised middle-level skills in areas of demand are the best option for entry.
However, service-based work will also be a major source of employment in overseas labourmarkets. The largest occupations of Tongan women in Australia in 2011, after nursing, are‘nursing support & personal care worker’s and ‘aged & disabled carers’. For Tongan men,their largest occupations in Australia in 2011 are ‘forklift drivers’, ‘storepersons’ and‘security officers & guards’. These service jobs are increasingly require some level of post-school formal training.
Conclusion
This overview has highlighted the specific economic conditions affecting Tonga against thebackground of a broader set of constraints caused by being a small island country in thePacific. Despite little formal sector jobs growth between 2006 and 2011, major differences inthe growth and decline of broad occupational groups were noted. These changes reflect adeeper set of changes in the skills needed in the labour market due to the widespread use ofcomputers and the adoption of new ways of organising work.
The next chapter presents available evidence on the supply of skills and the employmentoutcomes of post-secondary graduates. Chapter Three discusses the available information onthe domestic demand for middle-level skills, drawing in particular on the results of a specialsurvey of enterprises conduced for this review. Chapter Four presents the results of a study ofthe income-earning opportunities in the informal economy and the rôle of training inimproving these opportunities. Attention is also given to the situation of women as incomeearners in the informal and formal economy. Chapter Five presents information from theenterprise survey about recent areas of jobs growth and prospects for job growth in the nextthree months from the date of the survey in November 2012. The chapter then focuses onproposed priorities for infrastructure investment and the implications for skills. Alsoaddressed are the skill needs of the maritime sector in Tonga and overseas.
Chapter Six discusses the jobs profile of Tongan migrants in New Zealand, Australia and the

5 March 2013 - Final 18 of 122
USA. Also discussed are the relevant middle skills-in-demand profiles of the immigrationauthorities of New Zealand and Australia. As well, skills and qualification trends for migrantsin the USA are also discussed, with particular reference to nursing.
The review ends with Chapter Seven. This chapter discusses the different approaches to theuse of indicators in the Tongan labour market and proposes a specific set of indicators onskills supply, demand and skills match.

5 March 2013 - Final 19 of 122
Annex 1.1
Table A1.1: Employment by whether in formal, informal orsubsistence economy, civilian population employed 15 years andover, national census of Tonga 2011, numbers in each group & percent
Type of economy N per cent
Formal 16,183 49.1Informal 11,171 33.9Subsistence 5,623 17.1
32,977 100.0
Table A1.2: Broad occupational groupings, civilian population employed 15years and over, national census of Tonga 2011, numbers in each group & percent, occupations in bold refer to the middle skilled occupations
Broad ISCO occupation groups2011
N Per cent1 Legislators, Senior Officials & Managers 1,079 3.32 Professionals 3,881 11.83 Technicians & Associate Professionals 1,588 4.84 Clerks 1,765 5.45 Service, Shop & Market Sales Workers 3,380 10.26 Skilled Agricultural & Fishery Workers 9,470 28.77 Craft Etc Trades Workers 9,662 29.38 Plant, Machine Operators & Assemblers 908 2.89 Elementary Occupations 1,244 3.8
32,977 100.0

5 March 2013 - Final 20 of 122
Table A1.3: Five occupational groups at the two-digit level, civilian populationemployed 15 years and over, national census of Tonga 2011, numbers in eachoccupation group, occupations in bold refer to the middle skilled occupations
Code Two-digit ISCO occupation classification N31 Science & engineering associate professionals 365
32 Health associate professionals 170
33 Business & administration associate professionals 578
34 Legal social cultural & related associate professionals 296
35 Information & communications technicians 179
Sub total 1,588
41 General & keyboard clerks 590
42 Customer services clerks 515
43 Numerical & material recording clerks 492
44 Other clerical support workers 168
Sub total 1,765
51 Personal service workers 619
52 Sales workers 1,765
53 Personal care workers 5
54 Protective services workers 991
Sub total 3,380
61 Market-oriented skilled agricultural workers 2,892
62 Market-oriented skilled forestry, fishery & hunting workers 955
63 Subsistence farmers, fishers, hunters & gatherers 5,623
Sub total 9,470
71 Building & related trades workers excluding electricians 1,411
72 Metal machinery & related trades workers 446
73 Handicraft & printing workers 7,324
74 Electrical & electronic trades workers 203
75Food processing, wood working, garment & other craft &related trades workers
278
Sub total 9,662

5 March 2013 - Final 21 of 122
Table A1.4: Broad occupational groupings, civilian population employed 15years and over, national census of Tonga 2006 and 2011, numbers in eachgroup
Table A1.5: Percentage change in each occupational grouping, civilianpopulation employed 15 years and over, national census of Tonga 2006 and2011, numbers in each group
Broad occupational group per centchange
Legislators, Senior Officials &Managers
54.4
Professionals 31.4
Technicians And AssociateProfessionals
-20.9
Clerks -3.7
Service Workers, Shop & MarketSales Workers
12.2
Skilled Agricultural & FisheryWorkers
-7.8
Craft /Trades Workers -17.0
Plant & Machine Operators &Assemblers
2.9
Elementary Occupations -8.8
Total employed -4.9
Broad Occupation groups2006 2011 2006-11
N NDiffer-ence
1 Legislators, Senior Officials &Managers 699 1,079 380
2 Professionals 2,954 3,881 9273 Technicians & AssociateProfessionals 2,007 1,588 -419
4 Clerks 1,832 1,765 -675 Service, Shop & Market SalesWorkers 3,012 3,380 3686 Skilled Agricultural & FisheryWorkers 10,268 9,470 -798
7 Craft Etc Trades Workers 11,644 9,662 -1,9828 Plant, Machine Operators &Assemblers 882 908 26
9 Elementary Occupations 1,364 1,244 -120
Total 34,662 32,977 -1,685

5 March 2013 - Final 22 of 122
Annex 1.2: Analysis of Job Advertisements in Tonga
Information was collected by TSP staff on 78 job advertisements over a three-month period in2012. Each occupation was coded according to the International Standard Classification ofOccupations (ISCO) 2008. Altogether two-in-five (41 per cent) of the job advertisements arein occupations below professional at the technician/associate professional, clerical or salesand service work levels. The largest group of occupations advertised (20) refer to technician/associate professional occupations, nine are clerical, and two refer to service work and oneinvolves providing building maintenance services. Of the 46 jobs advertised, 20 weretemporary. One advertisement was for 15 aged care workers on a temporary basis.
The industry sectors with the most job advertisements were: financial & insurance activities;human health & social work activities; public administration; activities of donororganisations; and transportation & storage. For the occupations below professional level, themain sectors seeking these skills were: public administration; financial & insurance activities;and transportation & storage.
The technician/associate professional-level occupations are shown below. Nine of the 20 jobsrequire a post-secondary qualification and another two did not state them in the jobadvertisement but would be required in the selection process (Bosun - Marine Masterqualification, and an IT Officer required to create & administer network & websites - adiploma in information technology).
Table A1.2.1: Technician/associate professional-level occupations according toISCO 2008 listed in advertised jobs, over three months, Tonga, 2012
Job title Job requirements Required qualifications
Assistant Air Worthiness -Officer
Form 7
Bosun Safely operate MV Hifofua n/a
Chief Clerk Higher Leaving Certificate
Coach - Women 7's Direct & supervise n/a
Committees Clerk/ResearcherProvide secretarial and technicalsupport
n/a
Computer Operator Grade 3 Diploma in IT
Finance & OfficeAdmin.(Australian SportsOutreach Program Tonga)
Maintain and handle day to dayoffice operations
n/a
Foreman Mechanics Asst. supervisor Trade Cert. in Mechanical Eng.
Head Coach - National 7's Direct, formulate, implement n/a
Health Co-ordinator Co-ordinate health activities Relevant tertiary qualifications
IT OfficerInstall, configure, monitorcomputer systems and network
Diploma in Information System,Information Technology,Computer System

5 March 2013 - Final 23 of 122
Job title Job requirements Required qualifications
IT OfficerCreate & administer network &websites
n/a
Marine Officer (Engineer) n/a Master Engineer Class III
MET Technician Gr 2 To implement, report and advisePacific Senior SecondaryCertificate (F6)
National Academy Coach Direct & supervise n/a
Personal Asst./Research To do research and present n/a
Senior Asst. Marine Officer -Nautical
Tertiary qualification in relevantfield
Senior Front Line Associate Sales and admin support Diploma in Accounting
Senior Marine Officer(Nautical)
n/a Master Engineer Class III
Settlement Officer (Domestic)Reconciliation and settlement ofaccounts
Dip. In Accounting, finance,banking
The main industry sectors advertising jobs at the technician/associate professional level are:water transport; public administration; information service activities; sports activities andamusement and recreation activities; and financial service activities.
Table A1.2.2: The industry sectors of technician/associate professional-leveloccupations, in advertised jobs, over three months, August to end of OctoberTonga, 2012
Industry sector NWater transport 5Air transport 1Information service activities 3Financial service activities 2Public administration 4
Social work activities 1
Sports activities, amusement &recreation activities
3
Activities of extraterritorialorganisations & bodies
1
The nine clerical jobs advertised are listed below. Four of the nine require a post-schoolqualification.

5 March 2013 - Final 24 of 122
Table A1.2.3: Clerical occupations according to ISCO 2008 listed in advertisedjobs, over three months, Tonga, 2012
Job title Job requirements Required qualifications
Clerk Class 1 Audit OfficeTonga School Certificate plusfive years work experience
Clerk Class 1 Public Service Commission Pass in Tonga School Certificate
Front Line Associate/'EuaProcess customer transactionsand handle customer enquiry
Form 7
Junior Medical Recorder Health Department Tonga School Certificate
Logistics OfficerEnsure procurement proceduresare followed
Relevant tertiary qualifications
Registry Clerk Public Service Commission Higher Leaving Certificate
Statistical Assistant - Economic Assist collect and process dataDiploma in Economic andBusiness
Statistical Assistant - Finance Assist collect and process dataDiploma in Finance andCommerce
Transaction Reporting OfficerAsst. Transaction ReportingOfficer
Dip. In finance, banking,commerce
One of the remaining three job advertisements require a post-school qualification. Theposition is for an ‘assistant building officer’ to help maintain a multi-storey building. Thequalification required is a ‘Diploma in plumbing, carpentry and joinery’. The other two jobsadvertised were for a cashier and required a Pacific Senior School Certificate and the otherwas for fifteen aged care workers, with no education qualifications specified.
Table A1.2.4: Required qualifications of advertised jobs, over three months,Tonga, 2012
Required qualification percent
Degree or higher 35.9
Diploma Nursing or higher 9.0
Other post-school quals 19.2
School Leaving Certificate 12.8
Other 1.3
Not available 21.8
100.0N 78

5 March 2013 - Final 25 of 122
The distribution of required education qualifications in the job advertisements are shown inTable A1.2.4 above. Over a third of the jobs advertised required applicants to have a degree orhigher qualification. One-in-ten positions required a nursing diploma or higher. One-in-fivepositions (19 per cent) required another post-school qualification. And near to one-in-sixpositions required secondary school leaving certificates. Over one-in-five advertisements (22per cent) did not specify a qualification although it is possible to infer what type ofqualifications would be required. Two examples a bosun to operate safely a sea going vesseland an IT (Information Technology) Officer required to ‘create & administer network &websites’.
It was also possible to infer the type of qualifications required based on the advertised jobdescription for a number of jobs. The following table shows the results of this exercise. Theproportion of jobs requiring a degree or higher qualification lifts to two-in-five (41 per cent)from 37 per cent. The share of jobs that do or may require a post-school qualification liftsfrom one-in-five (19 per cent) to over one-in-four (27 per cent).
Table A1.2.5: Required and inferred qualifications of advertised jobs, overthree months, Tonga, 2012
Required qualification per cent
Degree or higher 41.0
Diploma Nursing or higher 9.0
Other post-school quals 26.9
School Leaving Certificate 12.8
Other 1.3
Not available 9.0
100.0N 78

5 March 2013 - Final 26 of 122
Chapter Two: The Supply of Skills and EmploymentOutcomes
This chapter discusses the quantity and quality of the education inputs into the TVET process,the importance of foundation skills in literacy and numeracy and what are meant bybehavioural and social skills. Census data are used to show the existing middle-level stock ofskills in the formal economy, based on the share of workers in each middle occupation withpost-school qualifications. The remainder of the chapter reports on the employment outcomesachieved by TVET graduates in some 20 fields of study.
General education
Tonga had in 2008 a net enrolment ratio in primary education of 93 per cent of the relevantage group.19 The 2006 census recorded a net enrolment ratio of 88 per cent. The MDG targetis 100 per cent enrolment. Proportion of pupils starting Grade 1 who reach the last grade ofprimary school was 90 per cent in 2007, similar to the rate of 89 per cent based on the 2006census results.
The literary rate for 15-24 year-olds was claimed to be 99 per cent in 2006. However, thisclaim is based on a person’s own reply to a question in the census and not on anydemonstrated ability to read. As a minority of young people, between 17 and 22 per cent,have not attended or have not completed primary school, the demonstrated rate of literacyamong young people is likely to be much lower.
Primary and secondary school enrolment rates for 2009, 2010 and 2011 are presented in theAnnex to this chapter. The data have some major gaps such as nearly 2,000 secondary schoolstudents in 2011 who cannot be classified by the level of education they are in. However,comparing the same group of students over time shows that 64 per cent of Form 4 students in2009 have reached Form 6 in 2011 (see Tables A2.1-6).
The major exit years are at the end of Form 5 (the Tonga School Certificate) and at the end ofForm 6 (Pacific Senior Secondary Certificate). A small number stay on for Form 7 which isaimed at preparation for university entrance (South Pacific Form Seven Certificate (SPFSC),University of the South Pacific Foundation Level Examinations or Cambridge InternationalExaminations’s Advanced Subsidiary). The Form 5 leavers in 2011 are likely to havenumbered, 1,017.20 The Form 6 leavers in 2011 numbered 895.21 The Form 7 leavers in 2011numbered 387. Altogether, some 2,300 young people entered the labour market in 2012 afterleaving secondary school with Form 5 or above.
Supply of post-secondary graduates
The Secretariat of the Pacific Community commissioned a recent mapping study of technical& vocational education and training in the Pacific. The study offers the following assessment
19 Second report on progress in achieving the Millennium Development Goals,20 Based on the number of Form 5 students in 2010, less those in Form 6 and Hospitality, Vocational, &Commerce subjects in 2011.21 Based on the number of Form 6 students in 2010, less those in Form 7 in 2011.

5 March 2013 - Final 27 of 122
of the supply of skills in Tonga: ‘formal TVET provision in Tonga is complex andfragmented, and delivered by many small and relatively inefficient Government, faith-basedand private-sector providers’.22
The list of training providers and qualifications, with available data on enrolments andgraduates can be found in Annex 2, Table A2.7. It is obvious that there are major gaps in thedata for most training providers. No institution has been able to provide data on the number ofall enrolments or graduates by qualification for the last two years. Only four institutions havedata on their 2012 graduates. Table A2.8 summarises the numbers of graduates by field ofstudy.
Education attainment alone is increasingly viewed by policy makers in developed anddeveloping countries as a weak measure of the standard of education young people haveacquired. Measures of the literacy & numeracy of school students and the labour marketoutcomes they achieve are seen as more important measures. The issue of whether the flow ofgraduates is meeting the needs of the labour market is addressed below when the results of the2011 Graduate Tracer Survey are presented. This survey collected information on theemployment status of graduates from post-secondary providers for the years 2007 to 2010.
Overseas scholarships
A further potential supply of middle-level skills is from training institutions overseas. Theavailable source of information on this potential supply is the list of current and justcompleted scholarship holders funded by the Government of Tonga and donors. Checking thelist of current scholarship holders in April 2012, only three out of 113 are studying fordiplomas or a TVET qualification (Diploma of Physiotherapy, Diploma of DentalTechnology, TVET, UNITEC, New Zealand). Thirty five are listed as completing theirstudies and were expected to return in 2012. Only two of these graduates have a TVETqualification (a National Diploma Mechanical Engineering and a BA in Applied Technology,Automotive Engineering).
Foundation and generic skills
New efforts are being made to measure the cognitive, social and technical skills young peoplehave when they leave full-time education. Three types of skills can be identified: cognitive (orthinking) skills, social skills and technical skills.23 Cognitive skills refer to the ability to readand write, being able to express oneself verbally, have a good working memory, and beingnumerate and able to solve simple problems. These cognitive skills are not only formed in theearly years of schooling but also benefit greatly from support given by parents and the widerfamily.24 Social skills refer to the ability to work with others as part of a team, to be reliable,to show self-discipline and to make the effort to complete the work as expected. Technicalskills refer to the ability to perform certain tasks.
22 Dr Martin Grinsted, 2011, Mapping Study of Technical & Vocational Education and Training in Pacific ACPCountries Final Report, Secretariat of the Pacific Community, August, p 49.23 Box 5.7 ‘How skills are formed and how they are measured’ in World Bank, 2012, World DevelopmentReport 2013: Jobs. Washington DC, p 17524 See Note 17.

5 March 2013 - Final 28 of 122
Foundation cognitive skills
Standardised Test of Achievement of Tonga (STAT) is a national assessment of literacy andnumeracy skills for students in Class 4 and Class 6 of primary education. The test,administered in both English and Tongan, evaluates if students were developing the literacyand numeracy skills expected at their grade levels. STAT reading results have revealed theneed for major improvements on reading comprehension and writing composition in bothlanguages and grade levels.25
The Tonga Early Grade Reading Assessment
As part of the Government of Tonga's effort to improve reading levels, an early grade readingbaseline assessment was conducted in November, 2009 with support from regional educationpartners. Survey results showed major gaps in literacy learning. The survey results showedthat only 192 out of 1,203 students (17 per cent of the sample) in Grades 1 to 3 could beconsidered fluent in reading. Only 3 in 10 students at the end of Class 3 are able to developfluency in reading, an ability strongly related to reading comprehension.26
It is not known what the literacy and numeracy skills of 15 year-old Tongan students are.However, the responses of employers suggest that many secondary students lack basicfoundation skills in reading and working with numbers as well as English language capability.
Behavioural and social skills
Although cognitive (thinking) skills and knowledge are important educational outcomes, thecompetencies required in the workplace and in the wider community cannot be limited tothese cognitive elements alone. Employers in the enterprise survey stressed the importancealso of the practical skills, attitudes, motivation and values a worker has which are oftenacquired and developed outcome formal education.27 A number of high-income countries,including Australia and New Zealand, have identified key or core competencies, life skillsand basic skills. These countries have recognised that the supply of social skills is a necessaryrequirement of the skills formation process.
The Organisation for Economic Cooperation and Development, a think tank which collectsand analyses data on a range of countries, carried a project 2002-2005 to work out ‘a limitedset of competencies that are essential to personal, economic and social well-being’. Thesehave been based on the common elements of the different key or core competencies identifiedby OECD member countries. These competencies are presented below.
25 MEWAC. 2008. Tonga Standardised Test of Achievement: Results Report (mimeo). 2008 Ministry ofEducation, Women’s Affairs, and Culture26 World Bank. 2012. Tonga report. Vol. 2 of How well are Tongan children learning to read?. Pacific earlyreading assessments series. Washington DC.http://documents.worldbank.org/curated/en/2012/01/16711049/well-tongan-children-learning-read-vol-2-2-tonga-report27 Dominique Simone Rychen, 2009, ‘Key Competencies: Overall Goals for Competence Development: AnInternational and Interdisciplinary Perspective’, in R. Maclean, & D. Wilson (eds.),International Handbook ofEducation for the Changing World of Work, Springer and the UNESCO International Centre for VocationalEducation and Training, Bonn, p 2573.

5 March 2013 - Final 29 of 122
Employers responses on the gaps in the skills of their workers have highlighted the need for agreater focus by educators on these skills.
Key Competencies
Interacting in socially heterogeneous groups:
the ability to relate well to others;
the ability to co-operate;
the ability to manage and resolve conflict.
Acting autonomously:
the ability to act within the ‘big picture’;
the ability to form and conduct life plans and personalprojects;
the ability to defend and assert one’s rights, interests,limits and needs.
Using tools interactively:
the ability to use language, symbols and textinteractively;
the ability to use knowledge and informationinteractively;
the ability to use (new) technology interactively.
Source: Organisation for Economic Co-operation and Development.2005. The definition and selection of competencies: executivesummary. www.oecd.org/dataoecd/47/61/35070367.pdf
Post-school qualifications by occupation
The following section presents information about the formal post-school qualifications heldby job incumbents in the occupations classified as technician & associate professional, andcraft/trades workers of all residents in Tonga in 2011. A post-school qualification foroccupations at the technician level is usually required. The work requires more than skills thatcan be learned on-the-job. The nature of the work is such that knowledge of the theory isneeded to be able to write or read complex instructions, and to problem solve when faced witha non-routine event. In the case of occupations at the associate professional level, formaltraining based on an understanding of theory is also usually regarded as necessary.
The only occupation group with a high proportion holding a post-school qualification is ‘lifescience technicians & related associate professionals’, with 80 per cent (see Table A2.9). Nextcomes ‘nursing & midwifery associate professionals’, with 62 per cent. Two occupationgroups have half of their number with a post-school qualification: ‘physical & engineeringscience technicians’, and ‘medical & pharmaceutical technicians’. Over two-in-five (43 percent) ‘financial & mathematical associate professionals’ have a post-school qualification. Asimilar proportion (39 per cent) applies to ‘other health associate professionals’.

5 March 2013 - Final 30 of 122
Table A2.10 reports the proportion of people in each trade-level occupation with a post-school qualification. As most skills acquisition for craft or trades occupations is done on-the-job, formal qualifications are much less common than for the occupations of technicians.However, it is common for many countries to set up an apprenticeship system to codify andrecognise the skills learned on-the-job as well as ensure that some formal training is alsoprovided. Entry for trade level occupations to Australia and New Zealand via skilledmigration requires that these trade skills have been assessed by an independent body.
The two trade-level occupations which have the highest proportions of people withrecognised skills are: Electronics & telecommunications installers & repairers (39 per cent)and Electrical equipment installers & repairers (32 per cent). However, even in these twooccupations where externally recognised skills are important, three-in-five and two-in-threerespectively do not have post-school qualifications.
Construction work is a major source of work in Tonga. However, most of the skills requiredto do this work are learnt on-the-job and are not recognised formally. The 2011 census reportsthat most building workers do not have post-school qualifications. It is only about one-in-twenty of the 1,201 Building frame & related trades workers have a post-school qualification.Only one-in-five of the 143 Building finishers & related trades workers, and one-in-six of 67Painters, building structure cleaners & related trades workers are so qualified. These censusfigures show that only a small number of construction workers have the potential to migratefor work based on a recognised qualification.
Machinery mechanics & repairers is another important source of skilled work in Tonga.However, less than one-in-five of the 409 people working in this trade-level occupation grouphave a post-school qualification. Less than one-in-ten of the 169 Food processing & relatedtrades workers and 85 Garment & related trades workers have a post-school qualification.
Handicraft workers are the largest occupation group at this level. As this involves traditionalskills, no external form of skills recognition exists. Another important occupation relevant toTVET are vocational teachers. The census results show that four-out-of-five (81 per cent) ofthe 90 vocational teachers have a post-school qualification.
Post-secondary graduate employment outcomes
The real test of whether the supply of skills is meeting the demand is whether graduates of thetraining are in paid work and whether this work matches the skills for which they trained. Atracer survey of the 2007-2010 graduates from Tongan post-secondary institutions wasconducted in March/April 2011 by the Ministry of Training, Employment, Youth & Sports(MoTEYS), and funded through the Tonga TVET Strengthening Program (TSP1). Thedetailed results are reported in Annex 2.2 to this chapter.
Good employment outcomes
The results showed that the employment outcomes of graduates varied greatly by their post-school qualifications and type of connection to employers. At one extreme, the tracer surveyshowed that virtually all nursing graduates are employed. This is due to the close connectionbetween the training institution and the main employer of nurses in Tonga, the Ministry ofHealth. Nurses are recruited to training with the expectation that they will have a job at theend of their training. The numbers invited to enter training each year are determined by the

5 March 2013 - Final 31 of 122
needs of the employer. The employment relationship, like an apprentice, starts when thestudent nurses are recruited as trainees.
There are 217 nurses working in the health sector and another 25 working as nursingprofessionals in public administration. These numbers suggest that the domestic demand fornurses is limited to replacement demand, determined by retirement and emigration. The intakeof trainee nurses is limited to meeting domestic demand only.
For teachers, nine-out-ten graduates are employed. In this sector, the number of employers isgreater than is the case with nursing, with both government and church schools offeringemployment. There are 961 secondary school teachers and 791 Primary school and earlychildhood teachers as well as 90 vocational teachers. So if the share of teachers retiring orotherwise leaving teaching was 10 per cent each year, this would create over 180 vacancies.Enough to absorb new graduates.
Agricultural graduates also have a high employment rate (92 per cent), probably due to aclose connection with the Ministry of Agriculture for the Diploma graduates. It is worthnoting that both certificate holders were not employed.
Employment outcomes that could be better
Training for the private sector fared less well in terms of employment outcomes. Accountinggraduates at the certificate and diploma levels had reasonably high employment outcomes (79and 75 per cent respectively). However, significantly, 22 per cent of the Diploma graduateswere looking for work. Similarly, only seven-in-ten business graduates were in employmentwith 23 per cent looking for work. Closer ties with employers, through, for example, workplacements as students, may reduce this level of unemployment among accounting graduates.However, there are only 274 finance professionals and 145 finance associate professionals,adding up to 419 in total. The level of replacement demand is not likely to be high so thenumber of job vacancies may be limited.
The graduates of the Diploma in Construction & Architectural Technology did not fare aswell as the trade-based certificate holders. Of the 13 diploma graduates, near to 70 per centare in employment with the rest seeking work. Of the 11 carpenters with a trade certificate,eight are employed, and three are looking for work. Twelve of the 13 holders of TradeCertificate In Electrical Engineering are employed, with one undertaking further study. Thelatter have benefited from having employment as part of their training arrangements. Asimilar arrangement is needed for the diploma students.
Weak employment outcomes
A number of training programs have employment outcomes which are weak. The certificatein information technology has only a one-in-five employment rate, with over a third lookingfor work and near to half going onto further study. These results strongly suggest that thecertificate level training program is not providing its graduates with the skills needed to hold ajob related to information technology.
The employment rate for the diploma graduates of information technology is better at near totwo-in-three. However, nearly one-in-four graduates are looking for work. A closerconnection with workplaces during training may reduce this level of unemployed diploma

5 March 2013 - Final 32 of 122
graduates. However, it needs to be noted that there are only 126 jobs for ‘Information andcommunications technology operations and user support technicians’ so the number ofopportunities to find work is low, given that the replacement demand is low.
Few graduates of the certificate in secretarial studies have found paid work. Only one-in-threeare employed, and half of the graduates are looking for work. This may be due to the lack ofjobs for secretaries. More likely, employers may prefer graduates with higher qualificationssuch as a diploma in business. The holders of diplomas in business studies have a seven-in-tenemployment rate. There are 204 administrative and specialised secretaries at the associateprofessional level and 255 general secretaries at the clerical level. This relatively smallnumber of just under 460 suggests that replacement demand would be lower than the numberof graduates at certificate and diploma levels seeking work as secretaries.
The two qualifications aimed at employers in hospitality and tourism also have weakemployment outcomes. Less than half (45 per cent) of the certificate holders in cooking andhospitality are in paid work and over half are looking for work. The census shows that thereare only 239 cooks and up to 93 chefs so a large number of graduates in cooking will havetrouble finding work. The same picture holds for the diploma graduates in tourism &management with 47 per cent employed and 50 per cent looking for work. These pooremployment outcomes could be due to a number of factors. One factor could be the downturnin the industry after 2008. There are 98 hotel and restaurant managers so the number ofvacancies for managements positions will be low.
In relation to the certificate in commercial cooking, the skill levels and range of experienceoffered by the course may be below what employers are looking for. Competencies based oninternational standards may be one element of what is needed. Another could be apprentice-type employment and training to provide more extensive opportunities for learning on-the-job. Thirdly, work placements in overseas resorts in Fiji, New Zealand or Australia may beneeded to enable graduates to cook for demanding international tourists. Similarly, theDiploma in Tourism & Management may not have enough opportunities for students to learnon-the-job.
The employment outcomes of graduates with maritime qualifications are also weak with up toa half of graduates looking for work. The absence of an employment service which can collectinformation on job vacancies in the domestic maritime sector may be one contributor to thissituation. Another factor is the low number of positions available. The census records only140 ship and aircraft controllers and technicians.
Conclusion
This chapter has highlighted the range and extent of the supply of middle-level skills trainingin Tonga. The absence of comprehensive data on student enrolments and the number ofgraduates for each qualification has made it difficult to provide the exact numbers. Theemployment outcomes reported for these qualifications show how, in some instances, closeties with employers are part of the training arrangements. However in other cases, the linkswith employers are weak or non-existent. This is shown by the poor employment outcomesfor a number of qualifications. The training providers of qualifications in informationtechnology, secretarial studies, and cooking and hospitality in particular have to look moreclosely at why their graduates are not doing much better in the labour market.

5 March 2013 - Final 33 of 122
Annex 2.1
Tables A2.1 to A2.6: Overall primary and secondary enrolments, Tonga, 2009to 2011
Overall Primary Enrolments 2009 Overall Secondary Enrolments 2009Class 1 2,857 Form 1 2,612Class 2 2,761 Form 2 2,455Class 3 2,789 Form 3 2,413Class 4 2,671 Form 4 2,500Class 5 2,644 Form 5 2,499Class 6 2,977 Lower 5th 170IE 20 Vocational 179Total 16,719 Form 6 1,533
Form 7 315Total 14,676
Overall Primary Enrolments 2010 Overall Secondary Enrolments 2010Class 1 2,850 Form 1 2,666Class 2 2,786 Form 2 2,665Class 3 2,701 Form 3 2,385Class 4 2,735 Form 4 2,321Class 5 2,605 Form 5 2,683Class 6 3,138 Lower 5th 157Inclusive 24 Form 6 1,513Not stated 9 Form 7 387Total 16,848 Total 14,777
Overall Primary Enrolments 2011 Overall Secondary Enrolments 2011Class 1 2,875 Form 1 2,163Class 2 2,764 Form 2 2,212Class 3 2,724 Form 3 2,023Class 4 2,628 Form 4 1,787Class 5 2,645 Form 5 2,251Class 6 3,181 Lower 5th 48Inclusive 21 Form 6 1,604Not stated 195 Form 7 618Total 17,033 Hospitality 18
Vocational 169Commerce 32Unstated 1,949Total 14,874
Source: Ministry of Education and Training

5 March 2013 - Final 34 of 122
Table A2.7: Post-secondary training providers, field of study, level, duration,sector, enrolments and graduate numbers, 2011 & 2012, where available
Institution Course LevelDuration
Industrysector
Student intake GraduatesSeme-sters
years 2011 2012 2011 2012
St Joseph'sBusinessCollege
Secretarial Studies Cert 4 4 2 Business 28 46
MontfortTechnicalInstitute
Automotive Trade Cert 4 4 2Automotiverepair
2714
Building Carpentry Cert 4 4 2 Construction 16
AhopaniloloTechnicalCollege
Commercial Cookery& CateringOperations
Cert 4 4 2 Tourism 90 32
Tonga Instituteof HigherEducation
Accounting Cert&Dip
2 to 41 to
2yrs
All sectors 26 21 45Information Systems Cert&Dip All sectors 42 6 26Computer Science Cert&Dip All sectors 17 9 23Media & Journalism Cert&Dip Media 5 5 8
Tonga Instituteof Science andTechnology
Carpentry and Joinery Cert 4 Construction 32 18 8 11
General Engineering Cert 4 Construction n/a 17 7 4
Auto Mechanics Cert 4 Auto repair 28 33 13 29
Electrical Electronics Cert 4 Electricity 26 36 11 6Panel Beating andSpray Painting
Cert 4 Auto repair 2212
n/a 9
NationalCentre forVocationalStudies
Tourism Mgt Diploma 2 Tourism 14
Int'l Business Diploma 2 All sectors 19
Info Tech Diploma 2 All sectors 20 18Agriculture ? ? ? ? ? ?

5 March 2013 - Final 35 of 122
Table A2.7 (continued): Post-secondary training providers, field of study,level, duration, sector, enrolments and graduate numbers, 2011 & 2012, whereavailable
Institution Course LevelDuration Industry
sector
Student intake GraduatesSeme-sters
years 2011 2012 2011 2012
TupouTertiaryInstitute
Diploma Business Diploma All sectors 149 48Certificate in InformationTechnology
Cert All sectors28
15
Diploma in InformationTechnology
L5 All sectors51
11
Diploma in InformationTechnology
L6 All sectors44
6
National Certificate inComputing
NCC All sectors15
4
Diploma of Construction(L5)
L5 Construction20
National Diploma inArchitectural Technology
L6 Construction23
14
Certificate in OfficeAdministration andComputing (Advanced)
L3 All sectors16
8
Certificate in OfficeAdministration andComputing (Intermediate)
TSY1 All sectors
26
20
Bachelor in InformationTechnology
All sectors 3
Diploma in Teaching Education 40 7
QueenSaloteSchool ofNursing
Diploma in Nursing L5 6 3 Nursing 31 40 27 32
Advance Diploma inNursing Practice (Non-Communicable DiseaseNursing)
2 1 Nursing 0 0 0 0
Advance Diploma inNursing Practice(Midwifery)
2 1 Nursing 0 0 0 15
Post-basic Nursing inCritical Care
1 Nursing 0 0 0 0
Unuaki ‘oTongaRoyalUniversityofTechnology/Institute
Certificates in Tourism andHospitality
L1-L4 2 151

5 March 2013 - Final 36 of 122
Table A2.8: Field of study, level, graduate numbers, 2011 & 2012, whereavailable
Field of Study Level 2011 2012
Office skills
Secretarial Studies Cert 4 46
Diploma Business Diploma 48
Certificate in Office Administration andComputing (Advanced)
L3 8
Certificate in Office Administration andComputing (Intermediate) TSY1 20
Total 46 76
Automotive Trades
Automotive Trade Cert 4 14
Auto Mechanics Cert 4 13 29
Panel Beating and Spray Painting Cert 4 n/a 9
Building Carpentry Cert 4 16
Total 38
HospitalityCommercial Cookery & CateringOperations
Cert 4 32
Tourism Mgt 14
Certificates in Tourism and Hospitality 151Total 197
Accounting
Accounting Cert&Dip 21 45
Information Technology
Information Systems Cert&Dip 6 26Computer Science Cert&Dip 9 23
Info Tech Diploma 18
Certificate in Information Technology Cert 15
Diploma in Information Technology L5 11
Diploma in Information Technology L6 6
National Certificate in Computing NCC 4
Bachelor in Information Technology 3Total 33 88

5 March 2013 - Final 37 of 122
Table A2.8 (continued): Field of study, level, graduate numbers, 2011 & 2012,where available
Field of Study Level 2011 2012
Construction
Building Carpentry Cert 4 16
Carpentry and Joinery Cert 4 8 11
Electrical Electronics Cert 4 11 6Diploma of Construction (L5) L5National Diploma in ArchitecturalTechnology
L6 14
General Engineering Cert 4 7 4Total 42 35
Nursing
Diploma in Nursing L5 27 32
Advance Diploma in Nursing Practice(Non-Communicable Disease Nursing)
0 0
Advance Diploma in Nursing Practice(Midwifery)
0 15
Post-basic Nursing in Critical Care 0 0
Total 27 47
Other
Media & Journalism 5 8
Diploma in Teaching 7
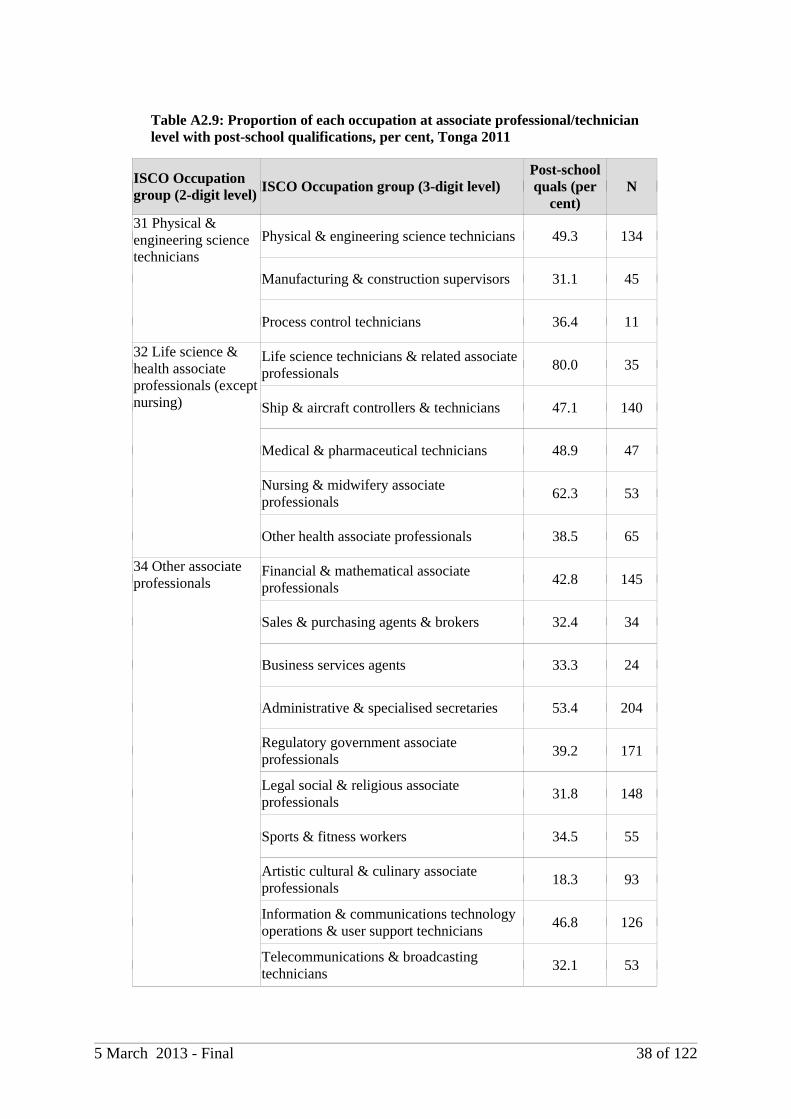
5 March 2013 - Final 38 of 122
Table A2.9: Proportion of each occupation at associate professional/technicianlevel with post-school qualifications, per cent, Tonga 2011
ISCO Occupationgroup (2-digit level) ISCO Occupation group (3-digit level)
Post-schoolquals (per
cent)N
31 Physical &engineering sciencetechnicians
Physical & engineering science technicians 49.3 134
Manufacturing & construction supervisors 31.1 45
Process control technicians 36.4 11
32 Life science &health associateprofessionals (exceptnursing)
Life science technicians & related associateprofessionals
80.0 35
Ship & aircraft controllers & technicians 47.1 140
Medical & pharmaceutical technicians 48.9 47
Nursing & midwifery associateprofessionals
62.3 53
Other health associate professionals 38.5 65
34 Other associateprofessionals
Financial & mathematical associateprofessionals
42.8 145
Sales & purchasing agents & brokers 32.4 34
Business services agents 33.3 24
Administrative & specialised secretaries 53.4 204
Regulatory government associateprofessionals
39.2 171
Legal social & religious associateprofessionals
31.8 148
Sports & fitness workers 34.5 55
Artistic cultural & culinary associateprofessionals
18.3 93
Information & communications technologyoperations & user support technicians
46.8 126
Telecommunications & broadcastingtechnicians
32.1 53

5 March 2013 - Final 39 of 122
Table A2.10: Proportion of each occupation at craft/trade level with post-school qualifications, per cent, Tonga 2011
ISCO Occupationgroup (2-digit level) ISCO Occupation group (3-digit level)
Post-schoolquals (per
cent)N
71 Extraction &building tradeworkers
Building frame & related trades workers 6.3 1201
Building finishers & related trades workers 18.2 143
Painters, building structure cleaners &related trades workers
16.4 67
72 Metal machinery& related workers
Sheet & structural metal workers moulders& welders & related workers
25.0 32
Machinery mechanics & repairers 17.8 409
73 Precisionhandicrafts, printing& related workers
Handicraft workers 2.0 7271
Printing trades workers 17.6 34
Electrical equipment installers & repairers 31.6 152
Electronics & telecommunications installers& repairers
39.2 51
Food processing & related trades workers 8.3 169
Wood treaters cabinet-makers & relatedtrades workers
6.7 15
Garment & related trades workers 9.4 85
74 Other craft &related tradesworkers
Other craft & related workers 0.0 9

5 March 2013 - Final 40 of 122
Table A2.11 : Current employment status of graduates of post-secondarytraining providers by age, per cent, Tonga Graduate Tracer Survey 2011
Agegroup
EmployedActivelylookingfor work
Notemployed& notactivelylookingfor work
TOTAL N
15-19 29.7 37.8 32.4 100 37
20-24 51.4 30.7 17.9 100 463
25-29 75.8 15.7 8.5 100 293
35+ 87.8 7.0 5.2 100 115

5 March 2013 - Final 41 of 122
Annex 2.2
Tonga Graduate Tracer Survey 2011 employment outcomes
A tracer survey of the 2007-2010 graduates from Tongan post-secondary institutions wasconducted in March/April 2011 by the Ministry of Training, Employment, Youth & Sports(MoTEYS), and funded through the Tonga TVET Strengthening Program (TSP1).28 Elevenpost-secondary institutions were asked to participate in the survey through providing lists oftheir graduates from 2007-2010 together with their contact details. The survey gatheredinformation on 908 graduates over four years, ranging from 170 in 2007 to 313 in 2010.
According to information from the post-secondary institutes, the total number of graduatesthey produced in the year 2007 to 2010 was 2,102. Some 1,300 former students who hadgraduated were located by contacting friends, relatives and classmates, and neighbours. Somewere found on Internet, via bebo and other social networks. Finding the location of 1,300graduates represents a follow-up rate of 62 per cent. However, the base number of graduatesprovided by the training providers was also found to be inaccurate due to a number ofduplicated names. So the actual follow-up rate is higher than the 62 per cent.
Of the 1,300 located, some 143 were resident in the islands other than Tongatapu and werenot able to be interviewed. Another 252 of those located were resident overseas. Theseincluded 147 resident in New Zealand, 45 in Australia, 18 in the USA, 15 in Fiji and 27elsewhere (China, Japan, Philippines, Niue, Tokelau and Ha’amoa).
Results
The employment outcomes for graduates of post-secondary qualifications in twelve fields ofstudy between 2007 and 2010 can be identified. These are: Agriculture, Accounting,Automotive, Business, Construction, Education, Hospitality & Tourism, IT, Maritime, Media& Journalism, Nursing and Secretarial Studies. Achieving an employment outcome is of lessvalue to the graduate if it is not matched to the skill area in which he or she has trained.Overall, assessment of the field of study compared with the title of the job and name of theemployer showed a closer match than expected: 88 per cent of graduates were in jobs thatwere related to or consistent with the field of study of their qualification. However, the extentof the skills match for job holders varied greatly between qualifications.
The employment outcomes reported below do not take into account the age of the graduate,and how long she or he has been looking for work. As Table shows A2.9, the age of thegraduate has a strong effect on whether he or she is employed or not. However, the results doshow which qualifications are meeting the demand for these skills in the labour market.Holders of the Diploma of Nursing, for example, have a 98 per cent employment outcome. Onthe other hand, just less than half (46 per cent) of those with a certificate of hospitality andcooking were in paid work.
The results do not show whether the graduate is already employed before he or she undertooktheir training and whether they are still with their same employer. So the results reported
28 I am grateful to Mrs Fatai Soakai, Ministry of Training, Employment, Youth & Sports (MoTEYS) for her helpin giving me full access to the data and helpful background information.

5 March 2013 - Final 42 of 122
below do not show the net employment outcome of each qualification, only the currentemployment status of the qualification holder. However, most graduates are likely to havegone directly from secondary school to their post-secondary training program, and so few ofthe graduates are likely to have been already employed same field.
Agriculture
Fifteen respondents indicated that they had obtained a qualification in Agriculture. Of these13 had obtained a diploma and two a certificate. Those with a diploma had an employmentrate of 92 per cent with the remainder actively looking for work. Both certificate holders werenot employed and looking for work. Two-thirds of the job holders were in jobs that matchedtheir field of study.
Field of Study Qualification EmployedLookingfor work
Total N
Agriculture Diploma 92.3 7.7 100 13
Accounting
Sixty-one respondents reported that they had a qualification in Accounting. Of these 29 hadobtained a certificate and 32 a diploma. Those with a certificate had an employment rate of 79per cent with 10 per cent looking for work and 10 per cent undertaking further study. Threequarters of the diploma holders were in employment, 22 per cent were looking for work and 3per cent were undertaking further study. Most of the jobs of the graduates in accountingmatched their field of study. The skills match is 91 per cent for certificate holders and 95 percent for graduates with a diploma.
Field of Study Qualification EmployedLookingfor work
Furtherstudy
Total N
AccountingCertificate 79.3 10.3 10.3 100 29
Diploma 75.0 21.9 3.1 100 32
Automotive
Twenty-two respondents had undertaken a qualification related to automotive maintenanceand repair. Ten had gained a Trade Certificate in Automotive Mechanics from TIST (TongaInstitute in Science & Technology). This training took place over a three or four-year period,combining formal classroom instruction with an extended work placement or employment.Nine of the ten holders of the Trade Certificate in Automotive Mechanics were in paid work.TIST also offers a Trade Certificate in Panel Beating and Spray Painting. Three graduates ofthis certificate responded and all were employed.
Nine of the ten were employed, and one is unemployed. Montfort Technical Institute offers atwo-year Certificate in Motor Vehicle Mechanic & Automotive Technology. Nine graduatesof this certificate responded, 6 were in employment and three were looking for work. Thefollowing table combines the three certificates to provide a more statistically robust samplesize. Of those with formal jobs, half of the job titles matched the field of study. Four werealso self-employed or running their own business, and it can be assumed that they were usingthe skills they had acquired.

5 March 2013 - Final 43 of 122
Field of Study Qualification EmployedLooking for
workTotal N
Automotive Certificate 81.8 18.2 100 22
Business
Eighty graduates of business-related qualifications responded to the survey. Thesequalifications and the number of graduates were: nine with a Diploma In InternationalBusiness (National Centre for Vocational Studies), 57 with a Diploma in Business and 14with a Diploma in Business Management (both Tupou Technical Institute). All of thegraduates in the Diploma In International Business (National Centre for Vocational Studies)are in employment. Nearly two-thirds (65 per cent) of the graduates of the Diploma ofBusiness and four-out-of-five (79 per cent) of the Diploma of business Management are inwork. The following table reports the three qualifications together. The overall skills match tocurrent job is high (93 per cent).
Field ofStudy Qualification Employed
Looking forwork
Furtherstudy Other Total N
Business Diploma 71.3 22.5 5.0 1.3 100 80
Construction
Forty-four respondents to the tracer survey had qualified in a field of study related toconstruction. It is likely that this industry is under-represented in the survey for some reason.In relation to the highest qualification, the Diploma in Construction & ArchitecturalTechnology, of the 13 graduates, near to 70 per cent are in employment with the rest seekingwork. Of the 11 carpenters with a trade certificate, eight are employed, and three are lookingfor work. Twelve of the 13 holders of Trade Certificate In Electrical Engineering areemployed, with one undertaking further study. The other trade certificate holders, mostly ingeneral engineering are too few in number to report.
The overall employment outcome for the construction industry is four- out-of-five employed,with one-in-five looking for work. The skills match to job is high (89 per cent).
Field of Study QualificationEm-
ployedLookingfor work
Furtherstudy
Total N
ConstructionDiploma &certificates
79.5 18.2 2.3 100 44
Education
Most of the holders of a diploma of teaching from the Tonga Institute of Education areemployed, with 8 per cent looking for work. The match of the field of study to the job held ishigh (94 per cent). This may be due to the close connection to potential employers through the12 months work placement that graduates are required to take to qualify as a teacher.
Field of Study Qualification EmployedLooking for
workFurther study Other N Total
Education Diploma 89.4 7.7 1.9 1.0 104 100

5 March 2013 - Final 44 of 122
Hospitality & Tourism
The Certificate in Hospitality and Cooking from Ahopanilolo Technical College onlyachieved near to half in employment (45 per cent), and over half looking for work (53 percent). The Diploma in Tourism & Management from the National Centre for VocationalStudies achieved much the same employment outcome. The skills match to the jobs held isreasonably high (78 per cent).
Field of Study Qualification EmployedLookingfor work
Study Other Total N
Cooking &hospitality
Certificate 44.7 52.6 2.6 100 38
Tourism &management
Diploma 47.1 50.0 2.9 100 34
Information Technology
Information technology is a popular field of study. However, the employment outcomes forthis set of skills are not high. This applies particularly to the Certificate in InformationTechnology. The respondents have listed both the Tupou Tertiary Institute and TongaInstitute for Higher Education as the institution where they undertook the certificate. Onlyless than one-in-five are in paid work and a third (37 per cent) are looking for work. However,the proportion in further study is the highest of any course, indicating that certificate holdershave used the qualification as a stepping stone to further study, most likely in informationtechnology.
The holders of a Diploma in Information Technology have fared much better with nearly twoout-of-three in paid work. Nevertheless near to one-in-four graduates are looking for work,and small numbers are undertaking further study or are in unpaid work. Of the certificateholders, four out of five (81 per cent) were in jobs linked to information technology. A similarskills match applied to the jobs held by the diploma graduates (83 per cent).
Field of Study Qualification EmployedLooking for
workStudy Other Total N
InformationTechnology
Certificate 18.3 36.7 43.3 1.7 100 60
Diploma 63.2 23.2 7.4 6.7 100 89
Maritime
Some 119 respondents had obtained a qualification from the Tonga Maritime PolytechnicInstitute (TMPI). These qualifications included Certificate Maritime; Certificate in FireFighting, and Certificate in Safety, Certificate Watch keeper & Deck Rating; EngineerClasses, 3, 4 & 5; and Class 4 & 5 Master. These certificates have been grouped into threetypes to provide a large enough sample size to provide a more stable set of results. Half of theholders of certificates in maritime, firefighting and safety are employed (55 per cent).However, there are major differences between certificates suggesting that in the case offirefighting, that existing employees did the training course.
In the case of the other two sets of qualifications, the employment outcomes are almost thesame: three-out-five (62 per cent) are in employment and one-in-three are looking for work.

5 March 2013 - Final 45 of 122
The overall skills match to job is high at 84 per cent.
Qualification & Field of Study EmployedLookingfor work
Study Other Total N
Certificates in maritime, firefighting andsafety
55.0 45.0 0.0 0.0 100 20
Certificate In Watchkeeper & Deck Rating 61.7 34.0 4.3 0.0 100 47
Engineer or Master 61.5 34.6 1.9 1.9 100 52
Media & Journalism
For the Diploma in Media & Journalism, of the eight graduates, seven have found work andone is looking for work. All graduates in paid work were in jobs matched to their field ofstudy.
Nursing
The employment outcomes achieved by the graduates of the Queen Salote School of Nursinghave by far the best employment outcomes of all post-secondary institutions. As many as 51of the 52 nurses surveyed were in paid employment. All of the job holders were in a jobrelated to nursing. As with teachers, this may be due to the close connection to potentialemployers through the 12 months work placement that graduates are required to take toqualify as a nurse.
Field of Study Qualification EmployedLookingfor work
Total N
Nursing Diploma 98.1 1.9 100 52
Secretarial Studies
Two institutions produced graduates with Certificates in Secretarial Studies: St. Joseph'sBusiness College and the Tupou Tertiary Institute. Their combined results are shown below.Only just over one in three (36 per cent) had found paid work and half (49 per cent) werelooking for work. The graduates of the certificate course from St. Joseph's Business Collegeachieved a better employment outcome than those from the Tupou Tertiary Institute, withtwo-in-five graduates in paid work compared with just under one-in-five. However the reasonfor this difference is that three in five graduates of the Tupou Tertiary Institute went ontofurther study. Nearly all of the job holders were in jobs related to their field of study (96 percent).
Field of Study Qualification EmployedLookingfor work
Study Other Total N
SecretarialStudies
Certificate 36.2 48.5 10.8 4.9 100 130

5 March 2013 - Final 46 of 122
Chapter Three: Domestic Demand for Middle-Level Skills
The calibre of the majority of our workforce is very poor and their attitudeto work is also disappointing. We, as a country, have a responsibility and alot of work to do to improve the current situation (Rural employer of 27workers who expanded his workforce in the previous 12 months).
Many employers in Tonga in 2012 find it hard to recruit workers with the skills they need intheir business. Over half (57 per cent) of all employers surveyed in 2012 said it was hard orvery hard for them to recruit workers with the skills they need. For enterprises that hadincreased their workforce in the last 12 months, the proportion saying they hard to recruitworkers with the skills they need was higher at 63 per cent of employers.
Being unable to recruit new workers with the right skills is only part of the skills deficiencyemployers face. Many employers face a skills gap in their existing workforce. Employerswere also asked whether their existing workers have the skills to do their job? Three-in-tenemployers (29 per cent) said that only some of their workers have the skills to do their job.Another two-in-five (38 per cent) said most of their workers have the skills needed to do theirjob. Only a third of employers could say that all of their workers have the skills to do theirjob.
How important are skill shortages and workforce skills gaps compared with other issuesfacing businesses? Employers rated ‘finding skilled workers’ as the most important issue theirbusiness faces (see Table 3.1). It shared equal importance with government regulations. Thethird issue they rated as the most important facing their business was ‘the lack of good workhabits among our workers’. Employers rated skills shortages and skills gaps in theirworkforce slightly above the state of the roads, business permits, and the electricity supply.They rated as less important issues: the tax system, access to credit or finance, and problemswith suppliers. The least important issue employers faced was the cost of foreign workers.
The context
The World Bank conducted an enterprise survey in Tonga in 2009.29 The representativesample is of 150 private sector enterprises, not in agriculture and located in Tongatapu. Fourout five were domestically owned. Two-thirds had women participating in the ownership ofthe firms. Most (87 per cent) of the private sector firms surveyed had less than 20 employees(average 7.3 permanent employees). The remaining firms surveyed have an average of 23.1permanent employees.
29 The surveys, conducted in over 225 countries, are based on a representative sample of firms in the non-agricultural formal private economy. The sample size for Tonga is 150, with 54 from manufacturing, 64 fromretail and 32 from other services. The sample includes the entire manufacturing sector, the services sector, andthe transportation and construction sectors. Excluded are public utilities, government services, health care, andfinancial services sectors.

5 March 2013 - Final 47 of 122
The graphic above shows that it is the firms in the services sector that are much more likely tosay that an inadequately educated workforce is a major constraint. It is worth noting that nofirms in the services sector report that they offer any formal training and only just over one-in-ten (13 per cent) of firms in manufacturing say they provide formal training for theiremployees.
A feature of the World Bank’s Enterprise Surveys is the capacity to compare the results forcountries in the same region or wider afield. This comparison shows that the proportion offirms in Tonga offering formal training is much lower than in other neighbouring countries.Only one-in-ten Tonga firms provide training compared with four-out-of-five (79 cent) inSamoa, three-in-five in Fiji (61 per cent) and one-in-two (48 per cent) in Vanuatu.30
Figure 2: Per cent of private sector firms in Tonga, Samoa & Fiji, offeringformal training, 2009
61.0
79.1
11.1
0.0 20.0 40.0 60.0 80.0 100.0
Fiji
Samoa
Tonga
Source: Enterprise Surveys (www.enterprisesurveys.org), The World Bank.
Other important survey results which reinforce this picture are the low proportion of firms inTonga that are exporters. Tonga has only one-in-twenty (5 per cent) firms which exportdirectly or indirectly at least one per cent of their sales. This compares with Fiji and Samoa
30 The data from the enterprise surveys are sourced from the custom query facility at Enterprise Surveys(www.enterprisesurveys.org), The World Bank.

5 March 2013 - Final 48 of 122
where one in five (19 per cent) and one-in-four (26 per cent) respectively are exporters, usingthe same definition.
An export orientation often provides the incentive for enterprises to invest in training for theirworkforce. One form this export focus takes is for an enterprise is to obtain an internationalquality certification. In Tonga, less than one-in-ten (8 per cent) of firms have aninternationally recognised quality certification, compared with one one-in-five (23 per cent)in Fiji and nearly one-in-three (31 per cent) in Samoa. This low export focus helps explainwhy so few enterprises in Tonga in 2009 had a website, compared with neighbouringcountries. Little more than one in twenty (7 per cent) of Tongan firms in 2009 had a website,compared with one-in-three in both Fiji and Samoa.
These results show that private sector firms in Tonga are much less likely to invest in trainingtheir workers compared with other countries in the region and point to some of the reasonswhy. At the same time, most firms are not happy with the skills of their workforce. These twoconclusions indicate that many firms in Tonga operate with what they see as a low skills base,but they do not have the resources or capacity to change the situation.
What types of skills are needed by employers
The Enterprise Skills Needs Survey 2012 asked employers to say what specific and generalskills they needed. Multiple responses were encouraged, and 265 replies were received aboutthe general skills needed by employees.
Types of generic skills needs
Employers, in addition to technical skills, are seeking a range of general skills which includeboth cognitive and social skills. One employer highlighted the importance of these skills bystating:
When recruiting we look mainly for attitude, work ethic & honesty. We cantrain anyone who has the right attitude. Often we struggle to find applicantsthat truly understand a business environment & the expectations we have.
Cognitive or thinking skills
The cognitive or thinking skills they are seeking are spoken English, basic computer skills,numerical skills, and how to solve problems. The ability to speak English is also includedhere as a basic cognitive skill because the language of instruction in the school system afterGrade 4 is English.
The words employers use to describe the cognitive skills they are seeking are: ‘basic Englishgrammar, spelling etc’; ‘English communication’; ‘speak confidently to foreigners’; the needto be ‘bilingual - fluent; and communication in English’. The references to computer skillsincluded the following: ‘computer skills’; ‘lack of basic computer and analytical skills’;‘computer skills are now important’; ‘computer literacy’; ‘IT skills’; ‘can use computer’;‘sound computer skills’, ‘lack IT knowledge’; ‘computer literate skills’ and ‘computing skills(basic)’.
The numerical skills required were described in the terms: ‘money handling’; ‘solve

5 March 2013 - Final 49 of 122
mathematical problems quickly and accurately to avoid costly mistakes’; ‘working accountingskills’; ‘financial skills’; ‘math’; and ‘numerical skills’.
Problem-solving skills are described in the following terms: ‘maintaining vehicle they use forwork’; ‘unable to problem solve due to lack of life experience’; ‘reporting your failures’;‘solving conflicts in the workplace’; ‘cut and shape material and be able to join themtogether’; ‘ability to apply knowledge to an application’; ‘training skills’; an ‘ability to learn’;and the ‘ability to see small details’.
Behavioural and social skills
Employers expect an employee to have a range of behavioural and social skills. They aredescribed in the following terms: ‘attentive’; ‘attitude’; ‘commitment to the task given;‘commitment-productivity misunderstanding’; ‘consistency in effort and application of theskills’; ‘dependability (lack of commitment)’; ‘good work ethics’; ‘honesty’; ‘hygiene’;‘initiative’; ‘personality’; ‘punctuality’; ‘safety’; ‘values/core beliefs’; and ‘willingness towork & work hard’.
Many employers referred to the need for customer service skills. In some cases, specificdetails are given. These included: ‘closing the sale - selling skills’; ‘building better/closerelationship with customers’; ‘follow-up with customers’; ‘service standards’; and ‘customerservice skills, marketing skills’. One detailed comment offered was: ‘Tour guides with abilityto connect well with customers (Excellent social & customer service skills)’.
The personal skills related to time management and ability to set priorities are important.These are described in the following terms: ‘being on time’; ‘able to organise work & setpriorities’; ‘management skills’; ‘unable to meet deadlines’; ‘absent too much and forunnecessary [reasons]’; ‘not coming to work on time’; ‘select material, [able to] plansequences and method of work’; ‘knowing what next to do when doing a job’; ‘supervisionand follow-up’; ‘to think long-term (planning)’; ‘on-time performance’; ‘time frames’;‘scheduling’; ‘time management’; ‘work on time’; ‘basic administrative skills’; ‘office skills’;and able to ‘prioritise’.
Specific comments that refer to communication skills are: ‘unable to communicate openly’;‘basic understanding of Tongan words & proper grammar & meaning’; ‘clearcommunication’; ‘writing skills and writing reports’. One extended comment highlighted theissue of cultural barriers to communication:
How & Why to speak with your Manager. Due to cultural hierarchy it isvery difficult to discuss business with the staff except in a top-down, non-inclusive way.
The need for employees to exercise leadership or to take responsibility is referred to in thefollowing terms: ‘leadership skills’, ‘able to work unsupervised’, ‘supervisory role skills’;‘coaching skills’, ‘operating machinery safely’; ‘ability to take on responsibility’; and‘working under no supervision’. Teamwork is also a key social skill. This is referred to in thefollowing words: ‘team player skills’; ‘team work’; ‘team work and coordination’; and‘working in harmony together’. The lack of these behavioural and social skills indicates thatnew recruits do have enough opportunities to acquire relevant work experience, and inparticular of workplaces operating under pressure to perform.

5 March 2013 - Final 50 of 122
Technical skills in current demand
Table A3.3 lists the skill needs of employers in November 2012. This table is based on theresponses of employers with current job vacancies and their responses to the question aboutsets of skills their business find hardest to recruit. Businesses with a large number ofvacancies may be state-owned enterprises which are waiting for the government delay onrecruitment to be lifted at the end of 2012.
1. Agriculture, forestry, and fishing
The enterprises surveyed in this sector are engaged in the following activities: forestry andtimber production involving tree felling and sawmilling; the management of fisheries; deepsea fishing and the export & processing of vanilla & agricultural products.
The skill needs of the three forestry and timber producers with 130 employees in total are forskills specific to the forestry & timber industries. These are specified as: tree cutting skills -felling; bulldozer drivers; other heavy machine operators; chainsaw repairers; and skilledmechanics to maintain heavy machinery. A number of managerial roles are performed byforeign workers.
In relation to a deep sea fishing venture with 26 employees, the specific skill needs are:seamanship, chef, and accountant. The general skill needs are ‘worker's commitment;worker's reliability; and worker's attitude’.
For the processor and exporter of vanilla & other agricultural products, the skill needs are:vanilla pollination and vanilla drying. For a trading company engaged in agriculture andquarrying with 27 employees, the skill needs are: Qualified and competent workers for theoffice; need for IT knowledge; and need for qualified tradesmen/women to maintainmachines.
2. Mining
A rural-based enterprise producing quarry supplies had skills needs which are more genericthan specific. The specific skills requested are: heavy equipment operators, and able to doconcrete work. Generic skills sought are: supervisory experience, able to take an inventory,directing customers; writing reports; money handling; correctly filing documents, andscheduling.
A mineral exploration enterprise involved in offshore work wanted specific skills in geology,environmental science, or in geophysics but noted that they are seeking people with relevantexperience in their type of work so they can train them on the job.
3. Manufacturing
The range of manufacturing activities undertaken by the enterprises surveyed are as follows:art & crafts; cabinet-making & joinery-furniture; manufacturing & food processing; meatprocessing/wholesale/retail; tobacco distribution; manufacture of house paints & distributionof marine paints; retail & wholesale of paint & related items; and the production ofhandicrafts.

5 March 2013 - Final 51 of 122
In relation to the producers of arts and crafts, the following specific skills are sought: salesperson; handicraft producers (who are mostly trained in-house); and a Web designer. Thegeneral skills sought are: communication skills; creativity; display art & crafts skills; need tomeet deadlines; and quality control. As noted above, few firms in Tonga had a website in2009. This low usage of the Internet to market their business is reflected in the fact that onlyone respondent enterprise identified web designer as a skill they needed.
The specific skills wanted are technical or trade based: cabinet making & joinery; skilledtechnicians (machine operators that can fix their machine); food processing skills; andbutchery skill. However, some requested skills are normally learnt on-the-job: such as theskill of packing cigarettes; knowledge of products & how to sell; and understanding painttechnology, paint making & colour mixing.
Moreover, a number of the skills identified are not task specific but generic: such asnumerical skills; [need to get to] work on time; absenteeism of staff; ‘problem of [worker]attitude towards the job & sincerity’; ‘there is no urge to excel or do the job right and feelproud for it’. Other generic skills wanted by manufacturing employers were: ‘commitmentand understanding of productivity; computer skills; middle management training &leadership; ability to apply knowledge to an application; unable to communicate openly, workperformance; customer service; food safety; operating machinery safely; marketing;management skills; accounting skills; speaking English; and an ability to learn.
4. Electricity, gas, steam and air conditioning supply
The activities of the three enterprises interviewed from this sector included: sole supplier &distributor of electricity in Tonga; an electrical contractor and retailer, and a provider ofrefrigeration & air conditioning services.
The main technical skills needed by Tonga Power are: general maintenance & repairtechnicians; electrical linesmen; specific skills gaps for engineers; project engineer; systemcontrollers; and project manager. The general skills wanted were: a background in electricalengineering; computer and writing skills.
An electrical contractor wanted electricians with ‘overseas electrical skills’. Englishcommunication was stated as the only generic skill wanted. The supplier of refrigeration & airconditioning services simply said they wanted ‘technical skills’.
5. Water supply; sewerage, waste management activities
Three enterprises in the sector of water supply; sewerage, waste management activitiesprovided information on their skill needs. The technical skills they need are: plumbing worksskills and mechanical skills. Also mentioned is the need for workers to have ‘computerliterate skills’, ‘customer service skills’; and ‘supervising and management skills’. The jobs oftwo foreign workers are described as ‘operator at the landfill’ and ‘supervisor’.
A waste management operator specialising in the removal of solid and liquid waste and itsdisposal did not mention the need for any technical skills. However, a supervisor highlightedthe need for the following generic skills: honesty & reliability (work ethics); safe drivinghabits;maintaining vehicle they use for work; reporting your failures; and safety in theworkplace.

5 March 2013 - Final 52 of 122
6. Construction
Ten construction firms responded to the survey. Their average number of employees was 29,with a range from 10 to 49 employees.
A major issue for the construction firms is the lack of staff with formal qualifications. The2011 census data shows that only one-in-twenty (6 per cent) of the largest group ofconstruction workers has a post-school qualification. For a smaller number of workersinvolving in finishing work such as tiling, finishing wall surfaces and plastering, only lessthan one-in-twenty (18 per cent) has a post-school qualification. This problem is highlightedby one response which said: ‘Quality is lacking not skills’. Other related comments onspecific skills needs are: [the need for] ‘people with formal qualifications’; ‘qualifiedtradesmen’ and ‘skilled labour’.
There is a demand for carpenters and plumbers, with each occupation mentioned four times.The need for finishing skills was also strong. These included: wiring, finishing wall surfaces,plastering, painting, and tiling. Supervisory skills are also needed: in the roles of foremen,leading hands and supervisors. Middle management skills were also needed. Specific skillneeds mentioned are: quantity surveyor, able to use Quickbooks accounting software andAuto-CAD software.
Another indicator of skills demand is the jobs held by foreign workers. Construction firmsprovided information about the following foreign workers’ occupations: electrician;security/fire system; supervisor; vinyl layer; manager; supervisor; site superintendent;welders; leading foreman and tiling work (temporary).
The most important generic skills needed relate to being able to ‘work unsupervised’ or ‘workaccording to drawings’; ‘knowing what next when doing a job’ or ‘planning’. One commentprovided more detail about what this involved: ‘select material, plan sequences and method ofwork’.
Other sought-after generic skills are: ‘people with the full motivation and discipline attitudes’;able to ‘solve mathematical problems quickly and accurately to avoid costly mistakes’; andknowledge of tools. Being able to communicate, English language ability and working safelyare also important generic skills for construction firms.
7. Wholesale and retail trade; repair of motor vehicles and motorcycles
Fourteen enterprises engaged in wholesale and retail trade responded to the survey, with anaverage of 23 employees, and a range from 2 to 71 employees.
The need for ‘staff to be better qualified’, and for ‘staff to have qualifications in sales &marketing’ was highlighted. Specific technical skills mentioned are: engineering; mechanicalengineering; it; aircraft engineer; accountant; electrical engineering; finance; and panelbeating. Also sought are ‘driving licence’ and ‘can drive forklift’; ‘knowledge ofspareparts/product knowledge in hardware/building supplies’; and the ‘ability to use acomputer’.
Some twenty comments were made about the need for employees to have social skills. Theterms used are: ‘healthy & good attitude’; ‘motivation & attitude’; ‘attentive’; ‘initiative in

5 March 2013 - Final 53 of 122
workplace’; ‘conscientious attitude to work’; and ‘social & good behaviour’. Several referredto the need to show a commitment to work: ‘fully committed’; ‘commitment to the workgiven’; or ‘commitment to task given’. Also important is: ‘punctuality’; ‘time management’and ‘coming to work on time’. Other related comments are: ‘quality of a person’ andleadership skills.
Eight employers stressed the importance of customer service skills: ‘consumer servicethroughout’; ‘committed to customer service’ and ‘building better/close relationship withcustomers’ were specific comments. Four employers mentioned the need for skills in clearcommunication in general or in English. Four employers also highlighted the need ‘honesty inhandling money.
8. Transportation and storage
The main activities of the 12 enterprises in this sector are: shipping agents and stevedoring;facilitating cargo movement in ports; airport management; aircraft ground handling services;air freight; courier & tourism; travel and cargo; and two domestic airline services coveringticketing/inbound tours/transport shipping. The average number of employees is 49 but with awide range from 8 to 153 employees.
This industry sector has a number of skill needs at the technical level. In relation to maritimeand port activities, the skill needs are: electrical and mechanical engineering; technical skillsfor the vessel; seamanship; maritime skills; and port machinery operation. In relation toaviation, the technical skill needs are: ‘engineers - licensed LAME/AME’; Pilots - formetro/convair captains; flight procedures design; technicians/commercial skills; technicalcomputer skills; IT skills; air traffic controller skills; and more generally: sound computerskills; and supervisory role skills. Also sought after are staff who are dangerous goodscertified and trained; staff trained in rescue fire/aviation security requirements; and quality &safety managers. Also needed are staff who are computer literate in terms of the airlinesticketing system and staff with accounting skills.
General skill needs were specified as: communication skills/public relations; reporting skills;administration skills and financial skills. Seven employers highlighted the need for customerservice skills in the following terms: selling skills; experience in travel; able to meet customerservice requirements; closing the sale - selling skills; telephone skills; and key service skills.
Problems with staff mentioned are: ‘Unable to grasp what is required internationally’ and‘lack of problem solving due to lack of life experience’. Eight employers highlighted the needfor a range of related social skills in these words: industry discipline; self-discipline &motivation; ability to take on responsibility; honesty; able to think outside the square; workethic; able to work unsupervised; and trustworthy & reliability.
9 & 14. Accommodation, food service activities and tourism relatedservices
The hospitality and tourism sector encompasses accommodation, offering food and drinkservice and providing services to tourists such as airport transfers, tours, and arrangingactivities such as scuba diving, game fishing and whale watching. Twenty-six enterprises canbe categorised as focusing on accommodation and food services, 14 of these are located in arural or outer island setting. The average number of employees per enterprise is 14 with a

5 March 2013 - Final 54 of 122
range of 1 to 35 employees.
Another five enterprises have a single focus on providing activities for tourists. Theseinclude: whale watching & diving; diver training, scuba diving, and boat tours; inbound &outbound activities for visiting cruise ships such as kayaking. These enterprises are smaller,with an average of 6 employees, and a range of 2 to 13 employees.
Five sets of technical skills are needed for accommodation and food & beverage services:these are cooking/chef; housekeeping; front-of-house (waitress, bar attendant, receptionists);and maintenance skills (general handyman, make repairs in plumbing, electrical, wood,motors, clean and painting and gardening). Office skills are also sought, covering basicaccounting and paperwork. Other specific skills mentioned are: sailing, tour guiding anddriving. Six employers said they needed supervisors and middle managers. Of the totalnumber of employees (357) in the enterprises surveyed, only 14 are foreign workers. They arenearly all managers or first-line supervisors.
Twelve employers mentioned their need for people with cooking skills. Ten of thesespecifically also mentioned the word ‘chef’, with some adding words like ‘qualified’ or‘experienced or qualified’. This strong demand indicates that the current TVET provision forcooking is not meeting the needs of the hospitality and tourism industry. This is confirmed bythe fact that the tracer survey of post-secondary graduates. Less than half (46 per cent) ofthose with a certificate of hospitality and cooking were in paid work in 2011.
The 2009 Tourism Training Needs Analysis noted three major gaps in formal education andtraining for the sector. These were the lack of accredited institutions and curriculum;inadequate teaching facilities for essential courses in professional cookery, food and beverageservice and hospitality; and an incomplete supply of adequately qualified and experiencedtutors.31
The issue may also be related to the lack of relevant and extended work experience for thesecertificate holders. An apprenticeship arrangement combining formal training off-the-job withon-the-job training may be needed, similar to that which applies to the trade certificates incarpentry and automotive mechanics. Another option is to lift the standard of the cookingskills taught by providing access to an international qualification such as that provided by theAustralian Pacific Technical College. However, again, classroom-based instruction may notbe sufficient, and the skills expected of a ‘chef’ may only be acquired through on-the-jobtraining in large kitchens serving a demanding clientele in major tourist destinations in theregion.
Skills for activities for tourists
The enterprises providing activities for tourists listed these skill needs: skilled divers; rescuedivers; tour guides on land and scuba diving guide. Tour guides need the ability to connectwell with customers, based on excellent social & customer service skills. The kayak guidesneed to be able to operate kayaks safely, and be able to swim well. They also need to haveCPR training to apply rescue breathing and chest compressions to help a person whosebreathing and heartbeat have stopped.
31 NZAID Tonga Tourism Training Needs Analysis, Draft Report, 11 September 2009, p 25.

5 March 2013 - Final 55 of 122
Tour guides also need to be bilingual and fluent in English, able to communicate clearly andspeak confidently to foreign customers. They need good knowledge about Tongan history andlandmarks.
General skills needed for hospitality
On the issue of what general skills sets they need, employers gave a huge range of exampleswhich can be placed in three broad groupings: communication skills, customer service skills,sets of skills related to personal behaviour and social skills.
In relation to communication skills, orals skills or spoken communication got a specificmention as well as the ability to speak English. The need for customer service skills werementioned by ten employers, and were best summed by this comment: ‘Understandingcustomers expectations’ or ‘key service’ skills. Another set of skills sought relate to salesmarketing. These are described as: public relations/hospitality skills; the need for aqualification in sales & marketing. Also needed is an understanding of the importance oftourism; experience in product knowledge & tourism awareness; and need for a personalexperience of tourist activity.
In terms of desired social skills, 35 separate comments were made. Good work ethics orhonesty were mentioned by seven employers. The social skills of team work; working inharmony together and solving conflicts in the workplace are mentioned. However, the largestnumber of desirable traits relate to personal behaviour. The single word descriptions are:reliability; self-motivation or just motivation; dedication; dependability; attitude, competencyand discipline.
The ability to show initiative was emphasised a number of times: initiative/using commonsense/thinking outside the box; working under no supervision; workplace initiative;initiatives/judgement; and ability to see small details. Other important personal skillsidentified by employers as desirable are: confidence/professionalism; willing to learn;consistency in effort and application of the skills; able to think long-term (planning).
Tourism training needs analysis 2009
The 2009 Tourism Training Needs Analysis identified the highest priority training needs ofthe sector as: customer service; reception, including front office, bookings, dealing withcomplaints; tour guide refresher; food and beverage service (including barista); housekeepingfundamentals; first aid and advanced first aid for marine operators and staff; boat skipper/boat master; outboard and inboard engine maintenance and refrigeration; and running a smallbusiness.32
10. Information and communication activities
The two enterprises in this sector are large employers with a range of technical skill needs.The Tonga Communications Corporation needs in particular electrical engineers, informationtechnology and computer science skills; and skills related to revenue assurance & qualityauditing. Generic skills needed relate to providing good customer services andcommunication skills.
32 NZAID Tonga Tourism Training Needs Analysis, Draft Report, 11 September 2009, p 2.

5 March 2013 - Final 56 of 122
The Tonga Broadcasting Commission needs skills in journalism & media; radio & TVproduction; visual TV editing and radio & TV presenters. The generic skills sought are: basicEnglish grammar & spelling; knowledge of basic Tongan words & proper grammar &meaning; ability to pronounce properly English & Tongan words; basic media skills in news& program production; basic work ethics & attitude; and commitment & loyalty.
11. Financial and insurance activities
Five enterprises surveyed provide financial services such banking services, accounting and arange of insurance products. Two are large and three are small enterprises, covering in total125 employees. The most important formal qualifications for working in this sector arerelated to accounting and finance. The types of skills needed are: working accounting skills,cashflow/business analysis.
The general skills needed are: in addition to basic administrative skills, customer service skillsand communication skills are important. Particular reference was made to the obstacle tointernal communication between management and workforce created by deference to thecultural hierarchy. Also important are: having the right attitude, being a team player; havingproblem solving skills and commitment.
13. Professional, scientific and technical activities
This sector includes only one enterprise focusing on printing activities. The required technicalskills are: management skills; computer skills; print finishing skills; and data compositionskills. Also important are: customer service skills, and marketing skills.
Type of training needed
All of the nominated skills needs were classified into whether training could address the needand if so, what sort of training. The categories of training are technical of the kind providedby TVET, short courses, in-house training or basic skills. The category of basic skills refers tothose attitudes and values that employees bring to the workplace as well as foundational skillsin literacy and numeracy, basic skills in how to use a computer. These basic skills also includeEnglish language ability, as it is the language of instruction in the school system. As oneemployer commented:
When recruiting we look mainly for attitude, work ethic & honesty. We cantrain anyone who has the right attitude. Often we struggle to find applicantsthat truly understand a business environment & the expectations we have.
These basic attributes expected of employees include honesty, self-motivation, willingness tolearn, dedication and initiative cannot be easily acquired. This means they are difficult toinculcate through formal training as they are usually considered part of a person’s personality.
Need for short courses
Many of the skills identified by employers (about two in five of those mentioned) can beaddressed by short courses supplemented by on-the-job mentoring. These skills includelearning how to operate equipment and large machinery such as bulldozers, other heavy

5 March 2013 - Final 57 of 122
equipment such as cranes and forklifts. It also includes jobs like bar attendant, kitchen hand,food processing skills and housekeeping. These require some front-end formal training but aremostly learnt on-the-job, under a supervisor.
Knowledge of quality and health and safety standards can best be imparted through shortcourses followed by monitoring of performance in the workplace. The oft mentioned need forskills in communication, customer service and time management can also be met by shortcourses backed by on-the-job mentoring. Supervising skills can also be learnt through acombination of short courses and on-the-job mentoring once an employee shows a basicaptitude for taking a leadership rôle. Other skills can also be best learnt through in-housetraining as they only involve skills needed in the enterprise. This applies to productknowledge in relation to engine spareparts or hardware building supplies. Issues related towork behaviour such as being on time, promptness and absenteeism can only be addressed bychanges in the workplace such as providing feedback or incentives to change behaviour.
Extent of skills gaps in the workforce
Only two enterprises said that none of their workers had the skills to do their job (both intourism and hospitality). However, another 30 enterprises, out of 105, said that only some ofour workers have the skills needed to do their job. So gaps in the skills of the workforce existfor near to a third of enterprises. There is little difference in the median employment size ofthe businesses with a skills gap and those without. The largest group of businesses (28 percent) with a skills gap in their workforce are to be found in accommodation and food services.Next come businesses in manufacturing; agriculture; wholesale and retail trade, includingrepair of motor vehicles and motorcycles; and transport and storage. One factor is rurallocation. Near to half of the enterprises (44 per cent) with a skills gap in the workforce are inrural areas.

5 March 2013 - Final 58 of 122
Annex 3
Table A3.1: Ratings in terms of importance to employers of ten issues theyface, Survey of the Skill Needs of Employers in Tonga, 2012
Most important issue business faces RatingFinding skilled workers 4.4Government regulations 4.3Business permits 4.2Lack of good work habits among our workers 4.2The tax system 4.2The electricity supply 4.0The state of the roads 3.9Access to credit or finance 3.6Problems with suppliers 3.5The cost of foreign workers 2.7
N 105

5 March 2013 - Final 59 of 122
Table A3.2: The type of generals skills identified by employers as needed bytheir employees, per cent
Which set of skills does your business find hardest to recruit? Please listthem in order of importance to the work of your business
Jobsnow
Main activitiesof business
Ticketing Tour conductor2
Ticketing/In-boundTours/Transport
Tour guideson land
Scuba diving guide2
Whale watching,scuba diving, boattours
Supervisors Housekeeping 2 Accommodation
Seafarers Chef Accountant2
Fishing (DeepSea)
Customerservice
Cooking Housekeeping1
Hospitalityservices -accommodation
Technicians,ElectricalLinesman
Engineer levels withspecific skills gaps
ProjectEngineer
SystemControl-lers
ProjectManager
1
Sole supplier &Distributor ofElectricity inTonga
Sales person Handicraft producers (Imostly train them)
Web designer1
Art & Crafts
Chef1
Accommodationand restaurantservices
Manage-ment skills
Technical skills -computer skills
1Facilitating cargomovement
Air trafficcontrollerskills
Technicians/Commer-cial skills
Flightproceduresdesign
Quality &safetymanagers
Rescuefire/Avia-tion security
1Airportmanagement
Supervisoryexperience
Inventory DirectingCustomers
Writingreports
Concretework
1Quarry supplies,gas station
Knowledgeof paints
Knowledge of sales &projects
Color mixing Paintmaking 1
Retail &wholesale of paint& related items
Team workandcoordination
Supervision skills Communica-tion skills
Customerservice
Initiative1
Logistics andWarehousing

5 March 2013 - Final 60 of 122
Table A3.4: Proportion of construction workers with post-schoolqualifications, per cent and total number
Table A3.5: Type of training needed for general & specific skills identified byemployers, enterprise skill needs survey 2012, per cent
Type of training per cent
Basic skills brought toworkplace
16.9
Short courses 42.0
In house 7.6
Technical skills - TVET 32.3
Other 1.2
100
N 486
Construction workersPer centwith ps
qualN
Building frame & related trades workers 6.3 1201
Building finishers & related trades workers 18.2 143

5 March 2013 - Final 61 of 122
Chapter Four: Needs of the Informal Economy and theRôle of Training
An important distinction needs to be made between formal and informal employment. Formalemployment refers to work that is covered by and responsive to regulations set and enforcedby government. It usually refers to paid work for employers who are registered as businesseswith government and who pay taxes. Informal employment refers to work that producesgoods or services for sale or own consumption that is not subject to any legal requirementabout how the activity is conducted.
More people in Tonga earn an income from the informal economy than the formal economy.Over half (56 per cent) of adults in 2003 were working in the informal economy. Wage andsalary earners accounted for only 44 per cent of total employment in 2003. The 2006 censusshowed that 39 per cent of those in employment were self-employed, with a slightly higherproportion for women (41 per cent) (see Figure below). The second most common source ofhousehold income during the 12 months prior to the 2006 census was selling products such asfish, crops or handicrafts (29 per cent) after wages and/or salaries (43 per cent of householdincomes). However, only small proportion (7 per cent) of households relied on income fromtheir own business.33
Skills training for the informal economy refers to either ways to improve sustainablelivelihoods or to create income-earning opportunities. Skills shortages in the informaleconomy refer to the lack of knowledge, skills and attitudes to take advantage of availableopportunities to earn cash. Subsistence farmers and those reliant on fishing for their
33 Tonga 2006 Census of Population and Housing, Volume 2: Analytical report/Statistics Department,Government of Tonga, p 55.
5 March 2013 - Final 62 of 122
livelihoods, under the pressure of a growing population, need to learn better ways lift theircrop and fish yields and nutritional quality as well as make sure of new ways to keep food instorage with minimal loss. The Skilling the Pacific Report (2009) noted that skills training isessential for promoting sustainable livelihoods in the Pacific. Where environments are fragile,people need to know how to manage better their available resources.
Skills training in most countries is geared to preparing people for work in the formal economyand to meeting the needs of enterprises providing this employment. Providing training for theinformal economy suffers from a number of challenges. These include the lack of adequateresources and the means to provide training such as suitable trainers to the agricultural andurban informal economies. Low levels of literacy and numeracy of many of those making aliving in the informal economy are another challenge.
Also, identifying the need for training in the informal economy is not as simple or easy to doas it is in the formal economy. Different methods of identifying the needed skills to those usedin the formal economy are required. Training is only part of the support needed to help peoplegenerate incomes. In relation to income-earning opportunities, for example, considerableeffort has to go initially into collecting relevant information from ‘key informants’ about whatare the available economic opportunities and then to work out what skills needed to make asuccess of these activities. These key informants need to be acknowledged experts, and bewilling to pass on their knowledge.
Skills training relevant to an identified opportunity also has to include training in running abusiness such as how to manage money. Access to microfinance, and marketing services arealso likely to be needed. Continuing business advice is another form of support that willincrease the chances of success. This post-training support should be designed and managedby people with business experience and skills, and not civil servants or trainers. Follow-up ofthe impact of the training and support services is also needed to see how effective it is interms of generating income.
Outline of this chapter
The main focus of this chapter is to present the results of a survey of 57 people engaged inactivities in the informal economy. This is followed by a discussion of the training needs ofwomen in the informal and formal economies.
Survey of people earning income in the informal economy
A special survey was conducted in early to mid November 2012 for the review of the Tonganlabour market. The survey was carried out in the islands of Eua, Ha'apai, Vava'u as well as onTongatapu. The villages were selected to fit one of four types, based on their main source ofincome or livelihood or location: farming, fishing, tourism or urban fringe. People in eachvillage were invited to answer four questions and so the responses are from people whooffered to take part in the survey.
Some 24 villages were selected. The numbers of people interviewed in each location were:Eua (7), Ha'apai (8), Vava'u (29) and Tongatapu (13). The main economic activity of nearlyhalf the villages surveyed is farming, tourism is an important source of income for a quarter ofthe villages, one-in-six villages are on the fringe of an urban area and just over one-in-ten arereliant on fishing.

5 March 2013 - Final 63 of 122
The survey was designed to avoid asking people directly whether they wanted training. Asnoted above, the forms of support needed for activities in the informal economy are usuallymore varied than simply offering training. The approach sought to determine if trainingemerged as an unprompted suggestion for the sort of help needed to conduct their incomegenerating activity.
The four questions asked were:
[Q1] what do you do to gain regular income? what is your main activity forearning an income?[Q2] what do you think you would like to do to improve your incomegenerating activity?[Q3] what types of help would you need to do this?[Q4] what other ways/other opportunities do you think you could use to earnsome income?
Main income-earning activities
The most important activities to earn an income are: handicrafts as part of a cooperativeventure; farming, handicrafts as a solo activity, fishing and animal husbandry. The cooperativehandicraft work involves growing pandanus leaves, harvesting, preparing the leaves forweaving and weaving the handicrafts. Some very large mats are valued at TOP 2,500 andabove. In one case, three women were full-time weavers of high-quality products for export tointernational buyers. In one month, they can make enough income for a year. One woman wasthe finance officer and business manager. Four husbands harvested the pandanus leaves andprepared the material. In other cases, handicrafts were sold at local stalls (fale) or in stores.
The most important activity in the villages based on farming is growing crops, with someanimal husbandry and cooperative handicraft making. This can refer to growing vegetablesand a few root crops to get sufficient to feed an extended family group and to exchange thevegetables for fish. In other cases, farming included growing a range of crops for export suchas kava and vanilla. In other cases, the farming focused on growing food crops for localconsumption such as taro and melons. Another means of earning income was to raise beefcattle for sale at local markets and for produce to go to Tongatapu markets.
However, in the fishing villages, the income-earning activities are more diverse. Theyincluded cooperative handicraft-making, diving, solo handicraft-making, fishing, farming,housekeeping, cooking and shopkeeping. Fishing two or three times a week was both to helpfeed the family and also for sale in the local village sale/income. The diving was for bêche-de-mer (sea cucumbers) to be sold as commercial seafood produce.
In the villages, dependent on tourism, cooperative handicraft-making is the most importantactivity, with some fishing, farming and solo handicraft-making. In the villages on the urbanfringe, the most important activities are cooperative and solo handicraft-making.
The activities involved a mixture of ventures run by male entrepreneurs (commercialvegetable growing - vanilla, kava, yams and taro), household-based activities (wage earnerplus crafts/pigs or stall), male-led activities (fishing), group-based male and female activity(traditional mat weaving, including growing, harvesting and preparing the matting by themen), and group-based female activity (weaving group), and female-led activities such as

5 March 2013 - Final 64 of 122
home-based crafts and piggery and arts & handicrafts.
Suggestions to improve income-generating activities
Some 44 suggestions were offered. The most important were: handicraft equipment (8);expand/secure market (6); and fence/security (6). Other suggestions were: reduce regulation(5); and improve transportation (3). Expand crops (2), better market prices, hire moreemployees, and feed animals were each suggested by two people. Single mention suggestionswere: more land, office/office equipment, farming equipment, better organisation, start newbusiness, access to utilities, more animals, and boat/fishing equipment.
Table 4.1 Suggestions to improve income-generating activities by type ofvillage
Farming-based villages N Tourism-based villages N Expand crops 5 Boat/fishing equipment 3 Farming equipment 2 Handicraft equipment 1 Start new business 2 Expand/secure market 1 More animals 2 Improve transportation 1 Handicraft equipment 1 Expand crop 1 Expand/secure market 1 Start new business 1 Fence/security 1 Villages on urban fringe Better market prices 1 Expand/secure market 4 Hire more employees 1 Fence/security 1 Feed animals 1 Reduce regulation 1 More land 1 Farming equipment 1 Better organisation 1 Start new business 1 Access to utilities 1 Boat/fishing equipment 1Fishing-based villages Expand/secure market 2 Boat/fishing equipment 2 Office/office equipment 1 Better organisation 1 Start new business 1
Specific responses to Question 2 included raising more animals for sale: growing and sellingmore pigs - currently need several breeding sows and secure compound to retain animals.Other suggestions focused on exports crops: ‘need to create more local & overseas markets tosell the vanilla to’; want to grow more cash crops such as tobacco; ‘export crops overseas andsell them locally as well’. Another way to improve income was by contracting out services infarm land preparation by using a tractor to plough fields. One farmer was growing vegetablescommercially for local markets, employing six permanent workers. He wanted to improve hisoperations so he could export high-value root crops in cold containers to New Zealandmarkets.
In relation to handicrafts: ‘grow more pandanus trees’ to allow more weaving for overseassales; ‘get the right equipment and resources and recruit more skillful people’; ‘gain betteraccess to markets for woven/handicraft products’; and ‘increase the frequency of internationalsales’. Several of those earning income from fishing wanted to buy their own boat for fishingin preference to the high cost of hiring an available boat. They could sell all of their catch butthe cost of hiring the boat meant they could only fish two or three times a week.

5 March 2013 - Final 65 of 122
Type of help needed
A follow-up question was asked what types of help would you need to do this. The leadingtype of help suggested was ‘funding/loan’ (9); followed by training/education (8); securemarkets/improved marketing (8) and improved road and transportation (7). Other types ofhelp suggested were: a fence/security for animals (5), subsidies (4), get familymembers/friends involved (2); and cheaper equipment/supplies (2). One-off suggestions forhelp were: better selection of crops/animals, reduce regulation, information on markets, andconservation.
The tourism-based villages and the villages on the urban fringe were the most likely tomention training/education as the type of help they wanted. In the farming-based villages,more important types of help suggested were: funding/loan, improved road, securemarkets/improved marketing, fence/security, and subsidies. In the fishing-based villages,funding/loans came first, followed by training/education, secure markets/improved marketingand impact of new regulations.
On the issue of the negative impact of new regulations, an elderly leader of a local fishingcommunity made the point that for a large number of local fishermen, new ecosystemregulations aimed at better environmental management of fisheries has resulted in the collapseof many household incomes due to over-regulation. He stated that the Ministry of Fisheriesneeded to understand better the impact of the new regulations and review them because thenew requirements were currently catching the wrong players and hurting poor families.
The final question was ‘What other ways/other opportunities do you think you could use toearn some income?’ The responses were: handicrafts (6), training/education (5), fishing (4)get family member involved (3) new business (2), funding/loan (2), stop pests (2), fishingequipment (2), and feed for animals (2). Single responses were: sell overseas, farmingequipment, farming, grow more crops, better selection of crops/animals, cheaper utilities andexpand markets. The farming-based urban fringe villages were most likely to favour the useof training/education to help them earn some income.
Some specific requests for training were to seek skilled training in diving and betterequipment to dive safely for bêche-de-mer (sea cucumbers) as the person was self-taught andwas using basic equipment. The commercial grower of vegetables wanted on-the-job trainingfor his farm workers to apply improve techniques for skinning taro and preparing it for export.The weavers of large traditional mats using prepared and treated pandanus fibre wanted tomaintain skills of the group and induct young girls as weavers and provide on-the-jobtraining.
Women and the informal economy
Women dominate two activities in the informal economy: the making of textiles andhandicrafts. The 2003 labour force survey showed that 98 per cent of those who made textileswere women (4,319) and 92 per cent of those made wood products, except furniture and strawand plaiting articles were women (3,009). The 2009 Household Income & ExpenditureSurvey showed that 40 per cent of rural household subsistence income came from handicrafts.The production of handicrafts is vital to the survival of rural households.

5 March 2013 - Final 66 of 122
In agricultural activities, the rôle of women in producing food is often not recognised inofficial statistics. The 2003 labour force survey records only 407 women compared with9,128 men growing of crops; market gardening; and in horticulture. And yet, it has been notedthat women (and children) take part in virtually all other farming jobs like planting andplanting preparation, harvesting and post-harvest processing.34
It is clear that women are involved in a wide range of activities in the informal economy.These include subsistence and commercial agriculture, fishing, weaving and tapa-making,trading and small-business activities. A 1998 report entitled Women in Tonga described therange of activities women were involved in agriculture:
In principle, women manage and control the cultivation of vegetables, fruittrees, and a wide range of medicinal, cultural and ornamental/fragrant(often multi-purpose) trees/plants in the immediate vicinity of the household('api kolo). In addition, they are responsible for the cultural and income-generating handicraft species like the paper mulberry (hiapo) andpandanus, which usually grow in the male bush garden area ('api 'uta). Theyassist with the cultivation of food crops in the 'api 'uta, usually weeding andharvesting, and they contribute to the commercial farming of vegetables(and other crops like peanuts) at all stages after the land is cleared. Theyalso feed the pigs and raise the chickens. Men are responsible fortree/plant/crop species (with the exception of handicraft plants) in the 'api'uta including staple root crops and multipurpose trees like coconut, mangoand breadfruit.35
In the production of commercial crops such as squash, vanilla and coffee, women have playedkey roles in the production, processing and preparation for export of these products.36 Asnoted above, the production of handicrafts is a major source of income for rural households.Women have traditionally played the key rôle in this activity, from the growing of the rawmaterial, a variety of pandanus and paper mulberry (hiapo) trees, to the final production ofhigh-value weaving or tapa cloth and its marketing.37
Women’s rôle in generating income from fishing activity has also not been recognisedadequately or supported. For the coastal communities, landless families and low-incomehouseholds in urban fringe villages, gathering shellfish and women's inshore fishing remainimportant sources of food and income. Tongan women also engage in various post-harvestactivities ranging from simple gutting, scaling and cleaning of shellfish to using processingand preserving methods like salting and drying. It has been suggested that women involved infishing activities want to develop their skills and knowledge in fish preservation andprocessing.38
34 Atu `o Hakautapu Emberson -Bain, 1998, Women In Tonga: Country Briefing Paper, Asian DevelopmentBank, December, p 53.35 `Atu `o Hakautapu Emberson -Bain, 1998, p 53.36 `Atu `o Hakautapu Emberson -Bain, 1998, p 53-56.37 `Atu `o Hakautapu Emberson -Bain, 1998, p 56.38 `Atu `o Hakautapu Emberson -Bain, 1998, p 59.

5 March 2013 - Final 67 of 122
Women in business
Women In Sustainable Enterprises (WISE Tonga Inc) conducted a survey of the trainingneeds of a third of its 167 members. The resulting ‘Report on Training Options for theMembers of WISE Tonga Inc. August 2012’ by Janet Carlyle described the typical currentmember of WISE as a woman, aged between 26 and 65, who is employing between 1 to 15staff. She started her business, or businesses, (many members of WISE have multiplebusinesses), out of economic necessity, but did not use micro finance to fund her start up or toexpand. Many members of WISE have a formal business plan in place.
The current membership of WISE is split, half and half between women who have businessesin the formal and informal economy. Informal businesses are defined as those businesses notearning enough income to pay the lowest level of business tax set at $7,400 per year.39
A survey of 47 WISE members that identified and prioritised their general areas of trainingthey wanted. The results are presented in the graphic below. Training and skills in Tourismwas the most important area of training identified. This was followed by interest in training inbusiness ethics, planning and staff management. A third of respondents were interested inobtaining skills in either corporate governance and or political governance.
39 Janet Carlyle, 2012, Report on Training Options for the Members of WISE Tonga Inc. August, p 5.

5 March 2013 - Final 68 of 122
Conclusion
Earning a reliable income in the informal economy depends on having the appropriateresources as well as skills. The latter are usually passed on within the household or the widercommunity. However, finance is often needed to purchase the equipment needed to undertakethe activity more cost effectively. This applied to fishing in particular but also to raisinganimals. The cost to market was also another barrier to selling produce. After these factors,training did get mentioned as a way of improving the capacity to generate incomes. However,the need for training was a specific one, often related to on-the-job training rather than formalclassroom-based instruction.
Not mentioned by respondents was the need for training in financial literacy. This is likely tobe important as several people wanted to take out a loan to purchase equipment such as a boatfor fishing, safety equipment to allow off-shore fishing or other equipment such asattachments for a tractor. Also needed are skills in managing a business, marketing andclosing a sale.
The ‘Know Your Business’ training programme has been developed by the InternationalLabour Organisation (ILO) for trainers and teachers in vocational education, secondaryeducation and also higher education.40 It is a 80 to 120 hours course for young studentsbetween 15 to 18 years. Its aim is to promote awareness among young people of theopportunities and challenges of entrepreneurship and self-employment. The trainingprogramme provides the knowledge of the challenges and the desirable attributes needed tostart and operate a successful enterprise. The ILO’s Start & Improve Your Business (SIYB)training programme is aimed at local Business Development Service organisations, andespecially women's organisations. It teaches people how to generate an idea for a smallbusiness, how to start it up and how to improve a business over time.41
However, these programmes will have little impact unless a range of support services is alsoprovided. Training which raises expectations about the potential of self-employment has toalso acknowledge the challenges and barriers that exist to undertaking any activity aimed atcreating a reliable income.
The informal economy in general is under-reported in official statistics because simplequestions at one point-in-time cannot provide answers to the nature and extent of people’seconomic activities. In particular, the rôle of women in the informal economy is often difficultto identify from official statistics because they understate the economic contribution theymake beyond the household. One informal activity of women that makes a large contributionto the incomes of rural households is traditional weaving and tapa cloth making. Forms ofsupport needed include ensuring that sufficient supplies of raw materials are available,assistance with marketing to international clients and help with managing finances. Alsoneeded is a focus on ensuring these traditional skills are passed onto a younger generation ofwomen.
40 International Labour Organisation, 2011, ‘Know About Business’ (KAB): A training methodology to createawareness about entrepreneurship among youth Factsheet.http://www.ilo.org/employment/DepartmentsOffices/rural-development/WCMS_159163/lang--en/index.htm41 Fact sheet of 'The Start and Improve Your Business Programme (SIYB)'http://www.ilo.org/empent/Publications/WCMS_101309/lang--en/index.htm

5 March 2013 - Final 69 of 122
Chapter Five: Forecasting future demand for middle skills
The issue of how to forecast future demand for skills is a complex one. It is not possiblesimply to take past trends and project them into the future. Sector forecasts of workers withspecific technical skills was popular in the the 1960s and 1970s but were rejected in the 1980sdue to the rigidity of the method used.
Manpower planning generally assumed a fixed relationship between laborand outputs, implicitly ruling out technological change. It also emphasisedtechnical skills to the detriment of cognitive and social skills. And it wasslow to adapt to rapid changes in the world of work...42
The OECD’s major review of TVET in 2010 called Learning for Jobs noted that:
...the shape of future labour market needs is inevitably misty. The challengeis to identify what can reasonably be predicted some years into the future,and what cannot.43
The World Bank concludes its note on the limitations of manpower planning with thiscomment: ‘...perhaps the most valuable lesson from East Asian countries is that skills-development systems need to grow organically from below while being coordinated andfostered from above’.44
In a small economy, reliant on government and donor expenditure, predicting the futuredemand for skills often depends on decisions made by the government. A good indicator ofskills demand for the short-term future is information about planned investment ininfrastructure and other major projects. The local demand for skills training is also shaped bygovernment approvals of work visas for foreign workers and on whether there is a policy toreplace foreign workers. Government policy on limiting the size of the public sector also has adirect effect on whether retiring workers are replaced or not.
The skill requirements of infrastructure projects are also open to government intervention.What types of skills needed to do the work and how these skills will be sourced can bespecified as a requirement of the tender process. Enterprises submitting a tender could beasked to provide details of the types of skills to be created, the required training for theseskills, the numbers of persons in jobs using these skills, and whether the skills are to berecruited domestically or not. If foreign skilled workers are to be used, enterprises could beasked to make arrangements to ensure that skills are transferred to local workers. Thesearrangements should include partnerships with skills training providers or providers, toprovide structured work placements for students and new graduates, and other forms ofassistance in terms of personnel and equipment for training providers.
42 World Bank, 2012, World Development Report 2013: Jobs. Washington DC, Box 5.8, p 17743 OECD, 2010. Learning for Jobs: Synthesis Report of the OECD Reviews of Vocational Education & Training.p 57.44 See Note 39.

5 March 2013 - Final 70 of 122
Employment situation over previous 12 months to November 2012
Employers were asked about their jobs record in the previous 12 months and theiremployment situation in the immediate future. In response to the question: ‘Has the number ofyour workers changed in the last 12 months compared with the previous year?’, over a thirdof employers (33 per cent) said the number of their workers had increased, just over one fifthquarter (22 per cent) said it had decreased and two-in-five (42 per cent) said it had remainedthe same (see Table A5.1).
The smaller employers (average number of employees 22) had not changed their employmentnumbers in the last year. The larger employers (average 31-32 employees) had eitherincreased or decreased their employment.
Industry changes in employment
Table A5.1 shows that the industry sectors that increased their employment more than thenational average are: Agriculture, forestry, fishing; Mining and quarrying; Financial andinsurance activities; and Construction. The industry sectors which performed below thenational average were: Wholesale and retail trade; repair of motor vehicles and motorcycles;Manufacturing; Transportation and storage; and Information and communication activities.
The sector with the largest number of employers is hospitality and tourism. The majority ofenterprises said they had not increased their number of employees in the last 12 months. Athird said they had increased their number of jobs; and one-in-ten had decreased their numberof employees.
The two industry sectors which stand out as contributing major employment growth are:agriculture, forestry and fishing and finance and insurance services. Construction and miningand quarrying have also contributed in a smaller way to the employment growth. Inagriculture, forestry and fishing, the main activities which have expanded employment are:forestry and timber production, deep sea fishing; processing and export of agricultureproducts, such as vanilla. Supplying quarry products has also expanded its employment.
The main types of activities expanding in the finance and insurance sector are: generalInsurance, microfinance which provide access to loans, savings, life insurance, businesstraining and financial literacy training to low-income, self-employed or unemployed womenin Tonga; and a firm providing services in accounting, audit and taxation.
The results for the construction sector show that some firms have expanded and some havecontracted. Four firms have increased their employment in the last 12 months, three havedecreased their number of workers and 2 firms have kept the same level of employment. Thissector is particularly dependent on the funding of specific projects. The four constructionfirms which had expanded in the last 12 months were all located in Pahu, Ma'ufanga,Haveluloto.
The tourism and hospitality sector also has 11 out of 32 enterprises which increased theiremployment in the 12 months to November 2012. Four out of 14 enterprises in the sectorcovering wholesale and retail trade; repair of motor vehicles and motorcycles increased theiremployment over the last 12 months.

5 March 2013 - Final 71 of 122
In terms of decreased employment over the last twelve months, the major sectors are: miningand quarrying; information and communication activities; manufacturing; water supply;sewerage, waste management activities; construction; and wholesale and retail trade; repair ofmotor vehicles and motorcycles; and transportation and storage.
Manufacturing is the sector with the most enterprises (5 out of 11 surveyed) that havedecreased their employment over the last 12 months. Three constructions firms decreasedtheir employment in the last 12 months. Four out of 14 enterprises had decreased theiremployment in the sector covering wholesale and retail trade; repair of motor vehicles andmotorcycles.
Expectations about jobs expansion in the immediate future
Employers had lower expectations of increasing the number of their workers in the next threemonths. Only one-in-four (24 per cent) believe that they would have more workers in threemonths time compared with the third of enterprises that increased their employment in the last12 months (see Table A5.2). Three-in-five (60 per cent) believe they will have the samenumber of workers and one-in-six (16 per cent) said they thought they will have fewerworkers.
The largest employers (average 44 employees) think the number of their workers will remainthe same in three months. Mid-sized employers (average 34 employees) think their numberswill remain the same. However, smaller enterprises (average size 16 employees) think thatthey will have fewer workers in three months time.
The industry sectors which are optimistic about increasing their number of workers over thenext three months are shown in Table A5.2 Enterprises in agriculture, forestry and fishingstand out as the most optimistic about future job growth, with five out of the six saying theyexpect to increase their number of workers in the next three months. Construction has three-out-of-ten firms which expect to increase their workforce. Manufacturing has three out of 11firms also expecting to increase their workforce.
These results show that employment growth, or the demand for skills on which it is based,cannot be predicted on the basis of conditions in an industry sector. Except in the case ofagriculture, forestry and fishing, the expectations about future employment vary greatly byenterprise within most sectors.
Difficulties with forecasting the future based on past trends
The difference between actual job growth and expectations about future job growth showshow difficult it is to forecast the future in terms of past trends. Only a third (34 per cent) ofthe enterprises that increased the number of workers in the last 12 months said they expectedto further increase the size of their workforce in the next three months. Of those enterprisesthat decreased their workforce in the last twelve, a quarter (26 per cent) expect to continue tolose workers in the next three months. However, a fifth (21 per cent) of this same group ofenterprises that lost workers in the previous 12 months expect to increase their workforce inthe next three months. Three-out-of-four enterprises with the same number of workers overthe latest 12 months expected this situation to continue, with near to one in six (14 per cent)saying they expect their number of workers to increase and just over one in ten (12 per cent)saying they expect to have fewer workers.

5 March 2013 - Final 72 of 122
Estimating the potential of replacement demand for middle-level skills
In a small economy with slow private sector growth and constraints on public spending, thepotential demand for middle-level skills is shaped much less by the growth in jobs (expansiondemand) and much more by the replacement of existing workers (replacement demand).
Replacement demand is caused by several factors. One factor is the aging of the workforce inan occupation and people leaving the occupation on retirement. However, replacement cannotbe automatically assumed to take place. The decision, especially in the public sector, toreplace a retired worker may depend on the current budget situation. Nevertheless the numberof people who are aged 55 or over can be used as one source of information on replacementdemand. Table A5.3, in the second data column, shows the number of workers in eachoccupation who are likely to retire in the next five years.
Another factor affecting replacement demand is the number of foreign workers in anoccupation. If an employer can find people in the domestic labour market with the desired setof skills, then it is more cost efficient for the employer to replace the foreign worker.Employers go to the trouble of bringing in foreign workers at considerable cost becauseTongan workers do not have the necessary skills to do the job. The government approval of awork visa is based on an assessment that Tongan workers with the same skills are notavailable to work. In particular, the middle occupations with a high proportion of foreignworkers can indicate a domestic skills shortage in that occupation.
The availability of census data on the occupations of foreign workers and their qualificationprofile compared with Tongan workers provide a valuable way to measure the potentialdomestic demand for middle-level skills training. These data can be used to identify thereplacement demand and the skills gap in the existing workforce.
Demand based on filling skills gaps in middle-skill occupations
Another source of demand for middle-level skills is the need to upgrade the skills of existingworkers. Most jobs in the occupations classified as technician level require a post-schoolqualification. For the associate professional occupations, the skills required may be reflectedin post-school qualifications or may be learnt on-the-job.
For the trade-based occupations, a qualification based on classroom training and on-the-jobtraining is regarded as highly desirable by employers in international labour markets,especially where trades workers are accountable for meeting minimum standards. However, indeveloping countries formal qualifications in these occupations are much less common.
Working out a benchmark for qualifications in middle occupations
The proportion of foreign workers in an occupation with post-school qualifications provides avaluable reference point or benchmark to show what minimum set of qualifications employersare seeking. If an employer has gone to the considerable extra cost of engaging a foreignworker with post-school qualifications, then it can be assumed that the employer believes thatthis level of qualification is desirable for that occupation. The gap between the qualificationsprofile of Tongan workers compared with foreign workers shows the number of the latter whopotentially need middle-level skills training.
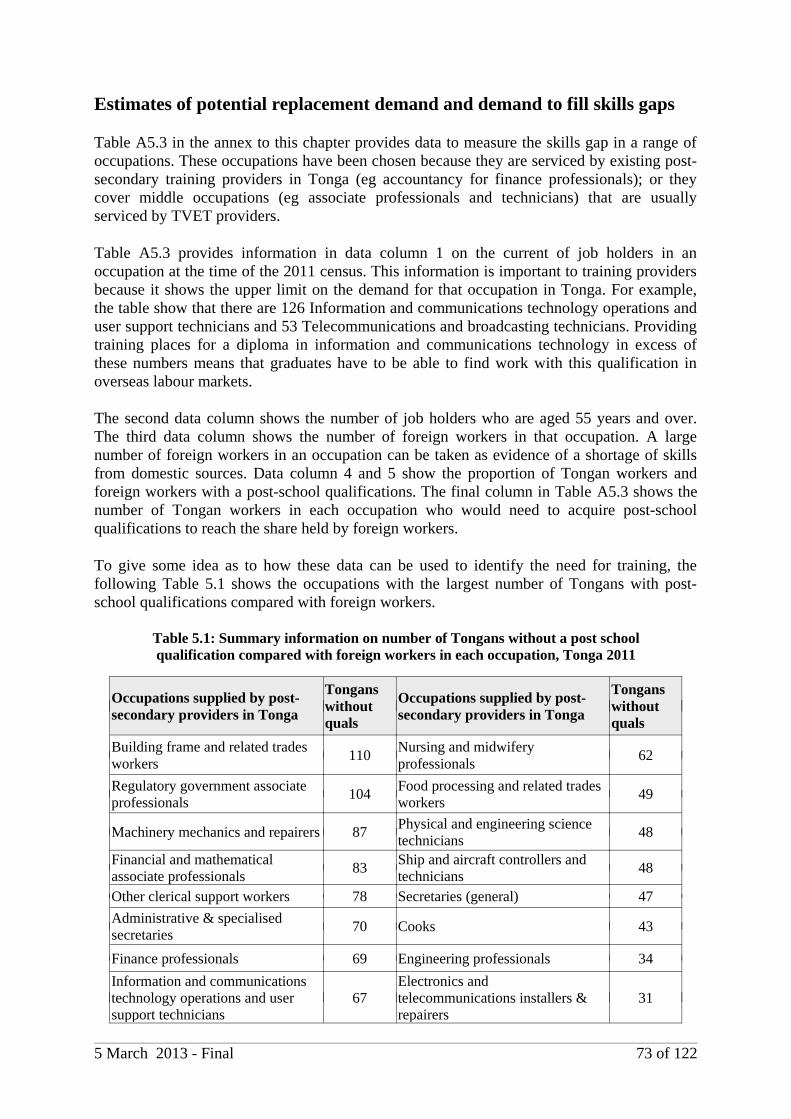
5 March 2013 - Final 73 of 122
Estimates of potential replacement demand and demand to fill skills gaps
Table A5.3 in the annex to this chapter provides data to measure the skills gap in a range ofoccupations. These occupations have been chosen because they are serviced by existing post-secondary training providers in Tonga (eg accountancy for finance professionals); or theycover middle occupations (eg associate professionals and technicians) that are usuallyserviced by TVET providers.
Table A5.3 provides information in data column 1 on the current of job holders in anoccupation at the time of the 2011 census. This information is important to training providersbecause it shows the upper limit on the demand for that occupation in Tonga. For example,the table show that there are 126 Information and communications technology operations anduser support technicians and 53 Telecommunications and broadcasting technicians. Providingtraining places for a diploma in information and communications technology in excess ofthese numbers means that graduates have to be able to find work with this qualification inoverseas labour markets.
The second data column shows the number of job holders who are aged 55 years and over.The third data column shows the number of foreign workers in that occupation. A largenumber of foreign workers in an occupation can be taken as evidence of a shortage of skillsfrom domestic sources. Data column 4 and 5 show the proportion of Tongan workers andforeign workers with a post-school qualifications. The final column in Table A5.3 shows thenumber of Tongan workers in each occupation who would need to acquire post-schoolqualifications to reach the share held by foreign workers.
To give some idea as to how these data can be used to identify the need for training, thefollowing Table 5.1 shows the occupations with the largest number of Tongans with post-school qualifications compared with foreign workers.
Table 5.1: Summary information on number of Tongans without a post schoolqualification compared with foreign workers in each occupation, Tonga 2011
Occupations supplied by post-secondary providers in Tonga
Tonganswithoutquals
Occupations supplied by post-secondary providers in Tonga
Tonganswithoutquals
Building frame and related tradesworkers
110Nursing and midwiferyprofessionals
62
Regulatory government associateprofessionals
104Food processing and related tradesworkers
49
Machinery mechanics and repairers 87Physical and engineering sciencetechnicians
48
Financial and mathematicalassociate professionals
83Ship and aircraft controllers andtechnicians
48
Other clerical support workers 78 Secretaries (general) 47
Administrative & specialisedsecretaries
70 Cooks 43
Finance professionals 69 Engineering professionals 34
Information and communicationstechnology operations and usersupport technicians
67Electronics andtelecommunications installers &repairers
31

5 March 2013 - Final 74 of 122
Identifying emerging skills needs
Government goals and targets for infrastructure investment offer a guide to emerging skillsneeds. Current and future planned or proposed large projects require skills over and above thenormal requirements of a low-growth economy. However, it is not possible to apply a settemplate to work out the domestic skill needs of a specific project. This will depend on theparticular uses of technology the successful tender applies, the forms of work organisationthey deploy and the skills of their core workforce they will import for the project.
Current and proposed projects that have implications for the supply of middle-level skills. TheTonga National Infrastructure Investment Plan 2013: Draft for Discussion uses four strategicthemes to list the projects which have high priority for future infrastructure investment.45
These four themes are: Connecting Tonga; Improved Infrastructure for Communities;Reliable and Affordable Energy; and Sustainability, Resilience and Safety. The projectswhere a need for middle-level skills can be identified are outlined below.
Telecommunications
The completion of an undersea fibre-optic cable link to Fiji is scheduled for mid 2013. Thedraft Tonga National Infrastructure Investment Plan 2013 points out that this cable willdeliver a step-change in the speed of communication, as well its capacity and quality. Theimproved communications have the potential to create a range of new economic and socialopportunities. In addition, infrastructure and services of the local telecommunicationoperators in relation to telephone, radio, and the Internet are also being improved to offer newapplications such as mobile Internet, multi-media and interactive applications. Efforts are alsobeing made to improve mobile phone and AM radio coverage in less-populated islands.
A proposed project is to extend the fibre-optic cable link to connect Ha'apai and Vava'u withinternational networks. However, the draft plan notes that the private sector and Governmentneed to build on opportunities emerging from improved Internet access, and follow-up withinitiatives that provide e-commerce and e-Government services: ‘these follow-up activitiesare critical to maximising the national benefits from investment in the cable’.46 The skillsrequired to operate e-commerce and e-Government services include: web and multimediadevelopers, graphic designers applications programmers, database designers andadministrators, computer network & systems technicians and web technicians.
The second investment priority for this sector recommended in the draft plan is to improve theresilience of the AM radio system so it can better perform its role as an early warning systemfor cyclones and in providing vital information during disaster recovery. This would involveconstruction of a new transmitter tower on Vava'u and climate proofing of transmissionfacilities and studios in Tongatapu and Vava'u. A new transmission tower on Vava'u wouldaddress reception problems on northern islands, especially during cyclones and emergencysituations.
The skills needed are: telecommunication engineers, electrical engineering techniciansElectronics engineering technicians Electrical line installers and repairers Electronicsmechanics and servicers.
45 Tonga National Infrastructure Investment Plan 2013: Draft for Discussion, 14 December 2012, p 25.46 Tonga National Infrastructure Investment Plan 2013: Draft for Discussion, 14 December 2012, p 13.

5 March 2013 - Final 75 of 122
Road repair and maintenance
Transport Sector Consolidation Project is upgrading Tonga’s road system after a decade ofneglect. Specific projects are the Nuku'alofa Reconstruction Project, the Integrated UrbanDevelopment Sector Project; the Tonga National Road Improvement Project; and theAusAID/World Bank Transport Sector Consolidation Project. There is also ongoing roadmaintenance.
According to a 2011 report assessing road construction and maintenance services in Tonga,there are about six or seven professional engineers in the private sector, spread betweencontractors and consultants. There are also some 50 engineering contractors on Tongatapu,most with experience in quarry operations or building projects.47 Many contractors have adepth of experience in tendering, scheduling and contract administration of building works.
The report recommended the movement of road maintenance function from government to theprivate sector. In relation to ‘manpower skills’, the report noted that:
’... existing consulting groups and contractors that have the capacity todesign, supervise and carry out road building and maintenance. However,some strengthening of tender preparation and estimating skills would behelpful. Likewise, initial strengthening of contract preparation and projectmanagement skills within government agencies would allow them to moreeffectively control operating contracts’.48
The draft Infrastructure Report identified the main obstacle to improved roads is the backlogof maintenance and the need to rehabilitate the road system to a standard where it can besustainably maintained in a cost-effective way using local resources and expertise.
Water and Sanitation
The growth in the population of Nuku'alofa and peri urban settlements is lifting the demandfor better access to water supply and water quality. The water agency, the Tonga WaterBoard, also has to monitor and safeguard water sources.
Another challenge is reducing loss and waste of valuable water. More can be done by theTonga Water Board and village water supply managers to promote responsible use of waterthrough demand-side management initiatives similar to the energy sector. This involvesundertaking measures such as helping households to reduce water leaks; encouraging ormandating the use of water-saving fittings; and conducting awareness campaigns to build anunderstanding of water as a scarce and valuable resource. Skills training is likely to be neededon how to conduct this campaign and to carry out the suggested measures.
Maritime
Increasing the safety and reliability of all maritime activities is a major priority of theGovernment and especially for inter-island shipping. The draft Infrastructure Report notes
47 Institutional Assessment of Road Construction and Maintenance Services in the Royal Kingdom of TongaStage 1 Report: Technical Assessment. Prepared for Pacific Infrastructure Advisory Center April, 2011, p 28.48 See Footnote 24, p 38.

5 March 2013 - Final 76 of 122
that this will require further investment in infrastructure and complementary initiatives toimprove capabilities, facilities and systems. The report suggests a preliminary estimate ofT$20 million is needed to cover these activities.
Maritime training facilities suffer from a lack of investment, and there is aneed to upgrade safety standards and awareness and rebuild capability inmaritime safety oversight.49
The report states that while some of these issues are being addressed by existing programs,‘more urgently needs to be done’. The implications for the skills training system include theneed to build up local capacity and systems for enhanced maritime safety oversight. Alsoneeded are revitalised local training programs for seafarers and the associated facilities.
Aviation safety, security and continuity of services
Ensuring aviation safety and maintaining vital air service connections is also a high priorityfor the Government. The draft Tonga National Infrastructure Investment Plan 2013 notes thataviation operational requirements involve complying with increasingly more stringentindustry safety and security standards. To do this will require that staff who are operatingairports have improved capabilities in aviation safety and security. The draft plan states that‘this will require ongoing capacity building of staff to keep pace with aviation marketdevelopments; high industry standards; and rapid technology change’. This means that ‘thenecessary skills and qualifications for effective oversight of international safety and securitystandards are available in Tonga’.50
A significant investment program is already underway in the airport sector. This includes afocus on meeting safety and security compliance requirements in terms of fire and rescuecapability, security screening, navigational aids, and runway condition.
Energy
Tonga has one of the highest levels of access to electricity in the region with around 85 percent of the population on-grid and high levels of supply reliability. However, Tonga also hasone of the highest costs of electricity in the region. This high cost has a negative impact ofbusiness costs and on household budgets. In addition, the high level of reliance on importedpetroleum creates energy security and price stability issues. The major challenge in theEnergy sector is providing reliable, sustainable and affordable energy to households andbusinesses in Tonga.
In 2009, Government responded to the twin challenges of reducing the Tongan contribution toglobal Greenhouse Gas emissions and improving national energy security by endorsing apolicy of 50 per cent of energy from renewable resources by 2020.51
The major investment priorities in the Energy sector are: an additional 1-2 MW of solargeneration capacity on Tongatapu (T$24 million); and solar generation capacity on outer-
49 Tonga National Infrastructure Investment Plan 2013: Draft for Discussion, 14 December 2012, p 20.50 Tonga National Infrastructure Investment Plan 2013: Draft for Discussion, 14 December, p 2251 Tonga Energy Road Map 2010-2020: A ten year road map to reduce Tonga's vulnerability to oil price shocksand achieve an increase in quality access to modern energy services in an environmentally sustainable manner.Final Report, June 2010.

5 March 2013 - Final 77 of 122
islands (T$9 million). These priority investments continue and accelerate the program ofinstalling on-grid solar electricity generation and extend renewable energy generation to outerislands. The Tonga Energy Road Map 2010-2020 has instituted a number of supportinginitiatives. These include strengthening the policy, legal, or regulatory environment;implementing measures to foster energy efficiency; undertaking research into other renewableenergy from domestic sources such as wind, wave, hydro; and implementing improved fuelsupply logistics.
The proposed Tonga Green Incentive Fund is a dedicated fund that would provide incentivesfor private sector investment in renewable energy and/or for the long-term financing ofconsumer-owned renewable energy installations. Other initiatives the Fund could financecould include end-use efficiency and demand-side management initiatives such as energyawareness, energy efficient lighting and appliances, etc aimed at reducing inefficient use andwaste of electricity. There is also interest in trialling alternative sources of energy, such ascoconut oil blended with or replacing diesel in existing or slightly modified engines, andbiogas extracted from landfills. All these initiatives have implications for identifying ‘greenjobs’ and ‘green skills’ in the Tongan context.52
Environmental protection and response
The draft of the Tonga National Infrastructure Investment Plan 2013 has noted that:
A key constraint to effective environmental assessment of infrastructureprojects is a lack of technical skills and awareness amongst governmentagencies, private sector and the general public. This creates an urgent needfor skills building in environmental assessment for project proponents andlocal consultants, and for broad awareness raising activities withinagencies responsible for infrastructure development.53
In particular, the plan highlights the need for additional human resources and technical skillsbuilding for staff within the Environmental Impact Assessment system. Department of theMinistry of Lands, Environment, Climate Change & Natural Resources (MLECCNR) andPlanning and Urban Management Agency (PUMA). In an annex on climate change, the reportnotes:
Technical Training related to Revised Building Code and Road DesignStandard: In line with revision of the Building Code and Road DesignStandard, training for Ministry of Infrastructure staff responsible forinspection and enforcement will be required together with training forprivate sector organisations on the use of the building code and road designstandard.54
Green jobs, requiring new green skills will be needed to carry out the proposed CoastalProtection project for Eastern Tongatapu (T$15m). Green jobs and green skills will also beincluded to build and operate the proposed Infrastructure to enhance Disaster Response &
52 ILO, 2011, Skills for Green Jobs: A Global View Synthesis Report based on 21 Country Studies. InternationalLabour Organisation, Geneva.53 Tonga National Infrastructure Investment Plan 2013: Draft for Discussion, 14 December 2012, p 3254 Annex on climate change (para 124), Tonga National Infrastructure Investment Plan 2013: Draft forDiscussion, 14 December 2012.

5 March 2013 - Final 78 of 122
Evacuation (T$12m). The latter project involves building a range of infrastructure to supportdisaster response coordination and capacity and to support community evacuation prior tonatural disaster events.
Conclusion
Forecasting the skill needs of the Tongan economy cannot be based on a projection of pasttrends. In an economy where the private sector is focused on serving the needs of a smalldomestic market and the tourist trade with its variable demand, government and donorinvestment in infrastructure provide the best guide to the future demand for skills. However,an estimate of the skills needed for a particular infrastructure project can only be worked outfrom more detailed discussions with the parties directly responsible for the project. In manycases, these will be the enterprises awarded the contracts to build or supply the infrastructure.In other cases, it will be the government agency charged with implementing an energy, wateror environmental protection initiative.
Future opportunities for skills formation may also require a change in government policy tomaximise the skills transfer opportunities. One way this could be done is for government tostipulate in a request for tenders that opportunities for skills transfer be provided such as theemployment of apprentices. Another way could be for government to specify the ‘green jobs’and competencies needed to implement its policy statements on energy and responses toclimate change. Two key examples are the Tongan Energy Roadmap 2010-2020, especially inrelation to renewable energy and energy conservation; and the Joint National Action Plan onClimate Change Adaptation & Disaster Risk Management 2010-2015.55
55 On training for disaster response in the Pacific, see United Nations Office for the Coordination ofHumanitarian Affairs (OCHA), 2012, Analysis of Disaster Response Training in the Pacific Island. September

5 March 2013 - Final 79 of 122
Annex 5
Table A5.1: Proportion of employers in each industry sector whose number ofworkers increased, decreased or remained the same over the last 12 monthscompared with the previous year, per cent
Industry Increase Decrease Same NR Total N
Agriculture, forestry, fishing 66.7 0.0 33.3 100 6
Mining and quarrying 50.0 50.0 100 2
Manufacturing 27.3 45.5 27.3 100 11
Electricity, gas, steam and airconditioning supply
33.3 0.0 66.7 100 3
Water supply; sewerage, wastemanagement activities
33.3 33.3 33.3 100 3
Construction 40.0 30.0 20.0 10.0 100 10
Wholesale and retail trade; repair ofmotor vehicles and motorcycles
28.6 28.6 42.9 100 14
Transportation and storage 14.3 21.4 57.1 7.1 100 14
Accommodation, food service activities& tourism
34.4 9.4 53.1 3.1 100 32
Information and communicationactivities
0.0 50.0 50.0 100 2
Financial and insurance activities 50.0 16.7 33.3 100 6
Professional, scientific and technicalactivities
100.0 100 1
Total 32.7 22.1 42.3 100 104

5 March 2013 - Final 80 of 122
Table A5.2: Proportion of enterprises saying they expect to increase thenumber of their workers in the next three months, per cent in each industrysector
Industry per cent N
Agriculture, forestry and fishing 83.3 6
Electricity, gas, steam and airconditioning supply
33.3 3
Water supply; sewerage, wastemanagement activities
33.3 3
Construction 30.0 10
Manufacturing 27.3 11
Wholesale and retail trade; repair ofmotor vehicles and motorcycles
21.4 14
Accommodation, food service activities& tourism
18.8 32
Transportation and storage 14.3 14

5 March 2013 - Final 81 of 122
Table A5.3: Occupations supplied bypost-secondary providers in Tonga Total
Numberaged 55plus
Numberof foreignworkers
Prop ofTonganswith post-schoolquals
Propforeignworkerswith post-schoolquals
No ofdomesticworkersrequiring-post-schoolquals
Professions supplied by Tonga training providers
Finance professionals 274 28 26 75 100 69
Nursing and midwifery professionals 248 16 9 75 100 62
Associate professionals & technicians
Physical and engineering sciencetechnicians
134 9 27 49 85 48
Mining manufacturing andconstruction supervisors
45 6 12 31 58 12
Process control technicians 11 0 0 36 0
Life science technicians and relatedassociate professionals
35 2 8 80 100 7
Ship and aircraft controllers andtechnicians
140 15 11 48 82 48
Medical and pharmaceuticaltechnicians
47 2 0 49 0
Nursing and midwifery associateprofessionals
53 7 1 64 0 0
Veterinary technicians and assistants 1 0 0 100 0
Other health associate professionals 65 6 5 38 60 14
Financial and mathematical associateprofessionals
145 13 4 43 100 83
Sales and purchasing agents andbrokers
34 2 3 32 100 23
Business services agents 24 5 1 33 100 16
Administrative and specialisedsecretaries
204 18 16 53 88 70
Regulatory government associateprofessionals
171 16 3 39 100 104
Legal social and religious associateprofessionals
148 34 31 32 48 25
Sports and fitness workers 55 2 6 35 67 18
Artistic cultural and culinary associateprofessionals
93 4 16 18 50 30
Information and communicationstechnology operations and usersupport technicians
126 2 2 47 100 67
Telecommunications and broadcastingtechnicians
53 5 0 32 0

5 March 2013 - Final 82 of 122
Table A5.3 cont’d: Occupationssupplied by post-secondary providers inTonga
TotalNumberaged 55plus
Numberof foreignworkers
Prop ofTonganswith post-schoolquals
Propforeignworkerswith post-schoolquals
No ofdomesticworkersrequiring-post-schoolquals
Clerical
General office clerks 198 4 3 27 33 13
Secretaries (general) 255 20 14 46 64 47
Keyboard operators 137 2 4 44 50 9
Tellers money collectors and relatedclerks
199 4 3 28 33 10
Client information workers 316 9 10 25 10 0
Numerical clerks 431 19 26 41 42 4
Material-recording and transportclerks
61 0 1 21 0 0
Other clerical support workers 168 6 5 33 80 78
Hospitality & Tourist occupations
Hotel and restaurant managers 104 37 52 50 69 20
Artistic cultural and culinaryassociate professionals
93 4 16 23 50 25
Travel attendants conductors andguides
65 10 5 29 40 7
Cooks 239 2 13 13 31 43
Waiters and bartenders 151 2 10 11 20 14
Building and housekeepingsupervisors
114 4 9 3 0 0
Hairdressers beauticians and relatedworkers
44 3 9 27 67 18
Construction workEngineering professionals (excludingelectrotechnology)
107 8 12 52 83 34
Architects, planners, surveyors &designers
78 5 16 60 88 22
Manufacturing, mining, construction& distribution managers
91 32 18 47 67 18
Building frame and related tradesworkers
1201 86 58 6 16 110
Building finishers and related tradesworkers
143 11 20 18 30 17
Painters building structure cleanersand related trades workers
67 2 2 16 50 23

5 March 2013 - Final 83 of 122
Table A5.3 cont’d: Occupationssupplied by post-secondary providers inTonga
TotalNumberaged 55plus
Numberof foreignworkers
Prop ofTonganswith post-schoolquals
Propforeignworkerswith post-schoolquals
No ofdomesticworkersrequiring-post-schoolquals
Other tradesSheet and structural metal workersmoulders and welders and relatedworkers
32 3 12 25 25 0
Blacksmiths toolmakers and relatedtrades workers
5 0 0 20 0
Machinery mechanics and repairers 409 26 23 18 39 87
Printing trades workers 34 1 1 18 100 28
Electrical equipment installers andrepairers
152 6 4 32 50 28
Electronics and telecommunicationsinstallers and repairers
51 1 1 39 100 31
Food processing and related tradesworkers
169 10 8 8 38 49
Wood treaters cabinet-makers andrelated trades workers
15 2 1 7 0 0
Garment and related trades workers 85 16 6 9 17 6

5 March 2013 - Final 84 of 122
Chapter Six: Tongan participation in regional andinternational labour markets
Tongans have a strong migrant presence in three countries: New Zealand, Australia and theUSA. This chapter presents data on the job profiles of Tongans in New Zealand, andAustralia; highlights the changing nature of the skills migration polices of Australia and NewZealand and reports on the skills profile expected of migrants to these countries and to theUSA. Also addressed are the opportunities for Tongan seafarers.
Tongans living in New Zealand
In New Zealand, the most recent data available are for the 2006 census. The New Zealandcensus shows that the Tongan community grew more than threefold between 1986 and 2006from 13,600 to over 50,500 residents. Of these, 29,163 were aged 15 years and over. Of those15 years and over, 56 per cent were employed, 14 per cent had no source of income (12.5 percent for males and 15.4 for females). The remainder were receiving some form of income,mostly from government.56
The largest occupation group for Tongans resident in New Zealand is labouring (see TableA6.1). This is followed by ‘technicians & trades workers’ and ‘machinery operators &drivers’. Also important occupations are: ‘community & personal service workers’ and‘professionals’, followed by ‘clerical & administrative workers’ and ‘sales workers’. Just overone-in-four of these jobs (28 per cent) require middle-level skills and above (ManagersProfessionals Technicians and trades workers). However, for men, near to one-in-three (32per cent) are in a middle-level occupation or above compared with just above one-in-fivewomen (22 per cent).
There are marked differences between men and women in most occupations (see Table A6.1).The sex differences are greatest for ‘technicians & trades workers’ and ‘machinery operators& drivers’ and are significant for ‘community & personal service workers’, ‘clerical &administrative workers’ and for professionals. In other words, the main occupations womenare working in are: labourers, community & personal service workers, clerical &administrative workers, professionals, and sales workers. The main jobs for men are:labourers, technicians & trades workers, machinery operators & drivers, professionals,managers & community & personal service workers.
The income of Tongans in New Zealand in 2006 varies widely from one-in-ten on zeroincome to over one-in-ten (12.3 per cent) on $30,001-$40,000 See Table A6.2).
56 http://www.stats.govt.nz/Census/2006CensusHomePage/QuickStats/quickstats-about-a-subject/pacific-peoples/tables.aspx

5 March 2013 - Final 85 of 122
Tongans living in Australia
Information from the 2011 Australian census reveals that there are 9,209 people born inTonga who are resident in Australia. Of these, 4,479 are employed in the occupational groupsshown in Table A6.3. As with the Tongan population in New Zealand, the largest occupationgroup is labouring although the proportion in this occupation is larger (28 per cent comparedwith 22 per cent in New Zealand). The next largest group is ‘machinery operators and drivers’which is double the proportion of the Tongans in work in New Zealand. The next importantgroupings are: Community & Personal Service Workers; Professionals; and Clerical &Administrative Workers. The share of occupations at middle-level skills or higher (ManagersProfessionals Technicians and trades workers) is one-in-five (20 per cent) compared with one-in-four in New Zealand (28 per cent). Tongans in Australia are concentrated in occupationsbelow middle skill level.
There are marked differences in occupations between men and women. Table A6.4 presentsdata on the top 25 occupations of Tongan men compared with women who are resident inAustralia. The top ten occupations for men are: forklift drivers, storepersons, security officers& guards, crop farm workers, truck drivers, packers, registered nurses, machine operators,building & plumbing labourers, and engineering production workers. The top ten occupationsfor women are: registered nurses, nursing support & personal care workers, aged & disabledcarers, packers, storepersons, commercial cleaners, crop farm workers, child carers, generalclerks, and kitchenhands
The main occupations that require TVET level training are: nursing support and personal careworkers, aged and disabled carers, concreters, structural steel and welding trades workers,child carers, and structural steel construction workers (see Table A6.6).
Education levels of Tongans in Australia
Over a majority (59 per cent) of Tongans resident in Australia aged 15 years and over and notin education have completed Year 12 or higher, with 29 per cent having completed Year 10 or11, one-in-ten (10 per cent) have completed up to Year 9 and 7 per cent did not go to school.Over one-in-four (28 per cent) have a post-school qualification. One-in-six (15 per cent) havea certificate, 6 per cent have a Diploma or Advanced Diploma, one-in-twenty (5 per cent) hasa bachelor’s degree and 2 per cent have a postgraduate qualification.
Income earned by Tongans in Australia
Data are also available on the income levels of Tongans resident in Australia. One-in-twentyhave no income, a negative income or have not stated their income. The largest number ofTongans are earning $31,200-$41,599 and over one-in-six (17 per cent) are earning over$52,000. The income earned varies by year left secondary education and type of post-schoolqualification. Year left school affects earnings. Of the Tongans who left secondary school inYear 8 or 9, only 14 per cent are earning above $41,600. Of those who have completed Year10 or 11, over a quarter, (27 per cent) are earning above $41,600. Of those with Year 12 andabove, over one-in-three (37 per cent) are earning above $41,600.

5 March 2013 - Final 86 of 122
The type of post-school qualifications also affects the earnings of Tongans. Of those with acertificate or a diploma, two-in-five (39 per cent) are earning above $41,600. Of those with adegree or higher, three-in-five (60 per cent) are earning above $41,600.
Profile of Tongan migrants to New Zealand
According to New Zealand’s Immigration statistics, some 19,076 Tongans have entered NewZealand as migrants entitled to residence between 1 July 1997 to 3 November 2012. MostTongan migrants have entered through the international/humanitarian stream, specifically thePacific Access Program since 2002/03. Or they enter as members of the family of theprincipal applicant for migration through the Parent, Sibling, Adult, Child Stream or theUncapped Family Sponsored Stream. The number of principal applicants for migration hasbeen 10,528.
Not recorded in the above data are the temporary workers entering New Zealand under theRecognised Seasonal Worker Program. Data for this program show that this number has risenfrom 829 workers in 2007/08 to 1,678 workers in 2011/12.
It is important to note that less than one-in-ten long-term migrants to New Zealand over thelast 15 years (or 1,688 in number) have entered under the business or skilled category. Thenumber of Tongan migrants using the skilled migrant entry stream since financial year 2004-05 is even lower at one-in-twenty or 491 skilled migrants. Their actual numbers by year ofentry are shown in Figure 1 below. From a peak of 304 in the financial year 1998/99, thenumber of skilled or business entry migrants has declined to a low of 19 and 27 in years2005/05 and 2006/07. Their number has only risen to 69 and 68 in the last two financial years.
Figure 1: Tongan approved residence migrants to New Zealand by residencesubstream & financial years 1997/98 to 2011/12, numbers for skilled migrantsonly
105
304
171219
104164
96 59 19 2782 73 112 69 68
0
200
400
600
800
1,000
1,200Skilled migrant
PAC & Other
Family & Partners
Source: R1_Residence decisions by FY: 5 Nov 2012, NZ Department of Labour (Immigration)

5 March 2013 - Final 87 of 122
The conclusion to be drawn from these data is that relatively few Tongan migrants to NewZealand in the past 15 years have gained entry on the basis of the skills they hold. Informationon the occupations of applicants for work visas for the last four years to 2011/12 whichincludes Pacific Access applicants shows that most Tongan migrants approved to work inNew Zealand are labourers, and community & personal service workers (61 per cent).Technicians & trades workers account for 16 per cent and professionals account for 10 percent of all work visas approved. The remaining occupations of machinery operators & driversmanagers, clerical & administrative workers, and sales workers account for 13 per cent of allapproved work visas.
Essential Skills Stream
Essential Skills is a temporary visa stream to respond to temporary or seasonal regional labourmarket needs. Half of the work visa applicants from Tonga are labourers, machine operatorsand drivers and sales workers. Technicians and trade workers account for 19 per cent andprofessionals account for 8 per cent of Tongan migrants approved to work under the EssentialSkills Stream. The number of Technicians and trade workers between 2008/09 and 2011/12who were granted a work visa under Essential Skills Stream was 164. Some 124 people whowere Community and Personal Service Workers also migrated to work in New Zealand.
Skilled Migrant Category
The occupations of Tongan approved applicants for New Zealand residence under the SkilledMigrant Category since 2008/09 to 2011/12 are mostly skilled workers or professionals. Ofthe 83 Tongans who were granted NZ residence under this skilled worker category, nearlyhalf (47 per cent) were technicians and trades workers. Another 36 per cent wereprofessionals by occupation. Both broad groups accounted for 83 per cent of all approvedapplicants. The other occupational groups were: managers, and community & personalservice workers (7 per cent respectively) and clerical & administrative workers (2 per cent).
These data show clearly that Tongans with a technician or trade qualification have thegreatest chance of gaining residence in NZ through the Skilled Migrant category. This is amajor change from the earlier period 2003/04 to 2007/08 when half of the approvedapplicants for skill migrant entry (78 persons in total) were professionals and only 13 per centwith technicians or trades workers.
Data on the occupations of Tongans approved for Skilled Migrant entry to NZ show that themost important occupations are: telecommunications technician, ship's engineer, diesel motormechanic, fitter-welder and welder (first class), prison officer, carpenter and chef.
Tongan migration to Australia
Over a longer period, based on arrival in Australia between 1 January 2002 to 1 January 2012,1,483 Tongans migrated directly to Australia, of whom only 195 entered as skilled migrantsand 1,231 entered under the family category.57 Tongans can migrate to Australia for workmaking use of either temporary visas or a Permanent Migration visa. For visas for temporarywork, there are two options: Subclass 457 and the new Seasonal Workers Program (formerly
57 Department of Immigration & Citizenship, 2012, Settlers By Country of Birth (Settlement) by MigrationStream, 18 September, p 15.
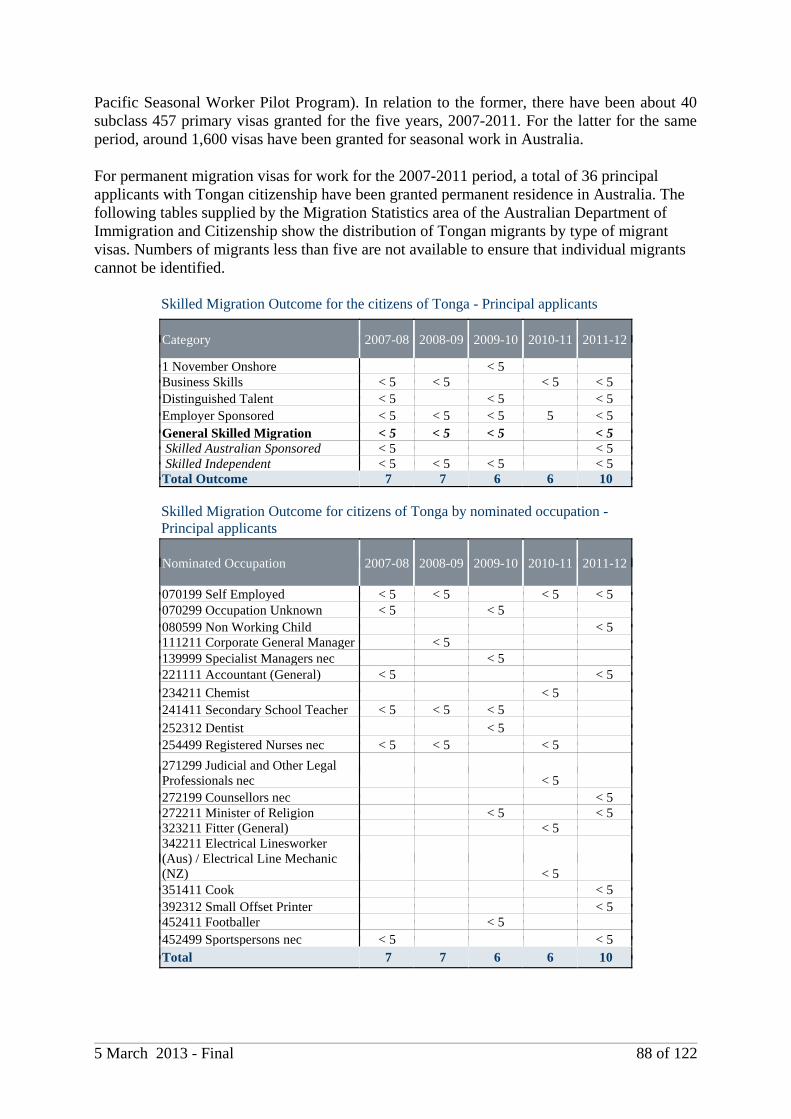
5 March 2013 - Final 88 of 122
Pacific Seasonal Worker Pilot Program). In relation to the former, there have been about 40subclass 457 primary visas granted for the five years, 2007-2011. For the latter for the sameperiod, around 1,600 visas have been granted for seasonal work in Australia.
For permanent migration visas for work for the 2007-2011 period, a total of 36 principalapplicants with Tongan citizenship have been granted permanent residence in Australia. Thefollowing tables supplied by the Migration Statistics area of the Australian Department ofImmigration and Citizenship show the distribution of Tongan migrants by type of migrantvisas. Numbers of migrants less than five are not available to ensure that individual migrantscannot be identified.
Skilled Migration Outcome for the citizens of Tonga - Principal applicants
Category 2007-08 2008-09 2009-10 2010-11 2011-12
1 November Onshore < 5Business Skills < 5 < 5 < 5 < 5Distinguished Talent < 5 < 5 < 5Employer Sponsored < 5 < 5 < 5 5 < 5General Skilled Migration < 5 < 5 < 5 < 5 Skilled Australian Sponsored < 5 < 5 Skilled Independent < 5 < 5 < 5 < 5Total Outcome 7 7 6 6 10
Skilled Migration Outcome for citizens of Tonga by nominated occupation -Principal applicants
Nominated Occupation 2007-08 2008-09 2009-10 2010-11 2011-12
070199 Self Employed < 5 < 5 < 5 < 5070299 Occupation Unknown < 5 < 5080599 Non Working Child < 5111211 Corporate General Manager < 5139999 Specialist Managers nec < 5221111 Accountant (General) < 5 < 5234211 Chemist < 5241411 Secondary School Teacher < 5 < 5 < 5252312 Dentist < 5254499 Registered Nurses nec < 5 < 5 < 5
271299 Judicial and Other LegalProfessionals nec < 5272199 Counsellors nec < 5272211 Minister of Religion < 5 < 5323211 Fitter (General) < 5342211 Electrical Linesworker(Aus) / Electrical Line Mechanic(NZ) < 5351411 Cook < 5392312 Small Offset Printer < 5452411 Footballer < 5452499 Sportspersons nec < 5 < 5Total 7 7 6 6 10
5 March 2013 - Final 89 of 122
The information about the permanent migrant visa shows the importance of direct employersponsorship. This type of work visa ensures that the migrant has a specific job to go to. Theskilled independent category means that the migrant has to find a job under their initiative,not easy to do, especially for work matched to the migrant’s recognised skill level. The mostimportant occupations of the Tongan skilled migrants to Australia seem to be: self employed,secondary school teacher, registered nurse, and sportsperson. However, the overall numbers(36) are low and the distribution wide, so it is hard to identify any occupation group as morethan another.
Current demand for skilled labour in Australia and New Zealand
Manpower Group has some 3,800 offices in over 80 countries and territories. The companyconducts an annual survey of employers hiring intentions by asking them about whether theyare having difficulty filling talent; and what jobs are most difficult to fill and why. A surveyof employers in Australia and New Zealand in the first quarter of 2012 revealed that half arehaving difficulty filling jobs.58
The jobs Australian employers are having the greatest difficulty in filling are: skilled tradesworkers, engineers, sales representatives, accounting & finance staff, IT staff, management,technicians, drivers, mechanics, and chefs/cooks. For the seventh consecutive year of thesurvey, employers report that skilled trades positions are the most difficult type of vacancyacross Australia.59 The list for New Zealand is similar: engineers, sales representatives, skilledtrades workers, IT staff, technicians, accounting & finance staff, management/executives,chefs/cooks marketing, public relations/communications staff, and drivers.60 One-in-five NewZealand employers and one-in-four Australian employers report that they are willing to lookoutside their own region and country for suitable workers.61
Skilled migration to Australia and New Zealand
The United States lacks a permanent resident skilled migration category; instead it admits onemillion low-skilled migrants per year. Australia, New Zealand, and Canada, by contrast, haveover the last decade given priority to migrants with skills-in-demand.62
In the decade since 2000, there has been extraordinary growth in skilled migration to NewZealand and Australia, through both permanent and temporary entry. Between 2004/05 and2008/09, Australia selected 358,151 permanent General Skilled Migration migrants, includingdependants. In 2009/10 Australia allocated 59 per cent of its permanent migration places toskilled applicants, 33 per cent to Family Category entrants, and 8 per cent to HumanitarianCategory entrants, out of a programme total of 182,450.
New Zealand had a planned overall intake of 45,000-50,000 people, including secondaryapplicants, across the: Skilled/Business Category: (60 per cent); Family (Partner andDependent Child); Category: (21 per cent); Family (Parent, Adult Child and Adult Sibling)
58 ManpowerGroup, 2012 Talent Shortage Survey Australia and New Zealand, pp 13 & 17.59 See Note 36, p 13.60 See Note 36. p 17.61 See Note 36, p 15 & 19.62 Hawthorne, L; 2011, Competing for Skills: Migration policies and trends in New Zealand and Australia.Department of Labour PO Box 3705 Wellington New Zealand p xiii. The following information on thedifferences between Australia and New Zealand is drawn from the Hawthorne report.

5 March 2013 - Final 90 of 122
Category: (11 per cent); and the International/Humanitarian Category: (8 per cent).
The top five professions of skilled migrants to Australia in the period 2004 to 2009 wereaccounting (32 per cent), computing (23 per cent), architecture/building (9 per cent),engineering (9 per cent), and nursing (5 per cent). The major trades of skilled migrants werechefs/bakers (30 per cent of trade arrivals), engineering (14 per cent), building excludingplumbing (14 per cent), electrical (12 per cent), and hairdressing (12 per cent).
For New Zealand, computing and education were the major occupations for skilled migrantprofessionals, both constituting 18 per cent of all professionally qualified skilled migrants),followed by registered nurses (17 per cent), architects and engineers (15 per cent), business,human resource, and marketing professionals (15 per cent), and health professionals (9 percent).63
Occupational demand is a key determinant of migrant selection in both countries, There hasbeen a rising points threshold for skilled category selection to both countries. From 2004/05to 2008/09, 58 per cent of Australia's 457 temporary visa arrivals were working inprofessional fields (compared with 66 per cent of permanent general skilled migrant arrivals).Seventeen per cent were in the trades, 13 per cent were associate professionals, and 10 percent were managers and administrators. Just 2 per cent possessed lower level skills, despitethe pressures of the mining boom and the existence of select low- skilled schemes (such as therecruitment of abattoir workers).
The primary General/Essential Skills groups entering New Zealand from 2004/05 to 2008/09were clerical, sales and service workers (21 per cent), followed by 19 per cent in professionaloccupations, 15 per cent in the trades, 11 per cent who were managers and administrators, 11per cent who were associate professionals, and 8 per cent who were labourers. The majorprofessions in 2008/09 were health and life sciences, including nursing (8,999), and teachersand lecturers (4,163). Two groups dominated the 19,791 trades total that year: mechanic andfabrication engineering (6,299) and automotive, mechanical, and building workers.
An important new trend is a greater rôle for employer selection in both countries. Accordingto the Hawthorne report: ‘Employers in both countries have come to exert extraordinaryinfluence on permanent as well as temporary entry flows’.64 Australian employers in selectingmigrants for temporary work visas are emphasising people with high-level English languageability. They are also seeking people from comparable high-quality education systems, andwant applicants who can fit into the workplace at speed. New Zealand's temporary skills entrystream (General/Essential Skills Category) has long allowed employers to assess thesuitability of applicants for permanent skilled migrant status. Australia's priority rankingsystem is moving in the same direction.65
Australia and New Zealand publish skills shortages lists. New Zealand’s Immediate SkillsList has over 70 occupations listed. Australian Immigration lists over 440 occupations eligiblefor the General Skilled Migration visas and 126 of these are middle-level occupations (seeTables A6.8 & A6.9).
63 See Note 40, p xv.64 See Note 40, p 157.65 See Note 40, p 157.

5 March 2013 - Final 91 of 122
Tongans living in the United States
According to 2010 US census data, just over 57,000 people of Tongan ethnicity live in theUSA.66 California has the most Tongans with some 22,850, followed by Utah with 13,235Tongans, and Hawaii, with some 8,000. Nearly, 13,000 live in the other states.67
Information on the occupations held by Tongans is only available for a larger group of PacificIslanders resident in the USA. This group includes the original peoples of Hawaii, Guam,Samoa or other Pacific Islands. The 2006-2010 American Community Survey conducted bythe US Census Bureau provides details on the occupations of this larger grouping (see TableA6.10 below).
Many Tongans working in the USA are likely to be found in jobs that require less thanmiddle-level skills. These jobs are administrative support workers; service and sales workersand transportation & material moving operative workers. However, middle-level skills andabove are needed in many cases for management, business & financial workers; otherprofessional workers; and construction & extractive craft workers. The importance ofdifferent occupation groups varies for men and women.
The most important jobs for Tongan men in the USA are likely to be: service workers, exceptprotective work; construction & extractive craft workers; administrative support workers; andtransportation & material moving operative workers; and labourers & helpers. Only oneimportant occupation group for men requires middle-level skills above the craft level:management, business & financial workers.
Tongan women resident in the USA are also likely to be in occupations that do not requiremiddle-skills above craft level. These are administrative support workers, and service & salesworkers. However, middle-level skills are important for women in the following occupations:management, business & financial workers; other professional workers and healthcarepractitioner professionals.
Need for higher education levels for immigrants in the US
Higher levels of education are needed for migrants to obtain secure work in the USAcompared with a generation ago. The share of working-age immigrants in the United Stateswho have a bachelor's degree has risen considerably since 1980, and now exceeds the sharewithout a high school diploma. In 1980, just 19 per cent of immigrants aged 25 to 64 held abachelor's degree, and nearly 40 per cent had not completed high school. By 2010, 30 per centof working-age immigrants had at least a college degree and 28 per cent lacked a high schooldiploma.68
66 Table 5. Native Hawaiian and Other Pacific Islander (NHPI) Population by Number of Detailed Groups: 2010,The Native Hawaiian and Other Pacific Islander Population: 2010, 2010 Census Briefs, issued May 201267 See Figure 6 Per centage Distribution of Largest Detailed Native Hawaiian and Other Pacific Islander Groupsby State: 2010, The Native Hawaiian and Other Pacific Islander Population: 2010, 2010 Census Briefs, issuedMay 201268 Matthew Hall, Audrey Singer, Gordon F. De Jong, & Deborah Roempke Graefe, 2011, The Geography ofImmigrant Skills: Educational Profiles of Metropolitan Areas. The Metropolitan Policy Program, BrookingsInstitution, Washington DC, June, p 1.

5 March 2013 - Final 92 of 122
Forty-four of the US's 100 largest metropolitan areas are high-skill immigrant destinations. Inthese cities, college-educated immigrants outnumber immigrants without high schooldiplomas by at least 25 per cent. These destinations include large coastal metro areas like SanFrancisco. The 30 low-skill destinations, in which the relative sizes of these immigrant skillgroups are reversed, include many in the border states of the West and Southwest, as well asin the Mid West.69
Nursing in the USA
The US has recently become the world’s largest importer of nurses, surpassing the UnitedKingdom. Although the UK has historically depended on foreign nurses to a larger extent, inrecent years, they have adopted stricter regulations on the hiring of foreign-educated nurses.70
The average age of nurses working in the US is more than 45 years, indicating that aging ofthe nursing labour force.71 With the nurse shortage projected to grow substantially in the nearfuture, the US will have to rely more heavily on foreign nurses to meet the demand.72
The share of foreign educated nurses taking the US examination for Registered Nursesincreased from 6 per cent in the mid-1980s to close to 20 per cent in the mid-2000s.73 Thecomposition of foreign nurses has also changed over time. The Philippines has emerged as thesingle largest source of nurses educated abroad, representing more than half of foreign nursesentering the US in the last decade. Filipino nurses are also more likely to have bachelordegrees (84 per cent) compared with other foreign-born nurses in the US (45 per cent) whoare more likely to have only a diploma. They also earn a higher hourly rate than other foreign-born nurses, due to the fact that they are more likely to work in hospitals, work full-time anddo shift work.74 This profile of opportunities for foreign-born nurses in the US shows thataccess to better paid positions is highly competitive.
Maritime work for Tongans
Existing maritime workforce
There are opportunities for Tongans to work as seafarers on foreign-owned vessels in theregion. The Tonga Maritime Polytechnic Institute in 2009 had manning contracts with threeshipping companies. Oceangas Australia Pty Ltd, which operates LPG Gas tankers in thePacific employed 23 Tongans plus a trainee. Inco Ships Australia Pty Ltd operatesconventional bulk carriers, complex self-unloading bulk cargo ships, as well as fullyautomated powder cement carriers. Inco Ships also operate crewing recruitment agencies inSydney and Manila and offers crew supply services on a lump sum basis for any type ofvessel. The company employed 43 Tongans in 2009. Pacific International Lines (PIL) fromSingapore employed 14 Tongan crew in 2009. The 2009 report notes that 44 Tongan seafarersare employed by SCP (Shipping Corporation of Polynesia).
69 See Note 47, p 1.70 Patricia Cortes & Jessica Pan, 2012 ‘The Relative Quality of Foreign Nurses in the US’ June, Working Paper,p 271 See Note 49, p 8.72 See Note 49, p 1.73 See Note 49, p 8.74 See Note 49, p 9.

5 March 2013 - Final 93 of 122
The number by type of positions these seafarers held on vessels operating in Tonga andelsewhere is shown in Table A6.11. Just over half (55 per cent) are Able or Ordinary Seaman.Only just over one-in-three (35 per cent) have positions with higher qualifications (ChiefOfficer to Master Mariner). There appears to be considerable scope for existing Tonganseafarers to obtain higher qualifications.
A 2009 report on the Maritime Polytechnic Institute noted there was a demand from Oceangasfor junior officers trained to a level of Master 3 to the International Maritime Organisationstandard. They also require advanced fire-fighting and Global Maritime Distress SafetySystem (GMDSS) general operator certificates to work on the gas tankers.75 Other examplesof the demand for higher skills are also given.76
The deep sea fishing industry and the rôle of observers
A significant opportunity for work on foreign vessels is the Observer Programs of the Westernand Central Pacific Fisheries Commission (WCPFC) and the Forum Fisheries Agency.Observers are placed on board tuna fishing vessels across the region to report on fishingcatches and methods.77 Often they travel with the fishing vessels, being away at sea for weeksor months at a time, to gather independent information about what is happening at sea. Theymake notes of how much fish is caught, what type of fish are caught, what methods are usedto catch fish, and whether they observed any breaches to laws and regulations. Thisinformation is then fed back into central databases so regional agencies and nationalgovernments can keep track of what fishing vessels are doing and whether fishing laws andregulations are being implemented. Debriefers meet observers when they come back to port tocheck their data and provide feedback. They also discuss any issues observers have such asrelations with the crew and payment of relevant salary and allowances.
Observers are placed on deep sea fishing vessels, including US, Japanese, Korean andTaiwanese vessels. Fishing vessels are obliged to provide observers with a bed and food forthe time they are on-board the ship. Observers earn approximately USD $30-50 a day.Observers need maritime training on how to live and work on a vessel at sea, how to take partin fire fighting drills, navigation, basic first aid and sea safety training.
Tonga is a member of the Regional Observers Program of the Western and Central PacificFisheries Commission. However, observers from Tonga are placed by the Tongan FisheryDepartment on vessels fishing in their waters. In November, 2012, the Government Tongaentered into a Memorandum of Understanding (MOU) with the Pacific Islands ForumFisheries Agency. This agreement is to provide fisheries observer services to the US purse-seine tuna fleet operating in the Western and Central Pacific Ocean.78 For these services, theTongan Division of Fisheries' observer programme has been paid US$77,125 to coordinate 25observer placements on US-flagged vessels over the next twelve months. This funding is toemploy and train the observers as well as developing the national infrastructure needed tosupport this capacity expansion.
75 Vocational Training in the Maritime Sector: the Way Forward. Interim Report, November 2009, p 7.76 See Note 45, p 7.77 The following description is taken from the Observer Program, Pacific Islands Forum Fisheries Agencyhttp://www.ffa.int/system/files/2%20MINUTE%20BRIEFS_Observers_regional%20factsheet.pdf78 Tongan Ministerial Visit to FFA (Forum Fisheries Agency), Honiara, Solomon Island, Press Release forConsideration - Tongan Ministerial Visit. http://www.tongafish.gov.to/

5 March 2013 - Final 94 of 122
The potential to make more use of Tongan observers on foreign vessels depends on whetherthe government allows foreign fishing vessels access to Tongan waters and how many vesselsgranted access require observers. Most tuna foreign vessels who want to access to Tonganwaters are likely to use longline fishing where there is a regionally agreed observer coverageof only five per cent of vessels. This would create some opportunities on a small-scale forTongan observers.
However, the agreed five per cent coverage of longline fishing vessels is minimum coverage.A higher proportion of vessels required to carry observers could be imposed as part of accessagreements. If a 100 per cent observer coverage of all foreign vessels fishing in Tonganwaters was required, this would create many more opportunities for Tongan nationals to beemployed as observers.

5 March 2013 - Final 95 of 122
Annex 6
Table A6.1 : Occupations of Tongans resident in New Zealand 2006, per cent
Occupation Males Females Total
Managers 6.2 5.1 5.8
Professionals 6.2 12.9 9.2
Technicians and trades workers 19.5 3.7 12.6
Community and personal serviceworkers
5.6 15.3 9.8
Clerical and administrative workers 3.9 13.0 7.9
Sales workers 3.8 10.4 6.7
Machinery operators and drivers 18.2 5.3 12.6
Labourers 22.9 20.0 21.6
Not elsewhere included(1) 13.6 14.1 13.8
Total 100.0 100.0 100.0
N 8,931 6,888 15,819
(1) Includes Response unidentifiable, Response outside scope and Not stated.Source:
Table A6.2: Distribution of personal income of Tongans resident in NewZealand, 2006, per cent
Total personal income 2006Loss 0.9Zero income 9.8$1–$5,000 9.8$5,001–$10,000 9.1$10,001–$15,000 7.7$15,001–$20,000 6.6$20,001–$25,000 7.0$25,001–$30,000 7.7$30,001–$40,000 12.3$40,001–$50,000 5.4$50,001–$70,000 3.5$70,001–$100,000 1.1$100,001 or more 0.4Not stated 18.7
Total 100.0N 29,163

5 March 2013 - Final 96 of 122
Table A6.3: Occupation distribution of Tongans resident in Australia 2011,per cent
Occupation - one digit level percent
1 - Managers 2.4 2 - Professionals 12.7 3 - Technicians and Trades Workers 4.6 4 - Community & Personal Service Workers 18.0 5 - Clerical And Administrative Workers 6.3 6 - Sales Workers 1.8 7 - Machinery Operators and Drivers 25.9 8 - Labourers 28.3
100.0N 4479

5 March 2013 - Final 97 of 122
Table A6.4: The main occupations of Tongans by birth in Australia, 2011
Occupations at 4 digit level Male Occupations at 4 digit level Female
Forklift Drivers 261 Registered Nurses 326
Storepersons 241Nursing Support & Personal CareWorkers
266
Security Officers & Guards 182 Aged & Disabled Carers 164
Crop Farm Workers 165 Packers 157
Truck Drivers 153 Storepersons 85
Packers 117 Commercial Cleaners 54
Registered Nurses 101 Crop Farm Workers 50
Machine Operators nfd 87 Child Carers 46
Building & Plumbing Labourers 76 General Clerks 44
Engineering Production Workers 75 Kitchenhands 43
Concreters 63 Food & Drink Factory Workers 41
Structural Steel & Welding TradesWorkers
59 Sales Assistants (General) 34
Freight & Furniture Handlers 50 Bank Workers 30
Metal Engineering Process Workers 48 Forklift Drivers 30
Ministers of Religion 45 Retail Managers 23
Structural Steel ConstructionWorkers
43 Receptionists 23
Nursing Support & Personal CareWorkers
39 Machine Operators nfd 22
Food & Drink Factory Workers 35 Inquiry Clerks 20
Aged & Disabled Carers 34 Laundry Workers 20
Labourers nfd 34 Product Assemblers 20
Commercial Cleaners 33Contract, Program & ProjectAdministrators
19
Meat, Poultry & Seafood ProcessWorkers
31 Accounting Clerks 18
Sales Assistants (General) 27Meat, Poultry & Seafood ProcessWorkers
16
Bus & Coach Drivers 27Checkout Operators & OfficeCashiers
15
Motor Mechanics 25 Welfare Support Workers 12

5 March 2013 - Final 98 of 122
Table A6.5 : The top twenty occupations of Tongans in Australia that requireTVET training, 2011, number in each occupation
Occupations at 4 digit level Total
Nursing Support and Personal Care Workers 305
Aged and Disabled Carers 198
Concreters 66
Structural Steel and Welding Trades Workers 59
Child Carers 49
Structural Steel Construction Workers 43
Bank Workers 30
Motor Mechanics 28
Purchasing and Supply Logistics Clerks 26
Welfare Support Workers 25
Contract, Program and Project Administrators 22
Accounting Clerks 21
Metal Fitters and Machinists 20
Transport and Despatch Clerks 19
Butchers and Smallgoods Makers 13
Printers 12
Construction Managers 11
Production Managers 9
Carpenters and Joiners 9
Electricians 9

5 March 2013 - Final 99 of 122
Table A6.6: Approved work visas to New Zealand, financial years 2008/09 to2011/12, per cent
Occupation (ANZSCO) Percent
Labourers 43.8
Community & Personal Service Workers 17.5
Technicians & Trades Workers 15.6
Professionals 9.9
Machinery Operators & Drivers 6.8
Managers 3.2
Clerical & Administrative Workers 2.0
Sales Workers 1.3
100.0N 1,510W3 Occupations of Work apps approved, NZ Dept ofLabour (Immigration), 5 November 2012
Table A6.7: The detailed occupations of Tongans granted NZ residence in thetechnician & trades grouping, for financial years 2008/09 to 2011/12, number
Occupation NTelecommunications Technicians 6Fitter-Welders + Welder (First Class)(Aus)/Welder (NZ)
4 + 2
Ship's Engineers 5Diesel Motor Mechanics 4Prison Officers 4Carpenters 3Chefs 3Baker 2Bricklayer 2Sheetmetal Trades Worker 2Cabinetmaker 1Carpenter and Joiner 1Developer Programmer 1Diagnostic and Interventional Radiologist 1Diversional Therapist 1Electrical Linesworker (Aus)/Electrical LineMechanic (NZ) 1Electrician (General) 1ICT Support Technicians nec 1Mechanical Engineering Technician 1Motor Mechanic (General) 1Painting Trades Worker 1Panelbeater 1

5 March 2013 - Final 100 of 122
Table A6.8: Consolidated Sponsored Occupation List Schedule 2, SkilledMigration Visa, Australia
Selected Australian Middle-skill Occupations in demand
Agricultural Technician Fisheries OfficerPrimary Products Inspectors notelsewhere classified
Apparel Cutter Floor Finisher Print Finisher
Arborist Florist Printing Machinist
Architectural Draftsperson Furniture Finisher Quarantine Officer
Baker Gardener (General) Roof Tiler
Blacksmith Gas or Petroleum Operator Safety Inspector
Bricklayer Graphic Pre-press Trades Worker Sail Maker
Broadcast Transmitter Operator Hairdresser Saw Maker & Repairer
Building & Engineering Technicians Hardware Technician School Laboratory Technician
Building Associate ICT Customer Support Officer Screen Printer
Building Inspector ICT Support Technicians Shoemaker
Butcher or Smallgoods Maker Landscape Gardener Signwriter
Cabinetmaker Life Science Technician Small Offset Printer
Cabler (Data andTelecommunications)
Light Technician Sound Technician
Camera Operator (Film, TV or Video) Maintenance PlannerSurveying or Spatial ScienceTechnician
Chef Make Up Artist Telecommunications Cable Jointer
Chemistry Technician Meat Inspector Telecommunications Linesworker
Clothing Patternmaker Mechanical Engineering Technician Telecommunications TechnicianClothing Trades Workers notelsewhere classified
Mechanical EngineeringDraftsperson
Television Equipment Operator
Communications Operator Medical Laboratory TechnicianTextile, Clothing & FootwearMechanic
Construction Estimator Metal Casting Trades Worker Toolmaker
Cook Metal Fitters & Machinists nec Vehicle Body Builder
DiverMusical Instrument Maker orRepairer
Vehicle Painter
Dressmaker or Tailor Nurseryperson Vehicle Trimmer
Earth Science Technician Optical Dispenser Veterinary Nurse
Electronic Engineering Draftsperson Optical Mechanic Wall & Floor Tiler
Electronic Engineering Technician Panelbeater Web Administrator
Electroplater Pastry cook Wood Machinist
Engraver Picture Framer Wood TurnerFire Protection EquipmentTechnician
Power Generation Plant Operator

5 March 2013 - Final 101 of 122
Table A6.9: Selected middle-level occupations and required work standardsfor visa applicants with an offer of work, from the 'Immediate Skill ShortageList', effective 5 December 2011, Immigration New Zealand
OccupationGroup Middle-level occupations
Required standard for work visa applicants with anoffer of employment
Agriculture andForestry
Arborist Trade Certificate AND/OR National Certificate in HorticultureArboriculture Level 4 AND a minimum of two years’ relevantexperience
Construction Construction Project Manager (Foreman)(Roading and Infrastructure)
At least five years’ experience in building ormaintaining roads & Staff management experience& appropriate drivers licence
Construction Surveying Technician (Spatial ScienceTechnician/HydrographicTechnician)
National Certificate in Surveying (HydrographicSurveying) Level 4
Construction Surveying Technician (Spatial ScienceTechnician/Land Surveyor'sTechnician)
Bachelor or Diploma of Surveying& two years’ relevant work experience
Engineering Civil Engineering DraughtspersonElectrical Engineering DraughtspersonElectronic Engineering DraughtspersonMechanical Engineering Draughtsperson
National Diploma in Engineering Level 6OR equivalent
Recreation,Hospitalityand Tourism
Café and Restaurant Manager (including BarManager)
National Certificate in Hospitality (OperationsSupervision) Level 4, & a minimum of four years’ combinedexperience in hospitality establishments with a minimum oftwo years at supervisory level or higher
Trades Baker National Certificate in Baking (Craft Baking) (Level4) OR National Certificate in Baking (Inshore/Franchise)(Level 4)
Trades Electronic Equipment Trades Worker National Diploma in Engineering (Electrotechnology) (Level6) AND New Zealand registration with the ElectricalWorkers Registration Board
Trades Motor Mechanic (General) (AutomotiveTechnician)
National Certificate in Motor Industry (AutomotiveElectrical and Mechanical Engineering) (Level 4) with strandin Light Vehicle OR National Certificate in Motor Industry(Automotive Engineering) (Level 4) OR NZ Trade Certificatein Automotive Engineering OR NZ Trade Certificate in MotorMechanics AND three years' relevant experience
Trades Motor Mechanic (General) (AutomotiveAir Conditioning Technician)
National Certificate in Motor Industry (AutomotiveSpecialist Engineering) (Level 4) with strand in Heating,Ventilation and Air Conditioning OR National Certificatein Motor Industry (Automotive Air Conditioning) (Level4) AND three years' relevant experience
Trades Motorcycle Mechanic National Certificate in Motor Industry (AutomotiveElectrical and Mechanical Engineering) (Level 4) with strandin Motorcycle OR National Certificate in Motor Industry(Motorcycle Engineering) (Level 4), OR NZ TradeCertificate in Motorcycle Engineering AND at least threeyears' experience
Trades Scaffolder (Advanced) National Certificate in Scaffolding (Level 4) with strandsin Advanced Scaffolding and at least five yearsexperience since obtaining the Level 4 Certificate
Transport Truck Driver (General) NZ recognised Full Class 5 Driver Licence and three yearsexperience driving heavy combination vehicles with a grosscombined weight of more than 25,000kg

5 March 2013 - Final 102 of 122
Table A6.10: Native Hawaiian and Other Pacific Islanders, Civiliansemployed at work 16 years and over, 2006-2010, per cent
Occupation Male Female Total1. Management, business & financial workers 8.3 9.2 8.72. Science, engineering & computer professionals 3.7 1.5 2.73. Healthcare practitioner professionals 0.8 2.5 1.64. Other professional workers 5.6 9.2 7.35. Technicians 2.1 2.4 2.26. Sales workers 7.3 13.0 10.07. Administrative support workers 10.9 28.9 19.48. Construction & extractive craft workers 11.5 0.4 6.39. Installation, maintenance & repair craft workers 7.2 0.7 4.110. Production operative workers 6.1 2.5 4.411. Transportation & material moving operativeworkers 9.6 2.2 6.112. Laborers & helpers 7.6 1.8 4.913. Protective service workers 5.9 2.2 4.114. Service workers, except protective 13.5 23.6 18.2
100.0 100.0 100.0107,525 95,655 203,180
Table A6.11: Number of positions held by Tongan overseas vessel crew andships operated by Shipping Corporation of Polynesia Ltd
Position N Position NChief Officer 2 Wiper 1Second Officer 7 Greaser 3Third Officer 6 Able Seaman (AB) 52Third Engineer 2 Steward 1Fourth Engineer 1 Ordinary Seaman 13First Mate 1 Cook 1Bosun 17 Cook/Steward 1Master Mariner (MM) 6 D/TR 1Fitter 1 E/TR 1Oiler 1 Cadet 1Source: Appendix 5 & 6, Vocational Training in the Maritime Sector: theWay Forward. Interim Report, November 2009

5 March 2013 - Final 103 of 122
Chapter Seven: Indicators of capacity for the Tonganlabour market
The purpose of this chapter is to identify primary indicators of capacity in the Tongan labourmarket. These relate to the supply and demand for skills. How can these indicators be used tohelp ensure there is a better match between the quantity and quality of skills coming onto thelabour market and the requirements of employers?
Key considerations
The starting point for identifying capacity indicators is the need to achieve some balancebetween demand and supply to produce better labour market outcomes. Much criticism hasbeen made of supply-driven training systems. As ADB report Skilling the Pacific notes:
The demand, or employer, side is under-represented in the planning anddirection of TVET systems. Similarly, communities tend not to be involved inidentifying training needs for the informal sector. As a result, trainingoperates in isolation and is supply driven ...
A mental shift is needed. TVET should not be viewed as synonymous witheducation. TVET is providing service and should be demand, not supply,oriented.79
Interventions on the supply side alone such as giving TVET providers more resources,restructuring their operations and applying more top-down management controls cannot bythemselves deliver the labour market outcomes wanted. Systems cannot reform themselves orbuild new capacity if left to their own supply-side focus. Only pressure or 'demand' from end-user groups such as employers, students, parents and government can 'pull' betterperformance out of the system. Use of demand-side pressure on service providers has the bestchance of working in cases where the means and outcomes are clearly understood andmeasurable at the point of delivery.80
An evidence-based understanding of the nature of demand for training is needed. Unexpectedstrong demand, particularly in the short-term, could overwhelm the supply side and start toundermine capacity. Demanders of services may seek more or better services but fail to helpwith the longer-term investments needed to build sustainable capacity or supply. Staff withinthe supplying organisations may became demoralised and opt out, in an effort to escape anyblame. Service providers, for their part, could lose balance. They could either try to expandtoo fast or attempt to do too many things and in the process, lose coherence and capacity. Ortoo much latitude could be given to the service provider and the organisation may lapse backinto self-serving behaviour. Persistent imbalances between demand and supply couldundermine the overall performance of the service provider.81
79 ADB, 2009, Skilling the Pacific: Technical and Vocational Education and Training in the Pacific. AsianDevelopment Bank, Manila, p 125 & 128.80 Heather Baser and Peter Morgan, 2008, Capacity, Change and Performance Study Report. Discussion PaperNo 59B, April, European Centre for Development Policy Management, p 68.81 See Note 62, p 69-70.

5 March 2013 - Final 104 of 122
Capacity indicators for whom?
The chapter on forecasting started with a comment on how top-down, centralised planningmodels of the demand for skills are no longer regarded by policy makers as necessary oruseful. The current view of the World Bank and others is that: ‘... skills-development systemsneed to grow organically from below while being coordinated and fostered from above’.82
Three approaches to the use of indicators
A key issue in developing appropriate indicators is to know their purpose. Three approachesto the use of indicators have been identified: planned, incremental and emergent.83 The use ofindicators for planning purposes to enable a government agency to allocate and coordinateresources flowing to the training providers. This focus shapes what data are collected and bywhom. This top-down management approach assumes that system-wide objectives can beclearly defined, targets can be set to meet these objectives and that training capacity can beeasily shifted to meet the targets. The senior managers in the coordinating agency assumethey can control and manage the process directly and that the training providers can and willrespond to what is asked for.
A planned, top-down approach to service delivery is needed to some extent, if only tocompete for funds within the government’s budget process. However, a sole reliance on thisapproach requires that a number of supporting conditions hold. These include a widely sharedconsensus about policy and direction; the resources to pay for the support systems; and clearand achievable objectives.84 Also needed are good activity-based accounting systems to trackunit costs, outputs and outcomes.
A second approach to the use of indicators can be termed incremental. This approach is basedon the principles of adaptiveness and flexibility in implementation. Strategies can still havepreset objectives and goals, but they function more as guidelines than as actual fixed targets.This approach works best in situations where conditions are unstable and the choice ofstrategy is difficult to clarify. Senior managers in the coordinating agency may be uncertainabout a number of factors affecting the capacity and performance of the service providers,such as institutional constraints or staff commitment. Indicators are needed about theoperation of the service providers to learn what works under different conditions. This allowsa more responsive system to be developed through trial and error. This is especially importantwhere there are conflicting interests and attitudes on the part of service providers.85
The third approach to the use of indicators is called emergent. As discussed above, a plannedchange relies on good system-wide data, prediction, goal-setting, hierarchical structures andtop-down strategy. An incremental approach relies on information which enablesadaptiveness, learning and adjustment. The emergent approach is better suited to situationswhere the behaviour of service providers is difficult to manage in a top-down fashion. In thesesituations, the driving forces for change are relationships, interactions and local energy.
82 World Bank, 2012, World Development Report 2013: Jobs. Washington DC, Box 5.8, p 17783 The following discussion of these approaches and the use of indicators draws heavily on Heather Baser andPeter Morgan, 2008, Capacity, Change and Performance Study Report. Discussion Paper No 59B, April,European Centre for Development Policy Management, pp 68-8084 See Note 62, p 77.85 See Note 62, p 78.
5 March 2013 - Final 105 of 122
A directive, top-down approach has real limitations because often there are too manyunknowns. The best starting point for achieving a close link between training providers andemployer needs is likely to be at the local area or community level. This is where face-to-facerelationships and trust are the most robust and where changes can be more easily achievedthrough the efforts of individuals.
Growing the skills system from below
Forming a group of interested parties, which may involve senior teachers from a secondaryschool, training providers and employers at a local level, can make the most of a shared senseof meaning or values and a collective identity. A local group also offers those involved a goodsense of a manageable area of joint activity. The group will also need some basic rules ofconduct, some resources to track performance, and a protected space that allows for somefreedom of action.
The focus of this approach is on a bottom-up coordination by nurturing relationships and thenwaiting for results and capabilities to emerge. The usual top-down mechanisms of clearobjectives, explicit strategies, scheduled activities, and targets are not applied. The aim is touse indicators to develop local capacity to coordinate training to maximise employmentoutcomes, making good use of community cohesion and energy.
The emergent approach to the use of indicators is to make them part of a process of fosteringlocal level coordination. These indicators could produce variable results as the participantstake time to develop the skills needed to sort out problems. The emergent approach is notgood at getting a set of tasks done in a short period of time. The approach is likely to fituneasily with donors and senior managers in government who want to see more control,direction and accountability for results.
Operating at different levels
In practice, indicators are needed to operate at different levels of activity. Data are needed toassist with the central allocation of funds on the basis of clear criteria and objectives.Information is also needed by a central agency to respond to the differences in capacitybetween training providers and to move each in the desired direction to meet the skills needsof employers. Finally, data should be collected and used at the local level to enable effectiveconnections to be made between supply and demand. These data should be about employerskill needs and the labour market outcomes of TVET graduates.

5 March 2013 - Final 106 of 122
Supply side indicators
These indicators are the standard measures required for reporting system activity. They areused in the annual reports of institutions responsible for funding and providing the services.They are relatively easy to collect and report on, provided a template and reporting channelsare specified.
Topic Indicators Data sourceInputs Outputs
Supp
ly o
f sk
ills
School enrolments by levelof secondary education
School completion byeducation level, overall andfor each school
Admin data
Enrolments by post-secondary qualification
Number of graduates and non-completers by qualificationfor each training provider
Admin data
Proportion of working agepopulation with post-schoolqualifications by sex & age
Household Income & ExpenditureSurveys, Census
Demand side indicators
Demand side indicators are new to most TVET systems because this focus has been largelyabsent. This applies especially to the provision of regular indicators of the demand for skills.Some existing official surveys such as Household Income & Expenditure Surveys offer someuseful information. However, for most indicators of skills demand, new data sources areneeded. These include a regular survey of employers. Also valuable is face-to-face feedbackto training providers from local employers.
Indicators Data sourceShort-term outcomes Longer term impact
Dem
and
for
skill
s
Changes in proportion ofworking age population infull-time paid work by sex &age group
Household Income & ExpenditureSurveys, Census
Number of advertised job vacancies per three months:ongoing or temporary, required/desirable qualification ,work experience, by industry sector, type of employer
Newspaper & radio jobadvertisements
Actual skills (specific &general) sought byemployers
Improved rates ofemployment in middleoccupationsLower cost of training permatched employmentoutcome
Yearly survey of enterprises orinformation sought from a localgroup of employers for specifictraining providersDirect face-to-face feedback fromemployers
Change in median wages byoccupation at three digitlevel at two points in time
Household Income & ExpenditureSurveys, provided occupation datacollected to three-digit level

5 March 2013 - Final 107 of 122
Indicators Data source
Shorter-term outcomes Longer term impact
Dem
and
for
skill
s
Type of training needed byenterprises eg short courses,training on-the-job
Feedback from employers onTVET graduates
Yearly survey of enterprises orinformation sought from localgroups of employers for specifictraining providersDirect face-to-face feedback fromemployers
Education level and type ofjob of employees by firmcharacteristics (employmentsize, sector, exportorientation)
Yearly survey of enterprises orinformation sought from a localgroup of employers for specifictraining providers
Need for training in theinformal economy
Effect on incomes of trainingsupported activities ininformal economy
Survey of programs deliveringservices to the informal economyor focus group discussions withpeople involved in a particularactivity
Total employment, ongoing,temporary, full-time, part-time by education and age,overall, by occupation, bysector & occupation to threeor four-digit level
Census for local areas and sectors
More Tongans access skilledmigrant streams for NZ &Australia, each year
Immigration authorities inAustralia & New Zealand
Employment & wageoutcomes for Tonganmigrants by occupation &qualification level in NewZealand, Australia & USA toshow Tongan born migrantshave more skilled & betterpaid jobs than at present
Longitudinal Immigration Survey:New Zealand (LisNZ);Longitudinal Survey onImmigrants to Australia (LSIA);Australian census 2011, NZcensus 2012

5 March 2013 - Final 108 of 122
Indicators of skills mismatches
Information on whether the skills being supplied are meeting the needs of employers is crucialto the effective operation of the labour market. This information needs to be collected by thetraining providers themselves in face-to-face discussions with employers. It also needs to becollected at a more systematic level to help government as the funder of skills training toassess whether the training is effective in the workplace.
Indicators Data source
Short-term outcomes Longer term impact
Skill
mis
mat
ches
Difficulties in finding theright skills for skilled andunskilled occupationsaccording to employers,by firm characteristics
Employers satisfactionlevels with efforts oftraining providers to formlinks with workplacesNumber of foreign workersby occupation
Yearly survey of enterprises orinformation sought from local groupsof employers for specific trainingproviders.Direct face-to-face feedback fromemployers
Gaps in actual skills ofexisting employees,according to employers
Employers' perspectives onthe quality of newly hiredgraduates, by firmcharacteristics andeducation level
Yearly survey of enterprises orinformation sought from local groupsof employers for specific trainingproviders. Direct face-to-facefeedback from employers
Employment outcomes inTonga and overseas forTVET graduates and coursenon-completers
Graduate tracer surveys of each majortraining course, conducted by thetraining provider, centrally or by localarea groupQuestions in enterprise survey aboutrelevance of training of newgraduates employed

5 March 2013 - Final 109 of 122
Attachment 1: Scope of the Review
This Review of the demand for skills training in the Tongan and Regional Labour Marketsaddresses the following ten key tasks.
Key tasks of the Review
1Provide a comprehensive mapping and statistical analysis of the Tonganlabour market (2012) including analysis of public and private sectoremployment trends
2Provide statistics and other evidence of Tongan participation in regionaland international labour markets
3Describe the labour market dynamics in Tonga, (and the wider Pacificregion) including an analysis of the flow of skilled personnel entering andleaving the labour market annually
4Estimate the numbers of TVET graduates in demand by specific industrysectors
5 Estimate current and projected employment-based migration patterns
6Identify possible emerging opportunities in regional and internationallabour markets
7Identify current workforce planning being undertaken in both the publicand private sectors
8Provide an analysis of opportunities and barriers faced by women seekingto enter into skilled employment and remain in the Tongan workforce
9Provide projections on demand for skilled personnel emanating fromcurrent or planned large scale infrastructure projects
10 Identify primary indicators of capacity in the Tongan labour market

5 March 2013 - Final 110 of 122
The focus of the primary and secondary data collection for the review has been on threeeconomic sectors: the formal and informal economy in Tonga and on the international labourmarkets traditionally favoured by Tongan migrants. A range of data sources have been usedfor each sector which are outlined in the table below:
Identifying skills demand in Data sources
Formal economy
Official statistics: Census 2006 & 2011; Report on theTonga Labour Force Survey 2003
Results of TVET Graduate 2007-2010 Tracer Survey(April 2011)
Special survey of larger enterprises
Other studies eg tourism training needs analysis (2009),Report on Training Options for the Members of WISETonga Inc. August 2012
Survey of job vacancies in newspapers
Current & planned infrastructure projects
Informal economy Special survey of key informants in fringe urban & rurallocations
International labourmarkets
Australian & NZ census data on occupations of Tonganborn residents and Immigration lists of skills shortagesUSA data on occupations of Pacific Islandcommunities, changing education profile of migrant toUS, with a focus on nurses
Defining the focus
The labour market review will aim to collect information on four types of skills imbalances.
1. Skill shortages experienced by employers. This refers to a situation whereemployers are not able to recruit people with appropriate skills from the domesticlabour market for jobs that they want to fill.
2. Skills gaps in existing workers. Employers regard their workers as not sufficientlyskilled to do the work required of them.
3. Skills mismatch. This refers to job incumbents not making use of all or most oftheir acquired skills.
4. Lack of employability skills. This imbalance makes employers reluctant toemploy educated young people because they lack relevant work experience.

5 March 2013 - Final 111 of 122
Skills supplied by TVET
The purpose of the review is to provide information on skills in demand for use by TVETproviders. This means that the focus of the review is on the occupations associated with sub-degree qualifications such as diploma and certificate. These occupations using theInternational Standard Classification of Occupations (ISCO) at the one digit level are listedbelow.
International Standard Classification ofOccupations Major Groups 3-73. Technicians and associate professionals
4. Clerical support workers
5. Service and sales workers
6. Skilled agricultural, forestry and fishery workers
7. Craft and related trades workers
Excluded occupations
The review excludes the occupations that usually require on-the-job training or formaltraining within an enterprise without a formal certificate. These occupations include plant &machine operators including stationary plant & machine operators, assemblers, and drivers &mobile plant operators. In this group are also ‘elementary’ occupations. There are: cleanersand helpers; agricultural, forestry & fishery labourers; labourers in mining, construction,manufacturing & transport; food preparation assistants; street & related sales and serviceworkers; and refuse workers & other elementary workers.
Focus on accredited training
The focus of the review is also on accredited skills training as delivered by the TVET sectoror within enterprises. Accredited training refers to Tongan Certificate Levels L1 to L4 and toDiploma Level 5. Certificates 1, 2 and 3 can be benchmarked against the current schoolqualifications of the Tongan School Certificate (level 1); Pacific Secondary Certificate (level2); and the South Pacific Form Seven Certificate (level 3).86
Key principles to underpin the review
Use available data from a number of sources
Recognise the limitations of each data source
Piece together a picture based on assessment of strengths and weaknesses of data
Recognise need for policy change to create demand for skills training
Risks and limitations of the available data
Estimating the current and future demand for skills training is a complex and uncertain
86 Appendix 1: Qualifications definitions, Tonga Qualifications Framework Policies, Tonga NationalQualifications and Accreditation Board, 17 September 2009.

5 March 2013 - Final 112 of 122
undertaking. The concept of skill is itself hard to measure and substitute measures such asoccupation and qualifications are used widely to try to address this problem. However, thesestatistical terms are in many instances inadequate for describing the underlying reality of jobswhich can vary widely from enterprise to enterprise in terms of the sets of tasks and skillsrequired.
This complexity means that no one source of information on the skill needs of the economyprovides a complete picture. This holds no matter how comprehensive that information sourcemay appear.
Limits of Census data
The Tonga National Population and Housing Census 2011 covers the total population. It,therefore, has comprehensive information on occupations, sectors of employment andqualifications. However, from a demand for skills perspective, it only collects informationfrom individuals and not from enterprises. It also provides only a snapshot picture of thepopulation at the time of the census and only allows comparisons with a similar one-offpicture taken five years earlier.
Limits of administrative data
Administrative data such as the occupations of foreign work permit holders can be a valuablesource of information about the current demand for skills. However, it has to be recognisedthat these data are not collected for this purpose. The accuracy of data on the occupations offoreign workers can be wanting if it is left to the applicant to describe the occupation of theforeign worker, without reference to a standard list of occupations such as that provided byISCO. As well, there is the risk that an employer may also misspecify the occupation toincrease the chances of gaining government approval.
Limits of information gained from surveying employers
Asking employers directly about their skills needs involves another set of risks. Manyemployers may be unclear about their current and future skills requirements. Smallemployers, in particular, may not have written job descriptions of the duties and competenciesrequired. They may rely on finding someone they trust who is seen as a good worker andprefer to train them on-the-job to do the required work. These enterprises may be operating ina low-wage, low-skill setting where they have little incentive to seek and pay for higher levelskills. These enterprises may have little interest in identifying their skill needs beyondconcerns about the work discipline of workers available at low wage rates.
The low-wage, low-skill setting of the construction sector may also mean that employers donot realise that they need certain managerial and contract-related skills to operate effectively.Many construction firms, for example, do not know how to estimate the costs of specificelements of a project. Hence they are likely to quote a total cost for a tender that is too low tocover the true cost of the work to be done. Nor do they know how to estimate the costs ofunexpected variations to the contract. Direct questions to employers may not reveal real skillneeds. Only an in-depth study can reveal how to improve the performance of firms in theindustry, and identify the supporting conditions and skills needed.
Employers in the private sector may have little advance knowledge of what their demand for

5 March 2013 - Final 113 of 122
skills might be. This applies especially in industries dependent on the awarding of contractssuch as construction. In many cases, a construction firm’s demand for skills depends onwinning contracts. So asking a construction firm about their future skills needs may simplyelicit a reply that it all depends on if they get a contract and its size and nature. In othersectors such as tourism and hospitality, the demand for skills may also be unpredictable. Itmay depend on variable factors such as the state of the weather, the economic conditions inthe countries sending tourists and the competitive pricing of other tourist operators in-countryand in the region.
Limits of forecasting skills
Predicting the future need for skills is difficult to say the least. Using census data five yearsapart to identify which occupations have grown, declined or remained static providesinformation about the current demand for skills as reflected in the data on occupations andqualifications. However, future demand cannot be simply projected on the basis of past trends.Conditions in the world economy may be very different in the next three to five years. Thefallout from the greatest downturn in the world economy in 2008 since the 1930s may still behaving a major impact on developing and developed countries in 2015 and beyond. There issome scope to identify future demand for skills from planned infrastructure investment. Also,an increase in demographic pressures will also have implications for basic education andhealth care services funded by governments.
Making the most of available data
Bringing together different sources of information to provide a composite picture, calledtriangulation, helps to offset the limitations of any one data source. However, this compositepicture needs to be checked regularly and updated when new information becomes available.For example, in relation to a future development such as the impact of the new fibre opticcable link to Tonga, it may not be possible to estimate the type of skills or the number of jobsgenerated because it will depend on what type of businesses will now see the benefit in takingadvantage of high speed Internet connection.
Another risk to the review is the nature of the economy dominated by a service sectorresponding to weak demand.

5 March 2013 - Final 114 of 122
Attachment 2: A profile of the occupations in the major sectors of theeconomy
The following notes highlight the major features of the occupational structure of each of themajor sectors of the economy. The profiles are based on the 2011 census results.
Middle Occupations - public administration
The number of job holders in the associate professional and technician level occupations issmall compared with the number of job holders in the clerical occupations. In particular, theseoccupations may have insufficient numbers to cope with job turnover: ship & aircraftcontrollers & technicians; Medical & pharmaceutical technicians; Nursing & midwiferyassociate professionals; and Veterinary technicians & assistants.
Middle Occupations - Health
The low numbers (less than 5 in each case) of Administrative & specialised secretaries andICT operations & user support technicians are worth noting.
Main occupations - Accommodation, food & beverage and tourist travel agency services
Apart of from a large number of chefs who fall into the category of Artistic cultural &culinary associate professionals, and a small number of Administrative & specialisedsecretaries, there are few or no job holders with professional or middle-level skills in financeor ICT.
There are 46 Travel attendants conductors & guides and 18 client information workers in thetwo sectors. However, there are few personal care workers and hairdressers and beauticianscatering for tourists. Similarly, there are no child care workers & teachers' aides whichsuggests that the tourist industry is not family friendly. There are few car or van drivers orships' deck crews who are focused on tourists.
Main occupations - Wholesale & retail trade & repair of motor vehicles & motorcycles
The two main occupations are: Engineering professionals (excluding electrotechnology) andMachinery mechanics & repairers. However, there are middle-skill jobs: Physical &engineering science technicians; Financial & mathematical associate professionalsAdministrative & specialised secretaries; and ICT operations & user support technicians.
Main occupations - Construction & specialised construction industries
The largest occupation group are those with basic building skills: building frame & relatedtrades workers. Job holders involving building finishers are less than one-in-ten of thecombined building trades. The construction industry appears to have too few managers,engineers, surveyors, accountants, technicians, supervisors, painters and welders comparedwith the large number of trades workers. This probably reflects the project-based nature of thework, and the lack of continuity in the work so it is difficult for all but a few largerconstructions firms to retain a core of skilled personnel.

5 March 2013 - Final 115 of 122
Main occupations - repair machinery
The two main occupations are: Engineering professionals (excluding electrotechnology) andMachinery mechanics & repairers. There appear to be fewer Electrotechnology engineers,physical & engineering science technicians and electrical equipment installers & repairersthan could be expected.
Main occupations - Electricity gas steam & air conditioning supply
The largest number of job holders are sales workers and electrical equipment installers &repairers. The number of Engineering professionals is low. However, middle-level skills areprominent in the three occupations: Physical & engineering science technicians; Processcontrol technicians; and Administrative & specialised secretaries. However numbers with ICTexpertise at the professional and technician level are low.
Main occupations - Financial & Insurance Services plus activities auxiliary to financialservice & insurance activities
The occupations with the largest number of job holders in Finance and Insurance Services are:Financial & mathematical associate professionals and tellers. Business services managers,finance professionals and professional service managers are also important. However, thosewith ICT expertise are few i number: Software & applications developers & analystsDatabase & network professionals. Lawyers and economists are also few in number.
Main occupations - Communications
Under the broad umbrella of Communications are the following: Publishing activities; Video& television programme production sound recording & music publishing activities;Programming & broadcasting activities; Telecommunications; & Computer programmingconsultancy & related activities; and Information service activities. No one occupation standsout as being much larger than the others. ICT skills are important and involve theseoccupations in particular: ICT service managers; Software & applications developers &analysts Database & network professionals; and ICT operations & user support technicians.Also important are the middle skill occupations of Telecommunications & broadcastingtechnicians and Physical & engineering science technicians. The numbers in the trade-leveloccupation of Electronics & telecommunications installers & repairers are significant.
Main occupations - Land, Water & Air transport; Warehousing & support activities fortransportation
The main jobholders in land, water and air transport are not unexpectedly: Car van &motorcycle drivers; Heavy truck & bus drivers; and Ships' deck crews & related workers. Atthe middle skill level are Ship & aircraft controllers & technicians. Client informationworkers and Numerical clerks are also prominent. Protective services workers are present insignificant numbers. The size of the domestic maritime labour market is about 160 jobs,comprising 58 Ships' deck crews & related workers and about 100 Ship’s officers andengineers.

5 March 2013 - Final 116 of 122
Middle Occupations - public administration Total
Physical & engineering science technicians 9Construction supervisors 8
Life science technicians & related associate professionals 31Ship & aircraft controllers & technicians 7
Medical & pharmaceutical technicians 7Nursing & midwifery associate professionals 12
Veterinary technicians & assistants *Other health associate professionals 27
Financial & mathematical associate professionals 12Sales & purchasing agents & brokers 7
Business services agents 7Administrative & specialised secretaries 39
Regulatory government associate professionals 143Legal social & religious associate professionals 7
Sports & fitness workers 5Artistic cultural & culinary associate professionals 6
ICT operations & user support technicians 25Telecommunications & broadcasting technicians *
General office clerks 96Secretaries (general) 75Keyboard operators 80
Tellers money collectors & related clerks 10Client information workers 50
Numerical clerks 120Material-recording & transport clerks 8
Other clerical support workers 62* = less than 5 Total 853
Middle Occupations - health TotalNursing and midwifery professionals 217
Other health professionals 34Medical & pharmaceutical technicians 40
Nursing & midwifery associate professionals 40Traditional & complementary medicine associate
professionals *Other health associate professionals 34
Administrative & specialised secretaries *ICT operations & user support technicians *
* = less than 5 Total 372

5 March 2013 - Final 117 of 122
Main occupations - Accommodation, food & beverage TotalHotel & restaurant managers 100
Other services managers 14Artistic cultural & culinary associate professionals 66
Administrative & specialised secretaries 5Client information workers 45
Numerical clerks 13Material-recording & transport clerks *
Other clerical support workers 6Travel attendants conductors & guides 5
Cooks 199Waiters & bartenders 140
Hairdressers beauticians & related workers *Building & housekeeping supervisors 21
Other personal services workers *Street & market salespersons 7
Shop salespersons 12Cashiers & ticket clerks 15
Other sales workers *Child care workers & teachers' aides 0
Personal care workers in health services 0Protective services workers 30
Building frame & related trades workers 11Food processing & related trades workers 14
Domestic hotel & office cleaners & helpers 103* = less than 5 Total 819
Main occupations - tourist travel agency services TotalOther services managers 6
Finance professionals *Administration professionals *
Sales marketing & public relations professionals *Database & network professionals *
Ship & aircraft controllers & technicians *Administrative & specialised secretaries *
General office clerks *Tellers money collectors & related clerks *
Client information workers 18Numerical clerks 5
Travel attendants conductors & guides 41Shop salespersons *
Cashiers & ticket clerks *Car van & motorcycle drivers *
Ships' deck crews & related workers ** = less than 5 Total 91

5 March 2013 - Final 118 of 122
Main occupations - Wholesale & retail trade & repair ofmotor vehicles & motorcycles Total
Engineering professionals (excluding electrotechnology) 25Finance professionals 7
Physical & engineering science technicians 3Financial & mathematical associate professionals *
Administrative & specialised secretaries 6ICT operations & user support technicians *
Clerical support workers 18Numerical clerks 11
Material-recording & transport clerks *Salespersons 26
Painters building structure cleaners & related trades workers 15Sheet & structural metal workers moulders & welders *
Machinery mechanics & repairers 109Office cleaners & helpers *
Vehicle window laundry & other hand cleaning workers ** = less than 5 Total 228
Main occupations - Construction & specialisedconstruction industries Total
Business services & administration managers *Construction managers 36
Professional services managers 5Other services managers *
Engineering professionals (excluding electrotechnology) *Electrotechnology engineers *
Architects planners surveyors & designers 10Finance professionals *
Physical & engineering science technicians 26Mining manufacturing & construction supervisors 16
Administrative & specialised secretaries *Secretaries (general) 9
Numerical clerks 13Material-recording & transport clerks *
Building frame & related trades workers 1095Building finishers & related trades workers 81
Painters, building structure cleaners & related trades workers 35Sheet & structural metal workers, moulders & welders 15
Blacksmiths toolmakers & related trades workers 35Machinery mechanics & repairers 8
Electrical equipment installers & repairers *Car van & motorcycle drivers 5
Heavy truck & bus drivers 7Mobile plant operators *
Mining & construction labourers 87* = less than 5 Total 1483

5 March 2013 - Final 119 of 122
Main occupations - repair machinery TotalEngineering professionals (excluding electrotechnology) 38
Electrotechnology engineers *Physical & engineering science technicians 16ICT operations & user support technicians *
Building finishers & related trades workers 6Painters building structure cleaners & related trades workers 9
Sheet & structural metal workers moulders & welders 6Blacksmiths toolmakers & related trades workers *
Machinery mechanics & repairers 222Electrical equipment installers & repairers 21
Electronics & telecommunications installers & repairers 8* = less than 5 Total 326
Main occupations - Electricity gas steam & airconditioning supply Total
Managers 13Engineering professionals (excluding electrotechnology) *
Electrotechnology engineers *Finance professionals 7
Sales marketing & public relations professionals *Software & applications developers & analysts *
Database & network professionals *Physical & engineering science technicians 19
Process control technicians 10Administrative & specialised secretaries 21
ICT operations & user support technicians *General office clerks *Secretaries (general) *Keyboard operators *
Tellers money collectors & related clerks 7Client information workers 6
Numerical clerks 11Shop salespersons 5
Cashiers & ticket clerks 5Other sales workers 97
Protective services workers 11Building finishers & related trades workers *
Machinery mechanics & repairers *Electrical equipment installers & repairers 72
Electronics & telecommunications installers & repairers *Other stationary plant & machine operators *
Car van & motorcycle drivers 8Heavy truck & bus drivers 5
Ships' deck crews & related workers *Domestic hotel & office cleaners & helpers *
Other elementary workers 18* = less than 5 Total 348

5 March 2013 - Final 120 of 122
Main occupations - Financial & Insurance Services plusactivities auxiliary to financial service & insuranceactivities
Total
Business services & administration managers 17Sales marketing & development managers *
ICT service managers *Professional services managers 26
Other services managers 5Mathematicians actuaries & statisticians *
Finance professionals 54Administration professionals 5
Sales marketing & public relations professionals 9Software & applications developers & analysts 6
Database & network professionals *Legal professionals *
Social professionals eg economist *Financial & mathematical associate professionals 115
Sales & purchasing agents & brokers 15Administrative & specialised secretaries 14
Regulatory government associate professionals *ICT operations & user support technicians *
General office clerks 10Secretaries (general) 16
Tellers, money collectors & related clerks 155Client information workers 21
Numerical clerks 41Shop salespersons 25
Protective services workers 44Car van & motorcycle drivers 18
Office cleaners & helpers 23Other 23
* = less than 5 Total 660

5 March 2013 - Final 121 of 122
Main occupations - Communications 1 Total
Managing directors & chief executives *Business services & administration managers 5
ICT service managers 9Other services managers 11
Electrotechnology engineers 19Designers *
Finance professionals 15Sales marketing & public relations professionals 54
Software & applications developers & analysts 10
Database & network professionals 6Legal professionals 1
Librarians archivists & curators 1Authors journalists & linguists 15
Creative & performing artists 40Physical & engineering science technicians 24
Financial & mathematical associate professionals 6Administrative & specialised secretaries 15
Artistic cultural & culinary associate professionals 6ICT operations & user support technicians 64
Telecommunications & broadcasting technicians 48General office clerks 9Secretaries (general) *Keyboard operators 10
Tellers money collectors & related clerks 6Client information workers 60
Numerical clerks 24Material-recording & transport clerks *
Other clerical support workers 11Street & market salespersons 21
Shop salespersons 21Cashiers & ticket clerks 10
Other sales workers 44Protective services workers 18
Printing trades workers *Electrical equipment installers & repairers 5
Electronics & telecommunications installers & repairers 27Car van & motorcycle drivers 10
Domestic hotel & office cleaners & helpers 11Other 33
* = less than 5 Total 673Communications includes: Publishing activities; Video & televisionprogramme production sound recording & music publishing activities;Programming & broadcasting activities; Telecommunications; &Computer programming consultancy & related activities; Informationservice activities

5 March 2013 - Final 122 of 122
Main occupations - Land, Water & Air transport;Warehousing & support activities for transportation Total
Managing directors & chief executives 5Business services & administration managers 8
Other services managers 14Engineering professionals (excluding electrotechnology) 11
Electrotechnology engineers *Architects planners surveyors & designers *
Finance professionals 17Administration professionals *
Sales marketing & public relations professionals *Database & network professionals *
Physical & engineering science technicians *Supervisors *
Ship & aircraft controllers & technicians 112Financial & mathematical associate professionals *
Sales & purchasing agents & brokers 8Business services agents 9
Administrative & specialised secretaries 17Regulatory government associate professionals 11
Artistic cultural & culinary associate professionals *ICT operations & user support technicians *
General office clerks 10Secretaries (general) 8
Client information workers 49Numerical clerks 26
Material-recording & transport clerks 7Other clerical support workers 18
Travel attendants conductors & guides 12Cashiers & ticket clerks 26
Protective services workers 83Building frame & related trades workers 6
Sheet & structural metal workers moulders & welders *Machinery mechanics & repairers 15
Electrical equipment installers & repairers *Electronics & telecommunications installers & repairers *
Car van & motorcycle drivers 184Heavy truck & bus drivers 63
Mobile plant operators 10Ships' deck crews & related workers 58
Domestic hotel & office cleaners & helpers 16Transport & storage labourers 55
Other 30* = less than 5 Total 909