Embed Size (px)
Citation preview
THE TORINOPROCESS
CONTACT US
Further information can befound on the ETF website:
For any additional informationplease contact:
European Training FoundationCommunication DepartmentVilla GualinoViale Settimio Severo 65I – 10133 Torino
[email protected]+39 011 630 2200+39 011 630 2222
E
F
T
www.etf.europa.eu

The contents of this paper are the sole responsibilityof the ETF and do not necessarily reflect the viewsof the EU institutions.
© European Training Foundation, 2012.Reproduction is authorised provided the sourceis acknowledged.

THE TORINOPROCESS
CONTENTS
1. INTRODUCTION ..............................................................................................3
1.1 What is the Torino Process? ............................................................................... 3
1.2 Introduction to the Analytical Framework............................................................4
1.3 Statistical data ..................................................................................................... 5
1.4 Final report and time schedule ............................................................................ 5
1.5 Next steps........................................................................................................... 6
2. ANALYTICAL FRAMEWORK FOR VOCATIONAL EDUCATION AND
TRAINING SYSTEM REVIEWS.......................................................................7
Executive summary ................................................................................................... 7
A. Vision for VET system development ................................................................... 7
B. External efficiency: addressing demographic, economic and
labour market needs............................................................................................ 8
C. External efficiency: addressing social demands for VET and promoting
social inclusion .................................................................................................. 10
D. Internal quality and efficiency of initial and continuing VET delivery..................11
E. Governance and financing of the initial and continuing VET system and
institutional capacities for change ..................................................................... 13
1

3. GUIDELINES ON QUANTITATIVE INDICATORS ........................................18
3.1 Introduction ....................................................................................................... 18
3.2 List of indicators ................................................................................................ 18
3.3 Definitions of indicators from the Torino Process Analytical Framework ..........20
ANNEXES............................................................................................................27
Annex 1. ISCED 97, NACE and ISCO classifications ..............................................27
Annex 2. Torino Declaration ................................................................................... 32
ACRONYMS ........................................................................................................34
REFERENCES ......................................................................................................35
THE TORINO PROCESS
2
1. INTRODUCTION
In 2010 the European Training Foundation (ETF) launched the first round of the Torino Process, in which 22
of its 29 partner countries participated. In May 2011 the ETF organised a conference entitled ‘The Torino
Process – Learning from Evidence’, which brought together over 250 stakeholders from all ETF partner
countries, EU institutions, EU member states and the international community. In the final Declaration (see
Annex 2), conference participants welcomed the Torino Process approach, endorsed the findings from the
first exercise, including a number of common priority areas and short-term actions, and encouraged the ETF
to work further to build capacity in evidence-based policy making. In addition, partner countries confirmed
their interest in taking part in the next round of the Torino Process.
1.1 WHAT IS THE TORINO PROCESS?
The Torino Process is a participatory process leading to an evidence-based analysis of vocational education
and training (VET) policies in a given country.
The Torino Process is carried out in order to build consensus on the possible ways forward in VET policy and
system development. This includes the determination of the state of the art and vision for VET in each
country or, after a given period, an assessment of the progress that countries are making in achieving the
desired results.
The added value of the Torino Process lies in the fact that it embeds VET within the socioeconomic context,
and ensures that the analysis is informed by relevant evidence and takes place through structured dialogue.
In this respect, the ETF helps countries to gather information from different sources of evidence and fosters
policy dialogue.
More specifically, the Torino Process is a vehicle for:
� developing a common understanding of a medium-term vision, priorities and strategy for VET
development, exploring possible options for implementing this vision and/or making further progress;
� designing and evaluating home-grown and affordable VET policies, based on evidence or knowledge and
collaboration;
� updating the analyses and achievements at regular intervals;
� providing opportunities for capacity development and policy learning within and among partner countries
and with the EU;
� empowering countries to better coordinate the contributions of donors to achieving agreed national
priorities.
In addition, the Torino Process informs the ETF’s recommendations to the EU’s external assistance
instruments and serves as a basis for the design of the ETF’s support strategy to partner countries.
The Torino Process has been inspired by policy assessment processes at EU level, notably the Copenhagen
Process in VET and the 2010 Bruges Communiqué. Indeed, the Torino Process in partner countries
complements the review of progress towards the common EU VET policies, objectives and tools under the
Bruges Communiqué. This complementarity facilitates mutual learning between the EU and partner
countries.
3
The Torino Process is founded on four principles.
� Ownership of both the process and the results (final report) by the partner country’s policy leaders and
stakeholders. This includes seeking complementarity between the Torino Process and the national policy
agenda and/or other relevant processes.
� Broad participation in the process by relevant stakeholder groups, including parliamentary committees,
policy leaders, social partner representatives, school managers, teachers, local authorities, company
representatives, researchers and civil society representatives. This provides the basis for reflections and
consensus building by local actors, thus making the connection between policy analysis and agreements
about policy choices and implementation.
� A holistic approach, using a broad concept of VET for both young people and adults and adhering to a
system approach, taking into account not only the system elements and how they communicate, but
also how the VET system responds to the economic and social environment in which it operates. The
Analytical Framework comprises the policy vision for VET, an analysis of the external and internal
efficiency of the system, and governance and financing issues.
� An evidence or knowledge-based assessment, which is seen as essential for countries to make
informed decisions about policy developments and to measure progress.
Evidence can take many forms, such as experience and evaluation of practice, the results of scientific
analyses, quantitative and qualitative research, basic and applied research, and the development of statistics
and indicators. Education and training are part of the diverse cultural traditions and identities of countries and
they interact with a web of other policies. In these circumstances, there can be no simple prescriptions
about what makes good policy or practice. This makes it all the more important to know as much as possible
about what works, for whom, under what circumstances and with what outcomes (European Commission,
2007).
1.2 INTRODUCTION TO THE ANALYTICAL FRAMEWORK
The Analytical Framework is intended to guide the review, to the extent that it fits the context of the country
in question. In particular, it seeks to answer the following key questions.
� Section A – Policy vision
What is the vision for VET development and does that comply with broader national socioeconomic
development objectives?
� Section B – VET in relation to economic competitiveness
Do the skills offered by the VET system match those required by the labour market and economic
development in general?
� Section C – VET in relation to social demand and social inclusion
Do institutions, and the programmes and skills offered by the VET system, match the aspirations of
individual learners, fulfil the needs of vulnerable groups, and address territorial disparities?
� Section D – Internal quality and efficiency
What further reforms are necessary to modernise the various elements or ‘building blocks’ of the VET
system?
� Section E – Governance and financing
Are institutional arrangements, capacities and budgets adequate for bringing about the desired changes
in the VET system?
Each section of the Analytical Framework proposes the use of a range of quantitative and qualitative
‘evidence’ – such as statistical data and indicators, good practice, qualitative assessments, and existing
national and international studies and reports – drawn from different sources. These are intended as
suggestions for the review, as experience shows that the specific policy challenges, available statistics and
other sources of evidence vary in each country.
THE TORINO PROCESS
4

Countries that have already been involved in previous rounds of the Torino Process exercise are encouraged
to revise and update their previous report, in line with the principles of the Torino Process. This implies:
� including reference to policy progress or developments that have occurred since, in particular in areas
identified as priorities in the previous report;
� updating the analysis with the most recent data and references;
� improving, where possible, the quality of the analysis across the report.
Countries that did not take part directly in earlier exercises are invited to carry out a first assessment under
the Torino Process.
1.3 STATISTICAL DATA
The statistical indicators listed in the Analytical Framework are intended to suggest possible ways of using
evidence and providing inputs to the analysis in line with the questions mentioned. They should not be seen
as exhaustive. The ETF Guidelines on Quantitative Indicators, which provide definitions and typical sources,
should also be consulted.
To support the review process in partner countries, the proposed indicators have been divided into two
categories:
� a list of indicators that will be gathered centrally by the ETF Statistics Team, and that can be used to gain
a general overview of the topics to be covered (see Section 2, p. 17);
� a series of more detailed information (basically all the other indicators suggested) that is necessary for a
more in-depth analysis (see Section 3).
We are aware that international data sources contain very little information on VET, while national data is
often closely linked to the national context, making it difficult to compare data easily across countries. This
means that most of the data provided by the ETF Statistics Team concerns rather general trends of the
complete education system, as well as of the socioeconomic context within which the VET system
operates.
A thorough analysis of any VET system must use additional specific data derived from national sources.
Reinforcing the quality of data and its deployment in the policy analysis will be a specific focus for the Torino
Process 2012. The ETF is willing to engage in a dialogue with national representatives in order to determine
what is the best available evidence in each country.
In addition, a practical manual on the creation and use of quantitative data will be made available in the
Torino Process section of the ETF website (www.etf.europa.eu).
1.4 FINAL REPORT AND TIME SCHEDULE
Partner countries are encouraged to document key findings from their analyses and consensus-building
processes in a final comprehensive report, including a statistical data annex. We suggest compliance with
the Analytical Framework as far as possible, with a view to ensuring coherence and allowing for a certain
degree of comparability across countries within a particular region.
The Torino Process should lead to a draft country report during the third quarter and a finalised and endorsed
country report by the last quarter of the year.
Please note that the ETF plans to check the quality and publish the summary country reports, including the
latest statistics, up to a maximum length of 15 to 20 pages – in English and French, Russian or Arabic.
1. INTRODUCTION
5
On the basis of the country reports, the ETF will prepare regional and cross-country analyses, and a specific
report on key indicators. The ETF also plans to provide a further opportunity for knowledge sharing and
policy learning at an international conference in Spring 2013.
1.5 NEXT STEPS
Partner countries are encouraged to:
� nominate a contact institution for liaison with the ETF;
� agree on the most appropriate implementation modality for the country, in particular by assessing
whether there is a preference for self-assessment or an ETF-led assessment:� for self-assessment, the partner country itself will collect relevant research, including data,
organising the consultation process, and drafting and validating the final report, with the ETF
providing some support to ensure the quality of the final report;� for an ETF-led assessment, the ETF could render more comprehensive support in collecting data
and information, designing and implementing the consultation process, and drafting and validating
the final report together with country stakeholders;
� identify institutions and individuals to collect data and information;
� engage or assist in the operational implementation of the consultation, drafting and validation processes
through the organisation of workshops, focus groups, public hearings or other types of meeting.
THE TORINO PROCESS
6
ADDITIONAL RESOURCES
� Cedefop glossary
� Manual on the creation and use of quantitative data
� Report template in English, French, Russian and Arabic
See ETF website: www.etf.europa.eu, Torino Process section
2. ANALYTICAL FRAMEWORKFOR VOCATIONALEDUCATION AND TRAININGSYSTEM REVIEWS
EXECUTIVE SUMMARY
(TWO TO THREE PAGES)
� What are the key findings from each of the following sections? Which key policy priorities for VET in the
country concerned can be derived from these? What actions are planned to address these priorities?
A. VISION FOR VET SYSTEM DEVELOPMENT
(ONE PAGE)
Key questions
1. What is/are the vision(s) of the government, enterprises and civil society for VET development in the
medium to long term, in response to the country’s economic, social and environmental strategies and
challenges and within the framework of the resources available? What are the commonalities/
differences in vision between the stakeholder groups?
2. To what extent do these visions address sustainable development, and in particular the necessity to
switch to a low-carbon economy and to green growth?
3. What are the priorities, and how have the different stakeholders translated – or how do they intend to
translate – this vision into specific policy measures and actions?
Sources of quantitative and qualitative evidence
� national policy papers and strategies concerning education/VET;
� national policy papers and strategies concerning economic, social and environmental development,
including local and/or regional development priorities;
� policy/position papers from enterprises, social partners, experts/academics and civil society;
� reports from interviews, meetings, focus groups and the media.
7
Vocational education and training (VET) is understood in a broad sense to cover education and
training that aims to equip both young people and adults with knowledge, know-how, skills and
competences required in particular occupations or, more broadly, on the labour market (Cedefop,
2008).
VET is provided at different levels, including secondary, post-secondary and tertiary. It can take place
in formal, non-formal or informal settings, in institutions, companies or other places, and at different
stages of individual’s lives.

B. EXTERNAL EFFICIENCY: ADDRESSING DEMOGRAPHIC,
ECONOMIC AND LABOUR MARKET NEEDS
(THREE TO FOUR PAGES)
Key questions
1. What are the main sociodemographic factors and trends (population, migration, ethnic composition,
etc.) in society, and how do they shape, or how are they going to shape, the demand for skills in the
country at national/regional level?
2. Which are the key economic sectors (in terms of contribution to both gross domestic product (GDP)
and employment) and what kind of skills do these sectors require? Are there significant regional
variations in terms of economic sector development? How do other economic factors influence the
demand for skills (taking into account economic growth prospects, sectors with trade agreements
with the EU, competitiveness, the size of companies, privatisation/restructuring trends, etc.)? Which
other factors shape the demand for skills (e.g. ecological requirements)?
3. What specific efforts are being made by governments (training and small and medium-sized enterprise
(SME) policy departments, particularly at national/regional level), including public and private training
providers, to ensure that the skills interests and concerns of the multinational, national and small
business community are being met?
4. What are the main labour market trends and employment challenges in the country, and how do they
influence the demand for skills (taking into account labour market participation; employment and
unemployment rates by gender, age and education level; public vs. private employment, types of
employment, significant regional variations, etc.)?
5. What is the size of the informal economy and informal employment, and how does this shape the
demand for skills?
6. Are the skills and competences offered by the initial and continuing VET system broadly in line with
those required by employers and the labour market at national/regional level? What are the principal
mechanisms in place to identify skill and training needs in the labour market, and how is this
information used to inform VET planning (including occupational competences/qualifications; curricula
and continuing vocational training courses; and the network of vocational schools and adult training
providers)?
7. How does the VET system promote entrepreneurial attitudes and skills?
8. Based on the above, what are the main priorities for improving external economic efficiency in the VET
system? What (further) policy initiatives or actions have already been planned to ensure that the VET
system can better respond to sociodemographic, economic and labour market issues, and how will
these policies and actions be implemented at national/regional level? Are there major priorities that are
not being adequately addressed by current policies or actions?
THE TORINO PROCESS
8
External efficiency in the context of this Analytical Framework denotes how well the VET system
correlates with the external environment within which it operates and how well it responds to related
signals or challenges. We have defined this in terms of three outcomes:
� the economic and employment perspective – here the focus is on labour market outcomes, which
is the primary rationale behind VET provision (Section B);
� the social inclusion perspective, or how well the VET system reaches out to the weakest
segments of the population and ensures the provision of (targeted) training (Section C);
� the individual learner perspective – here ‘social demand for education’ means providing attractive
learning pathways for all groups through VET provision (Section C).
Recommended quantitative indicators1
Key question 1
� total population, population growth rate and dependency rates;
� number and/or proportion of 15–24-year-olds in the total population;
� migration trends (inward and outward);
� ethnic composition of the population (major ethnic groups);
� educational attainment of population by age and gender;
� educational attainment of population by urban/rural;
� illiteracy rates/literacy rates.
Key question 2
� GDP growth rate and GDP per capita;
� changes in employment by detailed economic sector;
� changes in employment by occupational field;
� employment by sector compared to GDP by sector;
� enterprise start-up rates;
� Competitiveness Index;
� proportion of micro and small companies among active businesses.
Key question 4
� activity rates by gender and educational level;
� employment rates by gender and educational level;
� unemployment rates by gender and educational level;
� youth unemployment rates by gender and educational level;
� size of the informal economy/employment;
� changes in employment by status and gender;
� public employment as a percentage of total employment.
Key question 7
� Small Business Act Entrepreneurial Learning Index (source: ETF Entrepreneurial Learning Team).
Recommended sources of quantitative and qualitative evidence
� demographic projections, migration studies, studies on the ethnic composition of the population;
� census data;
� household budget or household consumption surveys;
� training strategies of public and private training providers;
� national, regional and sectoral economic development strategies;
� EU small enterprise monitoring framework – Small Business Act Dimension 8 (enterprise skills) for
pre-accession and Eastern Neighbourhood, and Euro-Mediterranean Enterprise Charter Dimension 4
(improved skills) for Southern Neighbourhood;
� regular labour force surveys or other specific labour market surveys;
� studies of informal economies;
� enterprise skills satisfaction surveys;
� national, sectoral and regional skill needs surveys;
� entrepreneurial learning strategies;
� World Economic Forum data; OECD Economic Outlook data, etc.;
� reports from interviews, meetings, focus groups and the media.
2. ANALYTICAL FRAMEWORK FOR VOCATIONAL EDUCATION AND TRAINING SYSTEM REVIEWS
9
1 Indicators in bold will be gathered by the ETF Statistics Team (see list of key indicators, p. 17).
C. EXTERNAL EFFICIENCY: ADDRESSING SOCIAL DEMANDS
FOR VET AND PROMOTING SOCIAL INCLUSION
(THREE TO FOUR PAGES)
Key questions
1. How well does VET match the aspirations of individual learners, and what actions have been
suggested to improve its attractiveness (e.g. facilitating the transition of VET graduates to higher
levels of education or the labour market; ensuring career guidance is available; developing further adult
training offers; developing qualification and assessment systems and promoting the recognition of
skills acquired through non-formal or informal learning, etc.)?
2. How successful has the VET system at national/regional level been in providing learning opportunities
for adults to enhance their labour market prospects or upgrade their skills?
3. How does the VET system develop active citizenship skills to allow individuals to contribute to
sustainable societies, for example by promoting critical reflection, cross-disciplinary and creative
thinking, and learner-centred, participatory learning processes?
4. Give an overview of the main social inclusion issues in the country, including poverty, inequality,
regional/rural disparities and ethnic/religious divisions. Identify key vulnerable groups (whose needs
the VET system must respond), including the poorest segments of the population, inactive people
(particularly females), unemployed/long-term unemployed individuals, ethnic groups, Roma people,
immigrants, refugees or internally displaced persons, illiterate or low-skilled people, the working poor
who are in precarious jobs, early school leavers, people residing in specific regions of the country,
females, young people not in employment, education or training (NEETs), individuals with a disability
and first job-seekers.
5. How successful has the VET system been in addressing the needs of the vulnerable groups identified
in terms of providing access to education and support for retaining individuals in education, completing
their learning and integrating into the labour market, and for their active citizenship and personal
development at national/local level?
6. Based on the above, what are the main priorities for improving external efficiency in the VET system?
What (further) policy initiatives or actions are foreseen for addressing the needs of individual learners
(including those from vulnerable groups), and how will these policies and actions be implemented at
national/regional level? Are there major priorities that are not being adequately addressed by current
policies or actions?
Recommended quantitative indicators
Key questions 1 and 2
� participation in adult learning;
� expenditure on active labour market policies (ALMPs) as a percentage of GDP;
� percentage of registered unemployed covered by ALMPs;
� percentage of VET students who continue to higher levels of education.
Key questions 3 and 4
� use information, from the previous section and other sources, to identify key vulnerable groups:� illiteracy rates;� educational attainment of the population by age and gender;� educational attainment of the population by urban/rural;� rate of early school leavers;� number of individuals with a disability, and information on Roma people, immigrants, those from
ethnic minorities, etc.
� proportion (or number) of young people not in employment, education or training;
� poverty and inequality rates (or proportions);
� number of first job-seekers and long-term unemployed as a proportion of the total unemployed (age 15+);
THE TORINO PROCESS
10
� number of VET students as a proportion of the total number of pupils and students by level and
gender;
� participation in VET in percent by field of study;
� drop-out rates in upper secondary, general and VET by gender.
Recommended sources of quantitative and qualitative evidence
� social inclusion and poverty reduction/inequity assessment strategies;
� analytical reports on the extent of apprenticeship schemes;
� mapping of VET programmes offered;
� VET graduate tracer studies;
� surveys on transition from education to work, e.g. by the International Labour Organisation (ILO) and the
ETF;
� employment strategies and action plans;
� analytical reports about career guidance and counselling;
� reports from interviews, meetings, focus groups and the media.
D. INTERNAL QUALITY AND EFFICIENCY OF INITIAL AND
CONTINUING VET DELIVERY
(THREE TO FOUR PAGES)
This section focuses mainly on the provision of VET by schools, colleges, faculties, company training sites, etc.
Key questions
1. How is quality defined in the country at provider level in initial and continuing VET?
2. Provide a diagram illustrating the provision of VET in the country, including links with basic and
general, higher, and continuing vocational education and training2. Are there any constraints which
restrict access for VET graduates to higher levels of education or training? What policies have been
developed/should be developed to address the dead ends?
3. What are the strengths and weaknesses in terms of quality and efficiency with regard to the following
elements or ‘building blocks’ of VET delivery:� occupational standards/qualifications, including key competences;� curricula;� textbooks and other learning materials and equipment;� the network of public and private training providers;� teachers’ skills and professional development;� school budgets, including unit costs for VET students, additional sources of income, etc.;� school management;
2. ANALYTICAL FRAMEWORK FOR VOCATIONAL EDUCATION AND TRAINING SYSTEM REVIEWS
11
Quality is the degree to which a set of inherent characteristics fulfils certain requirements. (Cedefop,
2011, quoted from ISO, 2000)
In this context it is important to understand that there needs to be internal consistency: any changes
in one element of the system (e.g. curricula) necessarily trigger changes in other elements of the
system (e.g. teachers’ skills, materials and equipment, inspection system, etc.).
Efficiency generally describes the extent to which funds, time or effort are well used for a specific
outcome.
2 Use where possible a national diagram. In the absence of a national diagram, please refer for inspiration to Cedefop Refernet
national country reports for EU member states.

� modern learning processes;� practical learning sites, involvement of employers/apprenticeship systems;� assessment and certification of skills?
4. Based on the above, what are the main priorities for improving the quality and efficiency of VET
delivery? What (further) policies or actions are already foreseen to address issues relating to the
internal efficiency and quality of VET, and how will these policies or actions be implemented at
national/regional level? Are there major priorities that are not being adequately addressed by current
policies or actions?
Recommended quantitative indicators
� number of VET students compared with those in general education;
� some indications on how to measure the quality in concrete terms (results achieved at the end), such as
completion rates, placement rates, drop-out rates, repetition rates, scores in national tests or international
tests (Programme for International Student Assessment (PISA), Progress in International Reading
Literacy Survey (PIRLS) and Trends in International Mathematics and Science Study (TIMSS), although
the data for the latter two surveys are relatively old);
� student/teacher ratio by programme;
� funds invested in teacher training and/or regularity of teacher training for ensuring quality.
Recommended sources of quantitative and qualitative evidence
� education or VET strategies targets compared with the actual figures for the outcomes from the system;
� analytical VET reports and system assessments in terms of attractiveness, results and achievements;
� descriptions of, or reports on, higher education programmes for VET teachers;
� national and international tests;
� information on completion, drop-out and repetition rates;
� information and data on the length of time between leaving the education system and placement in first
job (in months or years);
� information from employers on satisfaction with the skill levels of VET graduates from initial and
continuing training;
� standards and qualifications developed, curricula revised, textbooks produced or rewritten, materials and
equipment upgraded, etc., in schools or training centres within the past 10 years;
� teachers’ recruitment, qualifications and continuing professional development systems;
� balance between theory and practice in VET curricula, practical learning facilities in schools or in
companies that cooperate with vocational schools or training providers;
� reports from interviews, meetings, focus groups and the media.
THE TORINO PROCESS
12
E. GOVERNANCE AND FINANCING OF THE INITIAL AND
CONTINUING VET SYSTEM AND INSTITUTIONAL CAPACITIES
FOR CHANGE
(THREE TO FOUR PAGES)
This section focuses on the overall system level.
Key questions
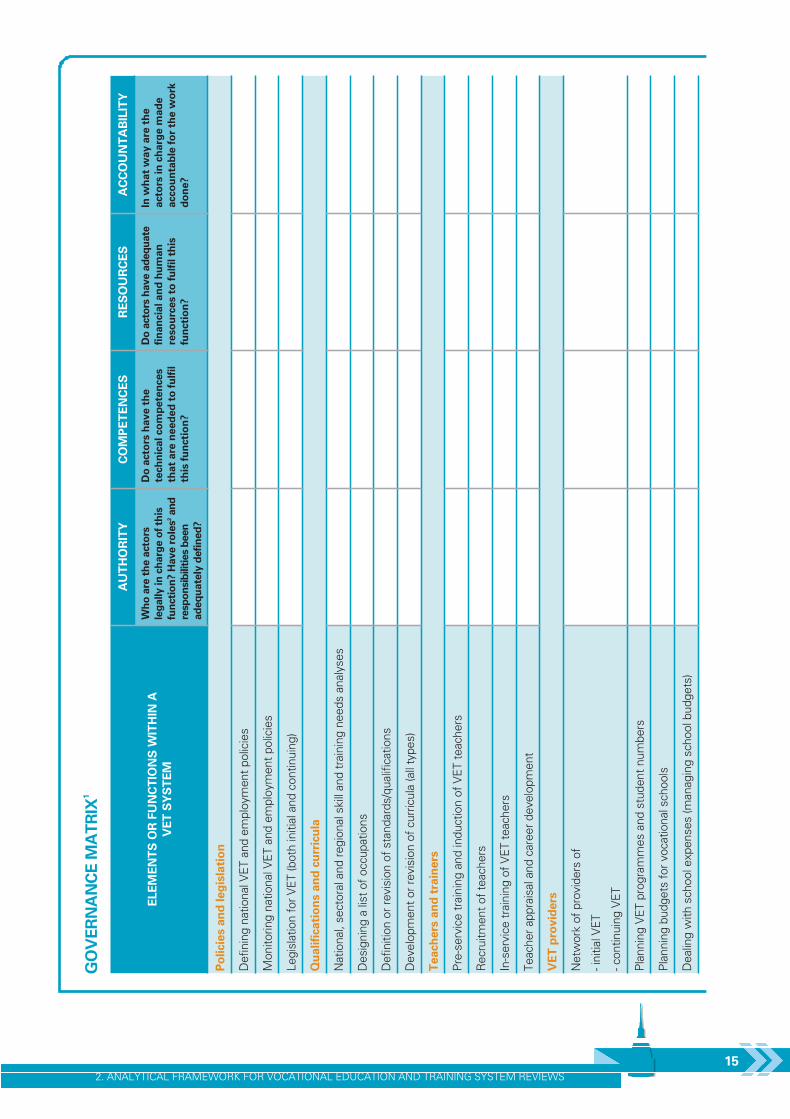
1. Please provide a chart of institutions or bodies involved in the design, implementation and
monitoring/evaluation of the VET system (covering both initial and continuing VET)3. Is there a legal
basis for stakeholder involvement? Analysing the chart, what needs to change as regards roles and
responsibilities, technical competences, resources and accountability of the actors involved in the
governance of initial and continuing VET?
2. What are current issues relating to (the decentralisation of) the management of the VET system? To
what extent are VET providers able to tailor their service delivery to meet specific opportunities or
needs in their local environment?
3. What quality assurance mechanisms4are in place both at system level and at provider level, and what
needs to be done to improve the system in this respect?
4. What are the current issues as regards social partner involvement in the areas of designing legislation
and strategies, VET financing, planning, monitoring and evaluation, designing VET qualifications and
assessing people’s skills, accrediting training providers, etc.?
5. Please provide an overview of total investments over the past five years in the
secondary/post-secondary VET system, as well as investments in adult training, whether public or
private. What are the main criteria for funding VET, and are these criteria applied efficiently and
effectively? What role do donors play in financing the VET system?
6. What changes are required as regards public and private investments and a more efficient
management of funds?
7. How do you assess institutional capacities for reform/innovation and for incorporating change? To
what extent is there a national VET research capacity, and how is it involved in VET development?
8. Based on the above, what are the main priorities for improving governance and financing in the VET
system? What (further) policy initiatives or actions are foreseen for addressing the needs of
governance and financing, and how will these policies and actions be implemented at national/regional
level? Are there major priorities that are not being adequately addressed by current policies or actions?
2. ANALYTICAL FRAMEWORK FOR VOCATIONAL EDUCATION AND TRAINING SYSTEM REVIEWS
13
Governance as a model for policy making in VET is based on involving stakeholders at all levels
(sectoral, local/regional, national and international) in objective setting, implementation and monitoring.
Governance aims to reinforce interaction between stakeholders and improve accountability,
transparency, coherence, efficiency and effectiveness of policy (Cedefop, 2011). The section on
governance focuses both on the roles of actors in managing the system and related efficiency (or
inefficiency), and on the drivers of policy development and reform, including through new forms of
governance.
Quality assurance covers activities involving planning, implementation, evaluation, reporting and
quality improvement that are implemented to ensure that education and training (content of
programmes, curricula, assessment and validation of learning outcomes, etc.) meet the quality
requirements expected by stakeholders (Cedefop, 2011). Section D deals with quality and quality
assurance issues primarily at the micro-level (level of organising teaching and learning processes),
while Section E deals with quality assurance at the macro-level (VET system level) and meso-level
(accreditation and quality assurance of training institutions).
3 To this end, you may use the matrix provided at the end of this section (see p. 15).
4 See, for example, the EU model of Quality Assurance in VET: www.eqavet.eu/qa/gns/home.aspx.
Recommended quantitative indicators
Question 5
� public expenditure on VET as a percentage of total national spending;
� public expenditure on VET and on general education by level;
� cost per pupil attending VET programmes compared to cost per pupil attending general programmes in
upper secondary education;
� information on costs of continuing VET.
Recommended sources of quantitative and qualitative evidence
� national/sectoral/local policies on governance;
� studies on governance/decentralisation of the system, etc.;
� legal framework governing VET;
� national/sectoral/local policies on the financing of VET;
� studies on quality in VET;
� description of existing or planned quality assurance systems;
� studies on financing VET, and the legal framework for training funds;
� overview of donor investments in VET;
� reports from interviews, meetings, focus groups and the media.
THE TORINO PROCESS
14
2. ANALYTICAL FRAMEWORK FOR VOCATIONAL EDUCATION AND TRAINING SYSTEM REVIEWS
15
GO
VE
RN
AN
CE
MA
TR
IX1
ELE
ME
NT
SO
RFU
NC
TIO
NS
WIT
HIN
A
VE
TS
YS
TE
M
AU
TH
OR
ITY
CO
MP
ET
EN
CE
SR
ES
OU
RC
ES
AC
CO
UN
TA
BIL
ITY
Wh
oare
the
acto
rs
leg
ally
inch
arg
eo
fth
is
fun
cti
on
?H
ave
role
s2an
d
resp
on
sib
ilit
ies
been
ad
eq
uate
lyd
efi
ned
?
Do
acto
rsh
ave
the
tech
nic
alco
mp
ete
nces
that
are
need
ed
tofu
lfil
this
fun
cti
on
?
Do
acto
rsh
ave
ad
eq
uate
fin
an
cia
lan
dh
um
an
reso
urc
es
tofu
lfil
this
fun
cti
on
?
Inw
hat
way
are
the
acto
rsin
ch
arg
em
ad
e
acco
un
tab
lefo
rth
ew
ork
do
ne?
Po
licie
san
dle
gis
lati
on
Definin
gnationalV
ET
and
em
plo
ym
ent
polic
ies
Monitoring
nationalV
ET
and
em
plo
ym
ent
polic
ies
Legis
lation
for
VE
T(b
oth
initia
land
continuin
g)
Qu
alifi
cati
on
san
dcu
rric
ula
National,
secto
raland
regio
nalskill
and
train
ing
needs
analy
ses
Desig
nin
ga
list
of
occupations
Definitio
nor
revis
ion
of
sta
ndard
s/q
ualif
ications
Develo
pm
ent
or
revis
ion
of
curr
icula
(all
types)
Teach
ers
an
dtr
ain
ers
Pre
-serv
ice
train
ing
and
induction
of
VE
Tte
achers
Recru
itm
ent
of
teachers
In-s
erv
ice
train
ing
of
VE
Tte
achers
Teacher
appra
isaland
care
er
develo
pm
ent
VE
Tp
rovid
ers
Netw
ork
of
pro
vid
ers
of
-in
itia
lV
ET
-continuin
gV
ET
Pla
nnin
gV
ET
pro
gra
mm
es
and
stu
dent
num
bers
Pla
nnin
gbudgets
for
vocationalschools
Dealin
gw
ith
schoolexpenses
(managin
gschoolbudgets
)

THE TORINO PROCESS
16
ELE
ME
NT
SO
RFU
NC
TIO
NS
WIT
HIN
A
VE
TS
YS
TE
M
AU
TH
OR
ITY
CO
MP
ET
EN
CE
SR
ES
OU
RC
ES
AC
CO
UN
TA
BIL
ITY
Wh
oare
the
acto
rs
leg
ally
inch
arg
eo
fth
is
fun
cti
on
?H
ave
role
s2an
d
resp
on
sib
ilit
ies
been
ad
eq
uate
lyd
efi
ned
?
Do
acto
rsh
ave
the
tech
nic
alco
mp
ete
nces
that
are
need
ed
tofu
lfil
this
fun
cti
on
?
Do
acto
rsh
ave
ad
eq
uate
fin
an
cia
lan
dh
um
an
reso
urc
es
tofu
lfil
this
fun
cti
on
?
Inw
hat
way
are
the
acto
rsin
ch
arg
em
ad
e
acco
un
tab
lefo
rth
ew
ork
do
ne?
Learn
ing
mate
rials
an
deq
uip
men
t
Learn
ing
mate
rials
Work
shop
equip
ment
Pra
cti
calle
arn
ing
sit
es
Lia
ison
with
em
plo
yers
Pra
cticaltr
ain
ing
pla
ces
within
com
panie
s
Appre
nticeship
s
Assessm
en
tan
dcert
ific
ati
on
Assessm
ent
of
stu
dents
’skill
s
Issuin
gcert
ific
ate
s
Mo
nit
ori
ng
an
dim
pact
Monitoring
the
qualit
yof
VE
Tpro
vis
ion
School-to
-work
transitio
nsurv
eys
or
tracer
stu
die
sfo
rgra
duate
s
Researc
han
din
no
vati
on
Researc
hand
innovation,in
clu
din
gth
etr
ansfe
rof
innovations
from
pilo
tto
syste
mle
vel
Do
no
rco
ord
inati
on
Eff
icie
nt
coord
ination
of
donors
inV
ET
Note
s:
1.The
matr
ixshould
be
am
ended
as
appro
priate
and
com
ple
ted
as
far
as
possib
le.P
lease
consid
er
the
various
levels
involv
ed
inth
em
anagem
ent
of
the
syste
m–
from
national,
regio
naland
localto
school(p
rovid
er)
levels
.
2.A
cto
rscould
have
decis
ion-m
akin
g,advis
ory
or
executive
role
s.

2. ANALYTICAL FRAMEWORK FOR VOCATIONAL EDUCATION AND TRAINING SYSTEM REVIEWS
17
KEY INDICATORS THAT WILL BE PROVIDED BY THE ETF STATISTICS TEAM
1. Population
� total population (last 5 years)
� population growth rates (last 5 years)
� population by age group (0–14; 15–24; 25–54; 55–64, 65+) (last 5 years)
Source: UNDP
2. Dependency rates
� total dependency rates (last 5 years)
� young dependency rates (last 5 years)
� old dependency rates (last 5 years)
Source: UNDP
3. Educational attainment of population by gender (last available year)
Source: Labour Force Survey (LFS), national data, where available
4. Illiteracy/literacy rates by gender (last 5 years)
Source: UNESCO
5. GDP growth rate (last 5 years)
Source: World Bank
6. GDP per capita (last 5 years)
Source: World Bank
7. Employment by sector compared to GDP by sector
� employment by main sector (last 5 years)
Source: LFS, national data, where available
� GDP by main sector (last 5 years)
Source: World Bank
8. Competitiveness Index (last 2 years)
Source: World Economic Forum
9. Activity rates by gender (last available year)
Source: LFS, national data, where available
10. Employment rates by gender (last available year)
Source: LFS, national data, where available
11. Unemployment rates by gender (last available year)
Source: LFS, national data, where available
12. Youth unemployment rates, by gender (age 15–24) (last available year)
Source: LFS, national data, where available
13. Changes in employment by status and gender (last 5 years)
Source: LFS, national data, where available
14. Total number of VET students compared to the total number of pupils and students by
level and gender (last available year)
Source: UNESCO
15. Public expenditure on education by level (ISCED 2, 3 and 4) (last available year)
Source: UNESCO
16. PISA results (2009)
Source: OECD
3. GUIDELINES ONQUANTITATIVE INDICATORS
3.1 INTRODUCTION
These guidelines are intended to provide the main definitions that will be useful for understanding the
indicators suggested in the Analytical Framework of the Torino Process.
If the indicators available in your own country differ in definition, please provide us with the definition used.
In addition, please provide the classification used (e.g. educational levels, economic sectors) in case they are
different from the ones proposed in Annex 1.
In order to allow detection of significant changes, data should cover a period of time of at least five years.
For further support, please contact the ETF Statistics Team through your ETF country manager.
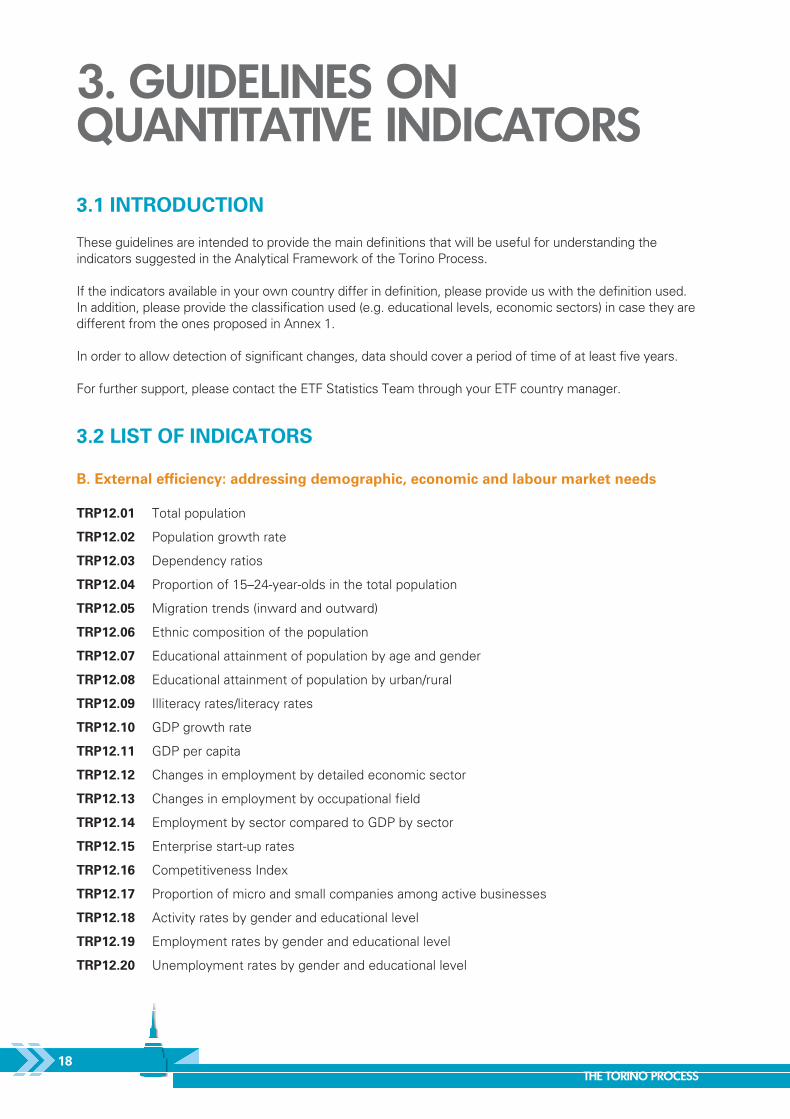
3.2 LIST OF INDICATORS
B. External efficiency: addressing demographic, economic and labour market needs
TRP12.01 Total population
TRP12.02 Population growth rate
TRP12.03 Dependency ratios
TRP12.04 Proportion of 15–24-year-olds in the total population
TRP12.05 Migration trends (inward and outward)
TRP12.06 Ethnic composition of the population
TRP12.07 Educational attainment of population by age and gender
TRP12.08 Educational attainment of population by urban/rural
TRP12.09 Illiteracy rates/literacy rates
TRP12.10 GDP growth rate
TRP12.11 GDP per capita
TRP12.12 Changes in employment by detailed economic sector
TRP12.13 Changes in employment by occupational field
TRP12.14 Employment by sector compared to GDP by sector
TRP12.15 Enterprise start-up rates
TRP12.16 Competitiveness Index
TRP12.17 Proportion of micro and small companies among active businesses
TRP12.18 Activity rates by gender and educational level
TRP12.19 Employment rates by gender and educational level
TRP12.20 Unemployment rates by gender and educational level
THE TORINO PROCESS
18

TRP12.21 Youth unemployment rates by gender and educational level
TRP12.22 Size of the informal economy/employment
TRP12.23 Changes in employment by status and gender
TRP12.24 Public employment as a percentage of total employment
TRP12.25 Small Business Act Entrepreneurial Learning (EL) Index
C. External efficiency: addressing social demands for VET and promoting social inclusion
TRP12.26 Participation in adult learning
TRP12.27 Expenditure on active labour market policies (ALMPs) as a percentage of GDP
TRP12.28 Percentage of registered unemployed covered by ALMPs
TRP12.29 Percentage of VET students who continue to higher levels of education
TRP12.30 Rate of early school leavers
TRP12.31 Number of people with a disability, Roma people, immigrants, those from ethnic minorities,
etc.
TRP12.32 Proportion of young people not in employment, education or training
TRP12.33 Poverty and inequality rates (or proportions)
TRP12.34 Number of first job-seekers and long-term unemployed as a proportion of the total
unemployed (aged 15+)
TRP12.35 Number of VET students as a proportion of the total number of pupils and students by level
and gender
TRP12.36 Participation in VET as a percentage by field of study
TRP12.37 Drop-out rates in upper secondary, general and VET by gender
D. Internal quality and efficiency of initial and continuing VET delivery
TRP12.38 PISA, PIRLS and TIMSS
TRP12.39 Student/teacher ratio by programme
TRP12.40 Funds invested in teacher training and/or regularity of teacher training for ensuring quality
E. Governance and financing of the initial and continuing VET system and institutional
capacities for change
TRP12.41 Public expenditure on VET as a percentage of total national spending
TRP12.42 Public expenditure on VET and on general education by level
TRP12.43 Cost per pupil attending VET programmes compared to cost per pupil attending general
programmes in upper secondary education
TRP12.44 Information on costs of continuing vocational training
3. GUIDELINES ON QUANTITATIVE INDICATORS
19
3.3 DEFINITIONS5
OF INDICATORS FROM THE TORINO PROCESS
ANALYTICAL FRAMEWORK
B. External efficiency: addressing demographic, economic and labour market needs
TRP12.01 Total population
Total population is based on the de facto definition of population, which counts all residents
regardless of legal status or citizenship, except for refugees not permanently settled in the
country of asylum, who are generally considered part of the population of their country of
origin. (World Bank)
TRP12.02 Population growth rate
Population growth rate, between two consecutive years (annual growth), is the percentage
change from one year to another
TRP12.03 Dependency ratios
Age dependency ratio: The ratio of dependants (people younger than 15 or older than 64)
to the working-age population (those aged 15–64). (World Bank)
Age dependency ratio, old: The ratio of older dependants (people older than 64) to the
working-age population (those aged 15–64). (World Bank)
Age dependency ratio, young: The ratio of younger dependants (people younger than 15)
to the working-age population (those aged 15–64). (World Bank)
TRP12.04 Proportion of 15–24-year-olds in the total population
Number of people aged 15–24 expressed as a percentage of the total population.
TRP12.05 Migration trends (inward and outward)
Migration: The movement of a person or a group of persons, either across an international
border, or within a state. It is a population movement, encompassing any kind of movement
of people, whatever its length, composition and causes; it includes migration of refugees,
displaced persons, economic migrants, and persons moving for other purposes, including
family reunification. (International Organisation for Migration (IOM))
Total migration: The sum of the entries or arrivals of immigrants, and of exits or departures
of emigrants, yields the total volume of migration, and is termed ‘total migration’, as distinct
from ‘net migration’, or the migration balance, resulting from the difference between arrivals
and departures. (IOM)
Net migration: The difference between the number of persons entering the territory of a
state and the number of persons who leave the territory in the same period. Also called
‘migratory balance’. This balance is called ‘net immigration’ when arrivals exceed
departures, and ‘net emigration’ when departures exceed arrivals. (IOM)
Migrant flow: The number of migrants counted as moving or being authorised to move, to
or from a given location in a defined period of time. (IOM)
Migrant stock: The number of migrants residing in a country at a particular point in time.
(IOM)
TRP12.06 Ethnic composition of the population
The number of people belonging to a particular ethnic group expressed as a percentage of
the total population.
The definition of each ethnic group should be according to national standards. Please
specify the definition.
TRP12.07 Educational attainment of population by age and gender
Total population by level of education, age group and gender.
Age groups: Usually 0–14, 15–24, 25–54, 55–64 and 65+.
Educational attainment: The highest grade completed within the most advanced level
attended in the education system of the country where the education was received.
Educational levels: For comparability reasons it is recommended that ISCED levels should
be used (see Annex 1.1).
THE TORINO PROCESS
20
5 The sources of the definitions are given, where relevant.

TRP12.08 Educational attainment of population by urban/rural
Follow national definitions for urban and rural areas. Please specify the definition.
TRP12.09 Illiteracy rates/literacy rates
Illiteracy rate: The percentage of the population in a given age range (usually 15 and over)
who cannot both read and write with understanding a short simple statement on their
everyday life. (UNESCO)
Literacy rate: The percentage of the population in a given age range (usually 15 and over)
who can both read and write with understanding a short simple statement on their everyday
life. Generally, ‘literacy’ also encompasses ‘numeracy’, the ability to make simple arithmetic
calculations. (UNESCO)
TRP12.10 GDP growth rate
GDP growth (annual %): Annual percentage growth rate of GDP at market prices based on
constant local currency. Aggregates are based on constant US dollars (using 2000 as the
baseyear). (World Bank)
GDP: The sum of gross value added by all resident producers in the economy plus any
product taxes and minus any subsidies not included in the value of the products. It is
calculated without making deductions for depreciation of fabricated assets or for depletion
and degradation of natural resources. (World Bank)
TRP12.11 GDP per capita
GDP per capita, PPP (current international dollar): GDP per capita based on purchasing
power parity (PPP). PPP GDP is gross domestic product converted to international dollars
using purchasing power parity rates. An international dollar has the same purchasing power
over GDP as the US dollar has in the United States. (World Bank)
GDP at purchaser’s prices: The sum of gross value added by all resident producers in the
economy plus any product taxes and minus any subsidies not included in the value of the
products. It is calculated without making deductions for depreciation of fabricated assets or
for depletion and degradation of natural resources. Data are in current international dollars.
(World Bank)
Purchasing power parity (PPP): An exchange rate calculated by comparing the cost of a
common basket of commodities in every country and expressing them in an artificial
common currency (purchasing power standard (PPS)) that equalises the purchasing power
of different national currencies. PPP is both a currency converter and a price deflator, as it
eliminates the differences in price levels between countries.
TRP12.12 Changes in employment by detailed economic sector
This indicator analyses the annual change in employment by sector; it requires annual data
on the total number of people employed, aged 15–64, by economic sector.
Economic sectors: For comparability reasons please refer to NACE classification (see
Annex 1.2).
TRP12.13 Changes in employment by occupational field
This indicator analyses the annual change in employment by occupation; it requires annual
data on the total number of people employed, aged 15–64, by occupation.
Occupational fields: For comparability reasons please refer to ISCO classification (see
Annex 1.3).
TRP12.14 Employment by sector compared to GDP by sector
This indicator compares data on employment by sector (TRP12.12) and GDP by sector,
broken down as follows.
Agriculture, value added (percentage of GDP): Agriculture corresponds to International
Standard Industrial Classification (ISIC) divisions 1–5 and includes forestry, hunting and fishing,
as well as cultivation of crops and livestock production. Value added is the net output of a
sector after adding up all outputs and subtracting intermediate inputs. It is calculated without
making deductions for depreciation of fabricated assets or depletion and degradation of
natural resources. The origin of value added is determined by ISIC, revision 3. (World Bank)
Industry, value added (percentage of GDP): Industry corresponds to ISIC divisions 10–45
and includes manufacturing (ISIC divisions 15–37). It comprises value added in mining,
3. GUIDELINES ON QUANTITATIVE INDICATORS
21

manufacturing (also reported as a separate subgroup), construction, electricity, water and
gas. Value added is the net output of a sector after adding up all outputs and subtracting
intermediate inputs. It is calculated without making deductions for depreciation of fabricated
assets or depletion and degradation of natural resources. The origin of value added is
determined by ISIC, revision 3. (World Bank)
Services, etc., value added (percentage of GDP): Services correspond to ISIC divisions
50–99 and include value added in wholesale and retail trade (including hotels and
restaurants), transport, and government, financial, professional and personal services such
as education, health care and real estate services. Also included are imputed bank service
charges, import duties and any statistical discrepancies noted by national compilers as well
as discrepancies arising from rescaling. Value added is the net output of a sector after
adding up all outputs and subtracting intermediate inputs. It is calculated without making
deductions for depreciation of fabricated assets or depletion and degradation of natural
resources. The industrial origin of value added is determined by ISIC, revision 3. (World Bank)
TRP12.15 Enterprise start-up rate
New enterprises (created within the last year) expressed as a proportion of all enterprises.
TRP12.16 Competitiveness Index
This index captures the microeconomic and macroeconomic foundations of national
competitiveness. Competitiveness is defined as the set of institutions, policies and factors
that determine the level of productivity of a country.
The index provides a score from 1 to 7 – the higher, the better. (World Economic Forum)
TRP12.17 Proportion of micro and small companies among active businesses
The proportion of micro and small companies expressed as a percentage of the number of
active businesses. The definitions of micro and small companies will vary from country to
country according to existing national definitions, which should also be provided. The
European Commission defines a ‘micro’ enterprise as an enterprise with less than 10
employees and a ‘small’ enterprise as one with less than 50 employees (Recommendation
2003/361/EC).
TRP12.18 Activity rates by gender and educational level
Activity rates (labour force participation rate) represent the labour force as a percentage of
the population of working age (typically 15–64 years). The labour force comprises both
employed and unemployed persons.
The age range for the working-age population must be clearly stated. It can be 15–64, 15–70
or 15+. It will be beneficial if activity, employment and unemployment rates are calculated
on the basis of the same age ranges.
TRP12.19 Employment rates by gender and educational level
The total employment rate is calculated by dividing the number of persons aged 15–64
years (typically) in employment by the total population of the same age group. (Eurostat)
The age range for the working-age population must be clearly stated. It can be 15–64, 15–70
or 15+. It will be beneficial if activity, employment and unemployment rates are calculate on
the basis of the same age ranges.
TRP12.20 Unemployment rates by gender and educational level
The total unemployment rate monitors the number of unemployed persons aged 15 and
over as a percentage of the labour force. (Eurostat)
The age range for the working-age population must be clearly stated. It can be 15–64, 15–70
or 15+. It will be beneficial if activity, employment and unemployment rates are calculate on
the basis of the same age ranges.
TRP12.21 Youth unemployment rates by gender and educational level
Unemployed persons aged 15–24 as a percentage of the labour force aged 15–24.
Unemployed persons aged 25–34 as a percentage of the labour force aged 25–34.
TRP12.22 Size of the informal economy/employment
There is no agreed international definition for the informal economy or employment. Please
provide your national definition if you have data on this.
THE TORINO PROCESS
22

TRP12.23 Changes in employment by status and gender
Status in employment: The status of an economically active person with respect to his or
her employment, that is to say, the type of explicit or implicit contract of employment with
other persons or organisations that the person has in his/her job.
It is recommended that the economically active population should be classified by status in
employment as follows:
� employees, among whom it may be possible to distinguish between employees with
stable contracts (including regular employees) and other employees;� employers;� own-account workers;� contributing family workers;� members of producers’ cooperatives;� persons not classifiable by status.
(ICSE-93)
TRP12.24 Public employment as a percentage of total employment
Number of people employed in the public sector as a proportion of the total number of
employed.
Total public sector employment: This covers all employment of the general government
sector as defined in System of National Accounts 1993 plus employment in publicly owned
enterprises and companies, resident and operating at central, state (or regional) and local
levels of government. It covers all persons employed directly by those institutions, without
regard for the particular type of employment contract. (ILO)
TRP12.25 Small Business Act Entrepreneurial Learning Index
The ETF’s Entrepreneurial Learning Team can provide a comprehensive overview of the
entrepreneurial learning indicators and a given country’s assessment. This can be done for
countries that have participated in an assessment of the national entrepreneurial learning
environment. This information will be provided to the relevant country teams.
C. External efficiency: addressing social demands for VET and promoting social inclusion
TRP12.26 Participation in adult learning
Percentage of 25–64-year-olds having participated in lifelong learning by gender.
Percentage of 25–34-year-olds having participated in lifelong learning by gender.
This is understood to mean having participated in any training or learning activity in the
four-week reference period prior to the interview (it is assumed that data will come from
labour force surveys or similar).
TRP12.27 Expenditure on active labour market policies (ALMPs) as a percentage of GDP
ALMPs: These include all social expenditure (other than education) that is aimed at
improving the beneficiaries’ prospect of finding gainful employment or otherwise increasing
their earnings capacity. This category includes spending on public employment services and
administration, labour market training, special programmes for young people when in
transition from school to work, labour market programmes to provide or promote
employment for unemployed and other persons (excluding young and disabled persons) and
special programmes for those with a disability.
TRP12.28 Percentage of registered unemployed covered by ALMPs
Number of registered unemployed people covered by ALMPs, expressed as percentage of
total registered unemployment.
Registered unemployment: This includes persons aged 15 and over who are registered
with the official employment agency and are seeking temporary or permanent work. They
must have the right to work, be available for work, be capable of working and be without
gainful employment on the day of the unemployment count. (OECD)
3. GUIDELINES ON QUANTITATIVE INDICATORS
23
TRP12.29 Percentage of VET students who continue to higher levels of education
Number of VET students who continue to higher levels of education, expressed as a
percentage of the total number of VET students.
VET: See ISCED 97 educational programmes in Annex 1.1.
TRP12.30 Rate of early school leavers
Proportion of the population aged 18–24 with at most ISCED level 2 (i.e. those with an
education below upper secondary qualification), and not in education or training. (Eurostat)
TRP12.31 Number of people with a disability, Roma people, immigrants, those from ethnic
minorities, etc.
Number of people with a disability, Roma people, immigrants and those from ethnic
minorities (as defined nationally) as a proportion of the total population. Please provide the
national definitions where relevant.
TRP12.32 Proportion of young people not in employment, education or training
Number of people aged 15–24 who are not in employment, education or training, as a
percentage of the total number of people aged 15–24. If national data do not allow for the
use of this age range, please provide a clear indication of the age range that has been used.
TRP12.33 Poverty and inequality rates (or proportions)
Poverty headcount ratio at US dollars (USD) 1.25 or USD 2 a day, percentage of
population: The percentage of the population living with less than USD 1.25 or USD 2 a day
at 2005 international prices. (World Bank)
At-risk-of-poverty rate: The proportion of people who have an equivalised disposable
income below the at-risk-of-poverty threshold (set at 60% of the national median equivalised
disposable income). (Eurostat)
Equivalised income: The household’s total income divided by its ‘equivalised size’. Each
household member is treated according to the ‘modified OECD equivalence scale’, which
gives a weight of 1.0 to the first adult, 0.5 to any other household member aged 14 and
over, and 0.3 to each child. It takes account of the size and composition of the household.
Gini coefficient: Measures the extent to which the distribution of income (or, in some
cases, consumption expenditure) among individuals or households within an economy
deviates from a perfectly equal distribution. A value of 0 indicates total equality and a value
of 1 maximal inequality (sometimes it is multiplied by 100). (World Bank)
TRP12.34 Number of first job-seekers and long-term unemployed as a proportion of the total
unemployed (aged 15+)
Unemployed persons aged 15+ who are looking for a job for the first time as a percentage
of the total unemployed aged 15+.
Unemployed persons aged 15+ who are long-term unemployed as a percentage of the total
unemployed aged 15+.
Long-term unemployed: Persons who have been unemployed for 12 months or more.
(Eurostat)
TRP12.35 Number of VET students as a proportion of the total number of pupils and students
by level and gender
Number of students enrolled in VET as a percentage of the total number of students
enrolled in the educational levels concerned. (The educational levels that include VET
programmes vary between countries, but are usually ISCED 2, 3 or 4.)
Number of students enrolled in the different educational levels by gender.
VET and educational levels: See ISCED 97 educational programmes and levels in
Annex 1.1.
TRP12.36 Participation in VET as a percentage by field of study
Percentage of students enrolled in VET programmes by field of study.
Fields of study: See ISCED 97 broad groups and fields of education in Annex 1.1.
THE TORINO PROCESS
24

TRP12.37 Drop-out rates in upper secondary, general and VET by gender
Proportion of pupils/students from a cohort enrolled in a given level, in a particular
programme, in a given school year who are no longer enrolled in the following school year.
Upper secondary education: See ISCED 97 educational levels in Annex 1.1.
General and VET: See ISCED 97 educational programmes in Annex 1.1.
D. Internal quality and efficiency of initial and continuing VET delivery
TRP12.38 PISA, PIRLS and TIMSS
Programme for International Student Assessment (PISA): Assesses how far students
near the end of compulsory education have acquired some of the knowledge and skills that
are essential for full participation in society. In all cycles, the domains of reading,
mathematical and scientific literacy are covered, not merely in terms of mastery of the
school curriculum, but in terms of important knowledge and skills needed in adult life.
(OECD)
Progress in International Reading Literacy Study (PIRLS): Focuses on the achievement
of children in their fourth year of schooling and the experiences they have at home and at
school in learning to read. For PIRLS, reading literacy is defined as the ability to understand
and use those written language forms required by society and/or valued by the individual.
(International Association for the Evaluation of the Educational Achievement (IEA))
Trends in International Mathematics and Science Study (TIMSS): Carried out every four
years at the fourth and eighth grades, and provides data about trends in mathematics and
science achievement over time. (IEA)
TRP12.39 Student/teacher ratio by programme
Average number of pupils (students) per teacher at a specific level of education in a given
school year.
Educational programmes: See ISCED 97 educational programmes in Annex 1.1.
TRP12.40 Funds invested in teacher training and/or regularity of teacher training for ensuring
quality
Training of trainers: Theoretical or practical training for teachers and trainers:
� is for teaching/training personnel who are practising either: (i) as professional teachers or
trainers; or (ii) as professionals in a given field who accompany trainees in their work
environment (occasional teachers or trainers);� covers a wide range of skills: knowledge specific to the field in question (general, technical
or scientific); educational, psychological and sociological skills; management skills; familiarity
with the world of work; and knowledge of training schemes and target audience;� covers training relating to course design, and to the organisation, implementation and
content of training activities, i.e. imparting knowledge, know-how and skills.
(Cedefop)
E. Governance and financing of the initial and continuing VET system and institutional
capacities for change
TRP12.41 Public expenditure on VET as a percentage of total national spending
Public expenditure on VET as a proportion of national gross domestic product (GDP).
Public expenditure on VET as a proportion of total government expenditure.
Public expenditure on VET as a proportion of total public education expenditure.
VET: See ISCED 97 educational programmes in Annex 1.1.
TRP12.42 Public expenditure on VET and on general education by level
Public expenditure on education by educational programme and level, for the national
educational levels that include VET programmes.
Educational level: See ISCED 97 educational levels in Annex 1.1.
Educational programme: See ISCED 97 educational programmes in Annex 1.1.
3. GUIDELINES ON QUANTITATIVE INDICATORS
25
TRP12.43 Cost per pupil attending VET programmes compared to cost per pupil attending
general programmes in upper secondary education
Expenditure on VET divided by the number of pupils enrolled in VET, and expenditure on
general programmes divided by the number of pupils enrolled in general programmes.
Educational programmes: See ISCED 97 educational programmes in Annex 1.1.
Upper secondary education: See ISCED 97 educational levels in Annex 1.1.
TRP12.44 Information on costs of continuing vocational training
Continuing vocational training and adult learning: Continuing vocational training takes
place after initial education or entry into working life and aims to help people to improve or
update their knowledge and skills or to acquire new ones. (Cedefop)
THE TORINO PROCESS
26

ANNEXES
ANNEX 1. ISCED 97, NACE AND ISCO CLASSIFICATIONS
Annex 1.1 ISCED 97 – International Standard Classification of Education (UNESCO)
27
GENERAL SCHEME
LEVEL NAME PROGRAMMES
ISCED 0 Pre-primary education
ISCED 1 Primary education or first stage of basic education
ISCED 2 Lower secondary or second stage of basic education 2A – general education
2B – general education
2C – vocational education and training
ISCED 3 Upper secondary education 3A – general education
3B – general education
3C – vocational education and training
ISCED 4 Post-secondary non-tertiary education 4A – general education
4B – vocational education and training
ISCED 5 First stage of tertiary education 5A – general education
5B – vocational education and training
ISCED 6 Second stage of tertiary education

THE TORINO PROCESS
28
EDUCATIONAL LEVELS
Pre-primary education (ISCED 0)
Programmes at the initial stage of organised instruction, primarily designed to introduce very young
children, usually from the age of three, to a school-type environment, and provide a bridge between
home and school. Upon completion of these programmes, children continue their education at
ISCED 1 (primary education).
Primary education (ISCED 1)
Programmes normally designed on a unit or project basis to give pupils a sound basic education in
reading, writing and mathematics along with an elementary understanding of other subjects such as
history, geography, natural science, social science, art and music. Religious instruction may also be
featured. Sometimes called ‘elementary education’.
Lower secondary education (ISCED 2)
Programmes typically designed to complete the development of basic skills and knowledge that
began at ISCED 1. In many countries the educational aim is to lay the foundation for lifelong learning
and individual development. The programmes at this level are usually on a subject-oriented pattern,
requiring specialist teachers for each subject area. The end of this level often coincides with the end
of compulsory education.
Upper secondary education (ISCED 3)
This level of education typically begins at the end of full-time compulsory education, for those
countries that have a system of compulsory education. More specialisation may be observed at this
level than at ISCED 2, and often teachers need to be more qualified or specialised. The age of entry to
this level is typically 15 or 16 years.
Post-secondary non-tertiary education (ISCED 4)
Programmes that lie between the upper secondary and tertiary levels of education from an
international point of view, even though they may be clearly considered as upper secondary or tertiary
programmes in a national context. They are often not significantly more advanced than programmes
at ISCED 3 (upper secondary), but they serve to broaden the knowledge of participants who have
already completed a programme at level 3. The students are usually older than those at level 3.
ISCED 4 programmes typically last between six months and two years.
Tertiary or higher education (ISCED 5 and 6)
Programmes with an educational content more advanced than that offered at ISCED 3 and 4. The first
stage of tertiary education, ISCED 5, covers level 5A, which consists of mainly theory-based
programmes intended to provide sufficient qualifications for gaining entry to advanced research
programmes and professions with high skill requirements; and level 5B, where programmes are
generally more practical, technical and/or occupationally specific. The second stage of tertiary
education, ISCED 6, comprises programmes devoted to advanced study and original research, leading
to the award of an advanced research qualification.
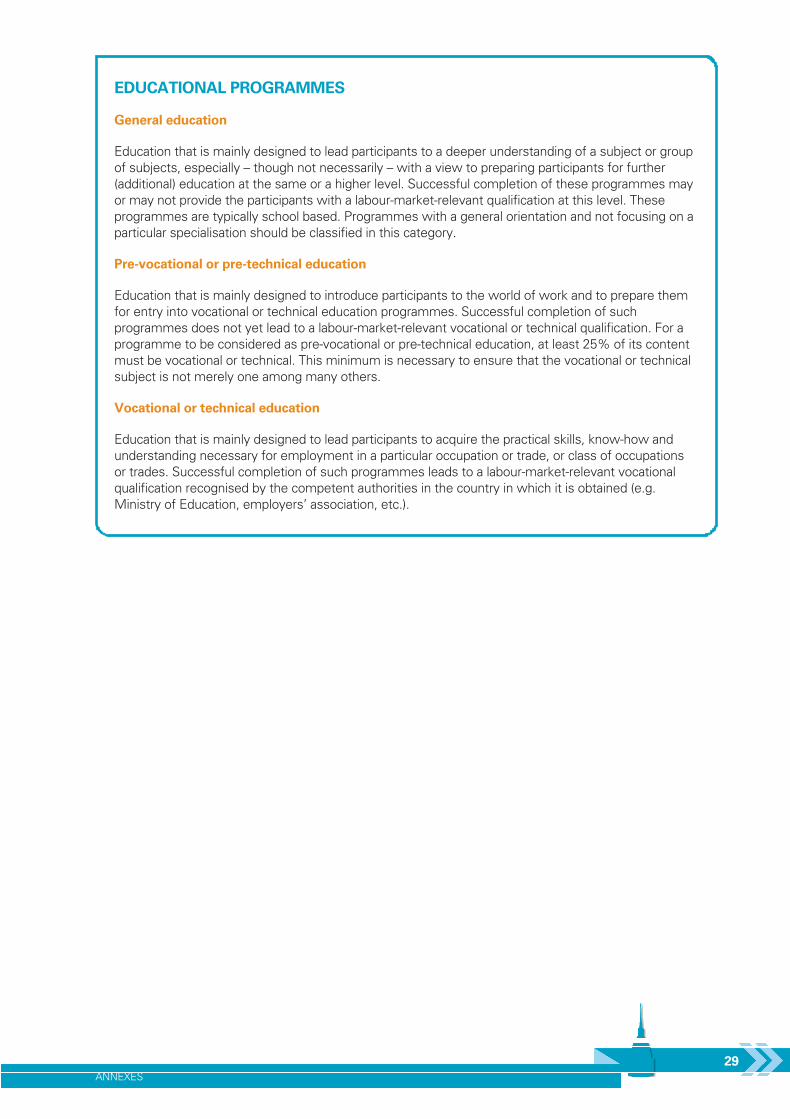
ANNEXES
29
EDUCATIONAL PROGRAMMES
General education
Education that is mainly designed to lead participants to a deeper understanding of a subject or group
of subjects, especially – though not necessarily – with a view to preparing participants for further
(additional) education at the same or a higher level. Successful completion of these programmes may
or may not provide the participants with a labour-market-relevant qualification at this level. These
programmes are typically school based. Programmes with a general orientation and not focusing on a
particular specialisation should be classified in this category.
Pre-vocational or pre-technical education
Education that is mainly designed to introduce participants to the world of work and to prepare them
for entry into vocational or technical education programmes. Successful completion of such
programmes does not yet lead to a labour-market-relevant vocational or technical qualification. For a
programme to be considered as pre-vocational or pre-technical education, at least 25% of its content
must be vocational or technical. This minimum is necessary to ensure that the vocational or technical
subject is not merely one among many others.
Vocational or technical education
Education that is mainly designed to lead participants to acquire the practical skills, know-how and
understanding necessary for employment in a particular occupation or trade, or class of occupations
or trades. Successful completion of such programmes leads to a labour-market-relevant vocational
qualification recognised by the competent authorities in the country in which it is obtained (e.g.
Ministry of Education, employers’ association, etc.).

THE TORINO PROCESS
30
BROAD GROUPS AND FIELDS OF EDUCATION
For further details: www.unesco.org/education/information/nfsunesco/doc/isced_1997.htm
0 General programmes 01 Basic programmes
08 Literacy and numeracy
09 Personal development
1 Education 14 Teacher training and education science
2 Humanities and arts 21 Arts
22 Humanities
3 Social sciences, business and law 31 Social and behavioural science
32 Journalism and information
34 Business and administration
38 Law
4 Science 42 Life sciences
44 Physical sciences
46 Mathematics and statistics
48 Computing
5 Engineering, manufacturing and construction 52 Engineering and engineering trades
54 Manufacturing and processing
58 Architecture and building
6 Agriculture 62 Agriculture, forestry and fishery
64 Veterinary
7 Health and welfare 72 Health
76 Social services
8 Services 81 Personal services
84 Transport services
85 Environmental protection
86 Security services
Not known or unspecified

Annex 1.2 NACE – Statistical Classification of Economic Activities (Eurostat)
ANNEXES
31
BROAD GROUPS AND MAIN CORRESPONDENCES
For further details:
http://circa.europa.eu/irc/dsis/nacecpacon/info/data/en/NACE%20Rev%202%20structure%20+%20explanatory%20notes%20-%20EN.pdf
NACE REV 1.1 NACE REV 2
Agriculture Agriculture, hunting, forestry and fishing Agriculture, forestry and fishing
Industry Mining and quarrying Mining and quarrying
Manufacturing Manufacturing
Electricity, gas and water supply Electricity, gas, steam and air conditioning
supply
Water supply; sewerage, waste
management and remediation activities
Construction Construction
Services Wholesale and retail trade; repair of motor
vehicles, motorcycles and personal and
household goods
Wholesale and retail trade; repair of motor
vehicles and motorcycles
Hotels and restaurants Accommodation and food service activities
Transport, storage and communication Transportation and storage
Information and communication
Financial intermediation Financial and insurance activities
Real estate, renting and business activities Real estate activities
Professional, scientific and technical activities
Administrative and support service activities
Public administration and defence;
compulsory social security
Public administration and defence;
compulsory social security
Education Education
Health and social work Human health and social work activities
Other community, social, personal service
activities
Arts, entertainment and recreation
Other service activities
Activities of households Activities of households as employers;
undifferentiated goods- and
services-producing activities of households
for own use
Extra-territorial organisations and bodies Activities of extra-territorial organisations and
bodies

Annex 1.3 ISCO – International Standard Classification of Occupations (ILO)
ANNEX 2. TORINO DECLARATION
11 May 2011
We, the participants at the high level international conference ‘Torino Process: Learning from Evidence’,
organised by the European Training Foundation (ETF) in Turin on 9-11 May 2011, representing the ETF
partner countries, European Union Member States and international organisations discussed the importance
of evidence in the vocational education and training policy cycle.
Our discussions were inspired by European policies, tools and approaches, and in particular the Education
and Training 2020 initiative, the EU Employment Strategy, the Copenhagen Process, and the external
relations policies which place skills at the heart of sustainable development. Our work has also been framed
by the increasing attention given to skills strategies for strong economic development and job creation in the
international community, including the G20. Our debates have also been enriched by evidence of progress in
reform in VET illustrated by cases from the ETF partner countries. These inspirations will help us to improve
our VET policies and systems according to our contexts.
For the ETF’s partners, the Torino Process has provided a valuable opportunity to review the efficiency and
effectiveness of VET policies. This includes their contribution to sustainable and inclusive growth and
economic development. The Torino Process confirmed priorities for the further development of our VET
policies and systems, as well as for policy dialogue with the EU and international community. In particular,
the following policy priorities were confirmed during the conference:
� ensuring the relevance of skills provision and increased employability;
� providing an integrated, lifelong learning approach to education and training;
� supporting the changing role of the teachers, trainers and managers of VET institutions;
� improving opportunities for access to education and training for all;
� investing in quality and improving the attractiveness of VET;
� reinforcing anticipatory, inclusive and good multi-level governance, also through education and business
cooperation and enhanced social dialogue;
� stimulating creativity and innovation also through entrepreneurial learning.
THE TORINO PROCESS
32
MAIN GROUPS
ISCO 08 CODE TITLE
1 Managers
2 Professionals
3 Technicians and associate professionals
4 Clerical support workers
5 Service and sales workers
6 Skilled agricultural, forestry and fishery workers
7 Craft and related trades workers
8 Plant and machine operators, and assemblers
9 Elementary occupations
0 Armed forces occupations
For further details: www.ilo.org/public/english/bureau/stat/isco/isco08/index.htm

The Torino Process has underlined the value of structured evidence in guiding policy decisions from
formulation, adoption and implementation to monitoring and evaluation in line with international
developments. In addition, the assessment methodology adopted by the Torino Process, inspired by the
Bruges Review, has encouraged national authorities to take a leading role in driving the assessment process.
This helps to build a strong sense of ownership for the outcomes. The participatory approach has also
reinforced the role of national networks of stakeholders representing economic and social interests in the
policy cycle under the leadership of national institutions. The Torino Process has also provided a framework
for peer-to-peer learning, policy dialogue and exchange with other partners facing similar policy challenges,
including the European Union institutions and Member States.
The conference provided a structured opportunity for institutions and experts to share practice and
experience on the contribution of evidence to policy making, as well as the importance of methods, tools
and inter-institutional cooperation. As a result, we identified a number of short-term actions for consideration
by each country according to its context:
� articulate a strong vision;
� focus on solutions with sustainable results in mind;
� strengthen national partnerships and peer learning opportunities;
� strengthen governance and accountability.
The conference was an important occasion for policy leaders to work together to share knowledge and build
a network across the countries and with the EU institutions. It was a strategic and effective platform for
tackling the critical socio-economic policy challenges facing our countries, with a view to boosting youth
employment through improving the transition from education to work; and increasing the contribution of VET
to competitiveness through creativity and innovation.
We appreciate the launch of the second 2012 round of the Torino Process at the conference to update the
2010 assessment. We acknowledge the principles reaffirmed for the second round, notably:
� the holistic approach linking education, training, employment, economic and social development;
� the importance of national ownership and leadership;
� the active participation of social and economic stakeholders in the process;
� the focus on evidence to guide decisions through the policy cycle.
We welcome the ETF’s support and cooperation for the second round, and call upon the EU and the
international community to cooperate in the review process and its outcomes.
We welcome the ETF Torinet initiative to build capacity in partner countries in this critical area.
We call for the EU, through the ETF, to continue providing opportunities for policy learning at the highest
level.
Finally we thank the ETF for this rich opportunity and call upon the agency to arrange a further occasion for
policy learning to celebrate the second round of the Torino Process.
ANNEXES
33

ACRONYMS
ALMPs Active labour market policies
Cedefop European Centre for the Development of Vocational Training – EU agency (Centre européen pour
le développement de la formation professionnelle)
ETF European Training Foundation – EU agency
EU European Union
GDP Gross domestic product
ILO International Labour Organisation
IOM International Organisation for Migration
ISCED International Standard Classification of Education
ISCO International Standard Classification of Occupations
ISIC International Standard Industrial Classification
LFS Labour Force Survey
NACE Classification of Economic Activities in the European Community (Nomenclature des activités
économiques dans la Communauté européenne)
OECD Organisation for Economic Cooperation and Development
PIRLS Progress in International Reading Literacy Study (OECD)
PISA Programme for International Student Assessment (OECD)
PPP Purchasing power parity
TIMSS Trends in International Mathematics and Science Study (OECD)
UNDP United Nations Development Programme
UNESCO United Nations Educational, Scientific and Cultural Organisation
USD US dollar
VET Vocational education and training
THE TORINO PROCESS
34

REFERENCES
Cedefop (European Centre for the Development of Vocational Training), Terminology of European education
and training policy: a selection of 100 key terms, Office for Official Publications of the European
Communities, Luxembourg, 2008. Last accessed 14 November 2011 at:
www.cedefop.europa.eu/en/Files/4064_EN.PDF
Cedefop (European Centre for the Development of Vocational Training), Glossary: quality in education and
training, Publications Office of the European Union, Luxembourg, 2011. Last accessed 14 November 2011
at: www.cedefop.europa.eu/EN/Files/4096_en.pdf
European Commission, Towards more knowledge-based policy and practice in education and training,
Commission staff working document, SEC(2007) 1098, Brussels, 2007.
The Bruges Communiqué on Enhanced European Cooperation in Vocational Education and Training for the
period 2011-2020, Bruges, 7 December 2010.
35


THE TORINOPROCESS
CONTACT US
Further information can befound on the ETF website:
For any additional informationplease contact:
European Training FoundationCommunication DepartmentVilla GualinoViale Settimio Severo 65I – 10133 Torino
[email protected]+39 011 630 2200+39 011 630 2222
E
F
T
www.etf.europa.eu