Embed Size (px)
Citation preview
Journal of Marine Research 72 165ndash181 2014
The transport of nutrient-rich Indian Ocean water throughthe Red Sea and into coastal reef systems
by James H Churchill12 Amy S Bower1 Daniel C McCorkle3 andYasser Abualnaja4
ABSTRACTDriven by upwelling-favorable monsoon winds nutrient-rich Gulf of Aden Intermediate Water
(GAIW) enters the Red Sea from the Indian Ocean each summer Hydrographic and velocity dataacquired in autumn 2011 provide the first indication that GAIW is carried rapidly northward along theeastern Red Sea margin in a well-defined subsurface current with speeds gt30 cm sminus1 The nutrient-rich (NO2 + NO3 concentrations up to 17 μmol lminus1) GAIW overlaps the euphotic zone and appearsto fuel enhanced productivity over depths of 35ndash67 m GAIW is broadly distributed through the RedSea extending northward along the eastern Red Sea boundary to sim24N and carried across the RedSea in the circulation of a basin-scale eddy Of particular significance is the observed incursion ofGAIW into coastal areas with dense coral formations suggesting that GAIW could be an importantsource of new nutrients to coral reef ecosystems of the Red Sea
1 Introduction
The Red Sea is a nearly completely enclosed basin with the sole significant connectionto the open ocean through the narrow (sim25-km width) shallow (sim160-m sill depth) Babal Mandeb (BAM) Strait at its southern end (Fig 1) Heileman and Mistafa (2008) haveclassified the Red Sea as a Class 1 highly productive large marine ecosystem The intro-duction of new water-borne nutrients to the Red Sea is limited to a single principal sourcea seasonal intrusion of Indian Ocean water (Khimitsa and Bibik 1979 Souvermezoglouet al 1989) known as Gulf of Aden Intermediate Water (GAIW) which flows through BAMduring summer (JunendashSeptember) This seasonal influx results from upwelling-favorablemonsoon winds over the western Gulf of Aden which elevate GAIW above the BAM silldepth and produce a hydrostatic pressure gradient driving GAIW northward through thestrait (Patzert 1974) Typically sandwiched between outward flowing layers of Red SeaSurface Water above and Red Sea Overflow Water below GAIW streams through BAM
1 Department of Physical Oceanography Woods Hole Oceanographic Institution Woods Hole MA 025432 Corresponding author e-mail jchurchillwhoiedu3 Department of Geology and Geophysics Woods Hole Oceanographic Institution Woods Hole MA 025434 Red Sea Research Center King Abdullah University of Science and Technology Thule Saudi Arabia
copy 2014 James H Churchill Amy S Bower Daniel C McCorkle and Yasser Abualnaja
165
166 Journal of Marine Research [72 3
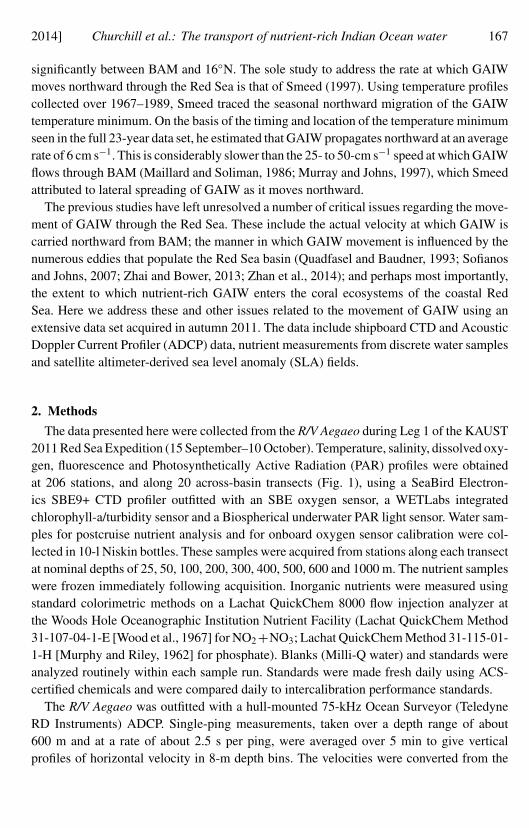
Figure 1 CTD stations of the September-October 2011 RV Aegaeo cruise in the Red Sea withtransect numbers (1ndash20) indicated The contour lines roughly mark the 150-m isobath at the upperedge of the Red Searsquos central basin As shown in subsequent figures the coastal region inshore ofthe basin is complicated and includes many channels of gt150-m depth which are not contouredabove
over a 30- to 120-m depth range (Palzert 1974 Murray and Johns 1997) and at a rate of022ndash036 Sv (Maillard and Soliman 1986 Murray and Johns 1997 Sofianos et al 2002)It enters the Red Sea as a relatively cold (174C at 75 m in BAM vs 314C in the top 10m) fresh (358 vs 374 psu) and nutrient-rich (eg NO3 235 vs 09 μmol lminus1) water mass(Poisson et al 1984 Maillard and Soliman 1986 Souvermezoglou et al 1989)
Observations of GAIW propagation through the Red Sea have thus far been limitedprincipally to temperature and Conductivity-Temperature-Depth (CTD) data The most-detailed study of a GAIW intrusion to date is that of Sofianos and Johns (2007) whoutilized CTD data from an August 2001 cruise of the Red Sea They found GAIW tobe concentrated on the eastern Red Sea margin with core property anomalies decreasing
2014] Churchill et al The transport of nutrient-rich Indian Ocean water 167
significantly between BAM and 16N The sole study to address the rate at which GAIWmoves northward through the Red Sea is that of Smeed (1997) Using temperature profilescollected over 1967ndash1989 Smeed traced the seasonal northward migration of the GAIWtemperature minimum On the basis of the timing and location of the temperature minimumseen in the full 23-year data set he estimated that GAIW propagates northward at an averagerate of 6 cm sminus1 This is considerably slower than the 25- to 50-cm sminus1 speed at which GAIWflows through BAM (Maillard and Soliman 1986 Murray and Johns 1997) which Smeedattributed to lateral spreading of GAIW as it moves northward
The previous studies have left unresolved a number of critical issues regarding the move-ment of GAIW through the Red Sea These include the actual velocity at which GAIW iscarried northward from BAM the manner in which GAIW movement is influenced by thenumerous eddies that populate the Red Sea basin (Quadfasel and Baudner 1993 Sofianosand Johns 2007 Zhai and Bower 2013 Zhan et al 2014) and perhaps most importantlythe extent to which nutrient-rich GAIW enters the coral ecosystems of the coastal RedSea Here we address these and other issues related to the movement of GAIW using anextensive data set acquired in autumn 2011 The data include shipboard CTD and AcousticDoppler Current Profiler (ADCP) data nutrient measurements from discrete water samplesand satellite altimeter-derived sea level anomaly (SLA) fields
2 Methods
The data presented here were collected from the RV Aegaeo during Leg 1 of the KAUST2011 Red Sea Expedition (15 Septemberndash10 October) Temperature salinity dissolved oxy-gen fluorescence and Photosynthetically Active Radiation (PAR) profiles were obtainedat 206 stations and along 20 across-basin transects (Fig 1) using a SeaBird Electron-ics SBE9+ CTD profiler outfitted with an SBE oxygen sensor a WETLabs integratedchlorophyll-aturbidity sensor and a Biospherical underwater PAR light sensor Water sam-ples for postcruise nutrient analysis and for onboard oxygen sensor calibration were col-lected in 10-l Niskin bottles These samples were acquired from stations along each transectat nominal depths of 25 50 100 200 300 400 500 600 and 1000 m The nutrient sampleswere frozen immediately following acquisition Inorganic nutrients were measured usingstandard colorimetric methods on a Lachat QuickChem 8000 flow injection analyzer atthe Woods Hole Oceanographic Institution Nutrient Facility (Lachat QuickChem Method31-107-04-1-E [Wood et al 1967] for NO2 +NO3 Lachat QuickChem Method 31-115-01-1-H [Murphy and Riley 1962] for phosphate) Blanks (Milli-Q water) and standards wereanalyzed routinely within each sample run Standards were made fresh daily using ACS-certified chemicals and were compared daily to intercalibration performance standards
The RV Aegaeo was outfitted with a hull-mounted 75-kHz Ocean Surveyor (TeledyneRD Instruments) ADCP Single-ping measurements taken over a depth range of about600 m and at a rate of about 25 s per ping were averaged over 5 min to give verticalprofiles of horizontal velocity in 8-m depth bins The velocities were converted from the
168 Journal of Marine Research [72 3
Figure 2 Plot of NO2 +NO3 concentration (N) against Apparent Oxygen Utilization (AOU) with thelinear regression line relating the two variables superimposed The regression is used to determinefields of N from CTD data
shiprsquos reference frame into earth coordinates using the shiprsquos heading from the onboard gyrocompass and shiprsquos velocity determined using GPS The velocity vectors shown here at CTDstations on map-view plots were averaged over the time-on-station typically 05ndash2 h
In order to resolve the NO2 + NO3 concentration (hereafter N) fields from the CTDdata we derived a mathematical relationship between N and Apparent Oxygen Utilization(AOU) which can be determined from CTD measurements of salinity temperature and O2
concentration The relationship was determined through linear regression using N valuesderived from bottle samples taken over depths of 31ndash1800 m (206 samples from our 2011survey and 184 from a March 2010 survey of the northern Red Sea) and AOU valuesdetermined from CTD measurements coincident with the bottle samples The plot of Nagainst AOU (Fig 2) shows a strong linear trend that reflects the influence of organicmatter decomposition on both N and AOU (eg Broecker 1974 Takahashi et al 1985)The linear regression line determined from the N against AOU data is of the form N =437AOU minus 079 (R2 = 097) where N and AOU are in units of μmol lminus1 and ml lminus1respectively The slope (intercept) of the regressions determined from either the 2010 or the2011 data alone differs from the slope (intercept) given above by lt032 (076) The 95confidence interval of the N estimates determined from the regression line (as determinedfrom the residuals from the regression) is roughly plusmn2 μmol lminus1 Concentrations of PO4
and SiO2 also exhibited a linear relationship with AOU allowing us to derive expressionsusing the approach above for PO4 and SiO2 concentrations as a function of AOU Lineartrends of Red Sea nutrient concentrations with AOU have also been reported by Naqvi
2014] Churchill et al The transport of nutrient-rich Indian Ocean water 169
Figure 3 Expanded view of the region enclosed by the southern rectangle in Figure 1 with the 66-mNO2 + NO3 concentration and mean 66-m velocity (vectors) at each CTD station Nutrient-richwater appears to be carried in a strong northward current along the eastern margin of the surveyregion to transect 5 and diverted southwestward along transect 5 The superimposed sea levelanomaly (SLA in cm) field of 21 September 2011 shows a basin-scale eddy with an SLA gradientwhich would produce a southwestward flow in the area of transect 5 The lightly colored areas arecoral islands and shoals of depth lt50 m Those shallow areas off the eastern shore are part of theFarasan Banks Circled stations labeled andashi are those at which the high-velocitynutrient-enrichedcore of the GAIW intrusion was sampled
et al (1986) who analyzed data from a May 1983 cruise that spanned the full length of theRed Sea
The SLA field shown in Figure 3 was computed with respect to the CLS01 (Centre deLocalisation des Satellites) long-term mean sea surface height The field obtained fromAVISO (httpwwwavisooceanobscom) combines the data of all available satellites inan objectively mapped grid of SLA with 025 grid spacing SLA rather than absolutedynamic topography was utilized in our study because the mean dynamic topography isnot available for the Red Sea This is because of a lack of in situ hydrographic and velocitydata which AVISO uses to generate maps of absolute dynamic topography in other areasRecently SLA has been employed as an integral part of studies of Red Sea dynamics byZhai and Bower (2013) and Zhan et al (2014)
3 Results
Our observations reveal three distinct GAIW features 1) a northward-moving stream ofnutrient-rich GAIW extending to sim19N 2) a filament of GAIW carried across the Red Sea
170 Journal of Marine Research [72 3
Figure 4 Water properties along transect 2 (Fig 3) The solid black contours on the salinity field(a) mark the 25 and 27 σt surfaces The dotted line curves on the other sections (bndashd) outline theGAIW water intrusion which encompasses subsurface maxima of NO2 + NO3 (b) chlorophyllconcentration (c) and northward (across-transect) velocity (d) The white lines in (d) are zerovelocity contours Also shown is station c of the along-GAIW section of Figure 3
basin in the circulation of an anticyclonic eddy and 3) highly dilute but identifiable GAIWappearing north of 19N These features are dealt with separately below Feature 1 is mostintensively analyzed as its boundaries and properties are best resolved by the salinity andnutrient fields
a The GAIW stream to 19N
The 66-m N field computed from the CTD measurements as described above showGAIW with high N (reaching 17 μmol lminus1) extending from the surveyrsquos southernmoststation (at 17N) to 19N (Fig 3) Concentrations of PO4 and SiO2 (as estimated from theCTD measurements) show a similar pattern Superimposing 66-m velocities measured bythe RV Aegaeorsquos ADCP over the N field (Fig 3) reveals what appears to be a continuousstream of high-N GAIW flowing northward to transect 5 (19N) The GAIW in this streamis distinguished by high N (gt14 μmol lminus1) and low salinity (375 vs 385 psu above) Itspans a depth range of sim35ndash120 m and a σt range of sim25ndash275 (eg Figs 4 and 5)
Our measurements provide the first indication that the GAIW intrusion is transportednorthward through the southern Red Sea in a well-defined subsurface current This currentis clearly visible in the fields of across-transect (roughly to the NNW) velocity measuredalong transects 1ndash4 It appears in the velocity field of transect 2 for example as a 15- to
2014] Churchill et al The transport of nutrient-rich Indian Ocean water 171
Figure 5 The same as Figure 4 except showing water properties along transect 3 The arrow above(a) marks the location of Dorish Island which is at the outer boundary of the area of isolatedcoral shoals and islands penetrated by transects 1ndash3 (see Fig 6) Also indicated is station d of thealong-GAIW section of Figures 3 and 6
40-cm sminus1 flow extending over sim35ndash115 m and roughly coinciding with the high-N coreof the GAIW intrusion (Fig 4) The across-transect velocity field of transect 3 also showsa strong (15ndash30 cm sminus1) NNW-ward current coinciding with the high-N core of the GAIWintrusion (Fig 5) However this current does not encompass the major fraction of the GAIWmeasured along the transect Roughly 60 of the GAIW signature is situated shorewardof the high-velocity (15ndash30 cm sminus1) core of the current and is predominately within a 0-to 10-cm sminus1 NNW-ward flow (Fig 5) As detailed further below we hypothesize that thisweakly flowing GAIW may have emerged from the reef area directly upstream (to the SSE)of transect 3 (Fig 3)
Our measurements are also the first to show nutrient-rich GAIW in proximity to Red Seacoral islands and reefs This is apparent over transects 1ndash3 which extend eastward fromthe Red Sea basin through an area of isolated coral shoals and islands and terminate withina few kilometers of a near-shore region of dense coral formations (part of Farasan Banks)(Fig 3) Vertical sections of salinity and N along these transects (eg Figs 4 and 5) showthe high-N GAIW intrusion confined to the eastern end of each transect and extending intothe area of isolated coral islands and reefs Notably the GAIW observed along transect 3encompasses an offshore coral feature known as Dorish Island (Figs 5 and 6) The frictional
172 Journal of Marine Research [72 3
Figure 6 NO2 + NO3 concentration at 66 m and vertically averaged velocity (over 35ndash120 m) ateach CTD station superimposed on a bathymetric chart (United Kingdom Hydrographic Office) ofthe area outlined by the box in Figure 3 The circled stations labeled dndashi are those at which thehigh-velocity core of the GAIW intrusion was sampled (see also Fig 3) Chart depths shown atselected locations are in meters Islands are shaded green and bottom depths lt20 m are shadedlight blue
influence of the near-shore coral features may account for the relatively weak flow of theGAIW observed at the eastern end of transects 1ndash3 (Figs 3ndash6)
Penetration of GAIW into the region of dense coral formations is observed at transect 4which extends eastward from the Red Sea basin into a deep (gt150 m) channel fringed bycoral islands GAIW observed along this transect is largely contained within the channel(Figs 3 and 6) Data taken at four other stations within the channel (circled in Figs 3 and 6)show a stream of GAIW occupying roughly the same depth and density range as the GAIWseen along transects 1ndash3 (Fig 7) The depth-averaged GAIW flow at the northernmoststations within the channel is directed to the northwest roughly along the channel axisNotably the depth-averaged GAIW flow at the southernmost channel station (station e inFig 6) is to the northeast further into the near-shore coral island and shoal region Theapparent continuity of the jet carrying GAIW across transects 1ndash3 and through the channelat transect 4 together with the absence of GAIW at transect 4 stations offshore of the
2014] Churchill et al The transport of nutrient-rich Indian Ocean water 173
Figure 7 Properties of the high-velocitynutrient-enriched GAIW stream sampled in the basin andin the coral island channel Property fields (andashc) are derived using data from the circled stations(labeled andashi) in Figures 3 and 6 Estimated ldquoGAIW fractionrdquo of salinity and NO2+ NO3 within thedensity band (2725 gt= σt gt= 247) occupied by the GAIW intrusion is shown in (d)
channel (Figs 3 and 6) indicates that the nutrient-rich GAIW intrusion had very likelybeen diverted into the coral islandndashfringed channels north of transect 3 Furthermore it ispossible that GAIW had extended unobserved into the deeper channels (gt120 m) of thecoral island and shoal area just shoreward of transects 1ndash3
To quantify the GAIW volume and N transport across transects 1ndash4 we interpolatedmeasurements of N and across-transect velocity along each transect onto a standard gridand integrated the velocity and the product of velocity and N over the cross section ofGAIW To outline this cross section we specified the boundaries of the GAIW in the verticalprofiles of the interpolated salinity fields using criteria developed through examination ofCTD-derived salinity and nutrient profiles The criteria are that the GAIW is present inprofiles in which the minimum salinity over the 65- to 85-m depth range is lt387 practicalsalinity units (psu) and that the GAIW layer extends between salinity bounds of ST at thetop and SB at the base (Figs 4 and 5) The results shown here (Figs 4 and 5 Table 1) were
174 Journal of Marine Research [72 3
Table 1 Cross-transect (positive to the northwest) fluxes of volume and NO2 + NO3 (N) containedwithin the Gulf of Aden Intermediate Water intrusion observed along transects 1ndash4 As detailed inthe text the uncertainty levels (in brackets) account for the sensitivity of the flux to the choice ofupper and lower salinity limits vertically bounding the GAIW
Transect Volume flux (Sv) N flux (mol sminus1)
1 019 [minus001 + 001] 25 times 103 [minus01 + 01] times 103
2 034 [minus004 + 005] 36 times 103 [minus03 + 04] times 103
3 036 [minus005 + 004] 44 times 103 [minus03 + 03] times 103
4 012 [minus003 + 002] 12 times 103 [minus01 + 01] times 103
computed using ST = 3865 and SB = 398 psu To assess the sensitivity of the computedfluxes to the choice of GAIW salinity bounds fluxes were also computed using boundsdeemed reasonable from examination of the salinity and N profiles that gave the minimumand maximum vertical GAIW range (ST = 384 SB = 394 and ST = 3865 SB = 402psu respectively) The results were used to assign uncertainty intervals to the computedfluxes (Table 1) which were no more than 15 of the values computed with ST = 3865and SB = 398 psu
Magnitudes of the N-fluxes across transects 1ndash3 (Table 1) are comparable to the estimatesof 39ndash45 times 103 mol sminus1 for GAIW N-flux through BAM (Souvermezoglou et al 1989)Both the net volume-flux and N-flux increase considerably by roughly a factor of 18 goingfrom transect 1 to 3 This may reflect high-frequency locally wind-driven fluctuations inGAIW inflow through BAM (Murray and Johns 1997) This flux increase may also be partlydue to the transport across transects 2 and 3 of GAIW that had flowed unobserved throughthe coral island and shoal region shoreward of the upstream (more southern) transects Inparticular the easternmost 20 km of transect 3 extends into an indentation of the basindirectly northwest of a coral island and shoal area (Figs 3 and 6) The N-flux of GAIWacross this portion of the transect is 08 times 103 mol sminus1 and roughly equals the increase ofGAIW N-flux from transects 2 to 3 (Table 1) GAIW volume-fluxes and N-fluxes acrosstransect 4 are considerably smaller (lt 1
2 ) than the fluxes measured across transects 1ndash3probably because of unobserved GAIW flow in the coral channel region onshore of transect4 (Figs 3 and 6)
To determine the extent to which the high nutrient concentrations of GAIW overlap theeuphotic zone we calculated a representative PAR profile by averaging all mid-day (900ndash1500 local time) PAR profiles taken along transects 1ndash3 The averaged PAR declines to127 of its 2-m value by 35 m (roughly at the top of the GAIW intrusion) and furtherdecreases to 1 of its 2-m value by 67 m Along transects 1ndash3 chlorophyll concentrationsdetermined from CTD-fluorometer data tend to be largest within this 35- to 67-m depthband of high-N GAIW and available PAR (Figs 4c and 5c) consistently exceeding themaximum concentration in the basin water farther offshore (Fig 8) This tendency forchlorophyll concentrations to be relatively high in GAIW suggests that the combination
2014] Churchill et al The transport of nutrient-rich Indian Ocean water 175
Figure 8 As a function of latitude maximum NO2 +NO3 (a) and chlorophyll concentration (b) in the10- to 75-m depth range at the easternmost (circlessolid line) and westernmost (trianglesdashedline) stations of transects 1ndash14
of available PAR and high nutrient concentrations may have fueled enhanced productivitywithin GAIW
Previous observations of GAIW in the southern Red Sea suggest that the intrusion issignificantly eroded by vertical mixing (Sofianos and Johns 2007) To estimate the extent towhich the GAIW intrusion streaming through the southern basin and the coral island channelhad been altered through mixing and nutrient uptake by primary production we estimatedthe proportion of GAIW relative to that contained in the intrusion at the southernmost(reference) station by assuming that the GAIW was confined to a distinct density band(σt = 247minus2725) and mixed equally with the water above and below The GAIW fractionat a station n was estimated from salinity (S) by fS(n) = (Sn minus Sa)(S0 minus Sa) where Sn
and S0 are respectively the mean salinities within the specified GAIW density band at n andat the reference station and Sa is the mean of the salinities just above and below the GAIWlayer A similar expression was used to estimate the GAIW fraction based on N (fN ) Here(Fig 7d) we show GAIW fractions at stations in the core of the GAIW stream along transects1ndash3 and in the coral island and shoal region penetrated by transect 4 (Figs 3ndash6) Both fN andfS show no systematic decline going from transect 1 to 3 suggesting relatively weak mixingof the GAIW core with surrounding basin water In contrast fS and fN decline significantlywithin the coral island region suggesting that the GAIW within this region is subjected tomore vigorous mixing than in the basin Such mixing may be important in exposing coralsabove the sim35-m depth ceiling of the GAIW intrusion to elevated nutrient concentrations
176 Journal of Marine Research [72 3
A significant reduction in N due to primary production would be reflected by a sharperdecline in fN relative to fS However this is not observed in our data fN and fS arecomparable in both the basin and the coral island region The observed downstream declinein GAIW N thus appears to be primarily the result of mixing with uptake through primaryproduction within the GAIW stream playing a secondary role
b GAIW-eddy interaction
The GAIW stream appears to bifurcate at transect 5 with one branch deflected to thesouthwest along transect 5 and a second continuing northward as seen at the easternmoststation of transect 6 (Fig 3) The southwestward flow of GAIW observed along transect5 on 21 September is consistent with the SLA field of that date (Fig 3) which revealsa basin-scale anticyclonic eddy encompassing transect 5 The eddy is associated with alocal SLA high centered near 19N 3853rsquo E and an SLA gradient that would producesouthwestward flow across transect 5 (Fig 3) The eddyrsquos circulation inferred from the SLAfield is consistent with the near-surface ADCP-derived velocities In particular the ADCP-derived velocities acquired at 26-m depth in the region of the eddy (184ndash199 N 39ndash3985E) and during the period 20ndash23 September 2011 are correlated (through complex correlationanalysis Kundu 1976) with the geostrophic velocities computed from the SLA field (at thesame locations of the ADCP measurements) at an R2 of 07 which is significantly differentfrom 0 at the 95 confidence level
On the basis of the ADCP-derived velocities and the circulation inferred by the SLAfield it appears that much of the GAIW stream flowing northward to transect 5 (19 N) isentrained in the eddyrsquos circulation and diverted to the southwest The mean across-basin (at237 T) flow of the GAIW entrained in the eddy determined by averaging ADCP-derivedvelocities measured along transect 5 within the 25ndash275 σt range (which encompasses theGAIW) is 143 cm sminus1 At this rate a GAIW parcel would traverse the Red Sea basinin roughly 13 d As the eddyrsquos SLA signature extended to the western Red Sea coast(Fig 3) it is possible that the GAIW was carried to the reef communities of the westernRed Sea
c GAIW north of 19N
Extension of GAIW north of 19N is suggested by well-defined vertical salinity minimaappearing over all transects north of transect 5 However the contrast between these min-ima and the higher salinity water above is at order 025 psu considerably smaller than theorder 15 psu contrast between the GAIW salinity minima and the salinity of the overly-ing water observed south of 19N As stable vertical salinity minima may be produced bysurface heating and evaporation ascribing the salinity minima north of 19N as evidenceof GAIW must be done with caution In judging the possibility that these minima maybe due to GAIW we have set criteria that they be within the 25- to 275-σt range of the
2014] Churchill et al The transport of nutrient-rich Indian Ocean water 177
Figure 9 Salinity fields along four transects north of 19N (Fig 1) Each field shows the signature ofGAIW in the form of a salinity minimum in the 10- to 100-m depth range on the eastern boundaryof the Red Sea basin Dashed lines are the 25 and 27 σt contours
GAIW observed south of 19N and that the lower-salinity water in which they are embed-ded contain nutrient concentrations larger than those measured in adjacent water of similardepth Here we apply these criteria to the salinity minima observed at transects 6ndash14 (19ndash24N) These minima span the full length of a number of these transects Nevertheless forall transects the lowest salinity minimum appears at the easternmost station (Fig 8) Thelower-salinity water associated with these minima roughly spans the 20- to 100-m depthrange and is contained within the 25- to 275-σt density range over which GAIW appearssouth of 19 N (Fig 9) The tendency of this lower-salinity water to contain higher N thanwater of similar depth (and σt ) within the central basin is evident from the contoured salinityand N fields along each of transects 6ndash14 (eg Fig 10) Furthermore both maximum Nand average N in the 10- to 75-m depth range are considerably higher at each transectrsquoseasternmost station relative to the westernmost station (Fig 8) The higher N at the east-ern margin appears to have enhanced primary productivity relative to the midbasin as themaximum and average chlorophyll concentration in the 10- to 75-m depth range is alsosignificantly higher on the eastern as compared with the western side of transects 6ndash14(Fig 8) On the basis of these observations we conclude that the low-salinity water appear-ing along the eastern boundary at transects 6ndash14 is GAIW The salinity minima observednorth of transect 14 may also be due to GAIW but this cannot be reasonably assessed asthe low-salinity water in which the minima are embedded has zero or near-zero nutrientconcentration
178 Journal of Marine Research [72 3
Figure 10 Water property fields along transect 8 (Fig 1) These fields indicate low-salinity GAIWroughly confined between the 25 and 27 σt surfaces (a) Near the eastern basin margin the GAIWis carried northward by an order 20 cm sminus1 current (d) and contains relatively high concentrationsof NO2 + NO3 and chlorophyll (b and c)
The shipboard-ADCP data reveal that the GAIW observed at transects 6ndash14 is predomi-nately carried northward The velocities measured in the low-salinity GAIW at the easternmargin of these transects are directed northward at a rate of 5ndash25 cm sminus1 (eg Fig 10)at all but transect 10 This tendency of northward GAIW flow over the central Red Sea isnicely illustrated by the velocity and N fields measured at 66 m (Fig 11) These show anearly continuous northward-flowing stream of nutrient-enriched GAIW extending alongthe eastern Red Sea margin from 19 to 24N With the available data we can only spec-ulate as to why the northward flow of GAIW appears to be interrupted at transect 10Along-shore velocities measured within the low-salinity nutrient-enriched water observedat the eastern margin of transect 10 are less than 5 cm sminus1 in magnitude and predominatelydirected to the SSE As transect 10 reaches to within 5 km of the coast it is unlikely thatour measurements missed a near-shore northward flow of GAIW It is possible that theweak GAIW flow at transect 10 may be partially the result of a temporal weakening of theGAIW inflow through BAM due to local wind forcing (Murray and Johns 1997) With thisexception the data indicate a northward flow of GAIW along the eastern margin of the RedSea basin with high N relative to the central basin water of the same depth to a latitude ofsim24N
2014] Churchill et al The transport of nutrient-rich Indian Ocean water 179
Figure 11 Expanded view of the region enclosed by the northern rectangle in Figure 1 with 66-mNO2 + NO3 concentration and mean 66-m velocity (vectors) at each CTD station
4 Summary and discussion
Our analysis of the autumn 2011 cruise data has changed the view of how GAIW propa-gates through the Red Sea In a broad sense the analysis has revealed four modes of GAIWtransport
One is a rapid transit of nutrient-rich GAIW though the southern Red Sea in subsurfaceflow near the eastern boundary The speed of this flow at sim25 cm sminus1 is considerably fasterthan the 6-cm sminus1 rate of northward GAIW transport previously estimated from temperaturedata (Smeed 1997) This strong northward flow and the nutrient-rich GAIW it carries extendto 19N gt300 km farther north than GAIW had been detected in previous hydrographicobservations (Sofianos and Johns 2007) The magnitude of observed N-transport carriedby GAIW between 17 and 19N is comparable with the N-transport of the GAIW influxthrough BAM suggesting that the nutrient flux of GAIW may not be significantly alteredby mixing or production as it transits the southern Red Sea
A second transport mode is cross-basin conveyance of GAIW in the circulation of a basin-scale eddy Our data show this cross-basin GAIW transport occurring at sim19N essentiallyat the terminus of the rapid northward GAIW flow noted above This mode of transportmay be an important mechanism for rapid movement of GAIW across the Red Sea basin
180 Journal of Marine Research [72 3
Studies by Quadfasel and Baudner (1993) and Sofianos and Johns (2007) have shown thatthe central Red Sea basin is typically populated with eddies encompassing velocities of upto 1 m sminus1
A third mode of GAIW transport is observed north of 19N and takes the form of a streamof dilute GAIW extending along the eastern Red Sea margin to 24N Given the prevalenceof eddies with the Red Sea basin which could divert such a flow seaward it is uncertainwhether such a feature may be a common yearly occurrence
A fourth mode of transport is the incursion of GAIW into coastal reef systems In ourdata this is observed over the outer reefs of the Farasan Banks More widespread GAIWincursion into Red Sea coral ecosystems is likely GAIW penetration farther into the FarasanBanks is suggested by the velocities averaged over the GAIW depth range (at site e in Fig 6)and GAIW may be carried to the coral ecosystems of the eastern Red Sea via the circulationof basin-scale eddies Furthermore GAIW-borne nutrients may be delivered to the near-surface reef environment by vertical mixing of GAIW with bordering water masses asindicated by our measurements over the outer Farasan Banks As coral health is sensitive toeven small variations in nutrients (Marubini and Davies 1996 Ferrier-Pages et al 2000Silverman et al 2007) the incursion of nutrient-rich GAIW into the coastal areas of theRed Sea could have a profound influence on the resident coral ecosystems Comprehensivemultidisciplinary studies are required to understand how these systems are affected by andadapt to nutrient delivery by GAIW
Acknowledgments We gratefully acknowledge financial and logistical support for the RV Aegaeocruise provided by King Abdullah University of Science and Technology (KAUST) and the supportof an international group of scientists and technicians during the cruise We thank in particular S Swiftfor work on chart generation during and after the cruise P Zhai for her contribution in generatingthe SLA field and P Henderson for nutrient analyses This research was supported by Award NosUSA-00002 KSA-00011 and KSA-0001102 made by KAUST to the Woods Hole OceanographicInstitution
REFERENCES
Broecker W S 1974 ldquoNOrdquo a conservative water-mass tracer Earth Planet Sci Lett 23 100ndash107Ferrier-Pages C J-P Gattuso S Dallot and J Jaubert 2000 Effect of nutrient enrichment on growth
and photosynthesis of the zooxanthellate coral Stylophora pistillata Coral Reefs 19 103ndash113Heileman S and N Mistafa 2008 III-6 Red Sea LME 33 in The UNEP Large Marine Ecosystem
Report A Perspective on Changing Conditions in LMEs of the Worldrsquos Regional Seas K Shermanand G Hempel eds UNEP Regional Seas Report and Studies No 182 Nairobi Kenya UnitedNations Environment Programme 175ndash186
Khimitsa V A and V A Bibik 1979 Seasonal exchange in dissolved oxygen and phosphate betweenthe Red Sea and the Gulf of Aden Oceanol 9 544ndash546
Kundu P 1976 Ekman veering observed near the ocean bottom J Phys Oceanogr 6 238ndash242Maillard C and G Soliman 1986 Hydrography of the Red Sea and exchanges with the Indian Ocean
in summer Oceanol Acta 9 249ndash269Marubini F and P S Davies 1996 Nitrate increases zooxanthelae population and reduces skeleto-
genesis in corals Mar Biol 127 319ndash328
2014] Churchill et al The transport of nutrient-rich Indian Ocean water 181
Murphy J and J P Riley 1962 A modified single solution method for determination of phosphatein natural waters Anal Chim Acta 27 31ndash36
Murray S P and W Johns 1997 Direct observations of seasonal exchange through the Bab el MandebStrait Geophys Res Lett 24 2557ndash2560
Naqvi S W A H P Hansen and T W Kureishy 1986 Nutrient uptake and regeneration ratios inthe Red Sea with reference to the nutrient budgets Oceanol Acta 9 271ndash275
Patzert W C 1974 Seasonal reversal in the Red Sea circulation in Lrsquooceanographie Physique de laMer Rouge Paris Centre National pour lrsquoExploitation des Oceans 55ndash89
Poisson A S Morcos E Souvermezoglou A Papaud and A Ivanoff 1984 Some aspects ofbiogeochemical cycles in the Red Sea with special references to new observations made in summer1982 Deep-Sea Res 31 707ndash718
Quadfasel D and H Baudner 1993 Gyre-scale circulation cells in the Red Sea Oceanol Acta 16221ndash229
Silverman J B Lazar and J Erez 2007 Effect of aragonite saturation temperature and nutri-ents on the community calcification rate of a coral reef J Geophys Res 112 C05004doi1010292006JC003770
Smeed D 1997 Seasonal variation of the flow in the strait of Bab el Mandeb Oceanol Acta 20773ndash781
Sofianos S S and W E Johns 2007 Observations of the summer Red Sea circulation J GeophysRes 112 C06025 doi1010292006JC003886
Sofianos S S W E Johns and S P Murray 2002 Heat and freshwater budgets in the Red Sea fromdirect observations at Bab el Mandeb Deep Sea Res II 49 1323ndash1340
Souvermezoglou E N Metzl and A Poisson 1989 Red Sea budgets of salinity nutrients and carboncalculated in the strait of Bab-el-Mandab during the summer and winter season J Mar Res 47441ndash456
Takahashi T W S Broecker and S Langer 1985 Redfield ratio based on chemical data fromisopycnal surfaces J Geophys Res 90 6907ndash6924
Wood E F Armstrong and F Richards 1967 Determination of nitrate in sea water by cadmiumcopper reduction to nitrite J Mar Biol Ass UK 47 23ndash31
Zhai P and A S Bower 2013 The response of the Red Sea to a strong wind jet near the Tokar Gapin summer J Geophys Res Oceans 118 422ndash434 doi1010292012JC008444
Zhan P A C Subramanian F Yao and I Hoteit 2014 Eddies in the Red Sea A statistical anddynamical study J Geophys Res Oceans 119 3909ndash3925 doi1010022013JC009563
Received 26 June 2013 revised 28 August 2014
166 Journal of Marine Research [72 3
Figure 1 CTD stations of the September-October 2011 RV Aegaeo cruise in the Red Sea withtransect numbers (1ndash20) indicated The contour lines roughly mark the 150-m isobath at the upperedge of the Red Searsquos central basin As shown in subsequent figures the coastal region inshore ofthe basin is complicated and includes many channels of gt150-m depth which are not contouredabove
over a 30- to 120-m depth range (Palzert 1974 Murray and Johns 1997) and at a rate of022ndash036 Sv (Maillard and Soliman 1986 Murray and Johns 1997 Sofianos et al 2002)It enters the Red Sea as a relatively cold (174C at 75 m in BAM vs 314C in the top 10m) fresh (358 vs 374 psu) and nutrient-rich (eg NO3 235 vs 09 μmol lminus1) water mass(Poisson et al 1984 Maillard and Soliman 1986 Souvermezoglou et al 1989)
Observations of GAIW propagation through the Red Sea have thus far been limitedprincipally to temperature and Conductivity-Temperature-Depth (CTD) data The most-detailed study of a GAIW intrusion to date is that of Sofianos and Johns (2007) whoutilized CTD data from an August 2001 cruise of the Red Sea They found GAIW tobe concentrated on the eastern Red Sea margin with core property anomalies decreasing
2014] Churchill et al The transport of nutrient-rich Indian Ocean water 167
significantly between BAM and 16N The sole study to address the rate at which GAIWmoves northward through the Red Sea is that of Smeed (1997) Using temperature profilescollected over 1967ndash1989 Smeed traced the seasonal northward migration of the GAIWtemperature minimum On the basis of the timing and location of the temperature minimumseen in the full 23-year data set he estimated that GAIW propagates northward at an averagerate of 6 cm sminus1 This is considerably slower than the 25- to 50-cm sminus1 speed at which GAIWflows through BAM (Maillard and Soliman 1986 Murray and Johns 1997) which Smeedattributed to lateral spreading of GAIW as it moves northward
The previous studies have left unresolved a number of critical issues regarding the move-ment of GAIW through the Red Sea These include the actual velocity at which GAIW iscarried northward from BAM the manner in which GAIW movement is influenced by thenumerous eddies that populate the Red Sea basin (Quadfasel and Baudner 1993 Sofianosand Johns 2007 Zhai and Bower 2013 Zhan et al 2014) and perhaps most importantlythe extent to which nutrient-rich GAIW enters the coral ecosystems of the coastal RedSea Here we address these and other issues related to the movement of GAIW using anextensive data set acquired in autumn 2011 The data include shipboard CTD and AcousticDoppler Current Profiler (ADCP) data nutrient measurements from discrete water samplesand satellite altimeter-derived sea level anomaly (SLA) fields
2 Methods
The data presented here were collected from the RV Aegaeo during Leg 1 of the KAUST2011 Red Sea Expedition (15 Septemberndash10 October) Temperature salinity dissolved oxy-gen fluorescence and Photosynthetically Active Radiation (PAR) profiles were obtainedat 206 stations and along 20 across-basin transects (Fig 1) using a SeaBird Electron-ics SBE9+ CTD profiler outfitted with an SBE oxygen sensor a WETLabs integratedchlorophyll-aturbidity sensor and a Biospherical underwater PAR light sensor Water sam-ples for postcruise nutrient analysis and for onboard oxygen sensor calibration were col-lected in 10-l Niskin bottles These samples were acquired from stations along each transectat nominal depths of 25 50 100 200 300 400 500 600 and 1000 m The nutrient sampleswere frozen immediately following acquisition Inorganic nutrients were measured usingstandard colorimetric methods on a Lachat QuickChem 8000 flow injection analyzer atthe Woods Hole Oceanographic Institution Nutrient Facility (Lachat QuickChem Method31-107-04-1-E [Wood et al 1967] for NO2 +NO3 Lachat QuickChem Method 31-115-01-1-H [Murphy and Riley 1962] for phosphate) Blanks (Milli-Q water) and standards wereanalyzed routinely within each sample run Standards were made fresh daily using ACS-certified chemicals and were compared daily to intercalibration performance standards
The RV Aegaeo was outfitted with a hull-mounted 75-kHz Ocean Surveyor (TeledyneRD Instruments) ADCP Single-ping measurements taken over a depth range of about600 m and at a rate of about 25 s per ping were averaged over 5 min to give verticalprofiles of horizontal velocity in 8-m depth bins The velocities were converted from the
168 Journal of Marine Research [72 3
Figure 2 Plot of NO2 +NO3 concentration (N) against Apparent Oxygen Utilization (AOU) with thelinear regression line relating the two variables superimposed The regression is used to determinefields of N from CTD data
shiprsquos reference frame into earth coordinates using the shiprsquos heading from the onboard gyrocompass and shiprsquos velocity determined using GPS The velocity vectors shown here at CTDstations on map-view plots were averaged over the time-on-station typically 05ndash2 h
In order to resolve the NO2 + NO3 concentration (hereafter N) fields from the CTDdata we derived a mathematical relationship between N and Apparent Oxygen Utilization(AOU) which can be determined from CTD measurements of salinity temperature and O2
concentration The relationship was determined through linear regression using N valuesderived from bottle samples taken over depths of 31ndash1800 m (206 samples from our 2011survey and 184 from a March 2010 survey of the northern Red Sea) and AOU valuesdetermined from CTD measurements coincident with the bottle samples The plot of Nagainst AOU (Fig 2) shows a strong linear trend that reflects the influence of organicmatter decomposition on both N and AOU (eg Broecker 1974 Takahashi et al 1985)The linear regression line determined from the N against AOU data is of the form N =437AOU minus 079 (R2 = 097) where N and AOU are in units of μmol lminus1 and ml lminus1respectively The slope (intercept) of the regressions determined from either the 2010 or the2011 data alone differs from the slope (intercept) given above by lt032 (076) The 95confidence interval of the N estimates determined from the regression line (as determinedfrom the residuals from the regression) is roughly plusmn2 μmol lminus1 Concentrations of PO4
and SiO2 also exhibited a linear relationship with AOU allowing us to derive expressionsusing the approach above for PO4 and SiO2 concentrations as a function of AOU Lineartrends of Red Sea nutrient concentrations with AOU have also been reported by Naqvi
2014] Churchill et al The transport of nutrient-rich Indian Ocean water 169
Figure 3 Expanded view of the region enclosed by the southern rectangle in Figure 1 with the 66-mNO2 + NO3 concentration and mean 66-m velocity (vectors) at each CTD station Nutrient-richwater appears to be carried in a strong northward current along the eastern margin of the surveyregion to transect 5 and diverted southwestward along transect 5 The superimposed sea levelanomaly (SLA in cm) field of 21 September 2011 shows a basin-scale eddy with an SLA gradientwhich would produce a southwestward flow in the area of transect 5 The lightly colored areas arecoral islands and shoals of depth lt50 m Those shallow areas off the eastern shore are part of theFarasan Banks Circled stations labeled andashi are those at which the high-velocitynutrient-enrichedcore of the GAIW intrusion was sampled
et al (1986) who analyzed data from a May 1983 cruise that spanned the full length of theRed Sea
The SLA field shown in Figure 3 was computed with respect to the CLS01 (Centre deLocalisation des Satellites) long-term mean sea surface height The field obtained fromAVISO (httpwwwavisooceanobscom) combines the data of all available satellites inan objectively mapped grid of SLA with 025 grid spacing SLA rather than absolutedynamic topography was utilized in our study because the mean dynamic topography isnot available for the Red Sea This is because of a lack of in situ hydrographic and velocitydata which AVISO uses to generate maps of absolute dynamic topography in other areasRecently SLA has been employed as an integral part of studies of Red Sea dynamics byZhai and Bower (2013) and Zhan et al (2014)
3 Results
Our observations reveal three distinct GAIW features 1) a northward-moving stream ofnutrient-rich GAIW extending to sim19N 2) a filament of GAIW carried across the Red Sea
170 Journal of Marine Research [72 3
Figure 4 Water properties along transect 2 (Fig 3) The solid black contours on the salinity field(a) mark the 25 and 27 σt surfaces The dotted line curves on the other sections (bndashd) outline theGAIW water intrusion which encompasses subsurface maxima of NO2 + NO3 (b) chlorophyllconcentration (c) and northward (across-transect) velocity (d) The white lines in (d) are zerovelocity contours Also shown is station c of the along-GAIW section of Figure 3
basin in the circulation of an anticyclonic eddy and 3) highly dilute but identifiable GAIWappearing north of 19N These features are dealt with separately below Feature 1 is mostintensively analyzed as its boundaries and properties are best resolved by the salinity andnutrient fields
a The GAIW stream to 19N
The 66-m N field computed from the CTD measurements as described above showGAIW with high N (reaching 17 μmol lminus1) extending from the surveyrsquos southernmoststation (at 17N) to 19N (Fig 3) Concentrations of PO4 and SiO2 (as estimated from theCTD measurements) show a similar pattern Superimposing 66-m velocities measured bythe RV Aegaeorsquos ADCP over the N field (Fig 3) reveals what appears to be a continuousstream of high-N GAIW flowing northward to transect 5 (19N) The GAIW in this streamis distinguished by high N (gt14 μmol lminus1) and low salinity (375 vs 385 psu above) Itspans a depth range of sim35ndash120 m and a σt range of sim25ndash275 (eg Figs 4 and 5)
Our measurements provide the first indication that the GAIW intrusion is transportednorthward through the southern Red Sea in a well-defined subsurface current This currentis clearly visible in the fields of across-transect (roughly to the NNW) velocity measuredalong transects 1ndash4 It appears in the velocity field of transect 2 for example as a 15- to
2014] Churchill et al The transport of nutrient-rich Indian Ocean water 171
Figure 5 The same as Figure 4 except showing water properties along transect 3 The arrow above(a) marks the location of Dorish Island which is at the outer boundary of the area of isolatedcoral shoals and islands penetrated by transects 1ndash3 (see Fig 6) Also indicated is station d of thealong-GAIW section of Figures 3 and 6
40-cm sminus1 flow extending over sim35ndash115 m and roughly coinciding with the high-N coreof the GAIW intrusion (Fig 4) The across-transect velocity field of transect 3 also showsa strong (15ndash30 cm sminus1) NNW-ward current coinciding with the high-N core of the GAIWintrusion (Fig 5) However this current does not encompass the major fraction of the GAIWmeasured along the transect Roughly 60 of the GAIW signature is situated shorewardof the high-velocity (15ndash30 cm sminus1) core of the current and is predominately within a 0-to 10-cm sminus1 NNW-ward flow (Fig 5) As detailed further below we hypothesize that thisweakly flowing GAIW may have emerged from the reef area directly upstream (to the SSE)of transect 3 (Fig 3)
Our measurements are also the first to show nutrient-rich GAIW in proximity to Red Seacoral islands and reefs This is apparent over transects 1ndash3 which extend eastward fromthe Red Sea basin through an area of isolated coral shoals and islands and terminate withina few kilometers of a near-shore region of dense coral formations (part of Farasan Banks)(Fig 3) Vertical sections of salinity and N along these transects (eg Figs 4 and 5) showthe high-N GAIW intrusion confined to the eastern end of each transect and extending intothe area of isolated coral islands and reefs Notably the GAIW observed along transect 3encompasses an offshore coral feature known as Dorish Island (Figs 5 and 6) The frictional
172 Journal of Marine Research [72 3
Figure 6 NO2 + NO3 concentration at 66 m and vertically averaged velocity (over 35ndash120 m) ateach CTD station superimposed on a bathymetric chart (United Kingdom Hydrographic Office) ofthe area outlined by the box in Figure 3 The circled stations labeled dndashi are those at which thehigh-velocity core of the GAIW intrusion was sampled (see also Fig 3) Chart depths shown atselected locations are in meters Islands are shaded green and bottom depths lt20 m are shadedlight blue
influence of the near-shore coral features may account for the relatively weak flow of theGAIW observed at the eastern end of transects 1ndash3 (Figs 3ndash6)
Penetration of GAIW into the region of dense coral formations is observed at transect 4which extends eastward from the Red Sea basin into a deep (gt150 m) channel fringed bycoral islands GAIW observed along this transect is largely contained within the channel(Figs 3 and 6) Data taken at four other stations within the channel (circled in Figs 3 and 6)show a stream of GAIW occupying roughly the same depth and density range as the GAIWseen along transects 1ndash3 (Fig 7) The depth-averaged GAIW flow at the northernmoststations within the channel is directed to the northwest roughly along the channel axisNotably the depth-averaged GAIW flow at the southernmost channel station (station e inFig 6) is to the northeast further into the near-shore coral island and shoal region Theapparent continuity of the jet carrying GAIW across transects 1ndash3 and through the channelat transect 4 together with the absence of GAIW at transect 4 stations offshore of the
2014] Churchill et al The transport of nutrient-rich Indian Ocean water 173
Figure 7 Properties of the high-velocitynutrient-enriched GAIW stream sampled in the basin andin the coral island channel Property fields (andashc) are derived using data from the circled stations(labeled andashi) in Figures 3 and 6 Estimated ldquoGAIW fractionrdquo of salinity and NO2+ NO3 within thedensity band (2725 gt= σt gt= 247) occupied by the GAIW intrusion is shown in (d)
channel (Figs 3 and 6) indicates that the nutrient-rich GAIW intrusion had very likelybeen diverted into the coral islandndashfringed channels north of transect 3 Furthermore it ispossible that GAIW had extended unobserved into the deeper channels (gt120 m) of thecoral island and shoal area just shoreward of transects 1ndash3
To quantify the GAIW volume and N transport across transects 1ndash4 we interpolatedmeasurements of N and across-transect velocity along each transect onto a standard gridand integrated the velocity and the product of velocity and N over the cross section ofGAIW To outline this cross section we specified the boundaries of the GAIW in the verticalprofiles of the interpolated salinity fields using criteria developed through examination ofCTD-derived salinity and nutrient profiles The criteria are that the GAIW is present inprofiles in which the minimum salinity over the 65- to 85-m depth range is lt387 practicalsalinity units (psu) and that the GAIW layer extends between salinity bounds of ST at thetop and SB at the base (Figs 4 and 5) The results shown here (Figs 4 and 5 Table 1) were
174 Journal of Marine Research [72 3
Table 1 Cross-transect (positive to the northwest) fluxes of volume and NO2 + NO3 (N) containedwithin the Gulf of Aden Intermediate Water intrusion observed along transects 1ndash4 As detailed inthe text the uncertainty levels (in brackets) account for the sensitivity of the flux to the choice ofupper and lower salinity limits vertically bounding the GAIW
Transect Volume flux (Sv) N flux (mol sminus1)
1 019 [minus001 + 001] 25 times 103 [minus01 + 01] times 103
2 034 [minus004 + 005] 36 times 103 [minus03 + 04] times 103
3 036 [minus005 + 004] 44 times 103 [minus03 + 03] times 103
4 012 [minus003 + 002] 12 times 103 [minus01 + 01] times 103
computed using ST = 3865 and SB = 398 psu To assess the sensitivity of the computedfluxes to the choice of GAIW salinity bounds fluxes were also computed using boundsdeemed reasonable from examination of the salinity and N profiles that gave the minimumand maximum vertical GAIW range (ST = 384 SB = 394 and ST = 3865 SB = 402psu respectively) The results were used to assign uncertainty intervals to the computedfluxes (Table 1) which were no more than 15 of the values computed with ST = 3865and SB = 398 psu
Magnitudes of the N-fluxes across transects 1ndash3 (Table 1) are comparable to the estimatesof 39ndash45 times 103 mol sminus1 for GAIW N-flux through BAM (Souvermezoglou et al 1989)Both the net volume-flux and N-flux increase considerably by roughly a factor of 18 goingfrom transect 1 to 3 This may reflect high-frequency locally wind-driven fluctuations inGAIW inflow through BAM (Murray and Johns 1997) This flux increase may also be partlydue to the transport across transects 2 and 3 of GAIW that had flowed unobserved throughthe coral island and shoal region shoreward of the upstream (more southern) transects Inparticular the easternmost 20 km of transect 3 extends into an indentation of the basindirectly northwest of a coral island and shoal area (Figs 3 and 6) The N-flux of GAIWacross this portion of the transect is 08 times 103 mol sminus1 and roughly equals the increase ofGAIW N-flux from transects 2 to 3 (Table 1) GAIW volume-fluxes and N-fluxes acrosstransect 4 are considerably smaller (lt 1
2 ) than the fluxes measured across transects 1ndash3probably because of unobserved GAIW flow in the coral channel region onshore of transect4 (Figs 3 and 6)
To determine the extent to which the high nutrient concentrations of GAIW overlap theeuphotic zone we calculated a representative PAR profile by averaging all mid-day (900ndash1500 local time) PAR profiles taken along transects 1ndash3 The averaged PAR declines to127 of its 2-m value by 35 m (roughly at the top of the GAIW intrusion) and furtherdecreases to 1 of its 2-m value by 67 m Along transects 1ndash3 chlorophyll concentrationsdetermined from CTD-fluorometer data tend to be largest within this 35- to 67-m depthband of high-N GAIW and available PAR (Figs 4c and 5c) consistently exceeding themaximum concentration in the basin water farther offshore (Fig 8) This tendency forchlorophyll concentrations to be relatively high in GAIW suggests that the combination
2014] Churchill et al The transport of nutrient-rich Indian Ocean water 175
Figure 8 As a function of latitude maximum NO2 +NO3 (a) and chlorophyll concentration (b) in the10- to 75-m depth range at the easternmost (circlessolid line) and westernmost (trianglesdashedline) stations of transects 1ndash14
of available PAR and high nutrient concentrations may have fueled enhanced productivitywithin GAIW
Previous observations of GAIW in the southern Red Sea suggest that the intrusion issignificantly eroded by vertical mixing (Sofianos and Johns 2007) To estimate the extent towhich the GAIW intrusion streaming through the southern basin and the coral island channelhad been altered through mixing and nutrient uptake by primary production we estimatedthe proportion of GAIW relative to that contained in the intrusion at the southernmost(reference) station by assuming that the GAIW was confined to a distinct density band(σt = 247minus2725) and mixed equally with the water above and below The GAIW fractionat a station n was estimated from salinity (S) by fS(n) = (Sn minus Sa)(S0 minus Sa) where Sn
and S0 are respectively the mean salinities within the specified GAIW density band at n andat the reference station and Sa is the mean of the salinities just above and below the GAIWlayer A similar expression was used to estimate the GAIW fraction based on N (fN ) Here(Fig 7d) we show GAIW fractions at stations in the core of the GAIW stream along transects1ndash3 and in the coral island and shoal region penetrated by transect 4 (Figs 3ndash6) Both fN andfS show no systematic decline going from transect 1 to 3 suggesting relatively weak mixingof the GAIW core with surrounding basin water In contrast fS and fN decline significantlywithin the coral island region suggesting that the GAIW within this region is subjected tomore vigorous mixing than in the basin Such mixing may be important in exposing coralsabove the sim35-m depth ceiling of the GAIW intrusion to elevated nutrient concentrations
176 Journal of Marine Research [72 3
A significant reduction in N due to primary production would be reflected by a sharperdecline in fN relative to fS However this is not observed in our data fN and fS arecomparable in both the basin and the coral island region The observed downstream declinein GAIW N thus appears to be primarily the result of mixing with uptake through primaryproduction within the GAIW stream playing a secondary role
b GAIW-eddy interaction
The GAIW stream appears to bifurcate at transect 5 with one branch deflected to thesouthwest along transect 5 and a second continuing northward as seen at the easternmoststation of transect 6 (Fig 3) The southwestward flow of GAIW observed along transect5 on 21 September is consistent with the SLA field of that date (Fig 3) which revealsa basin-scale anticyclonic eddy encompassing transect 5 The eddy is associated with alocal SLA high centered near 19N 3853rsquo E and an SLA gradient that would producesouthwestward flow across transect 5 (Fig 3) The eddyrsquos circulation inferred from the SLAfield is consistent with the near-surface ADCP-derived velocities In particular the ADCP-derived velocities acquired at 26-m depth in the region of the eddy (184ndash199 N 39ndash3985E) and during the period 20ndash23 September 2011 are correlated (through complex correlationanalysis Kundu 1976) with the geostrophic velocities computed from the SLA field (at thesame locations of the ADCP measurements) at an R2 of 07 which is significantly differentfrom 0 at the 95 confidence level
On the basis of the ADCP-derived velocities and the circulation inferred by the SLAfield it appears that much of the GAIW stream flowing northward to transect 5 (19 N) isentrained in the eddyrsquos circulation and diverted to the southwest The mean across-basin (at237 T) flow of the GAIW entrained in the eddy determined by averaging ADCP-derivedvelocities measured along transect 5 within the 25ndash275 σt range (which encompasses theGAIW) is 143 cm sminus1 At this rate a GAIW parcel would traverse the Red Sea basinin roughly 13 d As the eddyrsquos SLA signature extended to the western Red Sea coast(Fig 3) it is possible that the GAIW was carried to the reef communities of the westernRed Sea
c GAIW north of 19N
Extension of GAIW north of 19N is suggested by well-defined vertical salinity minimaappearing over all transects north of transect 5 However the contrast between these min-ima and the higher salinity water above is at order 025 psu considerably smaller than theorder 15 psu contrast between the GAIW salinity minima and the salinity of the overly-ing water observed south of 19N As stable vertical salinity minima may be produced bysurface heating and evaporation ascribing the salinity minima north of 19N as evidenceof GAIW must be done with caution In judging the possibility that these minima maybe due to GAIW we have set criteria that they be within the 25- to 275-σt range of the
2014] Churchill et al The transport of nutrient-rich Indian Ocean water 177
Figure 9 Salinity fields along four transects north of 19N (Fig 1) Each field shows the signature ofGAIW in the form of a salinity minimum in the 10- to 100-m depth range on the eastern boundaryof the Red Sea basin Dashed lines are the 25 and 27 σt contours
GAIW observed south of 19N and that the lower-salinity water in which they are embed-ded contain nutrient concentrations larger than those measured in adjacent water of similardepth Here we apply these criteria to the salinity minima observed at transects 6ndash14 (19ndash24N) These minima span the full length of a number of these transects Nevertheless forall transects the lowest salinity minimum appears at the easternmost station (Fig 8) Thelower-salinity water associated with these minima roughly spans the 20- to 100-m depthrange and is contained within the 25- to 275-σt density range over which GAIW appearssouth of 19 N (Fig 9) The tendency of this lower-salinity water to contain higher N thanwater of similar depth (and σt ) within the central basin is evident from the contoured salinityand N fields along each of transects 6ndash14 (eg Fig 10) Furthermore both maximum Nand average N in the 10- to 75-m depth range are considerably higher at each transectrsquoseasternmost station relative to the westernmost station (Fig 8) The higher N at the east-ern margin appears to have enhanced primary productivity relative to the midbasin as themaximum and average chlorophyll concentration in the 10- to 75-m depth range is alsosignificantly higher on the eastern as compared with the western side of transects 6ndash14(Fig 8) On the basis of these observations we conclude that the low-salinity water appear-ing along the eastern boundary at transects 6ndash14 is GAIW The salinity minima observednorth of transect 14 may also be due to GAIW but this cannot be reasonably assessed asthe low-salinity water in which the minima are embedded has zero or near-zero nutrientconcentration
178 Journal of Marine Research [72 3
Figure 10 Water property fields along transect 8 (Fig 1) These fields indicate low-salinity GAIWroughly confined between the 25 and 27 σt surfaces (a) Near the eastern basin margin the GAIWis carried northward by an order 20 cm sminus1 current (d) and contains relatively high concentrationsof NO2 + NO3 and chlorophyll (b and c)
The shipboard-ADCP data reveal that the GAIW observed at transects 6ndash14 is predomi-nately carried northward The velocities measured in the low-salinity GAIW at the easternmargin of these transects are directed northward at a rate of 5ndash25 cm sminus1 (eg Fig 10)at all but transect 10 This tendency of northward GAIW flow over the central Red Sea isnicely illustrated by the velocity and N fields measured at 66 m (Fig 11) These show anearly continuous northward-flowing stream of nutrient-enriched GAIW extending alongthe eastern Red Sea margin from 19 to 24N With the available data we can only spec-ulate as to why the northward flow of GAIW appears to be interrupted at transect 10Along-shore velocities measured within the low-salinity nutrient-enriched water observedat the eastern margin of transect 10 are less than 5 cm sminus1 in magnitude and predominatelydirected to the SSE As transect 10 reaches to within 5 km of the coast it is unlikely thatour measurements missed a near-shore northward flow of GAIW It is possible that theweak GAIW flow at transect 10 may be partially the result of a temporal weakening of theGAIW inflow through BAM due to local wind forcing (Murray and Johns 1997) With thisexception the data indicate a northward flow of GAIW along the eastern margin of the RedSea basin with high N relative to the central basin water of the same depth to a latitude ofsim24N
2014] Churchill et al The transport of nutrient-rich Indian Ocean water 179
Figure 11 Expanded view of the region enclosed by the northern rectangle in Figure 1 with 66-mNO2 + NO3 concentration and mean 66-m velocity (vectors) at each CTD station
4 Summary and discussion
Our analysis of the autumn 2011 cruise data has changed the view of how GAIW propa-gates through the Red Sea In a broad sense the analysis has revealed four modes of GAIWtransport
One is a rapid transit of nutrient-rich GAIW though the southern Red Sea in subsurfaceflow near the eastern boundary The speed of this flow at sim25 cm sminus1 is considerably fasterthan the 6-cm sminus1 rate of northward GAIW transport previously estimated from temperaturedata (Smeed 1997) This strong northward flow and the nutrient-rich GAIW it carries extendto 19N gt300 km farther north than GAIW had been detected in previous hydrographicobservations (Sofianos and Johns 2007) The magnitude of observed N-transport carriedby GAIW between 17 and 19N is comparable with the N-transport of the GAIW influxthrough BAM suggesting that the nutrient flux of GAIW may not be significantly alteredby mixing or production as it transits the southern Red Sea
A second transport mode is cross-basin conveyance of GAIW in the circulation of a basin-scale eddy Our data show this cross-basin GAIW transport occurring at sim19N essentiallyat the terminus of the rapid northward GAIW flow noted above This mode of transportmay be an important mechanism for rapid movement of GAIW across the Red Sea basin
180 Journal of Marine Research [72 3
Studies by Quadfasel and Baudner (1993) and Sofianos and Johns (2007) have shown thatthe central Red Sea basin is typically populated with eddies encompassing velocities of upto 1 m sminus1
A third mode of GAIW transport is observed north of 19N and takes the form of a streamof dilute GAIW extending along the eastern Red Sea margin to 24N Given the prevalenceof eddies with the Red Sea basin which could divert such a flow seaward it is uncertainwhether such a feature may be a common yearly occurrence
A fourth mode of transport is the incursion of GAIW into coastal reef systems In ourdata this is observed over the outer reefs of the Farasan Banks More widespread GAIWincursion into Red Sea coral ecosystems is likely GAIW penetration farther into the FarasanBanks is suggested by the velocities averaged over the GAIW depth range (at site e in Fig 6)and GAIW may be carried to the coral ecosystems of the eastern Red Sea via the circulationof basin-scale eddies Furthermore GAIW-borne nutrients may be delivered to the near-surface reef environment by vertical mixing of GAIW with bordering water masses asindicated by our measurements over the outer Farasan Banks As coral health is sensitive toeven small variations in nutrients (Marubini and Davies 1996 Ferrier-Pages et al 2000Silverman et al 2007) the incursion of nutrient-rich GAIW into the coastal areas of theRed Sea could have a profound influence on the resident coral ecosystems Comprehensivemultidisciplinary studies are required to understand how these systems are affected by andadapt to nutrient delivery by GAIW
Acknowledgments We gratefully acknowledge financial and logistical support for the RV Aegaeocruise provided by King Abdullah University of Science and Technology (KAUST) and the supportof an international group of scientists and technicians during the cruise We thank in particular S Swiftfor work on chart generation during and after the cruise P Zhai for her contribution in generatingthe SLA field and P Henderson for nutrient analyses This research was supported by Award NosUSA-00002 KSA-00011 and KSA-0001102 made by KAUST to the Woods Hole OceanographicInstitution
REFERENCES
Broecker W S 1974 ldquoNOrdquo a conservative water-mass tracer Earth Planet Sci Lett 23 100ndash107Ferrier-Pages C J-P Gattuso S Dallot and J Jaubert 2000 Effect of nutrient enrichment on growth
and photosynthesis of the zooxanthellate coral Stylophora pistillata Coral Reefs 19 103ndash113Heileman S and N Mistafa 2008 III-6 Red Sea LME 33 in The UNEP Large Marine Ecosystem
Report A Perspective on Changing Conditions in LMEs of the Worldrsquos Regional Seas K Shermanand G Hempel eds UNEP Regional Seas Report and Studies No 182 Nairobi Kenya UnitedNations Environment Programme 175ndash186
Khimitsa V A and V A Bibik 1979 Seasonal exchange in dissolved oxygen and phosphate betweenthe Red Sea and the Gulf of Aden Oceanol 9 544ndash546
Kundu P 1976 Ekman veering observed near the ocean bottom J Phys Oceanogr 6 238ndash242Maillard C and G Soliman 1986 Hydrography of the Red Sea and exchanges with the Indian Ocean
in summer Oceanol Acta 9 249ndash269Marubini F and P S Davies 1996 Nitrate increases zooxanthelae population and reduces skeleto-
genesis in corals Mar Biol 127 319ndash328
2014] Churchill et al The transport of nutrient-rich Indian Ocean water 181
Murphy J and J P Riley 1962 A modified single solution method for determination of phosphatein natural waters Anal Chim Acta 27 31ndash36
Murray S P and W Johns 1997 Direct observations of seasonal exchange through the Bab el MandebStrait Geophys Res Lett 24 2557ndash2560
Naqvi S W A H P Hansen and T W Kureishy 1986 Nutrient uptake and regeneration ratios inthe Red Sea with reference to the nutrient budgets Oceanol Acta 9 271ndash275
Patzert W C 1974 Seasonal reversal in the Red Sea circulation in Lrsquooceanographie Physique de laMer Rouge Paris Centre National pour lrsquoExploitation des Oceans 55ndash89
Poisson A S Morcos E Souvermezoglou A Papaud and A Ivanoff 1984 Some aspects ofbiogeochemical cycles in the Red Sea with special references to new observations made in summer1982 Deep-Sea Res 31 707ndash718
Quadfasel D and H Baudner 1993 Gyre-scale circulation cells in the Red Sea Oceanol Acta 16221ndash229
Silverman J B Lazar and J Erez 2007 Effect of aragonite saturation temperature and nutri-ents on the community calcification rate of a coral reef J Geophys Res 112 C05004doi1010292006JC003770
Smeed D 1997 Seasonal variation of the flow in the strait of Bab el Mandeb Oceanol Acta 20773ndash781
Sofianos S S and W E Johns 2007 Observations of the summer Red Sea circulation J GeophysRes 112 C06025 doi1010292006JC003886
Sofianos S S W E Johns and S P Murray 2002 Heat and freshwater budgets in the Red Sea fromdirect observations at Bab el Mandeb Deep Sea Res II 49 1323ndash1340
Souvermezoglou E N Metzl and A Poisson 1989 Red Sea budgets of salinity nutrients and carboncalculated in the strait of Bab-el-Mandab during the summer and winter season J Mar Res 47441ndash456
Takahashi T W S Broecker and S Langer 1985 Redfield ratio based on chemical data fromisopycnal surfaces J Geophys Res 90 6907ndash6924
Wood E F Armstrong and F Richards 1967 Determination of nitrate in sea water by cadmiumcopper reduction to nitrite J Mar Biol Ass UK 47 23ndash31
Zhai P and A S Bower 2013 The response of the Red Sea to a strong wind jet near the Tokar Gapin summer J Geophys Res Oceans 118 422ndash434 doi1010292012JC008444
Zhan P A C Subramanian F Yao and I Hoteit 2014 Eddies in the Red Sea A statistical anddynamical study J Geophys Res Oceans 119 3909ndash3925 doi1010022013JC009563
Received 26 June 2013 revised 28 August 2014
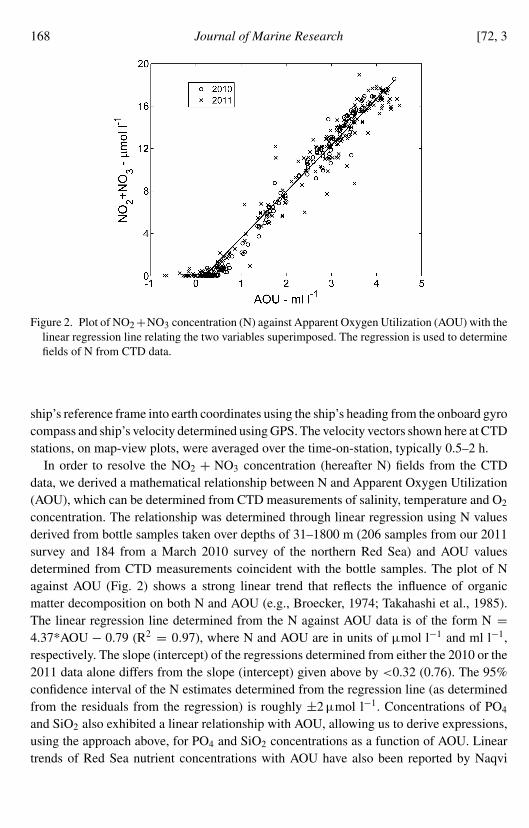
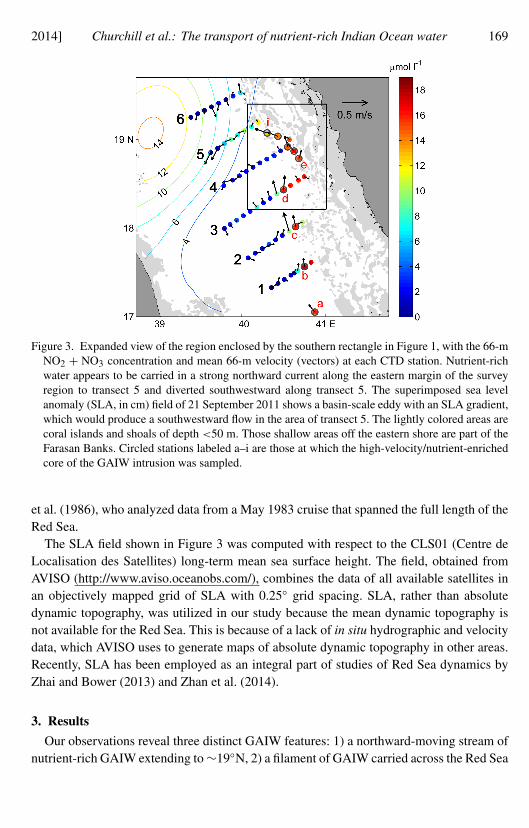
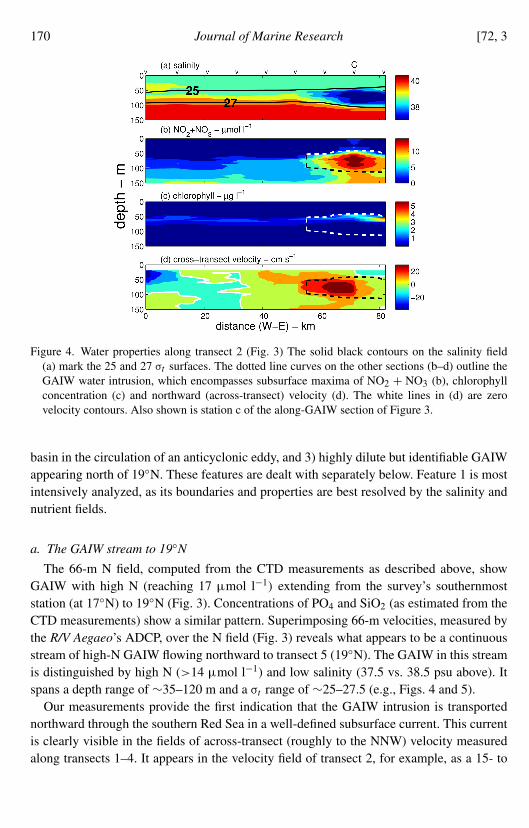
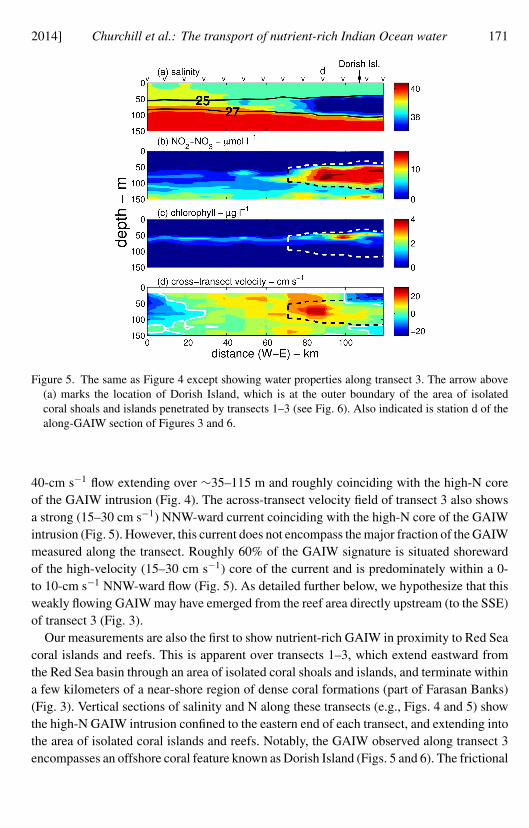
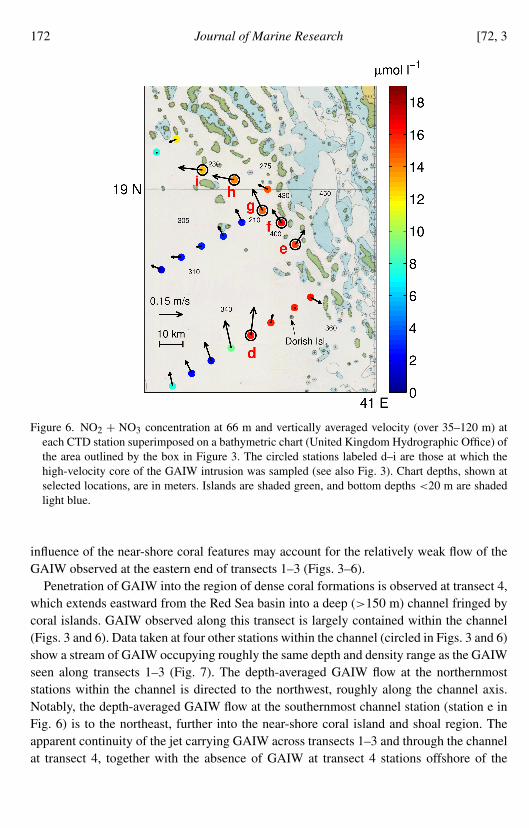
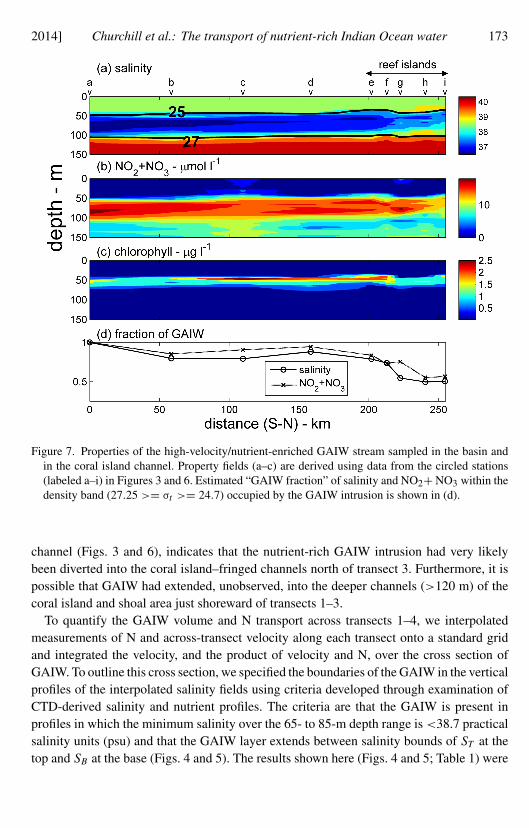
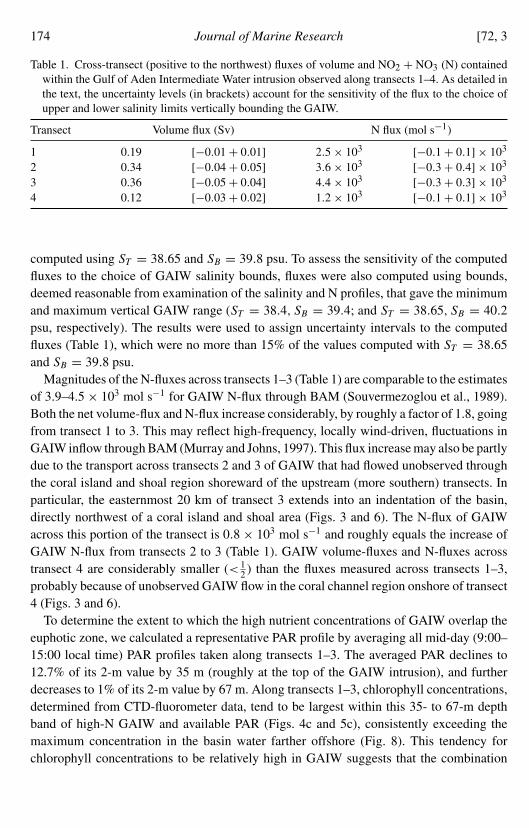
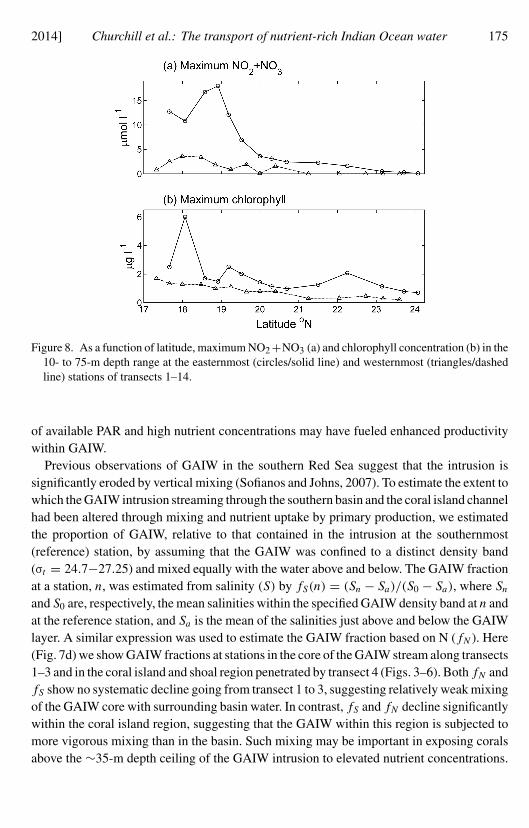
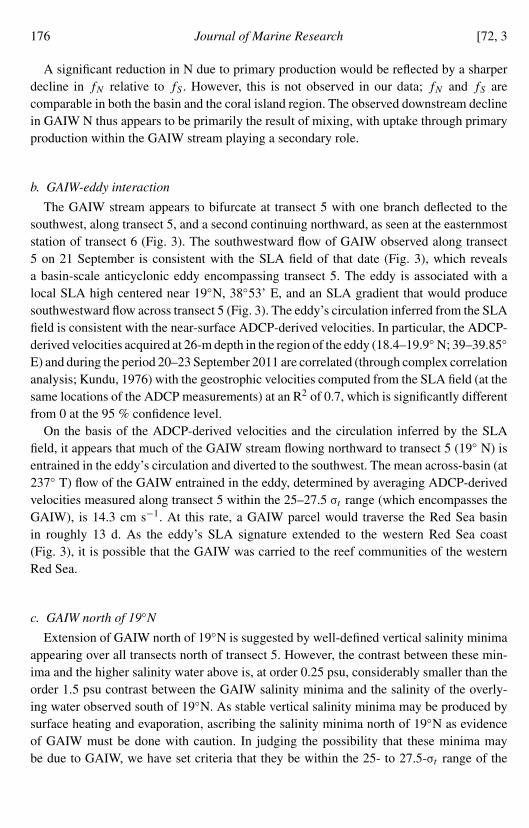
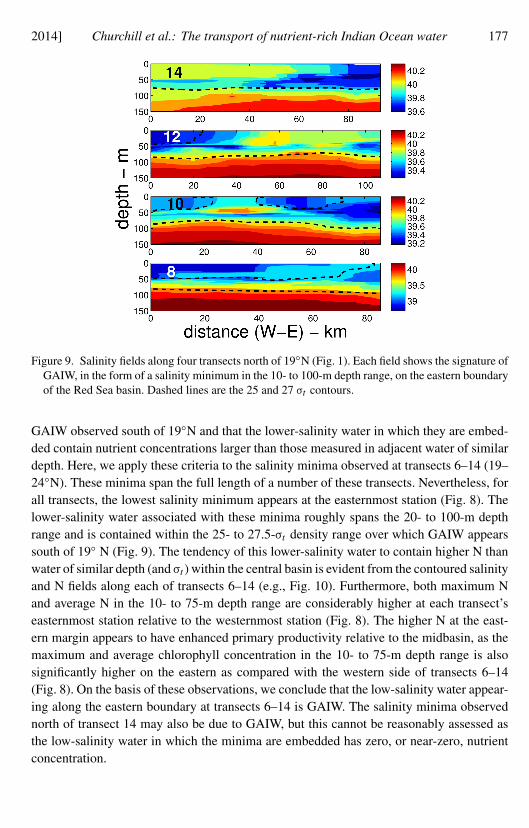
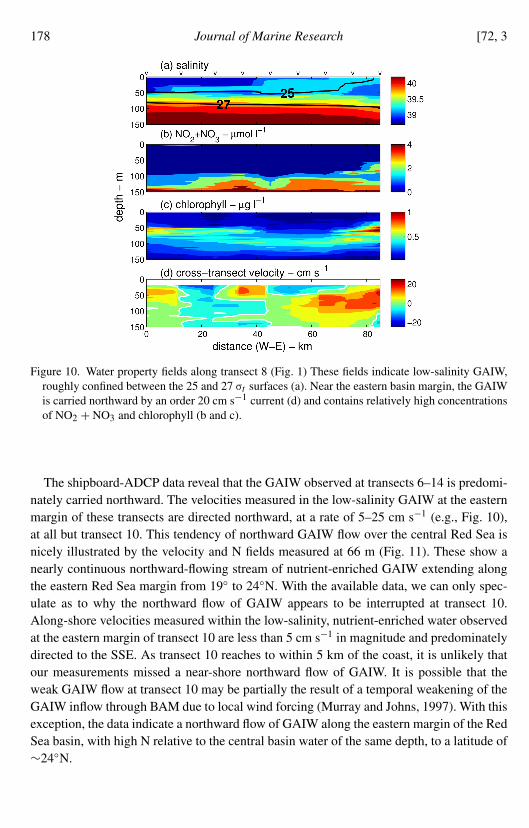
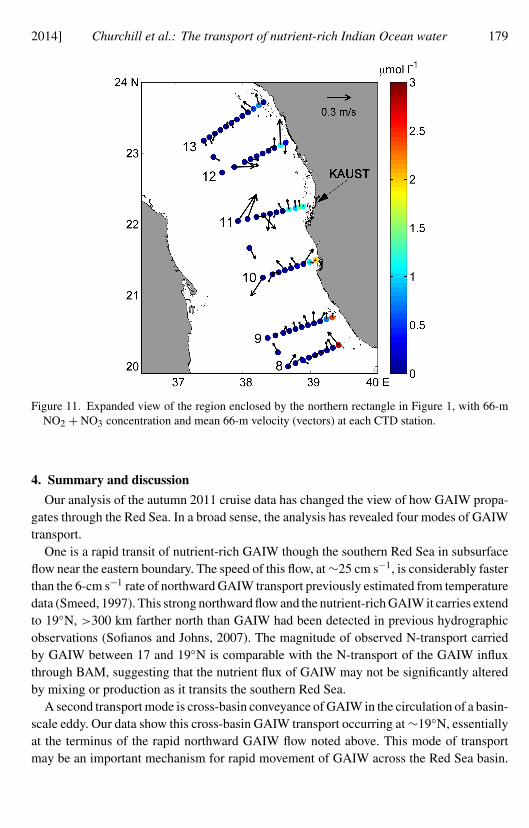