Embed Size (px)
Citation preview
SPONSORED BY
Copyright © 2013 InfoWorld Media Group. All rights reserved.
DeepDive
The triumph of
JavaScriptJAVASCRIPT IS EATING THE WORLD,
WITH NEW TOOLS AND ENHANCEMENTS ARRIVING AT A BREAKNECK PACE.
IS IT TIME TO ACCEPT THE INEVITABLE?

Deep Dive
2InfoWorld.com DEEP DIVE SERIES JavaS c r ip t
Remember the days when some people,
concerned about security, would disable JavaS-
cript in their browsers? Today that seems like a
ridiculous notion. JavaScript rules the Web.
In a computing era marked by a wild diversity
of platforms, we need apps that can run on
any device with a browser. Native apps may
run faster and exploit platform-specific features
JavaScript can’t touch, but we’re already living in
a cloud world. Are you going to write a desktop
or mobile app that runs on just one platform, or
write one in JavaScript that anyone can use?
Of course, the answer to that question
depends on the nature of the app. JavaScript
has obvious limitations -- for security reasons
JavaScript can’t read or write files on the client,
for example, and “real” programmers like to
hammer on a slew of shortcomings. But JQuery
and a host of other frameworks have made
JavaScript much more practical for building
complex applications, while JSON (JavaScript
Object Notation) has all but supplanted XML for
data transmission. Not to mention that Node.js,
which just won another InfoWorld Bossie award,
has provided a powerful way for JavaScript to
address the server side.
How far can JavaScript be pushed?By coincidence, two posts in InfoWorld’s New
Tech Forum both talk up the potential of JavaS-
cript: One by VisiCalc co-creator Dan Bricklin, of
Alpha Software, and one by Divya Manian and
Thibault Imbert of Adobe.
In “JavaScript beats native code for mobile,”
Bricklin calls into question the assumption that
JavaScript executes slower than native code:
While it’s true that for general computa-
tion of mathematical operations native code
should be able to run circles around JavaS-
cript (and compute those circles while doing
it), that viewpoint ignores the fact that far
different operations are performed in many
apps and JavaScript-based apps often equal
or beat native code for those operations.
Why? Because, Bricklin says, very smart
programmers have been tweaking browsers for
JavaScript is eating the world, with new tools and enhancements arriving at a breakneck pace. Is it time to accept the inevitable?BY ERIC KNORR
The triumph of JavaScript
SH
UT
TE
RS
TO
CK
Deep Dive
JavaS c r ip t InfoWorld.com DEEP DIVE SERIES
In other words, both easy to learn and some-what awkward, JavaScript democratizes programming — which will lead to messed-up code written by people who don’t know what they’re doing.
years to optimize the speed of those opera-
tions. Plus, progress is being made as we speak
in more advanced in-browser operations such
as 3D rendering.
Writing on behalf of Adobe, Manian and
Imbert peer into the future of JavaScript and call
out the Mozilla research project asm.js, which
“defines a subset of JavaScript that can be
generated by compilers and highly optimized by
JavaScript VMs.” More exciting is their explora-
tion of RiverTrail, a parallel programming model
and API for JavaScript developed by Intel. The
authors also talk about new HTML5 features
Adobe is proposing to standardize, including
Regions, Blend Modes, and Shapes.
It scarcely needs to be said that, by implica-
tion, Manian and Imbert’s post throws another
shovel of dirt on the grave of Flash and Action-
Script.
The JavaScript ecosystemThe triumph of JavaScript seems to have inspired
the launch of a new framework every week, as
well as other tools associated with JavaScript
coding. Along with jQuery and Node.js, this
year’s Best of Open Source Software Awards
showcased seven JavaScript winners:
• AngularJS, a toolset for turning static HTML
pages into JavaScript applications, with support
for MVC architecture
• Backbone.js, a JavaScript library that
enables developers to add structure to apps and
represent data as Models
• Bootstrap, a responsive Web design frame-
work intended to be used in conjunction with
JQuery
• Enyo, an object-oriented JavaScript frame-
work that can be used to build HTML5/CSS apps
• D3, a JavaScript library that pushes vector
graphics about as far as it can go in the browser,
no plug-ins necessary
• Ember.js, an up-and-coming JavaScript
framework for developing MVC applications
with rich functionality
• Emscripten, a compiler that converts C++
into asm.js, Mozilla’s highly optimizable subset of
JavaScript
That’s quite a toolbox -- and these represent
only the cream of the crop of what’s available.
The explosion in these tools, most of which
are open source, continues to fuel JavaScript’s
momentum.
But ... JavaScript??Nonetheless, experienced developers remain a
little queasy. InfoWorld’s Andy Oliver articulates
his reservations this way:
All JavaScript, all the time is entirely possible
-- you just need to decide for yourself
whether it’s a good idea ... The manager
in me loves the idea of being able to have
a pool of developers who can do jQuery,
Node.js, and maybe light database work on
MongoDB. The developer in me cringes at
the idea of spending my days writing JavaS-
cript ... The project lead in me cringes at the
thought of a bunch of JavaScript developers
even thinking about my precious database.
In other words, both easy to learn and some-
what awkward, JavaScript democratizes program-
ming -- which will lead to messed-up code written
by people who don’t know what they’re doing.
But there are also growing ranks of good
JavaScript coders, many of whom will run close
behind such advancements as asm.js or Intel’s
RiverTrail parallel programming model. They
certainly won’t suffer from a lack of tools to
pursue their craft.
The best doesn’t always triumph. As with
the x86 instruction set, sometimes the winner
just happens to be the last platform standing.
I have no idea how JavaScript can extend itself
to enable developers to build, say, applications
with the accumulated richness of a Microsoft
Office. But strange as it may seem to see the
future through a browser window, I wouldn’t bet
money against it. n
Eric Knorr is editor in chief at InfoWorld and has
been with the publication since 2003. A tech-
nology journalist since the start of the PC era,
he has developed content to serve the needs of
IT professionals. He ihas received the Neal and
Computer Press Awards for journalistic excel-
lence.
3

Deep Dive
Trying to decide which JavaScript UI frame-
work will best meet the needs of your project
and organization? With 10 strong contenders,
there’s a lot to consider.
Over the past few years we’ve seen tremen-
dous growth in UX libraries and frameworks --
most of which are open source. Much has been
written comparing the use of, approach to, and
completeness of these frameworks. But often
overlooked are the metrics tracking the size,
strength, and momentum of the communities
and ecosystems surrounding these open source
projects. These stats should play a key role in
your selection.
Earlier this year, I had the opportunity to do
an analysis of the fastest-growing open source
projects started in 2012, and I was struck by the
number of JavaScript projects on the list. This
caused me to take a deeper look into specific
JavaScript library/framework projects that focus
on helping developers build rich, scalable user
interface. My analysis uses open source commu-
nity metadata from Ohloh.net and incorporates
data from GitHub, including the number of stars
(which helps users track repositories they find
interesting) and followers individual projects
have attracted.
Which projects rose to the topThis analysis digs into the communities behind
the top 10 open source projects spanning UI
libraries, frameworks, and full-stack frameworks
that include server-side runtimes. The projects
in my analysis are today’s hottest UI projects,
The 10 hottest JavaScript framework projects
4InfoWorld.com DEEP DIVE SERIES JavaS c r ip t
Community strength is a huge factor is determining which JavaScript framework to adopt. Here’s a close look at the activity swirling around AngularJS, Backbone.JS, Ember.js, and more BY DAVE GRUBER
Project contributors per monthThe number of contributors to Ember took off like a rocket when the project was forked from SproutCore in December 2011. Google’s AngularJS has also seen rapid growth.

Deep Dive
5InfoWorld.com DEEP DIVE SERIES JavaS c r ip t
including AngularJS, Ember.js, SproutCore, Back-
bone.JS, Knockout.js, Spine, CanJS, Meteor-JS,
Derby, and Yahoo Mojito.
My goal was to paint a picture of the
communities surrounding these projects, specifi-
cally looking at size and growth, in an effort to
correlate the data against the popularity and
success of individual projects. Also included is
a look into the ecosystem surrounding each
project, with the assumption that the ecosystem
further reflects the popularity and success of a
project.
Monthly contributorsExploring the number and growth of monthly
contributors for a project provides insight into
the project’s momentum and can highlight crit-
ical tipping points for projects that are capturing
broad industry interest. The chart below tracks
monthly contributor participation. This statistic
shows the number of developers who have
contributed code in a given month.
As you can see, SproutCore was the early
front-runner in monthly contributor participation.
However, when SproutCore forked to create
Ember in December 2011, many developers on
the team moved along with it, jump-starting
Ember. Now Ember, along with AngularJS, has
seen significant monthly contributor growth in
2013, both emerging as leaders from an overall
community growth perspective. Also note that
in the spring of this year, active contributors to
Backbone and Meteor dropped off significantly
concurrent with the accelerated growth of
AngularJS and Ember.
All-time contributorsLooking at total lifetime contributors for a
project can help us understand a few different
points. For one thing, it often reflects the gover-
nance style of a project. Many projects are tightly
managed by a small group of people, while
others open up contributions to a wide and
diverse audience.
The number of all-time contributors can also
help us understand the relative momentum of a
project at any given time. Large, well-established
projects can often have significant numbers of
contributors, helping fix bugs, contributing to
documentation, and other related tasks. The
total number of contributors can also often
be associated with the overall size of the code
base. This metric is typically most valuable when
combined with other community metrics, such
as lines of code, total commits, and monthly
commits.
Ecosystem projectsBeyond immediate contributors, the strength of
a project’s community is evident from ecosystem
projects that extend and are built upon them.
This demonstrates that the core project commu-
nity alone doesn’t always tell the whole story of
a project’s momentum. Looking more broadly at
the ecosystem can further describe the overall
success of an individual project.
Project contributors over project lifetimeAngularJS and Ember show the largest overall communities, which mirror their recent monthly contributor growth.
Number of related projectsThe robustness of an open source project can in part be measured by the number of projects surrounding it. Here, Backbone.js and AngularJS are the clear winners.

Deep Dive
InfoWorld.com DEEP DIVE SERIES 6JavaS c r ip t
Notably, Backbone has a substantial
ecosystem, showing its overall momentum and
usage in the industry. In an effort to further
validate the Backbone ecosystem, I filtered my
search to include only Backbone-related projects
that have three or more stars on GitHub, which
resulted in 1,627 projects. Compare this with
794 AngularJS projects with more than three
stars, and Backbone’s ecosystem is still two times
the size of AngularJS’s.
Full-stack solutionsBecause the full-stack solutions have a different
scope than many of the other projects, I wanted
to take a separate look into their growth. Full-
stack solutions include both a client framework
and a server-side framework; hypothetically, the
amount of code involved should be greater, as
should be the number of contributors partici-
pating over time. The chart indicates each of
these projects is in a relatively early stage with
moderate participation.
The rise of JavaScriptThe number of developers who invest time and
create structured approaches to using JavaS-
cript is growing at a rapid rate. The chart below
shows the increasing, cumulative number of
developers contributing since the beginning of
2011. This reflects the mounting importance of
UI frameworks in today’s application develop-
ment and the continuing need for different
approaches supporting the needs of the many
different use cases across companies of all sizes.
There was a notable jump in contributions
starting in January of this year, primarily driven
by the growth in the AngularJS and Ember
teams.
Lines of code and commitsYou may be left wondering about the size of
the code bases for each of these projects -- and
the relationship between that number and the
number of contributors. Comparing these, we
see that community size and total commits have
little correlation to the size of the code base. For
Number of full-stack solutionsMeteor and Mojito appear to be attracting a stronger community, at least as measured by the number of contributors.
Total number of contributors for all 10 JavaScript projectsIf you have any doubt, this chart will convince you that JavaScript is eating the world, with the average number of developers more than doubling from 2011 to 2013.

Deep Dive
7InfoWorld.com DEEP DIVE SERIES JavaS c r ip t
example, AngularJS shows a ratio of 413 LOC
per contributor while Ember shows a ratio of
146 LOC per contributor.
You can, however, correlate the size of
the community (all-time contributors) with the
all-time number of commits and see that the
number of commits per contributor varies greatly
by project. This may show that some projects are
easier to contribute to, affecting their long-term
sustainability.
Reading the tea leavesCommunity size and growth are important
indicators of a project’s momentum. While these
indicators can’t tell us the whole story, they
provide important insight into projects that are
being heavily invested in and help us make deci-
sions based on the viability and sustainability of
the community behind a project. They can also
aid us in finding tipping points in a project’s life
span, providing us with opportunities to both
engage in projects and influence change.
The subject of rich UI frameworks is near and
dear to me, as I spent five years at Adobe driving
product marketing for the Flex framework,
now an Apache project. Based on all the data
analyzed here, my take is that Ember and Angu-
larJS are emerging as the frameworks to watch.
That said, the ecosystem surrounding Backbone
demonstrates both the popularity and commit-
ment to this UI approach, and is therefore sure
to have a continuing, bright future ahead. n
Dave Gruber is Black Duck’s Senior Direc-
tor of Product Marketing. He has an extensive
background in software development, with
more than 30 years’ experience in enterprise
application development, IT management,
product management, and product marketing.
Drawing on data from Ohloh and the Black Duck
Knowledgebase, Dave frequently writes about
open source trends, the latest new open source
projects, and how companies can leverage open
source methods.
Line of code vs. contributorsMore lines of code per contributor may indicate that a project is easier to contribute to, which some see as an indicator of a project’s health.

Deep Dive
InfoWorld.com DEEP DIVE SERIES 8JavaS c r ip t
Review: 4 supercool JavaScript tools for data visualizationFree, open source D3, InfoViz, Processing.js, and Recline.js bring dynamic, interactive -- and jaw-dropping -- data-driven graphics to the Web browserBY RICK GREHAN
New graphical elements in HTML5 and the
blossoming of JavaScript libraries have sparked
a positive renaissance in interactive data display
techniques. Today’s Web browsers not only
function as a rich user interface with responsive
and eye-pleasing graphical controls, but serve
as a data visualization playground of moving
histograms, frothing bubble charts, wind-blown
graphs, and colorful maps whose boundaries
swell and shrink.
Delivered to your desktop from around the
Web, this seemingly endless variety of dynamic
and interactive graphics allow news outlets
and bloggers and merchants -- anyone with a
website and access to a data source -- to present
data in dynamic ways you’d never expect to see
Pros Cons
D3 Abundance of examples
Uses standard DOM objects; easily debugged
Can be extended to create almost any data visualization you can dream up
Steep learning curve
Data “lifecycle model” not straightforward
Optimal use requires deep under-standing of JavaScript
InfoVis API is easy to comprehend
Hookable calls to enhance interactivity
Mainly a charting library; less flex-ible than others
Not as easily extended as other tools
Processing.js Can be used to create animations
Largely compatible with original Processing Java tool
Requires learning the Processing language
Passing data into engine requires some gymnastics
Recline.js IDE and online test platforms available
Online exerciser
Excellent integration with other JavaScript libraries
Sees the world through “relational database” eyes
Limited out-of-the-box charts
Documentation needs work
JavaScript libraries for data
visualization

Deep Dive
InfoWorld.com DEEP DIVE SERIES 9JavaS c r ip t
in a lowly browser.
This age of interactive data visualization rests
largely on capabilities provided by JavaScript
libraries designed specifically for the task. In
this article, we’ll look at four such libraries: D3,
InfoVis, Processing.js, and Recline.js. All of these
libraries can be used to adorn your Web page
with dynamic data visualizations, but each takes
a different approach to providing that capability.
And all four are free to use and redistribute under
open source licenses.
D3 takes a sort of “ground-up” approach,
combining the data structures already found in
the DOM representation of a Web page with
some of JavaScript’s more esoteric capabilities.
The result is both powerful and eye opening.
InfoVis follows a more conservative path.
Its API is clearly delineated, and its use is easily
grasped: Insert the chart objects and feed them
data; InfoViz does the rest.
Processing.js, the JavaScript version of an
initially Java-based graphical system, is not
content to provide merely data visualizations,
but is fully capable of the sort of animations you
might find in video games.
Finally, Recline.js treats data visualization as
one aspect of data exploration. While it prefers its
data organized into fields and records, it is none-
theless happy to provide you with timelines, line
graphs, or even geographical visualizations.
D3You may have already seen D3 (short for Data-
Driven Documents) in action -- it’s the visualiza-
tion library behind many of the interactive info-
graphics on the New York Times online edition’s
pages. Links to some of those articles are at the
website of Michael Bostock -- the principal author
of D3, though he acknowledges considerable
contributions from Jason Davies.
D3 is the offspring of an earlier project called
Protovis. The evolution from Protovis to D3 -- as
well as an excellent overview of D3’s internals
-- can be found in the paper, “D3: Data-Driven
Documents,” by Bostock, Vadim Ogievetsky, and
Jeff Heer.
D3 is similar to jQuery in that it manipulates
the DOM directly. This sets it apart from most
other visualization tools, which execute in a
separate set of objects and functions and call into
the DOM through standard APIs. D3 employs
entities already familiar to Web developers. For
example, you can use CSS to style elements that
D3 manipulates. Also, because D3 uses internally
the same structures employed by the browser
to represent the document, you can work with
existing browser-based development and debug-
ging tools with D3.
In D3’s world, selections are key. Selections
allow you to easily and iteratively perform opera-
tions on sets of document nodes. To change the
color of all paragraph elements:
d3.selectAll(“p”).style(“color”, “white”);
This technique of “chaining” a pipeline
of functions -- each passing its results to the
function appended to its right -- will be familiar
to users of jQuery and Prototype. D3 program-
mers use it to concisely express multiple actions
in a compact space. Selectors make DOM node
manipulations as simple as setting attributes and
styles, or as complex as sorting nodes, adding
nodes, and removing nodes.
This D3 example is a modified bubble diagram, shown here with the “circle” element altered so that a rectangle is used in place of the bubble.

Deep Dive
InfoWorld.com DEEP DIVE SERIES 1 0JavaS c r ip t
D3 binds data to DOM nodes via the data()
function. Typically chained after a select opera-
tion, data() builds data nodes and associates
them with DOM nodes returned from the selec-
tion. You can think of the data as being “joined”
to the DOM nodes. This joined data ultimately
drives the visualization of the elements repre-
sented by the DOM nodes. It determines the
height of bars in a bar chart, the size of bubbles
in a bubble graph, the position of teardrop
markers on a map, and so on.
Data joining is a key component of what D3
refers to as the “general update pattern.” A style
of coding a D3 application, the general update
pattern starts with a selection operation, which
is then followed by operations that add elements
corresponding to new data via D3’s enter() func-
tion, update existing elements (by modifying
whatever element attributes need modifica-
tion), and remove elements corresponding to
data that is no longer part of the visualization,
via D3’s exit() function. Although difficult to
grasp initially, the general update pattern nicely
manages a visualization’s entire lifecycle.
Data also drives D3’s transitions, allowing the
tool to produce dynamic displays, as opposed to
simply painting static graphics. The relative size
of bubbles in a bubble graph swell or shrink, and
bar charts rise and fall, as new data enters the
visualization and old data exits.
In D3, a transition is implemented as a key-
frame animation of two frames: starting and
ending. The starting frame is a visual element’s
current state. The ending frame is defined by
data that specifies the values of attributes to be
applied to that element. D3’s interpolator func-
tions handle the transition. D3 supplies interpola-
tors for things like numbers and colors; it’s smart
enough to peek into strings and locate and
interpolate embedded values such as the font
D3 displays a radial, Reingold-Tilford tree. The data is from the Flare ActionScript library’s API.
Deep Dive
InfoWorld.com DEEP DIVE SERIES 1 1JavaS c r ip t
size in a font specification. You can define your
own interpolator functions; D3 even integrates
with CSS3 transitions.
Where does the data come from? Although
you can embed it directly into your application,
D3 has functions for reading data from external
sources: text files, CSV files, JSON documents,
and others. It can even read an HTML document
and parse its contents into a document tree.
D3’s documentation is voluminous, though
it’s scattered throughout links on the Web page.
The API documentation is excellent, with code
sample interwoven among the explanations.
While the links in the API docs are to specific
functions, everything is organized by activity with
each of D3’s modules. The Web page also leads
to piles of tutorials and presentations on other
websites.
You’ll have the most fun by exploring the
Examples Gallery, which drops you into a trea-
sure trove of sample D3 visualizations. Many
of the gallery’s examples are accompanied by
commentary, as well as annotated source code.
You could spend days exploring all the chart
types and visualization techniques presented.
D3 has a relatively steep learning curve.
Its mechanism for handling a visualization’s
changing data set -- existing data elements being
modified, new data elements being added, and
old data elements being removed -- requires
careful study (and a good understanding of
JavaScript) to fully comprehend. Luckily, the
available tutorials are top quality, and just trying
a few of the visualizations made possible by D3
proves that time spent wrestling with the library
will be well rewarded.
D3 harnesses what’s available in HTML5 and
the DOM, and it couples that with a keen under-
standing of JavaScript’s capabilities. It enables
the eloquent manipulation of standard docu-
ment objects to generate data visualizations.
Oddly, D3 has almost no specifically graphical
side -- it doesn’t even know how to draw circles
(it employs the circle-drawing capabilities already
in HTML5). D3’s real power is in its ability to
transform a document (as in the DOM) based on
data -- Data-Driven Documents.
InfoVisThe JavaScript InfoVis Toolkit, or InfoVis for
short, is the creation of Nicolas Garcia Belmonte.
Although the toolkit is now owned by Sencha, it
retains an open source (BSD) license.
InfoVis is primarily a charting library that
makes heavy use of JSON. Data that is passed to
InfoVis’s charting functions does so in the form
of JSON objects. Also, when a chart is initialized
(that is, the chart object, such as an area chart,
is created) the chart’s parameters are specified
as elements in a JSON object that’s passed to
the initialization function. In effect, the JSON
objects serve as named parameters to InfoVis’s
function calls.
InfoVis’s stable of graphs include area, bar,
and pie charts; tree maps; space and hyper trees;
sunbursts; radial graphs; and force-directed
graphs. You can also form visualizations that are
compositions of multiple graph types (one of the
demonstrations shows a mixture of pie charts
and tree graphs). Most charts have configurable
display options unique to the chart type. For
example, a tree chart can be aligned left, center,
or right in its display field.
InfoVis also provides a set of core utility func-
tions, many of which are more or less duplicates
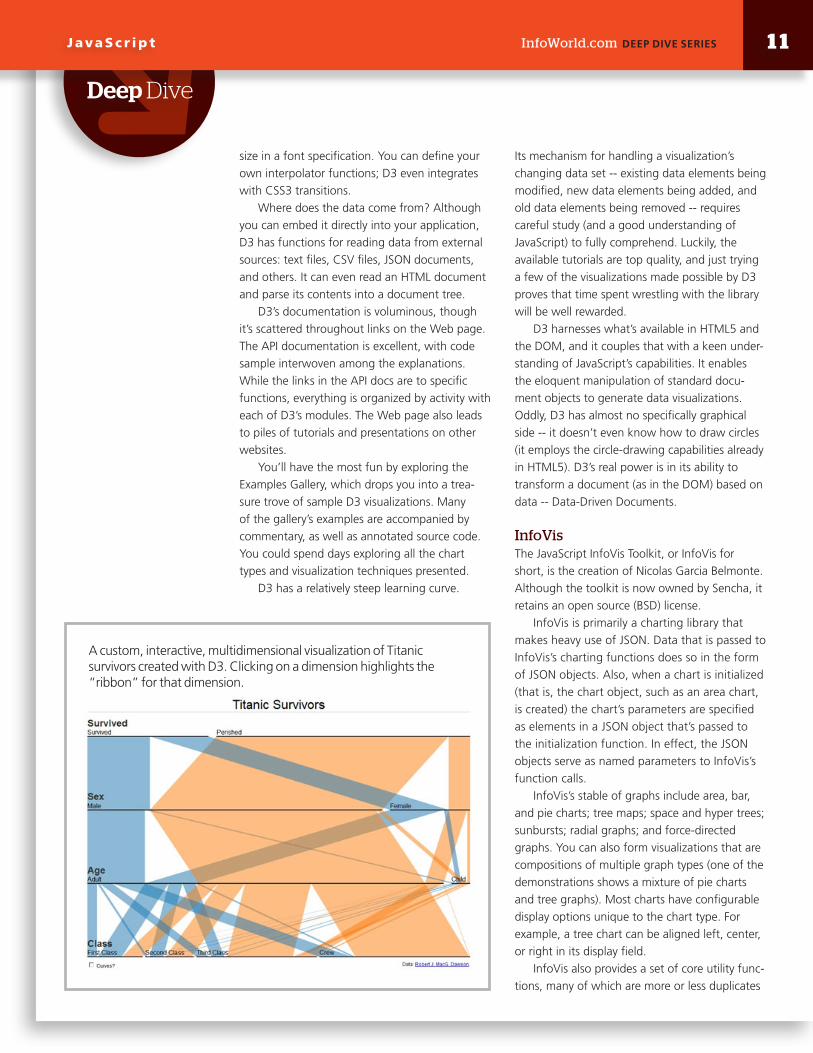
A custom, interactive, multidimensional visualization of Titanic survivors created with D3. Clicking on a dimension highlights the “ribbon” for that dimension.

Deep Dive
JavaS c r ip t 1 2InfoWorld.com DEEP DIVE SERIES
of similar functions available in popular JavaS-
cript libraries such as jQuery, Prototype, and
MooTools. For example, InfoVis provides the
each() function, which iterates over an array,
repeatedly applying a function -- useful for
wholesale modifications of the results of a selec-
tion, like changing the text color of all instances
of a specific <div> class.
Every chart type object has an associ-
ated updateJSON() method, which is how you
update the chart’s data. Transitions -- how a
chart morphs from one set of data to another
-- are built into InfoVis’s visual objects. However,
the library defines a set of controller methods
you can invoke to set callback functions. These
callbacks are executed at various stages in
the animations that a chart will exhibit either
through transition or user interaction. For
example, you can define a callback function
that’s called just prior to a node’s being drawn,
causing perhaps the node’s shape to change just
before the node object is plotted.
Similarly, you can embed functions in the
chart’s initializing JSON object. For example, you
can specify an onShow event handler, which
will be triggered when the user hovers over an
element. By passing the function a reference
to the specific node, you can extract the data
associated with the node and display a pop-up
table of that data.
The API documentation is clearly arranged.
The author has organized the Web page into a
navigation pane on the left and content on the
right. Entries are grouped by category -- Core,
Loader, Visualizations, and more -- and heavily
hyperlinked for easy browsing. But the best
place to start with InfoVis is the demos Web
page. All demonstrations are interactive, and the
author has even provided trimmed, annotated
code to explain important aspects of the specific
demonstration.
InfoVis is a more approachable toolkit than
D3. Initial development amounts to choosing a
chart type and passing it some data in JSON --
and there you are. As you become more familiar
with the package, its configurable options let
you tweak display and animation to produce
customized effects.
This InfoVis-generated force-directed graph shows the relationships among the members of an imaginary family.
InfoVis displays a sunburst diagram of a directory tree. Hovering over a slice produces a pop-up with information
about the directory or file.

Deep Dive
JavaS c r ip t InfoWorld.com DEEP DIVE SERIES 1 3
Processing.jsProcessing.js is a bit different from the other
packages in a couple of ways. First, Processing.js
is a JavaScript port of the Processing visualization
language. The Processing language was origi-
nally developed at MIT, and its documentation
describes it as “a simplified Java, with a simpli-
fied API for drawing and graphics.”
Second, while Processing.js can be used
to draw graphs and charts, it’s also a respect-
able, general-purpose graphics and animation
package. Processing (and therefore, Processing.
js) goes beyond data visualization, providing
both 2D and 3D graphics commands, and
permitting the creation of animations, interactive
digital artwork, and even video games. On the
Processing.js Exhibition page, you’ll find links to
animations of sea creatures, asteroids-like video
games, sketch applications, and more.
Processing.js renders its images using
HTML5’s canvas element. In a sense, Processing.
js extends the capabilities of HTML5’s canvas,
which Processing.js’s creators considered to be
too low-level for developers to use efficiently.
Working with Processing.js typically involves
writing your code in the Processing language,
and having Processing.js translate your code into
JavaScript for execution. The translation actually
occurs on the fly.
To develop Process.js applications, you’ll
want to download and use the Processing IDE.
(Versions are available for Windows, Linux, and
Mac.) The IDE is basically an editor with Run
and Stop buttons to display your Processing
application in a pop-up window. The IDE also
lets you export your application into a stand-
alone executable. Best of all, if you’re new to
Processing, the download includes the source
code for numerous example applications.
In addition to the IDE, the Processing.js
website also provides the Processing.js Helper
page. Paste your Processing code into the page’s
text box, then click Run to see how it will appear
when executing on a Web page. The Helper
page also provides a converter that will translate
Processing code into the equivalent Processing.js
JavaScript code.
Acceding to user requests, the developers
of Processing.js have surfaced the API of the
Processing.js engine that performs the graphical
operations in a Processing.js application. That
means you can skip the step of having to write
your application in Processing and translating it
into JavaScript. Instead, you can call the graphics
engine directly from your JavaScript code.
Tutorials on the Processing.js website demon-
strate how to pass data back and forth between
Processing instances (objects that execute in
the Processing engine) and JavaScript functions
running outside of the engine.
The Processing.js website provides links to
copious documentation. Plus, links will guide you
to more documentation for Processing itself. Best
of all, there are plenty of demo applications (I
counted more than 90). All include a live execut-
able window of the visualization, as well as the
source, and many provide explanations of the
specific feature illustrated by the example.
Processing.js is unable to cut itself entirely
free from its Java roots. It still feels like Java.
Nevertheless, because Processing.js is JavaScript
and because you can call the library’s API from
any piece of JavaScript code, the result is that a
Processing.js application has full access to all the
The Processing IDE (executing in the Java JVM) includes numerous demonstration applications. Here the IDE is shown running a simulation of planets (complete with cloud textures) orbiting the sun.

DOM elements. In addition, nothing hinders you
from mixing Processing.js and any other JavaS-
cript library.
Recline.jsRecline.js is billed as a “simple but powerful
library for building data applications in pure
JavaScript and HTML.” It is primarily the work
of Dr. Rufus Pollock (with his colleagues at the
Open Knowledge Foundation) and Max Ogden.
Recline.js’s internals can be partitioned into
three areas: models, back ends, and views.
Model components -- Datasets, Records, and
Fields -- impose structure on data; a Dataset is
a container that holds Record objects. In turn,
Record objects hold Field objects, which repre-
sent the constituent data. A Field possesses a
label, format specification, a flag to indicate
whether the Field is calculated, and data type.
Recline.js defines 13 data types, ranging from
simple (string, integer, float) to complex (geo_
point and geoson). A Field can also hold a collec-
tion or even an arbitrarily complex JSON object.
Recline.js’s Backend object furnishes the
connection between a Dataset object and a data
source. Put simply, you use a Backend object to
“fill” a Dataset with records. Currently, Recline.
js comes with eight back ends, including CSV
files, ElasticSearch, CouchDB, Google Doc
spreadsheets, and others. Recline.js even has a
“memory” back end, which allows you to push
data into Recline.js directly (hard-coded into your
application).
Of course, Recline.js wouldn’t be a data
visualization library if it couldn’t visualize data
-- and that’s where its Views come in. Recline.js
supports two sorts of views: Dataset and Widget.
I use the word “support” because Recline.js
doesn’t provide View objects so much as it inte-
grates with view objects from other frameworks.
In fact, the documentation notes that “Recline.js
views are instances of Backbone views.”
As its name implies, a Dataset view displays a
Dataset object. For example, a Grid view is really
a table view displaying rows with column head-
ings. Examples of Dataset views on the Recline.
js website show bar charts, line charts, timelines,
and even geo-data displayed on maps.
A Widget view lets you build what other
frameworks might simply call a widget. Widget
views either display or control some aspect of a
set of data. A Widget view would also be used
to display or modify an application’s generic
data. The example given for a Widget view in
the Recline.js documentation is QueryEditor, a
control that lets you view and modify the current
query state of a Dataset.
Recline.js’s documentation consists of an
overview page, which points you to more
detailed explanations of Recline.js mechanics.
The explanations are helpfully interleaved with
code snippets. Although what’s currently avail-
able is good, the documentation appears to be
a work in progress. For example, though Widget
Views are described briefly, the only real explana-
tion you’ll find is inside the source’s documenta-
tion. Finally, a comprehensive glossary would be
useful. I often encountered a term that I’m sure
someone familiar with Recline.js understood
immediately, but was mysterious to me.
Recline.js takes an almost relational view of
the world. Its Dataset, Record, and Field compo-
nents are entities that you would imagine finding
Deep Dive
InfoWorld.com DEEP DIVE SERIES 1 4JavaS c r ip t
This interactive display of winners of AFL/VFL (Australian Football) from 1897 to 2010 was created with Processing.js by Fink Labs. Each year is a concentric circle. Move the mouse to display the year and the team.

Deep Dive
JavaS c r ip t InfoWorld.com DEEP DIVE SERIES 1 5
in a relational database library.
Recline.js makes no bones about its being
built on (and therefore requiring) other JavaScript
frameworks. Specifically, Recline.js makes heavy
use of Backbone.js -- a JavaScript framework
that supplies entities that let you build MVP
(model-view-presenter) applications. In turn,
Backbone.js uses the utility JavaScript library
Underscore.js.
Recline.js also enhances its back-end code
with jQuery, as well as view code with libraries,
including Leaflet, TimelineJS, and others.
Recline.js is a marvelous example of incremental
technology and code reuse. It stands on the
shoulders of several powerful JavaScript libraries,
inheriting and extending their capabilities.
Where HTML5 meets big dataIf you need straightforward charts, manipu-
lated in a straightforward fashion, then you
should be pleased with InfoVis. Just package
your data into JSON and feed it to the right
chart object -- you have your graph. On the
other hand, if you’re looking for a library that
will take you beyond data visualization -- that
can produce abstract graphic designs or even
pure animations -- then look no further than
Processing.js.
If, however, you’re more interested in your
data than in its visualization -- that is, if your
main objective is to explore your data rather
than create animated and interactive charts and
diagrams with it, and you only need a handful
of basic, solid graph types -- then consider
Recline.js. It provides tools for getting your data
into its library from numerous sources, and it
provides routines for querying and analyzing
the data once it’s there.
But for sheer panache, D3 is tough to beat.
The variety and beauty of the graphics exhib-
ited on the D3 website is simply dazzling. And
because D3 uses existing DOM objects and
Web browser infrastructure to work its magic,
if you’re already comfortable with JavaScript
(particularly if you use jQuery extensively), then
you’ll probably pick D3 up quite quickly. Even if
you’re not a JavaScript pro, the sheer volume of
available examples means that you can probably
cut and paste together what you need. n
Rick Grehan is contributing editor of the Info-
World Test Center.
The Recline.js Data Explorer lets you import data into a Recline.js grid Dataset. You can select fields from the grid for display in various chart types. Here, weight data from Allen Downy’s book “Think Stats” is shown plotted in a bar chart.
Recline.js can display timeline data (bottom), coupled map view data (right), and other basic chart types.

Deep Dive
InfoWorld.com DEEP DIVE SERIES 1 6
With its asm.js project, Mozilla is promoting a subset of
JavaScript intended to improve Web application performance and
extend C and C++ applications to the Web.
Asm.js can be used as a low-level, efficient target language for
compilers, according to the asm.js specification. Mozilla’s goal has
been to provide a high-performance target for applications written
in low-level languages like C/C++, said Luke Wagner, a software
engineer at Mozilla. By itself, asm.js does not make existing hand-
written JavaScript faster, he said. “However, Web developers are
very creative, and we expect them do a lot more with asm.js than
just generation from C/C++.” The Emscripten tool can compile C
and C++ applications to asm.js, thus making them run faster.
“The key [to as.js] is a simple formal definition of the high-
performance ‘sweet spot,’” Wagner said. “This enables asm.
js-generators like Emscripten, Mandreel, LLJS, and others to
get a hard confirmation that they hit the spot. It also allows
the browser’s JavaScript engine to more easily and predictably
perform aggressive optimization.” Existing JavaScript engines can
optimize this subset of JavaScript; asm.js proponents have already
seen Firefox and Chrome achieve large speed-ups in a short time,
said Wagner.
While asm.js has been cited for its usefulness in game devel-
opment, enterprise applications also can benefit from it, JavaScript blogger Axel Rauschmayer said
at the O’Reilly Fluent conference in San Francisco this week. He cites two main advantages of asm.js.
“Advantage number 1, you get to compile existing C and C++ code – and there’s a lot of that code
out there. You can compile it and run it very fast on the Web,” Rauschmayer said. “The second advan-
tage is that it’s a neat compilation target for languages that are not JavaScript. You can more easily
compile some languages so that they’ll run on the Web platform and they’ll run very fast.”
Proponents of asm.js have planned additional Web APIs for compiling to asm.js in background
threads and to store results of compilation offline. This would improve startup in future application
loads. n
Paul Krill is an editor at large at InfoWorld, focusing on coverage of application development (desktop
and mobile) and core Web technologies such as HTML5, Java, and Flash.
C and C++ apps get Web boost from a JavaScript subset that allows Web browsers to better perform optimizationBY PAUL KRILL
Mozilla’s asm.js uses JavaScript to improve Web performance
JavaS c r ip t