Embed Size (px)
Citation preview

The Twelfth Five-Year Plan for Economic and Social Development
and the Macroeconomic Outlook
Lawrence J. Lau, Ph. D.Chairman, CIC International (Hong Kong) Co., Limited
Ralph and Claire Landau Professor of Economics, The Chinese Univ. of Hong Kongand
Kwoh-Ting Li Professor in Economic Development, Emeritus, Stanford University
The Ongoing Transformation of China’s Growth PatternAcademic Summit: China Development Forum 2011
Beijing, 19 March 2011
Tel: (852)3710-6888; Fax: (852)2104-6938Email: [email protected]; WebPages: www.igef.cuhk.edu.hk/ljl

Lawrence J. Lau 2
Outline
The Twelfth Five-Year Plan for National Economic and Social Development
The Macroeconomic Outlook
Concluding Remarks
Lawrence J. Lau 3
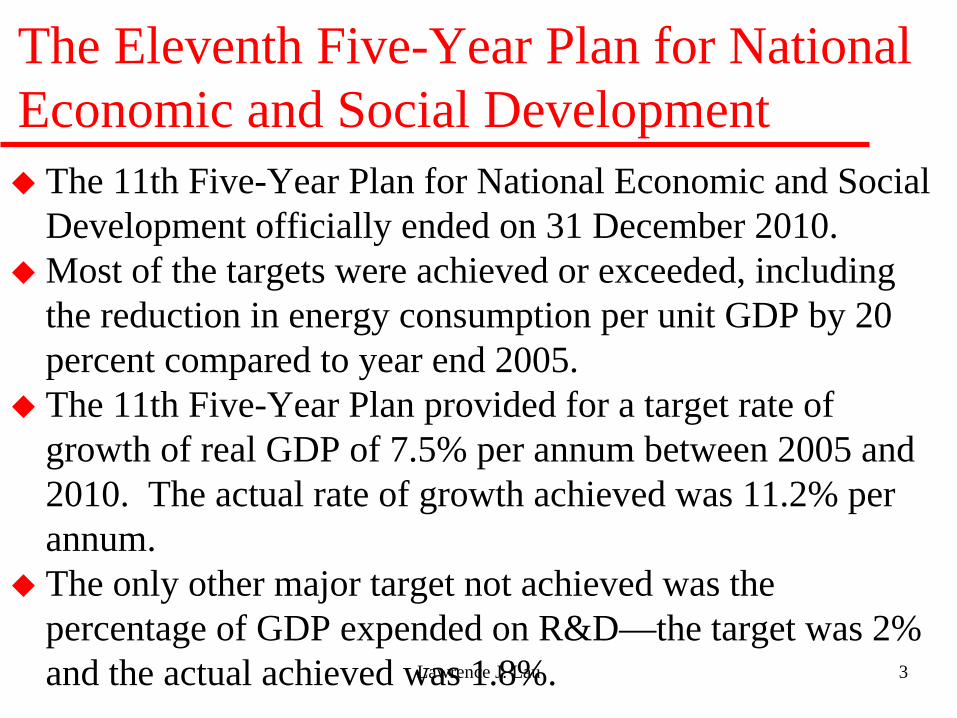
The Eleventh Five-Year Plan for National Economic and Social Development
The 11th Five-Year Plan for National Economic and Social Development officially ended on 31 December 2010.
Most of the targets were achieved or exceeded, including the reduction in energy consumption per unit GDP by 20 percent compared to year end 2005.
The 11th Five-Year Plan provided for a target rate of growth of real GDP of 7.5% per annum between 2005 and 2010. The actual rate of growth achieved was 11.2% per annum.
The only other major target not achieved was the percentage of GDP expended on R&D—the target was 2% and the actual achieved was 1.8%.

Lawrence J. Lau 4
The Twelfth Five-Year Plan for National Economic and Social Development
The Twelfth Five-Year Plan for National Economic and Social Development was approved by the National People’s Congress a week ago. It is mostly an indicative plan rather than a mandatory plan.
The most remarkable feature was that the target growth rate was lowered from 7.5% per annum of the 11th Five- Year Plan to 7% per annum. I am sure that this target will be exceeded, just as the target was exceeded in the last Plan. However, what the reduction in the target growth rate signals is the determination of the Chinese Government to de-emphasise quantitative economic growth and to focus on the quality of the economic growth.

Lawrence J. Lau 5
The Twelfth Five-Year Plan for National Economic and Social Development
The Plan provides for increased expenditures for education and healthcare, especially in the rural regions, environmental preservation and protection, and air and water pollution control. It also has mandatory targets for improvement in energy efficiency and reduction in carbon emission.
It also provides for improvements in the income distribution through taxation, transfer payments and targeted government expenditures on education and health care.

Lawrence J. Lau 6
The Twelfth Five-Year Plan for National Economic and Social Development
One principal theme of the Twelfth Five-Year Plan is the transformation in the mode of Chinese economic development—firstly, from export-oriented to domestic demand-oriented and secondly, from input-driven to technical progress-driven or innovation-driven.
The Plan aims at essentially balanced international trade, and I believe it is achievable.

Lawrence J. Lau 7
The Twelfth Five-Year Plan for National Economic and Social Development
While many problems have arisen in the Chinese economy within the past decade— for example, income disparity, environmental degradation, inadequate infrastructure and corruption—it is fair to say that everyone has benefited from the economic reform and opening since 1978, albeit to varying degrees, and few want to return to the central planning days.
The Chinese Government leaders have also demonstrated their ability to confront important challenges and solve difficult problems.
China is one of the very few socialist countries that have made a smooth transition from a centrally planned to a market economy. It is a model for other transition economies such as Vietnam and potential transition economies such as Cuba, Laos, and North Korea.

Lawrence J. Lau 8
The Macroeconomic Outlook
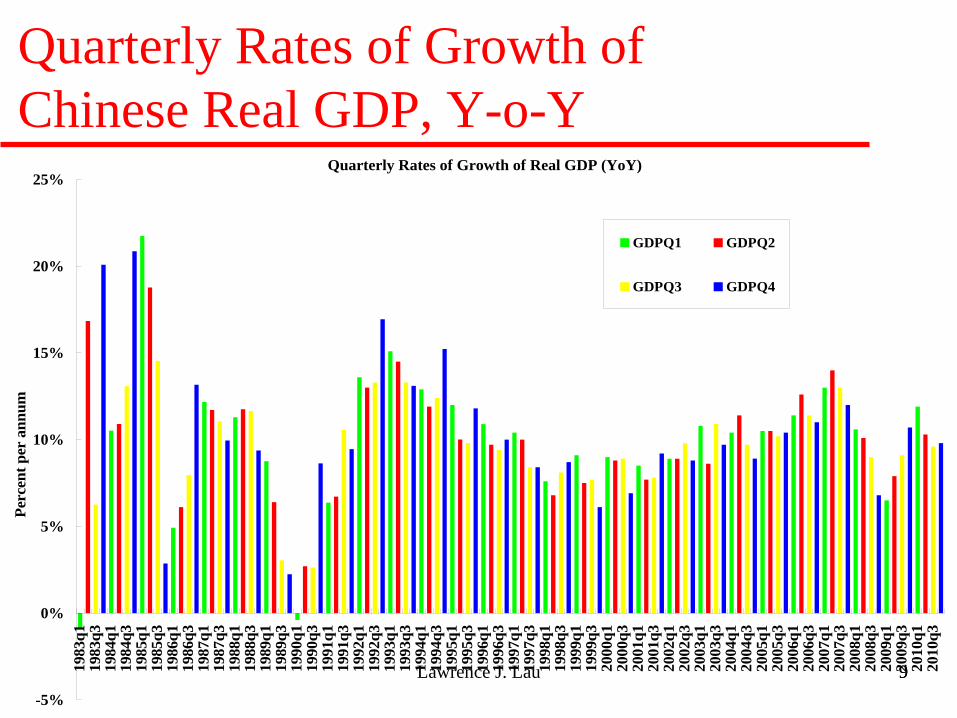
The Chinese economy grew 9.1% in 2009 and approximately 10.3% in 2010 even as the European and U.S. economies remained in recession.
The outlook is that there will be a gradual slowdown of the economy in 2011, to perhaps around 8%, which is actually a positive development for the Chinese economy.
While this may seem like a significant slowdown from 10.3%, but there are reasons to believe that the impact of the slowdown on Chinese employment is not that severe.
Lawrence J. Lau 99
Quarterly Rates of Growth of Chinese Real GDP, Y-o-Y
Quarterly Rates of Growth of Real GDP (YoY)
-5%
0%
5%
10%
15%
20%
25%
1983
q119
83q3
1984
q119
84q3
1985
q119
85q3
1986
q119
86q3
1987
q119
87q3
1988
q119
88q3
1989
q119
89q3
1990
q119
90q3
1991
q119
91q3
1992
q119
92q3
1993
q119
93q3
1994
q119
94q3
1995
q119
95q3
1996
q119
96q3
1997
q119
97q3
1998
q119
98q3
1999
q119
99q3
2000
q120
00q3
2001
q120
01q3
2002
q120
02q3
2003
q120
03q3
2004
q120
04q3
2005
q120
05q3
2006
q120
06q3
2007
q120
07q3
2008
q120
08q3
2009
q120
09q3
2010
q120
10q3
Perc
ent p
er a
nnum
GDPQ1 GDPQ2
GDPQ3 GDPQ4
Lawrence J. Lau 10
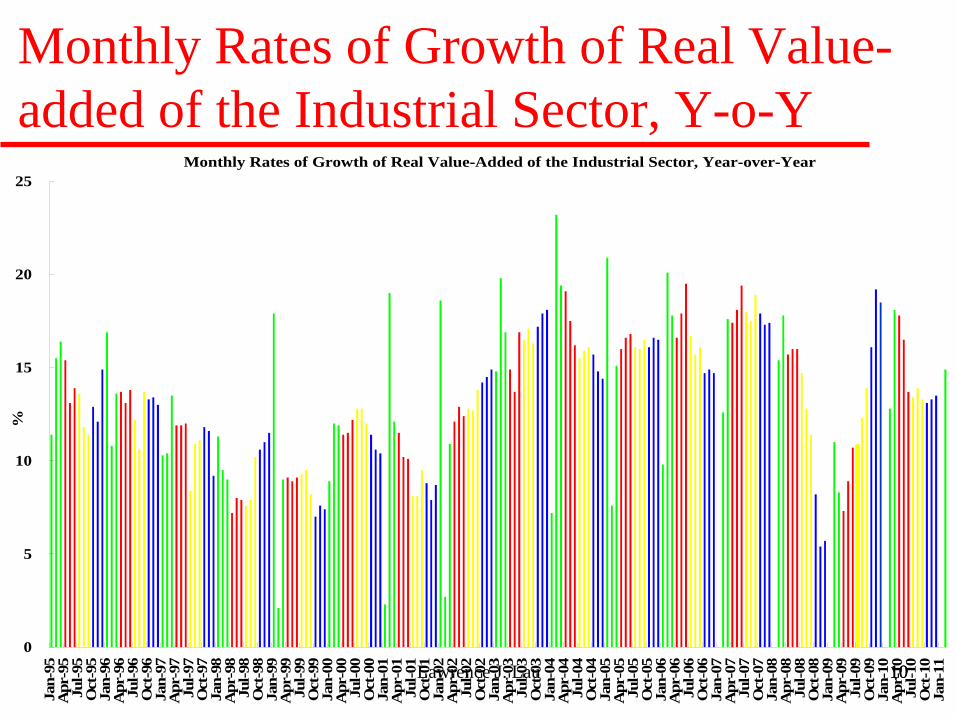
Monthly Rates of Growth of Real Value- added of the Industrial Sector, Y-o-Y
10
Monthly Rates of Growth of Real Value-Added of the Industrial Sector, Year-over-Year
0
5
10
15
20
25
Jan-
95A
pr-9
5Ju
l-95
Oct
-95
Jan-
96A
pr-9
6Ju
l-96
Oct
-96
Jan-
97A
pr-9
7Ju
l-97
Oct
-97
Jan-
98A
pr-9
8Ju
l-98
Oct
-98
Jan-
99A
pr-9
9Ju
l-99
Oct
-99
Jan-
00A
pr-0
0Ju
l-00
Oct
-00
Jan-
01A
pr-0
1Ju
l-01
Oct
-01
Jan-
02A
pr-0
2Ju
l-02
Oct
-02
Jan-
03A
pr-0
3Ju
l-03
Oct
-03
Jan-
04A
pr-0
4Ju
l-04
Oct
-04
Jan-
05A
pr-0
5Ju
l-05
Oct
-05
Jan-
06A
pr-0
6Ju
l-06
Oct
-06
Jan-
07A
pr-0
7Ju
l-07
Oct
-07
Jan-
08A
pr-0
8Ju
l-08
Oct
-08
Jan-
09A
pr-0
9Ju
l-09
Oct
-09
Jan-
10A
pr-1
0Ju
l-10
Oct
-10
Jan-
11
%

Lawrence J. Lau 1111
Monthly Rates of Growth of Chinese Fixed Assets Investment, Y-o-Y
Monthly Rates of Growth of Fixed Investment since 2000, Year-over-Year
0
10
20
30
40
50
60
Jan-
00A
pr-0
0Ju
l-00
Oct
-00
Jan-
01A
pr-0
1Ju
l-01
Oct
-01
Jan-
02A
pr-0
2Ju
l-02
Oct
-02
Jan-
03A
pr-0
3Ju
l-03
Oct
-03
Jan-
04A
pr-0
4Ju
l-04
Oct
-04
Jan-
05A
pr-0
5Ju
l-05
Oct
-05
Jan-
06A
pr-0
6Ju
l-06
Oct
-06
Jan-
07A
pr-0
7Ju
l-07
Oct
-07
Jan-
08A
pr-0
8Ju
l-08
Oct
-08
Jan-
09A
pr-0
9Ju
l-09
Oct
-09
Jan-
10A
pr-1
0Ju
l-10
Oct
-10
Jan-
11
Perc
ent

Lawrence J. Lau 1212
Monthly Rates of Growth of Chinese Real Retail Sales, Y-o-Y
Monthly Rates of Growth of Real Retail Sales since 2000, Year-over-Year
0
5
10
15
20
25
30
35
Jan-
00A
pr-0
0Ju
l-00
Oct
-00
Jan-
01A
pr-0
1Ju
l-01
Oct
-01
Jan-
02A
pr-0
2Ju
l-02
Oct
-02
Jan-
03A
pr-0
3Ju
l-03
Oct
-03
Jan-
04A
pr-0
4Ju
l-04
Oct
-04
Jan-
05A
pr-0
5Ju
l-05
Oct
-05
Jan-
06A
pr-0
6Ju
l-06
Oct
-06
Jan-
07A
pr-0
7Ju
l-07
Oct
-07
Jan-
08A
pr-0
8Ju
l-08
Oct
-08
Jan-
09A
pr-0
9Ju
l-09
Oct
-09
Jan-
10A
pr-1
0Ju
l-10
Oct
-10
Jan-
11
Perc
ent

Lawrence J. Lau 13
The Macroeconomic Outlook
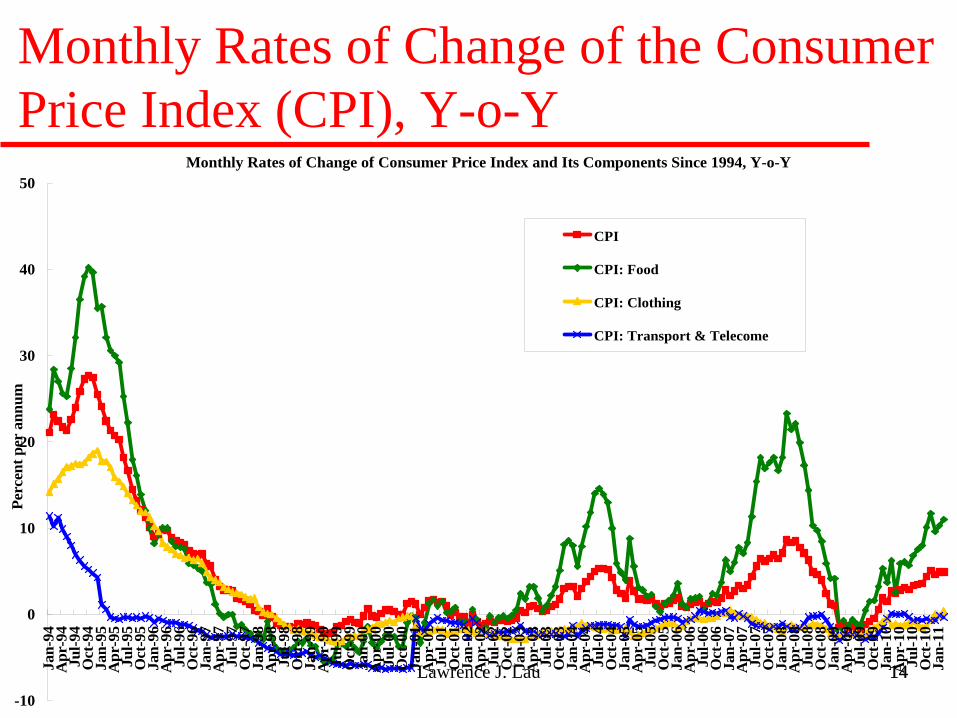
The rate of inflation of goods and services, as measured by the consumer price index, reached a peak of 5.1% year-over-year in November, 2010.
For 2010 as a whole, the rate of inflation exceeded the objective of the Chinese Government of 3% slightly, at 3.3%.
However, the bulk of the increase in the consumer price index (approximately 70%) was caused by the increase in food prices (principally vegetables), due mostly to weather and not to monetary factors. The core rate of inflation, that is, the rate of inflation net of the changes in the prices of agricultural and energy goods, has remained relatively tame at the 1-1.5% per annum level, as has been the case in the past few years.
Moreover, given the excess production capacity in many key industries, such as steel, cement, and glass, it is unlikely that there will be much inflation in the prices of goods.
Lawrence J. Lau 1414
Monthly Rates of Change of the Consumer Price Index (CPI), Y-o-Y
Monthly Rates of Change of Consumer Price Index and Its Components Since 1994, Y-o-Y
-10
0
10
20
30
40
50
Jan-
94A
pr-9
4Ju
l-94
Oct
-94
Jan-
95A
pr-9
5Ju
l-95
Oct
-95
Jan-
96A
pr-9
6Ju
l-96
Oct
-96
Jan-
97A
pr-9
7Ju
l-97
Oct
-97
Jan-
98A
pr-9
8Ju
l-98
Oct
-98
Jan-
99A
pr-9
9Ju
l-99
Oct
-99
Jan-
00A
pr-0
0Ju
l-00
Oct
-00
Jan-
01A
pr-0
1Ju
l-01
Oct
-01
Jan-
02A
pr-0
2Ju
l-02
Oct
-02
Jan-
03A
pr-0
3Ju
l-03
Oct
-03
Jan-
04A
pr-0
4Ju
l-04
Oct
-04
Jan-
05A
pr-0
5Ju
l-05
Oct
-05
Jan-
06A
pr-0
6Ju
l-06
Oct
-06
Jan-
07A
pr-0
7Ju
l-07
Oct
-07
Jan-
08A
pr-0
8Ju
l-08
Oct
-08
Jan-
09A
pr-0
9Ju
l-09
Oct
-09
Jan-
10A
pr-1
0Ju
l-10
Oct
-10
Jan-
11
Perc
ent p
er a
nnum
CPI
CPI: Food
CPI: Clothing
CPI: Transport & Telecome
Lawrence J. Lau 1515
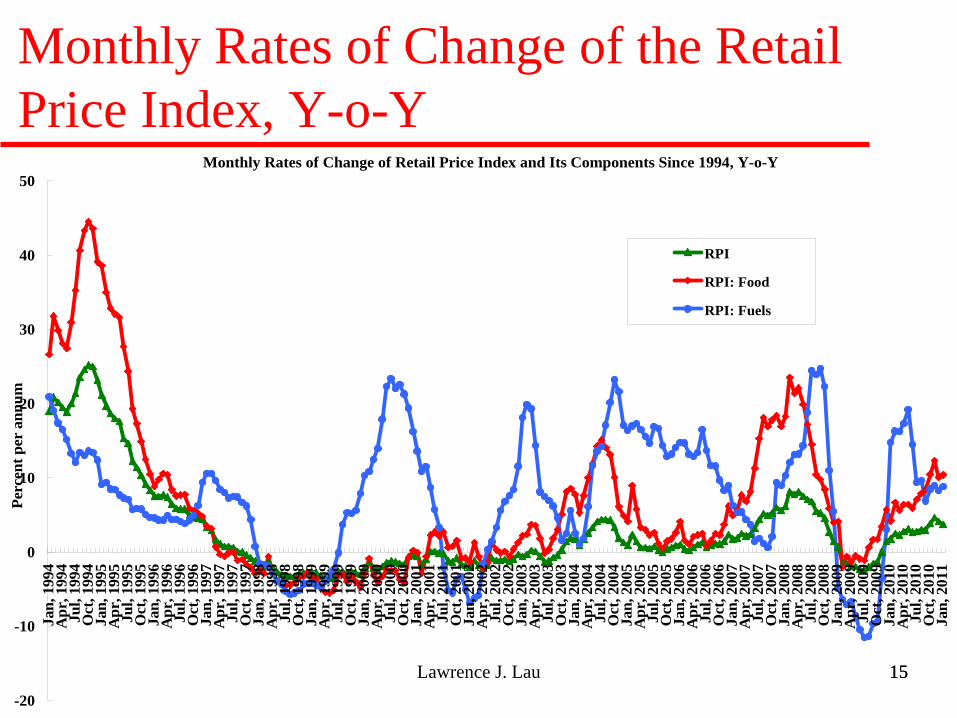
Monthly Rates of Change of the Retail Price Index, Y-o-Y
Monthly Rates of Change of Retail Price Index and Its Components Since 1994, Y-o-Y
-20
-10
0
10
20
30
40
50
Jan,
199
4A
pr, 1
994
Jul,
1994
Oct
, 199
4Ja
n, 1
995
Apr
, 199
5Ju
l, 19
95O
ct, 1
995
Jan,
199
6A
pr, 1
996
Jul,
1996
Oct
, 199
6Ja
n, 1
997
Apr
, 199
7Ju
l, 19
97O
ct, 1
997
Jan,
199
8A
pr, 1
998
Jul,
1998
Oct
, 199
8Ja
n, 1
999
Apr
, 199
9Ju
l, 19
99O
ct, 1
999
Jan,
200
0A
pr, 2
000
Jul,
2000
Oct
, 200
0Ja
n, 2
001
Apr
, 200
1Ju
l, 20
01O
ct, 2
001
Jan,
200
2A
pr, 2
002
Jul,
2002
Oct
, 200
2Ja
n, 2
003
Apr
, 200
3Ju
l, 20
03O
ct, 2
003
Jan,
200
4A
pr, 2
004
Jul,
2004
Oct
, 200
4Ja
n, 2
005
Apr
, 200
5Ju
l, 20
05O
ct, 2
005
Jan,
200
6A
pr, 2
006
Jul,
2006
Oct
, 200
6Ja
n, 2
007
Apr
, 200
7Ju
l, 20
07O
ct, 2
007
Jan,
200
8A
pr, 2
008
Jul,
2008
Oct
, 200
8Ja
n, 2
009
Apr
, 200
9Ju
l, 20
09O
ct, 2
009
Jan,
201
0A
pr, 2
010
Jul,
2010
Oct
, 201
0Ja
n, 2
011
Perc
ent p
er a
nnum
RPI
RPI: Food
RPI: Fuels

Lawrence J. Lau 1616
The Rates of Growth of Money Supply and Loans, Year-over-Year
The Rates of Growth of Money Supply and Loans, Year-over-Year
0
5
10
15
20
25
30
35
40
45
Jan-
01A
pr-0
1Ju
l-01
Oct
-01
Jan-
02A
pr-0
2Ju
l-02
Oct
-02
Jan-
03A
pr-0
3Ju
l-03
Oct
-03
Jan-
04A
pr-0
4Ju
l-04
Oct
-04
Jan-
05A
pr-0
5Ju
l-05
Oct
-05
Jan-
06A
pr-0
6Ju
l-06
Oct
-06
Jan-
07A
pr-0
7Ju
l-07
Oct
-07
Jan-
08A
pr-0
8Ju
l-08
Oct
-08
Jan-
09A
pr-0
9Ju
l-09
Oct
-09
Jan-
10A
pr-1
0Ju
l-10
Oct
-10
Jan-
11
Perc
ent
Money Supply (M1)
Money Supply (M2)
Loans

Lawrence J. Lau 17
The Macroeconomic Outlook
However, there has been significant inflation in the prices of assets such as real estate in the last year or two due to the implementation of the economic stimulus package and the significant increases in the rates of growth of money supply and commercial bank credit.
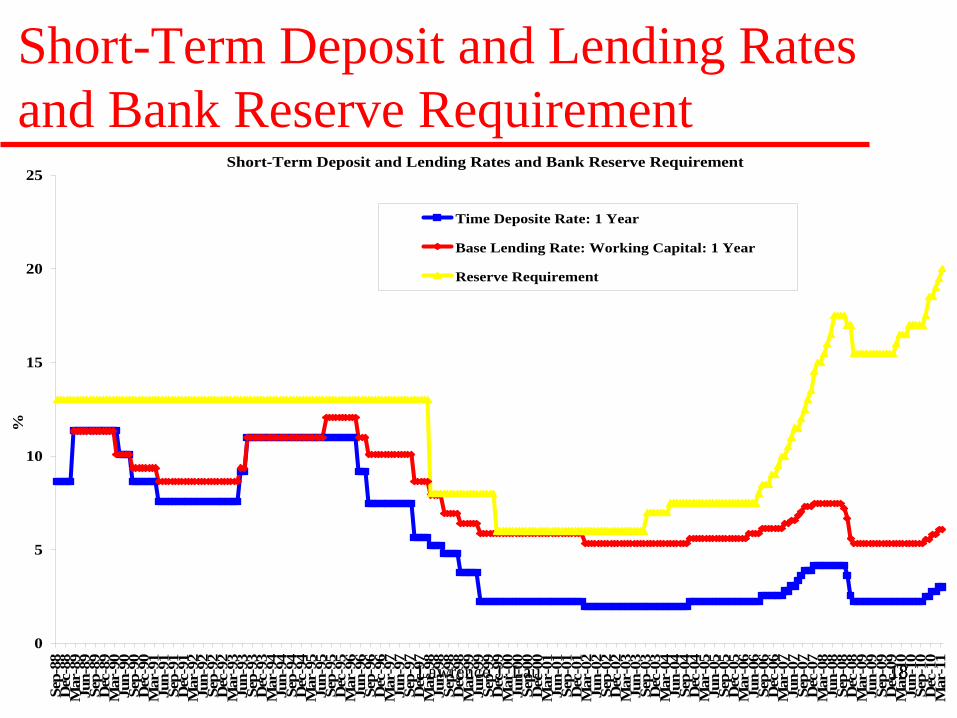
Measures have been taken recently to contain the asset price bubble. State-owned enterprises that have not been explicitly authorised are now forbidden to invest in real estate. Bank lending rules have also been tightened so as to discourage the purchases of more than one residential unit by a single household. Recently, the People’s Bank of China, the central bank, has increased the rate of interest and also the reserve requirement ratio a few times.
Lawrence J. Lau 1818
Short-Term Deposit and Lending Rates and Bank Reserve Requirement
Short-Term Deposit and Lending Rates and Bank Reserve Requirement
0
5
10
15
20
25
Sep-
88D
ec-8
8M
ar-8
9Ju
n-89
Sep-
89D
ec-8
9M
ar-9
0Ju
n-90
Sep-
90D
ec-9
0M
ar-9
1Ju
n-91
Sep-
91D
ec-9
1M
ar-9
2Ju
n-92
Sep-
92D
ec-9
2M
ar-9
3Ju
n-93
Sep-
93D
ec-9
3M
ar-9
4Ju
n-94
Sep-
94D
ec-9
4M
ar-9
5Ju
n-95
Sep-
95D
ec-9
5M
ar-9
6Ju
n-96
Sep-
96D
ec-9
6M
ar-9
7Ju
n-97
Sep-
97D
ec-9
7M
ar-9
8Ju
n-98
Sep-
98D
ec-9
8M
ar-9
9Ju
n-99
Sep-
99D
ec-9
9M
ar-0
0Ju
n-00
Sep-
00D
ec-0
0M
ar-0
1Ju
n-01
Sep-
01D
ec-0
1M
ar-0
2Ju
n-02
Sep-
02D
ec-0
2M
ar-0
3Ju
n-03
Sep-
03D
ec-0
3M
ar-0
4Ju
n-04
Sep-
04D
ec-0
4M
ar-0
5Ju
n-05
Sep-
05D
ec-0
5M
ar-0
6Ju
n-06
Sep-
06D
ec-0
6M
ar-0
7Ju
n-07
Sep-
07D
ec-0
7M
ar-0
8Ju
n-08
Sep-
08D
ec-0
8M
ar-0
9Ju
n-09
Sep-
09D
ec-0
9M
ar-1
0Ju
n-10
Sep-
10D
ec-1
0M
ar-1
1
%
Time Deposite Rate: 1 Year
Base Lending Rate: Working Capital: 1 Year
Reserve Requirement

Lawrence J. Lau 19
The Macroeconomic Outlook
There is not much any central bank can do about agricultural prices. No head of a central bank anywhere in the World has been able to control the weather.
The key in reining in asset prices, especially real estate prices, is to assure that there is a continuing dependable and steady supply going forward. Only the expectation of supply availability can change price expectations. The Government must therefore try to create the expectation of regular increases of actual and potential supply through its policy and its actual behaviour.

Lawrence J. Lau 20
The Macroeconomic Outlook
If the public expects that residential units will be just as available next year, and hence concludes that there is no need to rush out to buy something now, the real estate price bubble can be more readily contained.
Other instruments in addition to the rate of interest include the strict control, perhaps even prohibition, of financing of any non-owner-occupied residential unit, and increasing the equity (down payment) ratio. The introduction of a property tax as a source of revenue for local governments will also help to discourage speculation as well as reduce the dependence of local governments on revenue from the sale of land leases and hence on maintaining high and rising expectations of land prices.

Lawrence J. Lau 21
The Macroeconomic Outlook
Even with increases in the levels of minimum wage rates in the different provinces, regions and municipalities, the real wage rate of unskilled, entry-level labour has basically remained stable and is expected to be stable for a long time because of the continuing existence of significant surplus labour in the Chinese economy.
However, there is upward pressure on the real wage rates of skilled and experienced labour, which is actually in short supply, especially as Chinese enterprises move up the value-added chain. The recent high-profile wage settlements made by Honda and Foxconn plants in China provided for wage increases of 24 percent and 30 percent respectively.
But given the trend of rapid expansion of Chinese tertiary education in recent years, with 6 million new graduates projected annually, the increase in the real wage rate of even skilled labour is likely to be relatively limited going forward.

Lawrence J. Lau 22
The Relative Unimportance of International Trade
There is a common mis-impression that the Chinese economy is highly dependent on exports, and in particular, on its export surpluses, as a source of growth.
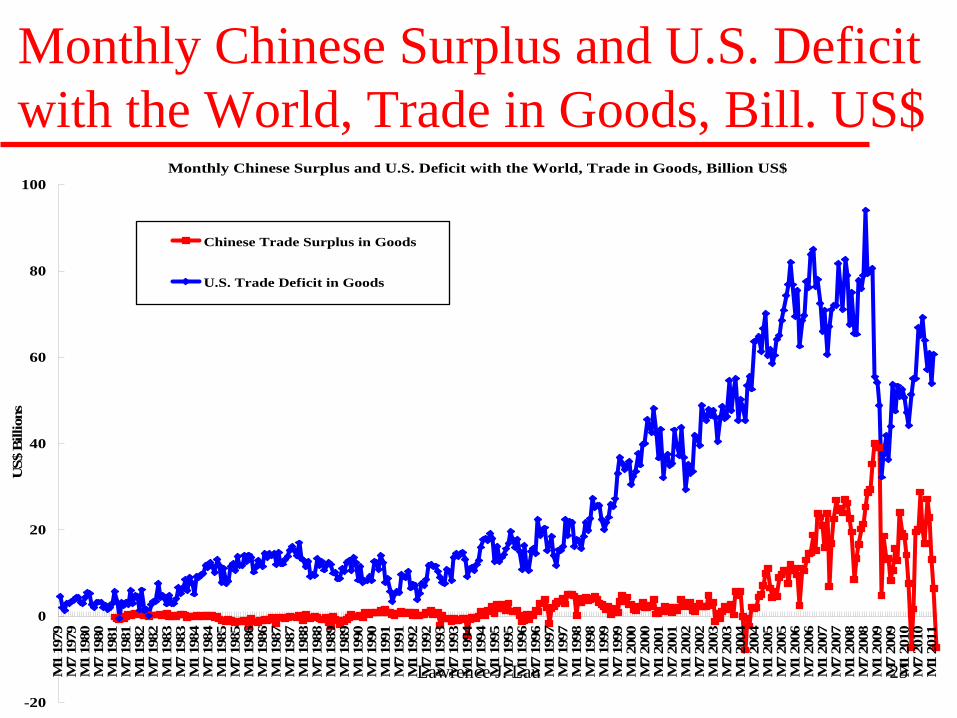
The facts are that China only began to have a significant trade surplus vis-a-vis the World in 2005, whereas the Chinese economy has been growing at an average real rate of approximately 10 percent per annum since 1978.
It should therefore be clear that the trade surpluses could not have been an important source of growth for the Chinese economy during the past three decades. Chinese economic growth does not depend on Chinese trade surpluses.

Lawrence J. Lau 23
The Trade Surplus has been Declining
The Chinese trade surplus has continued to decline, especially as a percentage of GDP. This trend is expected to continue. I expect Chinese international trade vis-à-vis the whole world to be essentially balanced in a couple of years, without necessarily any large adjustments in the Yuan exchange rate.
One reason that this is possible is the gradual closing of the savings-investment gap in China, as well as the substantial real appreciation of the Yuan versus the U.S.$ that has occurred since mid-2005, to the tune of 25%.

Lawrence J. Lau 2424
Chinese Monthly Exports, Imports and Trade Balance, US$
Chinese Monthly Exports, Imports and Trade Balance of Goods, in U.S. Dollars
-10
0
10
20
30
40
50
60
70
80
90
100
110
120
130
140
150
160
Jan-
92A
pr-9
2Ju
l-92
Oct
-92
Jan-
93A
pr-9
3Ju
l-93
Oct
-93
Jan-
94A
pr-9
4Ju
l-94
Oct
-94
Jan-
95A
pr-9
5Ju
l-95
Oct
-95
Jan-
96A
pr-9
6Ju
l-96
Oct
-96
Jan-
97A
pr-9
7Ju
l-97
Oct
-97
Jan-
98A
pr-9
8Ju
l-98
Oct
-98
Jan-
99A
pr-9
9Ju
l-99
Oct
-99
Jan-
00A
pr-0
0Ju
l-00
Oct
-00
Jan-
01A
pr-0
1Ju
l-01
Oct
-01
Jan-
02A
pr-0
2Ju
l-02
Oct
-02
Jan-
03A
pr-0
3Ju
l-03
Oct
-03
Jan-
04A
pr-0
4Ju
l-04
Oct
-04
Jan-
05A
pr-0
5Ju
l-05
Oct
-05
Jan-
06A
pr-0
6Ju
l-06
Oct
-06
Jan-
07A
pr-0
7Ju
l-07
Oct
-07
Jan-
08A
pr-0
8Ju
l-08
Oct
-08
Jan-
09A
pr-0
9Ju
l-09
Oct
-09
Jan-
10A
pr-1
0Ju
l-10
Oct
-10
Jan-
11
USD
bill
ions Exports, fob
Imports, cif
Trade Balance
Lawrence J. Lau 25
Monthly Chinese Surplus and U.S. Deficit with the World, Trade in Goods, Bill. US$
Monthly Chinese Surplus and U.S. Deficit with the World, Trade in Goods, Billion US$
-20
0
20
40
60
80
100
M1
1979
M7
1979
M1
1980
M7
1980
M1
1981
M7
1981
M1
1982
M7
1982
M1
1983
M7
1983
M1
1984
M7
1984
M1
1985
M7
1985
M1
1986
M7
1986
M1
1987
M7
1987
M1
1988
M7
1988
M1
1989
M7
1989
M1
1990
M7
1990
M1
1991
M7
1991
M1
1992
M7
1992
M1
1993
M7
1993
M1
1994
M7
1994
M1
1995
M7
1995
M1
1996
M7
1996
M1
1997
M7
1997
M1
1998
M7
1998
M1
1999
M7
1999
M1
2000
M7
2000
M1
2001
M7
2001
M1
2002
M7
2002
M1
2003
M7
2003
M1
2004
M7
2004
M1
2005
M7
2005
M1
2006
M7
2006
M1
2007
M7
2007
M1
2008
M7
2008
M1
2009
M7
2009
M1
2010
M7
2010
M1
2011
US$
Bill
ions
Chinese Trade Surplus in Goods
U.S. Trade Deficit in Goods

Lawrence J. Lau 26
Chinese National Savings and Gross Domestic Investment as Percents of GDP
Chinese National Savings and Gross Domestic Investment as a Percent of GDP since 1952
0
10
20
30
40
50
60
1952
1953
1954
1955
1956
1957
1958
1959
1960
1961
1962
1963
1964
1965
1966
1967
1968
1969
1970
1971
1972
1973
1974
1975
1976
1977
1978
1979
1980
1981
1982
1983
1984
1985
1986
1987
1988
1989
1990
1991
1992
1993
1994
1995
1996
1997
1998
1999
2000
2001
2002
2003
2004
2005
2006
2007
2008
2009
Perc
ent
Savings Rate
Investment Rate

Lawrence J. Lau 27
Case-Shiller U.S. Home Price Index, Chinese Trade Surplus & U.S. Trade Deficit, Bill. US$
Case-Shiller U.S. Home Price Index, Chinese Trade Surplus and U.S. Trade Deficit
60
80
100
120
140
160
180
200
220
Jan-
00A
pr-0
0Ju
l-00
Oct
-00
Jan-
01A
pr-0
1Ju
l-01
Oct
-01
Jan-
02A
pr-0
2Ju
l-02
Oct
-02
Jan-
03A
pr-0
3Ju
l-03
Oct
-03
Jan-
04A
pr-0
4Ju
l-04
Oct
-04
Jan-
05A
pr-0
5Ju
l-05
Oct
-05
Jan-
06A
pr-0
6Ju
l-06
Oct
-06
Jan-
07A
pr-0
7Ju
l-07
Oct
-07
Jan-
08A
pr-0
8Ju
l-08
Oct
-08
Jan-
09A
pr-0
9Ju
l-09
Oct
-09
Jan-
10A
pr-1
0Ju
l-10
Oct
-10
Jan-
11
2000
Q1=
100
-10
0
10
20
30
40
50
60
70
80
90
100
USD
bill
ions
Case-Shiller Home Price Index
U.S. Trade Deficit with the World
Chinese Trade Surplus with the World

Lawrence J. Lau 2828
The Nominal and Real Yuan/US$ Exchange Rates
The Nominal and Real Yuan/US$ Exchange Rates (1994 prices)
4.5
5.0
5.5
6.0
6.5
7.0
7.5
8.0
8.5
9.0
Jan-
94A
pr-9
4Ju
l-94
Oct
-94
Jan-
95A
pr-9
5Ju
l-95
Oct
-95
Jan-
96A
pr-9
6Ju
l-96
Oct
-96
Jan-
97A
pr-9
7Ju
l-97
Oct
-97
Jan-
98A
pr-9
8Ju
l-98
Oct
-98
Jan-
99A
pr-9
9Ju
l-99
Oct
-99
Jan-
00A
pr-0
0Ju
l-00
Oct
-00
Jan-
01A
pr-0
1Ju
l-01
Oct
-01
Jan-
02A
pr-0
2Ju
l-02
Oct
-02
Jan-
03A
pr-0
3Ju
l-03
Oct
-03
Jan-
04A
pr-0
4Ju
l-04
Oct
-04
Jan-
05A
pr-0
5Ju
l-05
Oct
-05
Jan-
06A
pr-0
6Ju
l-06
Oct
-06
Jan-
07A
pr-0
7Ju
l-07
Oct
-07
Jan-
08A
pr-0
8Ju
l-08
Oct
-08
Jan-
09A
pr-0
9Ju
l-09
Oct
-09
Jan-
10A
pr-1
0Ju
l-10
Oct
-10
Jan-
11
Yua
n pe
r U
.S. D
olla
r The Nominal Exchange Rate, Yuan/US$
The Real Exchange Rate, Yuan/US$

Lawrence J. Lau 29
The Relative Unimportance of International Trade
Chinese trade surplus as a percent of Chinese GDP fluctuated between -4.5 percent and 4.5 percent between 1982 and 2004 with an average of less than 2 percent of GDP. It then rose to almost 9 percent in 2007. It has since declined significantly and is around 3 percent. It is expected to continue to decline over the next few years.

Lawrence J. Lau 30
Chinese Trade Balance of Goods & Services as a Percent of GDP, 1982-
Chinese Trade Balance of Goods and Services as a Percent of GDP
-6
-4
-2
0
2
4
6
8
10
1982
1983
1984
1985
1986
1987
1988
1989
1990
1991
1992
1993
1994
1995
1996
1997
1998
1999
2000
2001
2002
2003
2004
2005
2006
2007
2008
2009
Perc
ent

Lawrence J. Lau 31
The Relative Unimportance of International Trade
Chinese exports as a ratio of GDP rose steadily beginning in 1978 and reached a peak of almost 40 percent in 2006 and then began to decline to approximately 25 percent in 2009.
While this ratio appears large, it is not when compared to Hong Kong, Singapore, South Korea and Taiwan, where exports are more than 100 percent of the respective GDPs.
And the Chinese Exports/GDP ratio actually exaggerates the importance of exports in the Chinese economy because it fails to take into account the low domestic value-added content of Chinese exports.

Lawrence J. Lau 32
Chinese Exports of Goods and Services as a Percent of GDP, 1970-present
Chinese Exports of Goods and Services as a Ratio of GDP since 1970
0
5
10
15
20
25
30
35
40
45
1970
1971
1972
1973
1974
1975
1976
1977
1978
1979
1980
1981
1982
1983
1984
1985
1986
1987
1988
1989
1990
1991
1992
1993
1994
1995
1996
1997
1998
1999
2000
2001
2002
2003
2004
2005
2006
2007
2008
2009
Perc
ent

Lawrence J. Lau 33
The Relative Unimportance of International Trade
The fact that the Chinese economy has continued to grow at an average rate of approximately 10% per annum since the beginning of the global financial crisis in 2007 is ample proof that the Chinese economy has been at least partially de-coupled from the rest of the World, and in particular, from the United States and Europe, both of which have been and still are mired in economic recession.

Lawrence J. Lau 34
Concluding Remarks
The long-term sustainable sources of Chinese aggregate demand will be internal: household and public consumption, investment in infrastructure, including high- speed inter-urban trains, owner-occupied residential housing, investment in education and health care, urbanisation (building new cities), urban mass-transit systems, environmental protection and preservation, energy conservation and renewable energy, and the green economy.
Consumption will rise, as GDP per capita and wage rate rise and the social safety net is gradually perfected. But savings rate will remain high for a long time.

Lawrence J. Lau 35
Concluding Remarks
International trade will continue to be somewhat important, but not critical, to the growth of the Chinese economy. Exports as a share of Chinese GDP will probably continue to decline over time, as befitting a large, continental economy. Chinese economic growth will be marginally, but not critically, affected by a large decline in its exports, as demonstrated by its experience in the past couple of years as well as during the 1997-1998 East Asian currency crisis. Thus, it will be able to survive even prolonged economic recessions in the European and U.S. economies.

Lawrence J. Lau 36
Concluding Remarks
For 2011, the short-term economic targets are to achieve a rate of growth of 8 percent and a rate of inflation of 4 percent. I am confident that both targets are achievable.