Embed Size (px)
Citation preview

11
Welcome to Presentation of
Twelfth Five Year Plan and Annual Plan Proposal Madhya Pradesh
May 11, 2012

2
2
ACHIEVEMENTS OF ELEVENTH PLAN (ECONOMY)
Targets and Achievement
Sector Target for Growth(1999-00 prices)
Expected Growth(1999-00 prices)*
Expected Growth
(2004-05 prices)(2004-05 base)
Agriculture (Primary) 5.0 % 4.0% 7.17
Industry (Secondary) 10.0 % 11.6% 9.66
Service (Tertiary) 8.0 % 9.6% 11.70
Over all Economy 7.9 % 8.8% 10.02
2*Mid Term Appraisal of Eleventh Plan, PMPSU, SPC, Govt. of MP
3
3
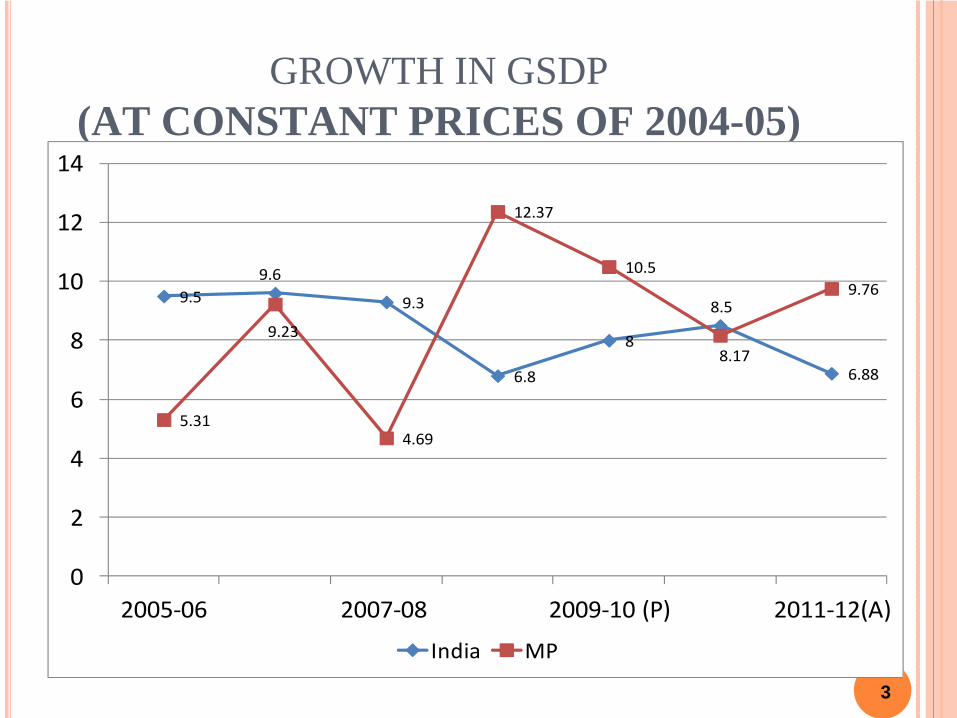
GROWTH IN GSDP (AT CONSTANT PRICES OF 2004-05)
9.59.6
9.3
6.8
8
8.5
6.88
5.31
9.23
4.69
12.37
10.5
8.17
9.76
0
2
4
6
8
10
12
14
2005-06 2007-08 2009-10 (P) 2011-12(A)
India MP3

4
4
GROWTH RATE IN AGRICULTURE (AGRICULTURE, FORESTRY AND FISHING)
(AT 2004-05 PRICE AND 2004-05 BASE)
6.2 5.8
0.11
7
2.52.91
2.35
-1.49
10.2 10.02
2.99
6.47.17
-4
-2
0
2
4
6
8
10
12
2006-07 2007-08 2008-09 2009-10(P) 2010-11(Q) 2011-12(A) XI Plan
India MP
4Source: Press Information Bureau, Govt. of India 31st January 2012 and Directorate of Economic & Statistics, Govt. of MP

5
5
GROWTH RATE IN SECONDARY SECTOR (AT 2004-05 PRICE AND 2004-05 BASE)
12.17
9.67
4.44
8.4
7.16
3.95
6.33
16.71
5.93
17.31
7.7 7.68.38
9.66
0
5
10
15
20
2006-07 2007-08 2008-09 2009-10(P) 2010-11(Q) 2011-12 (A) XI Plan
India MP
5Source: Press Information Bureau, Govt. of India 31st January 2012 and Directorate of Economic & Statistics, Govt. of MP
6
6
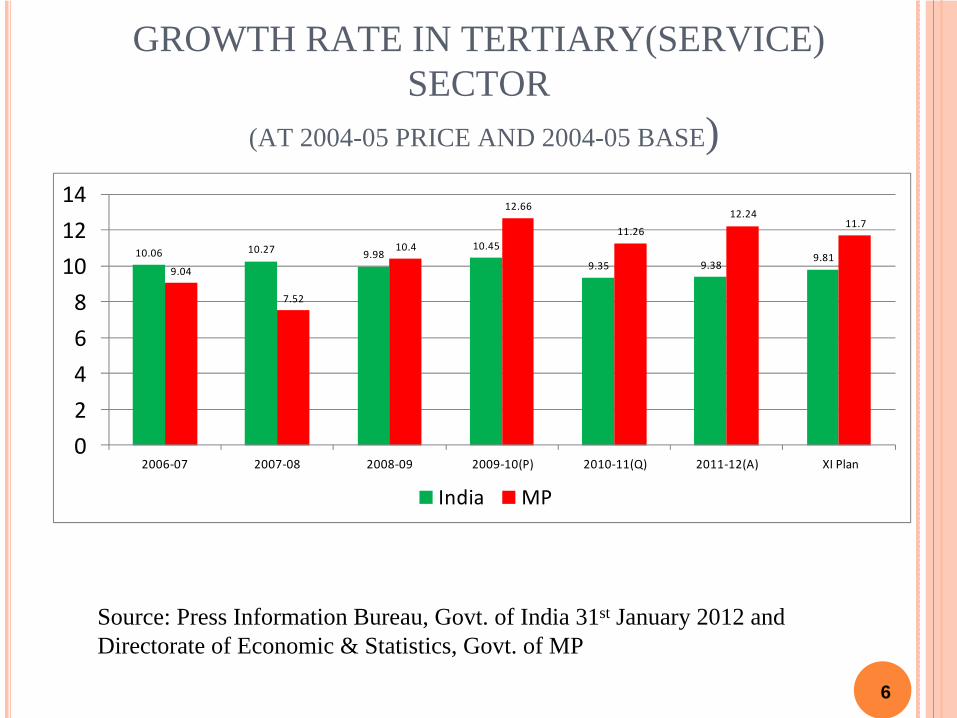
GROWTH RATE IN TERTIARY(SERVICE) SECTOR
(AT 2004-05 PRICE AND 2004-05 BASE)
10.06 10.27 9.9810.45
9.35 9.389.81
9.04
7.52
10.4
12.66
11.2612.24
11.7
02468
101214
2006-07 2007-08 2008-09 2009-10(P) 2010-11(Q) 2011-12(A) XI Plan
India MP
6Source: Press Information Bureau, Govt. of India 31st January 2012 and Directorate of Economic & Statistics, Govt. of MP
7
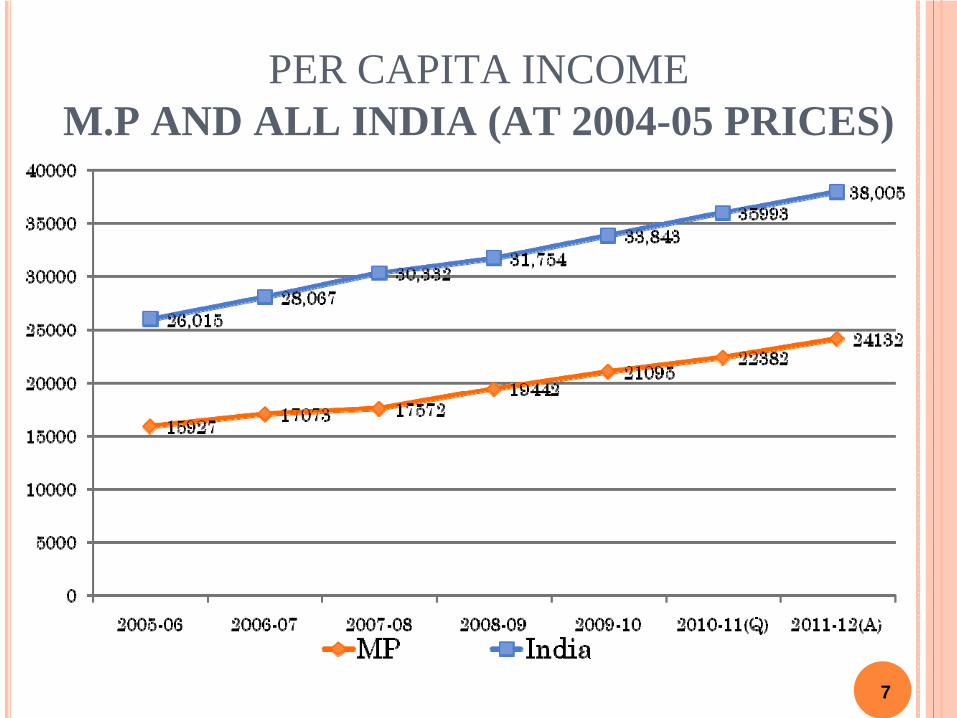
PER CAPITA INCOME M.P AND ALL INDIA (AT 2004-05 PRICES)
7

8
8
TOTAL REVENUE RECEIPT AS % OF GSDP
17.7719
17.0818.24
19.95 20.6
0
5
10
15
20
25
2006-07 2007-08 2008-09 2009-10 2010-11 2011-12
MP
MP8Source: Finance Dept. Govt. of MP

9
9
FISCAL DEFICIT AS % OF GSDP
3.32
2.55
6.046.48
1.951.72
2.262.73
0
1
2
3
4
5
6
7
2006-07 2007-08 2008-09 2009-10
India MP9
Source: Data Book for DCH April 09, 2012 & Finance Dept. Govt. of MP

10
10
OWN TAX REVENUE AS % OF GSDP
8.188.81
7.94
7.077.24 7.446.93
7.61
0
1
2
3
4
5
6
7
8
9
10
2006-07 2007-08 2008-09 2009-10
India MP
10
Source: Data Book for DCH April 09, 2012 & Finance Dept. Govt. of MPFor India Own tax revenue is net of states share

11
11
FISCAL PARAMETERS OF THE STATE
Year Actual 2010-11
Revised Budget
2011-12
Budget Estimates
2012-13
Revenue Surplus as % of GSDP
2.52 2.58 1.89
Fiscal Deficit as % of GSDP
1.94 2.63 2.98
Total Outstanding Debt as % of GSDP
27.79 27.73 28.09
11
Source: DoF, MP

12
SELECTED SECTORAL PERFORMANCES
12

13
13
POVERTY ESTIMATES (M.P AND ALL INDIA)
44.6 45.348.6
37.236.7
29.8
0
10
20
30
40
50
60
Total-MP Total-India
1993-94 2004-05 2009-10
Source: Planning Commission Revised Poverty estimates press release, Planning Commission, Government of India, November 2009 Based on MRP (Mixed Reference Period) and Recent Press Release of Planning Commission.

14
14
LITERACY RATE
14
Data of 1991 pertains to combined Madhya Pradesh and Chhattisgarh

15
15
LITERACY RATE BY GENDER
29.4
58.5
50.3
76.1
60
80.5
0102030405060708090
Female Male
1991 2001 2011
Data of 1991 pertains to combined Madhya Pradesh and Chhattisgarh

16
16
NET ENROLMENT RATIO IN ELEMENTARY CLASSES: MP
16
Source: Department of Education, Govt. of MP

17
17
UPPER PRIMARY LEVEL IN MP AND INDIA
(AS PER FLASH STATISTICS, AS ON 30TH SEPTEMBER 2009,NUEPA)
17

18
TRANSITION RATE FROM UPPER PRIMARY TO SECONDARY LEVEL

19
19
INFANT MORTALITY RATE: MP VERSUS INDIA (DEATHS PER 1000 LIVE BIRTHS)
19

20
20
MATERNAL MORTALITY RATIO (DEATHS PER 100000 LIVE BIRTHS)
MP, 441MP, 407
MP, 379
MP, 335MP, 313
India, 398
India, 327India, 301
India, 254
India, 212
0
50
100
150
200
250
300
350
400
450
500
1997-98 1999-2001 2001-03 2004-06 2007-09
Source: Various SRS reports, office of Registrar General and Census Commissioner, GoI.

21
21
GENERATION CAPACITY (IN MW)
2990.45
842.95
2147.51712.5 1715.85
6418
3724.7
917.2
2807.52371.5 2430.5
216 255
8998
0
1000
2000
3000
4000
5000
6000
7000
8000
9000
10000
MPPGCL Hydel Thermal Hydel (Joint Sector) Central Sector Private Sector Other Sector Total Installed Capacity
As on March2006 As on March 201121
Source: Energy Department, Government of MP

22
22
AGGREGATE TECHNICAL & COMMERCIAL LOSSES
40.75 40.71
39.75
39.21
38.5
37
37.5
38
38.5
39
39.5
40
40.5
41
Aggregate Technical and Commercial Losses
2007 2008 2009 2010 2011
22Source: Energy Department, GoMP
23
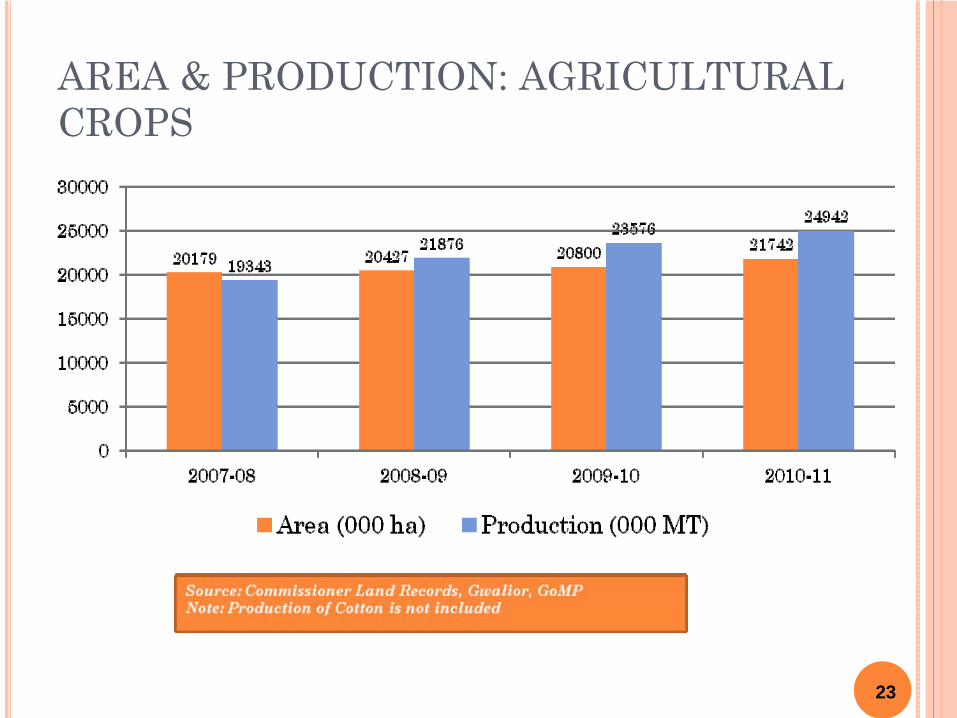
AREA & PRODUCTION: AGRICULTURAL CROPS
23

24
24
WHEAT PROCURED UNDER MSP
1968
3538
4965
8000
0100020003000400050006000700080009000
2009-10 2010-11 2011-12 2012-13(Expected)
Procurement (000 MT)
24

25
25
STORAGE CAPACITY (GOVERNMENT AND PRIVATE) USED FOR RABI
PROCUREMENT:
25Food &Civil Supply Dept., GoMP.

26
AREA & PRODUCTION OF HORTICULTURE: ALL CROPS
26

27
27
RABI IRRIGATION FROM IRRIGATION PROJECTS
823 821 801958
1722
0
500
1000
1500
2000
2007-08 2008-09 2009-10 2010-11 2011-12
Thousand Hectare
27
Source: Water Resource Department, Government of MP

28
28
PHYSICAL PROGRESS UNDER PMGSY
708110043
13832
19063
26957
37355
49445
0
10000
20000
30000
40000
50000
60000
2005 2006 2007 2008 '2009 2010 2011
Length in Km
28
Source: National Rural Road Development Agency, Ministry of Rural Development

29
29
ANNUAL PLAN 2012-13
29
30
30
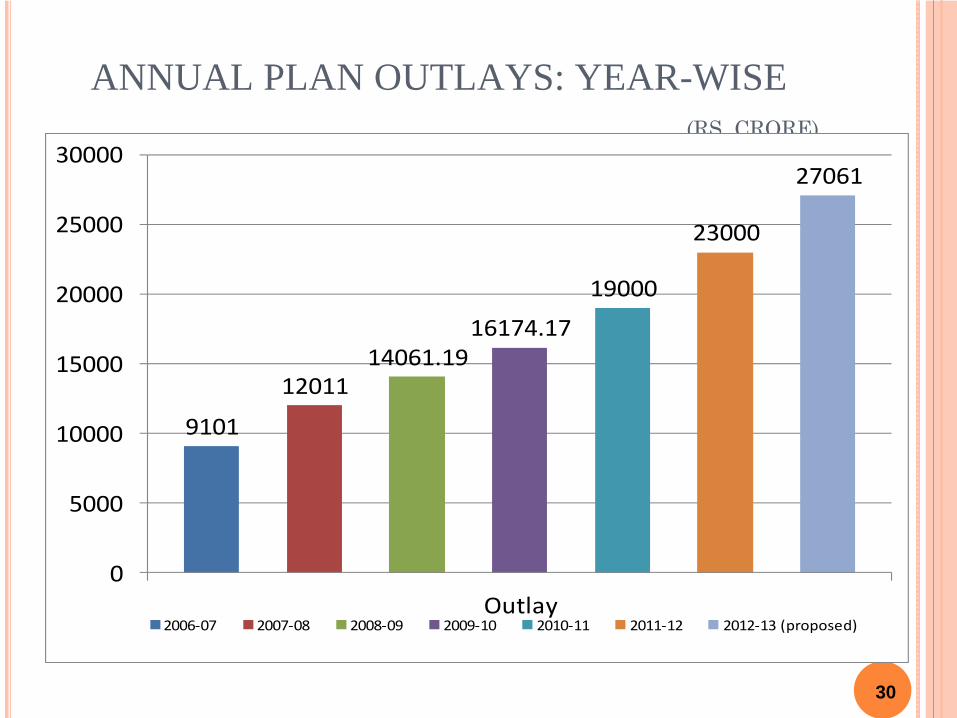
ANNUAL PLAN OUTLAYS: YEAR-WISE (RS. CRORE)
9101
1201114061.19
16174.17
19000
23000
27061
0
5000
10000
15000
20000
25000
30000
Outlay2006-07 2007-08 2008-09 2009-10 2010-11 2011-12 2012-13 (proposed) 30
31
31
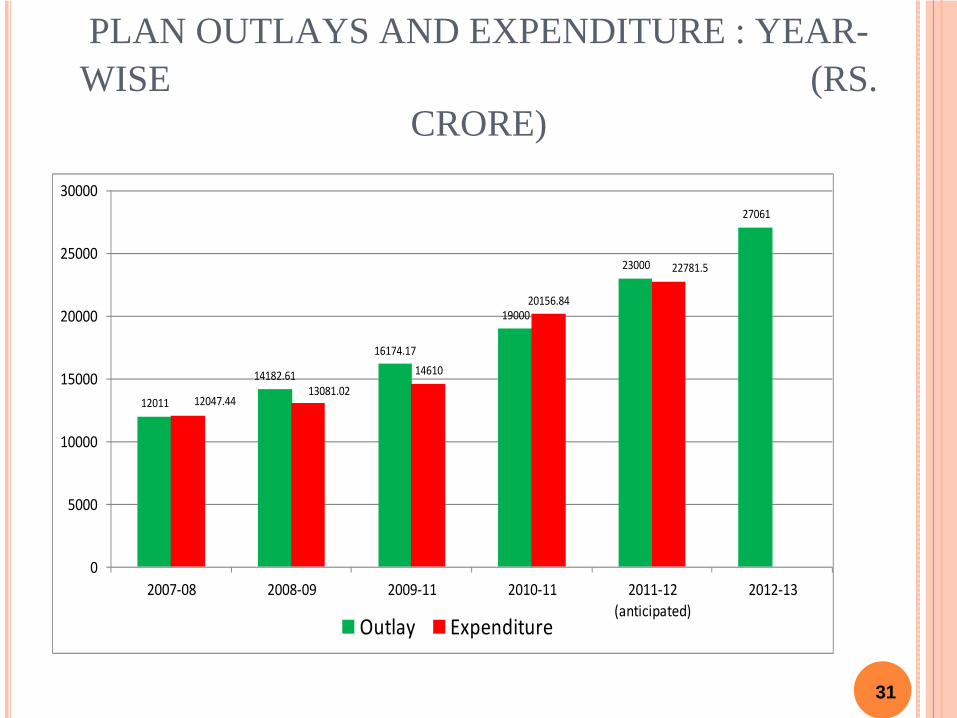
PLAN OUTLAYS AND EXPENDITURE : YEAR- WISE (RS.
CRORE)
12011
14182.61
16174.17
19000
23000
27061
12047.4413081.02
14610
20156.84
22781.5
0
5000
10000
15000
20000
25000
30000
2007-08 2008-09 2009-11 2010-11 2011-12 (anticipated)
2012-13
Outlay Expenditure 31

32
32
RESOURCE MOBILIZATION FOR ANNUAL PLAN 2012- 13
(IN RS. CRORE)
32Total Resources: 28074.05 Crore Total Plan Size: 27061 Crore

33
33
S. No.
Major Sector Annual Plan(2011-12)
Annual Plan (2012-13)
Outlay(Rs. Crore)
Percentage Share
Outlay(Rs.
Crore)
Percentage Share
1 Agriculture and Allied Activities 2219.79 9.65 2040.67 7.54
2 Rural Development 1954.93 8.50 1915.86 7.08
3 Special Areas Programme 1033.98 4.50 1101.04 4.07
4 Irrigation and Flood Control 3046.65 13.25 3299.19 12.19
5 Energy 1987.91 8.64 2769.87 10.24
6 Industry & Mining 371.17 1.61 688.26 2.54
7 Transport 2541.96 11.05 3626.21 13.40
8 Science Technology & Environment 66.09 0.29 72.41 0.27
9 General Economic Services 702.03 3.05 676.16 2.50
10 Social Services 8873.70 38.58 10670.49 39.43
11 General Services 201.79 0.88 200.84 0.74
12 Total 23000.00 100.00 27061.00 100.00

34
34
Sub Plan Outlay Share to Total Outlay
Normal Plan 16813.40 62.13
Tribal Sub Plan
(TSP) 6107.27 22.57
Scheduled Caste
Sub Plan (SCSP) 4140.33 15.30
Total Plan 27061.00 100.00

35
35
12TH FIVE YEAR PLAN
35

36
36
TARGETS OF XII FIVE YEAR PLAN (2004-05 PRICES)
Sector Target (Annual Growth of )
Agriculture (Primary) 9 % (7.17)
Industry (Secondary) 12.0 % (9.66)
Service (Tertiary) 13.75 % (11.70)
Overall Economy 12.00% (10.02)
36Figures in brackets indicate growth in the 11th
Plan
37
37
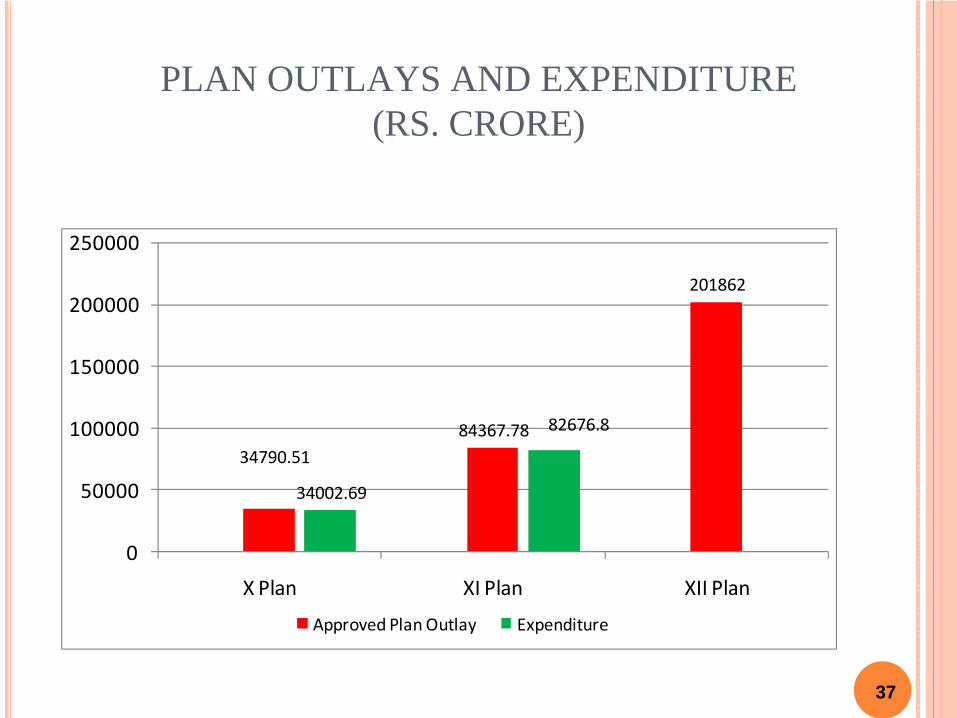
PLAN OUTLAYS AND EXPENDITURE (RS. CRORE)
34790.5184367.78
201862
34002.69
82676.8
0
50000
100000
150000
200000
250000
X Plan XI Plan XII Plan
Approved Plan Outlay Expenditure 37

38
38
RESOURCE MOBILIZATION FOR TWELFTH PLAN 2012- 17
(IN RS. CRORE)
Public Sector Enterprises, 8291, 4%
State’s own funds, 102815.86, 49%
Central Assistance, 35496.09, 17%
State’s Government Budgetary
Borrowings, 63466.95, 30%
State’s own funds State’s Government Budgetary BorrowingsCentral Assistance Public Sector Enterprises
38Total Resources: 210069 Crore
Total Plan Size: 201862 Crore
39
39
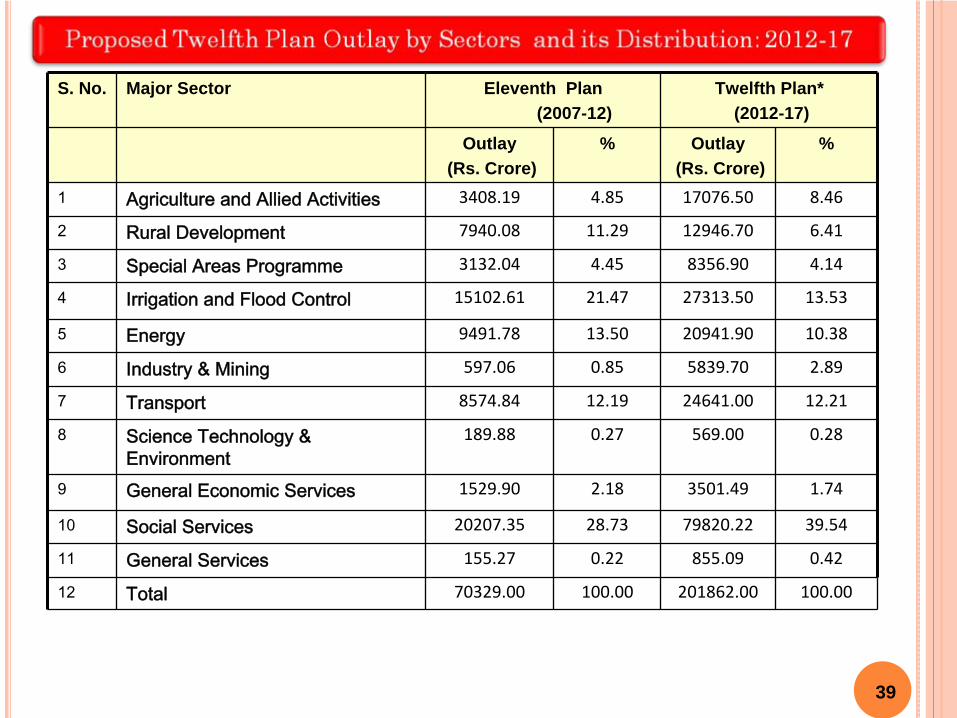
S. No. Major Sector Eleventh Plan(2007-12)
Twelfth Plan* (2012-17)
Outlay(Rs. Crore)
% Outlay(Rs. Crore)
%
1 Agriculture and Allied Activities 3408.19 4.85 17076.50 8.46
2 Rural Development 7940.08 11.29 12946.70 6.41
3 Special Areas Programme 3132.04 4.45 8356.90 4.14
4 Irrigation and Flood Control 15102.61 21.47 27313.50 13.53
5 Energy 9491.78 13.50 20941.90 10.38
6 Industry & Mining 597.06 0.85 5839.70 2.89
7 Transport 8574.84 12.19 24641.00 12.21
8 Science Technology & Environment
189.88 0.27 569.00 0.28
9 General Economic Services 1529.90 2.18 3501.49 1.74
10 Social Services 20207.35 28.73 79820.22 39.54
11 General Services 155.27 0.22 855.09 0.42
12 Total 70329.00 100.00 201862.00 100.00

40
40
Sub Plan Outlay Percentage Share
Normal Plan 123831.23 61.35
Tribal Sub Plan
(TSP) 46635.41 23.10
Scheduled Caste
Sub Plan (SCSP) 31395.36 15.55
Total Plan 201862 100.00

41
PRIORITIES FOR THE TWELFTH PLAN
41

42
42
AGRICULTURE AND ALLIED ACTIVITIES
9% growth in agricultural sector
Diversify and value add to make agriculture a remunerative
profession for the small and marginal farmers
Bring total area under horticulture to 1.2 million ha.
Encourage PPP in extension services, and agro- processing
Promote micro irrigation
Increase in per hectare use of fertilizer
Promote farm mechanisation and custom hiring services
42

43
AGRICULTURE AND ALLIED ACTIVITIES (CONTD..)
Enhancement of Storage Capacity
Strengthen seed production infrastructure
Promote production of pulses
Achieve animal health coverage of over 70%
Use technology for breed improvement
Achieve annual growth rate of 5% in milk
production
43

44
PANCHAYAT & RURAL DEVELOPMENT
To reduce poverty levels from 36.7% to 25%
Covering all Village with BT roads
Empowering women through socio-economic
development.
44

45
45
ENERGY-
CONVENTIONAL AND RENEWABLE
Turning from power deficit to power surplus state.
Completion of Feeder Separation in rural areas
Ensure 8 hrs of continuous power for Agriculture
To convert all utilities into commercially viable entities
Provide access to electricity to all willing households
Provide 10% of state’s energy needs from Renewable
sources45

46
46
HEALTH
Reduce MMR to 200
Reduce IMR to 35
Improve the CSR to 930 from 912
Reduce TFR to 2.2
Ensure 100% Immunization
Total Health care for all at the village level46

47
47
EDUCATION
Enhancing achievement levels of children of govt
schools
Improve quality of education at the primary and secondary level
Reduce dropout rate in elementary education to
below 3%
Ensure transition rate to secondary to above 90%
Enhance capacity of teachers through training 47

48
IRRIGATION
Expand present irrigation facilities by 12 lakh
hectares from all govt. schemes
Bridging the gap between potential created and utilized
Focus on efficiency on water usage
Command Area Development
Capacity restoration and enhancement of projects
Completion of all on-going projects 48

49
DRINKING WATER
Provide safe drinking water to Rural population
Ensure piped water supply to 20% of rural households
Reduce dependence on ground water and increase utilisation of surface water
49

50
PUBLIC WORKS DEPARTMENT
Complete development of 54000 KM of SH,MDR
and ODR.
Capacity enhancement for building construction wings by forming Project implementation units
Ensure safer highways
50

51
51
SOCIAL SECTORS
Reduce Total underweight children to below 40%. Bring
SAM to below 5%
Bridge the infrastructure gap for WCD (Anganwadis)
Strengthen infrastructure for Child Protection
Institutionalize convergence between Health, WCD and
Safe Drinking Water
Producing Quality Skilled Manpower especially in rural
areas
Strengthen social, economic and political empowerment
especially of SCs/STs, OBCs, minorities and poor.
51

52
RECENT AND PLANNED INITIATIVES
52

53
53
RECENT AND PLANNED INITIATIVES
CM Urban Drinking Water Mission
CM Urban Sanitation Programme
CM Urban Infrastructure Programme
Urban Governance Restructuring Initiative
53

54
54
RECENT AND PLANNED INITIATIVES
Strengthening of T& D and feeder separation with
ADB and JICA Assistance
Creation of 25 PIUs for improving construction quality in PWD.
Development of SH,MDR and ODR on PPP mode.
Construction of ROBs in partnership between PWD
and Railways 54

55
RECENT AND PLANNED INITIATIVES
Establishment of Horticulture Hubs and clusters
Establishment of fertilizer and Seed Quality Control Labs
State support for advance storage of fertilizer
Establishment of State Micro irrigation Mission
Universal provision of soil health cards
Promotion of Farm Mechanization & Custom hiring55

56
56
RECENT AND PLANNED INITIATIVES
Creation of new company for Rural and urban piped
water supply scheme and sewerage disposal
Development of New Industrial Area and up gradation of existing Industrial Areas
56

57
RECENT AND PLANNED INITIATIVES
Decentralized Planning and Social Audit
Public service guarantee for all critical Services
E- governance for implementing and
monitoring of programmes and projects
57

58
THANK YOU58

59
59
ISSUES FOR
DISCUSSION
59