Embed Size (px)
Citation preview
0
THE UNITED REPUBLIC OF
TANZANIA
MINISTRY OF FINANCE
GOVERNMENT PROCUREMENT SERVICES AGENCY
(GPSA)
ANNUAL PERFORMANCE REPORT
JULY 2011 – JUNE 2012
SEPTEMBER, 2012
i
Page No.
TABLE OF CONTENT …………………. ……. . ……. i
1.0 Part 1: Introduction……………………………………………. 1
Section 1.1 Purpose of the Report……………………. 1
Section 1.2 Layout and structure of the Report………………………….. 1
2.0 Part II: Overall Performance………………………………….. 2
Section 2.1 Progress towards reaching outcomes……………………….. 2
Section 2.2 Progress in improving Service delivery……………………... 3
Section 2.3 Evaluation and Reviews………………………………………. 4
Section 2.4 Milestone or Priority Interventions………………………….. 5
Section 2.5 Challenges experienced………………………………………. 7
3.0 Part III: Achievement of annual Targets…………………….. 8
4.0 Part IV: Financial Performance……………………………….. 11
4.1 Revenue Collection up to 30th June 2012 ……………………. 11
4.2 Expenditure up to 30th June 2012 …………………….…… 12
5.0 Part V: Human Resources Review…………………………… 13
Form 12A ………………………………………………………. 14
Form 12B……………………………………………………….. 20
Form 12C……………………………………………………….. 23
Form 13A………………………………………………………. 28
Form 13B……………………………………………………….. 29
Appendix A: Staffing levels summary ……………….. 30
Appendix B: Employees who left the Agency ……………….. 32
1
1.0 Part 1: Introduction
Section 1.1: Purpose of the Report
This report is prepared to reflect the Agency’s main achievements in terms of
targets reached and the progress it is making in realizing its outcomes and in
improving its service delivery for the financial year 2011/2012 from July 2011 to
June 2012. The report describes performance within the context of the Agency’s
Strategic Plan covering the period 2010/2011 to 2012/2013 as well as the Agency’s
Annual Business Plan and Budget for 2011/2012. It focuses on issues of
implementation, in particular the degree to which services have been produced
against the plan. The report shows the challenges faced and the remedial measures
taken to address them. The method used is participatory approach. During the
period under review, the Agency planned to perform various activities based on
the action plan derived from the Agency Business Plan for the financial year
2011/2012. The Annual action plan was implemented according to the timeframe
set for the purpose of performance, monitoring and control.
Section 1.2: Layout and Structure of the Report
This report is divided into five main parts. Part one is an introduction, Part two
provides the overall performance, Part three presents the achievement of annual
targets and Part four provides the financial performance, part five summaries
staffing levels. The planned targets, implementation status in form of physical
performance, financial performance and degree of performance are as shown in
Form 12A attached. The five Annexes support the main body by providing more
details on the progress towards achieving annual targets. These Annexes are:
Annex 1: Form 12A: Cumulative quarterly MTEF monitoring form
Annex 2: Form 12B: Quarterly cumulative milestone (priority) form
Annex 3: Form 12C: Outcome indicator monitoring form
Annex 4: Form 13A: Quarterly cumulative financial overview form
Annex 5: Form 13B: Quarterly cumulative financial detailed
2
2.0 Part II: Overall Performance
Section 2.1: Progress towards reaching outcomes
The overall performance for the period under review was as follows:
i. The Agency collected a total of Shs.36,505,987,341.00 which is equivalent to
96.98% of the planned revenue of Shs.37,643,491,000.00 for the year.
ii. The Agency spent a total of Shs. 36,563,683,633.00 which is equivalent to
97.30 % of the planned expenditure of Shs.37,578,491,000.00 for the period.
iii. The Agency continued to develop its staff through training in short and
long term courses within and outside the country.
iv. Two workers council meetings were held at Msimbazi Centre in D’ Salaam
from 28th to 29th July, 2011 and at Mkonge Hotel in Tanga from 29th and 30th
March, 2012.The main Agenda of the meetings were to deliberate on the
Agency’s performance for the year 2011/2012.
v. The Agency workforce stood at 393 whereas 298 are permanent staff and 95
are temporary and contract employees. During the year four new staff were
recruited, eight staff retired, three resigned, two terminated, one transferred
and one member of the staff passed away.
vi. The Agency obtained a Clean Audit opinion for the financial year
2010/2011
vii. All Regional offices are connected to the internet and the Agency website is
www.gpsa.go.tz
viii. The Agency continued to ensure fast moving stock items were readily
available at competitive prices in all regional depots. Stock received from
suppliers worth Tshs.28,566,612,464.00, stock sold to customers worth Tshs.
33,074,221,271.00, stock balance in warehouses and fuel depots as at
30thJune, 2012 worth Tshs.4,251,260,559.00 and customer’s deposits as at 30th
June 2012 worth Tshs.2,456,655,485.00
ix. Rehabilitation of Kurasini fuel station was completed and opening ceremony was officially graced by the Minister of Finance Hon. Mustafa Haid Mkulo on 5th December, 2011. However on 22nd May 2012, the contract for construction of Dodoma fuel station was terminated due to non- performance of the Contractor.
3
x. Financial and stock audits were conducted in 15 regions out of the 21 regions in Tanzania Mainland, verification of the Agency’s debtors, reconciliation of payroll information against staff list and special audit on evaluation of stock control system at head office was conducted
xi. A total of 6,267 framework agreements for CUIS were awarded to various Suppliers for the financial year 2012/2013.
xii. Two GPSA staff and one member of the GPSA Ministerial Advisory Board (MAB) visited the United Kingdom Government to learn best practices on
operationalization of framework agreements.
Section 2.2: Progress in improving service delivery.
Some changes that occurred at GPSA to improve quality of services offered to
customers include:
i. Increasing storage capacity by rehabilitation and expansion of Kurasini
fuel station in Dar es Salaam from 135,000 liters in 2010/2011 to 187,000
liters in 2011/2012,Tabora from 28,000 liters in 2010/2011 to 37,400 liters
in 2011/2012 and Manyara from 18,000 liters in 2010/2011 to 40,000
liters in 2011/2012.
ii. Fourteen dispensing pumps were installed at Dar es Salaam (10), Mara,
Tanga, Mtwara and Morogoro regions to improve service delivery
iii. Construction and expansion of Kurasini petrol station in Dar es Salaam
and rehabilitation of Tanga offices has been completed.
iv. Construction and rehabilitation of office buildings, warehouses and
petrol stations at Dodoma, Manyara, Tabora, Shinyanga, Lindi and
Mtwara are still in progress.
v. Four trucks were maintained in order to improve service delivery
vi. Stocks were made available at regional depots and at headquarter
vii. Acquisition of fuel management system is at contract stage
viii. Clearing and forwarding operations were facilitated
ix. Seven (7) HIV and AIDS affected staff were supported
4
x. Two staff and one member of the GPSA Ministerial Advisory Board
visited the United Kingdom Government to learn best practice on
operationalization of framework agreements
xi. Communication strategy was implemented by improving internet
connectivity, website and acquisition of ICT equipment.
xii. Awareness of GPSA products and services were provided during Public
events
xiii. Three MAB and two workers council meetings were conducted to
deliberate strategies to improve service delivery
Section 2.3: Evaluation and Reviews
During the period under review, the Agency conducted the survey to help in
assessing the implementation of the Strategic Plan 2010/2011 through
2012/2013. The following results obtained from the survey will be used to
prepare the 3- Year outcome report.
i. Staff awareness on HIV and AIDS has increased from 86% in 2010/2011
to 90% in 2011/2012
ii. Budget spent in supporting HIV and AIDS victims has increased from
0% in 2010/2011 to 71% in 2011/2012 whereby 100% of the affected
GPSA staff received HIV and AIDS support services.
iii. Number of procuring entities (PEs) using framework agreements has
increased from 102 PEs equivalent to 26% of 390 total PEs in 2010/2011
to 114 PEs equivalent to 29% of 393 total PEs in 2011/2012
iv. Percentage of framework agreements awarded and signed has decreased
from 84% (3,397 awarded tenders) in 2010/2011 to 72% (6,267 awarded
tenders) in 2011/2012
v. Storage capacity for underground tanks have increased by 10.75% from
850,938 Liters in 2010/2011 to 942,438 Liters in 2011/2012
vi. 15 staff were trained in various skills
vii. 67% of external customers showed satisfaction with GPSA information
dissemination system
5
viii. External customers satisfied with the quality of services offered by
GPSA have increased from 78% in 2010/2011 to 79% in 2011/2012.
ix. 80% of external customers believed that GPSA management is
accountable and responsive
x. Internal customer’s satisfaction with the quality of services offered by GPSA has significantly decreased from 77% in 2010/2011 to 68% in 2011/2012.
xi. Overall labour productivity of GPSA has significantly increased from
21.30 in 2010/2011 to 22.50 in 2011/2012. Labour productivity is the
ratio of annual revenue over annual salaries and wages of GPSA
employees.
xii. GPSA sales turnover has increased from 97.83% in 2010/2011 to 100.29%
in 2011/2012.
xiii. Number of vacant duty posts filled have increased from 2.64% in
2010/2011 to 18.43% in 2011/2012
Section 2.4: Milestones or Priority interventions
In order to ensure effective implementation of the Strategic Plan, interventions
listed in Annex 2 (Form 12B) attached have been considered to be critical to
achieve overall objectives. The specific planned reviews, milestones,
timeframes and the responsible departments/units for the financial year
2011/2012 are shown in the table below
Year Planned
Reviews
Milestones Timeframe Responsi
ble
Person
2011/
2012
Two
reviews
Schemes of service and Staff
Regulations implemented
July, 2011 DBSS
6
per year –
midyear
and
annual
reviews
Study report on business process
improvement in place
April, 2012 DBSS
Stock control system improved June, 2012 DO
Office facilities and equipment
acquired
June, 2012 DBSS
HIV and AIDS awareness
programme developed and
implemented
June, 2012 DBSS
Programme to support HIV and
AIDS victims implemented
June, 2012 DBSS
Study visits to learn best practice
of common procurement
October,2011 DPAS
Handling and Distribution
system improved
June, 2012 DO
Procurement processing time
reduced
June, 2012 HPMU
Sales volume increased June, 2012 DBSS
Implementation of Agency
planned targets monitored and
evaluated. Annual M&E Report
for FY 2011/2012 in place
September, 2012 HPME
7
Section 2.5: Challenges experienced
During the period under review, there was a remarkable achievement in most
of the planned targets. However the following targets were at risk or were not
met due to the following problems.
S/No
.
Target at risk or
not met
Problems
experienced
Action taken to address these
problems
1 Working environment improved by June 2012
Office equipment,
storage facilities
and office buildings
are not in good
condition
The Agency plans to acquire
working equipment, tools,
rehabilitation of office
buildings and storage facilities
to improve working
environment
2 Communication strategy developed and implemented by June 2012
Inability to collect,
retrieve, process
and disseminate
information on
time makes
decision making
difficult
The Agency plans to improve
the existing information
system by acquiring necessary
ICT equipment and
developing communication
infrastructure
3 Capital position
improved by June
2012.
Inadequate
working capital
Implementation of consultant
report on GPSA assets
utilization to generate more
revenue by constructing
commercial buildings through
private public partnership
(PPP) is in progress
4 Marketing survey to assess acceptability of GPSA products
Marketing survey was not conducted due to lack of marketing and
The Agency plans to
strengthen staff by recruiting
required staff in next year
8
and services conducted by June 2012.
sales staff 2012/2013
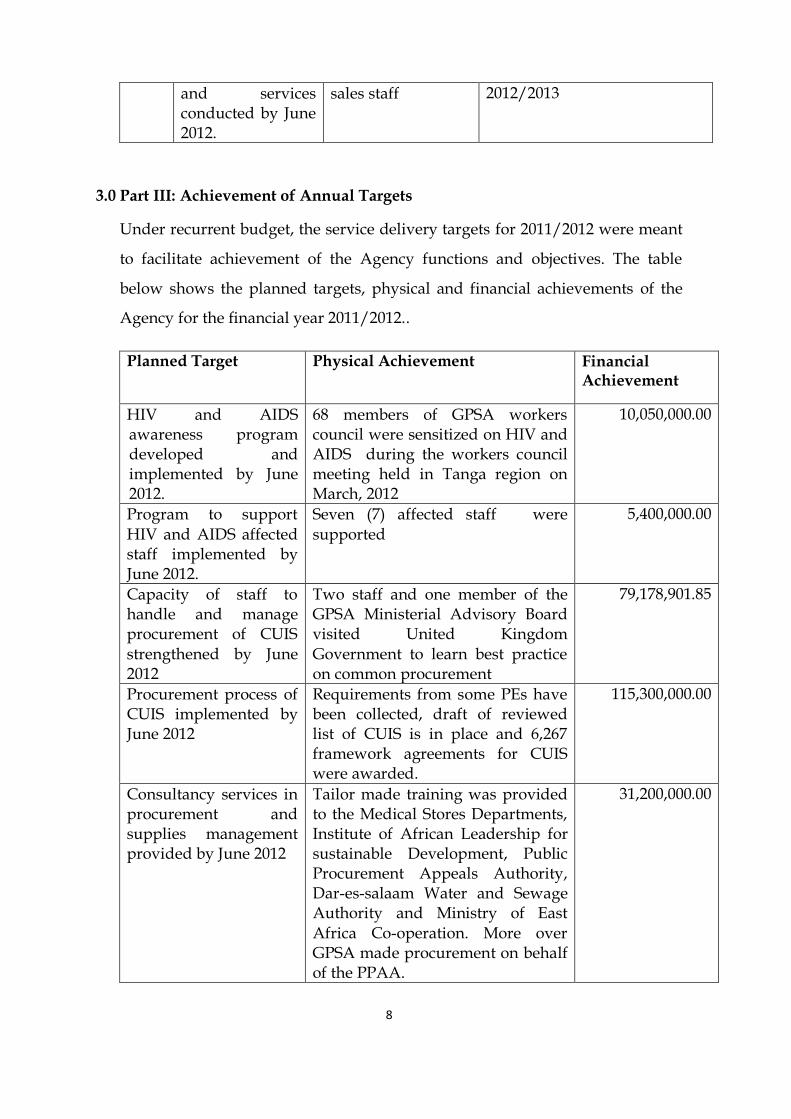
3.0 Part III: Achievement of Annual Targets
Under recurrent budget, the service delivery targets for 2011/2012 were meant
to facilitate achievement of the Agency functions and objectives. The table
below shows the planned targets, physical and financial achievements of the
Agency for the financial year 2011/2012..
Planned Target Physical Achievement Financial Achievement
HIV and AIDS awareness program developed and implemented by June 2012.
68 members of GPSA workers council were sensitized on HIV and AIDS during the workers council meeting held in Tanga region on March, 2012
10,050,000.00
Program to support HIV and AIDS affected staff implemented by June 2012.
Seven (7) affected staff were supported
5,400,000.00
Capacity of staff to handle and manage procurement of CUIS strengthened by June 2012
Two staff and one member of the GPSA Ministerial Advisory Board visited United Kingdom Government to learn best practice on common procurement
79,178,901.85
Procurement process of CUIS implemented by June 2012
Requirements from some PEs have been collected, draft of reviewed list of CUIS is in place and 6,267 framework agreements for CUIS were awarded.
115,300,000.00
Consultancy services in procurement and supplies management provided by June 2012
Tailor made training was provided to the Medical Stores Departments, Institute of African Leadership for sustainable Development, Public Procurement Appeals Authority, Dar-es-salaam Water and Sewage Authority and Ministry of East Africa Co-operation. More over GPSA made procurement on behalf of the PPAA.
31,200,000.00
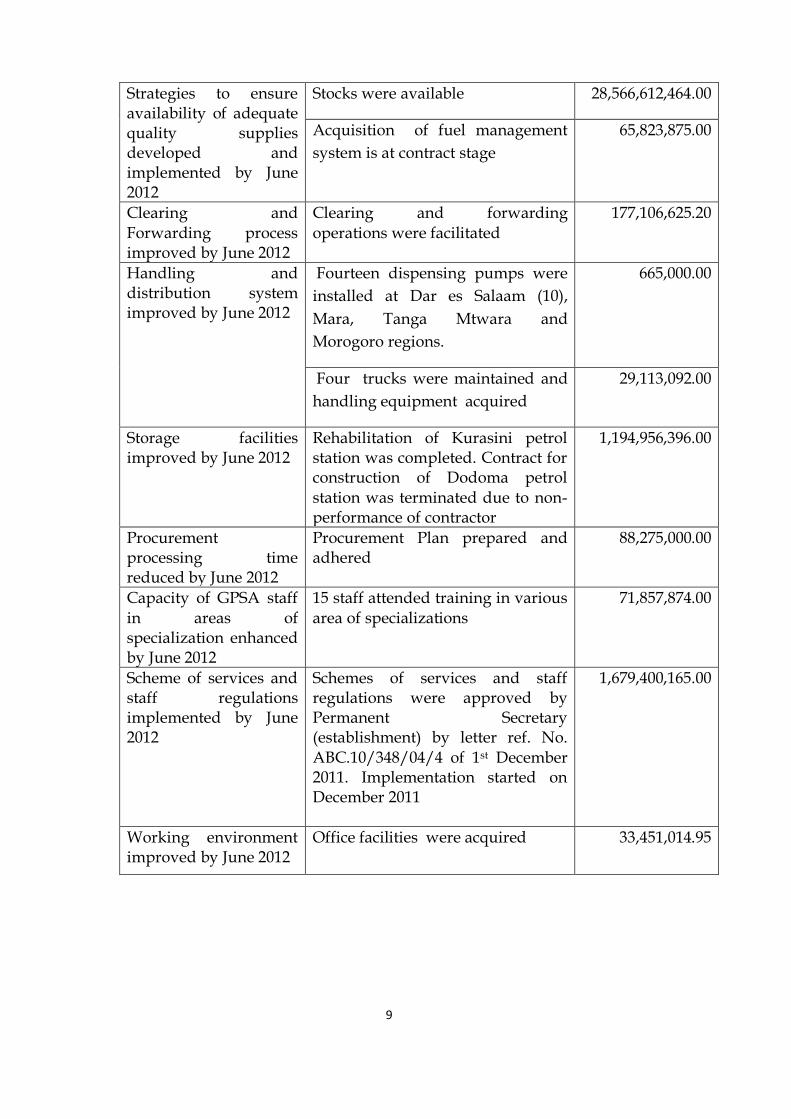
9
Strategies to ensure availability of adequate quality supplies developed and implemented by June 2012
Stocks were available 28,566,612,464.00
Acquisition of fuel management
system is at contract stage
65,823,875.00
Clearing and Forwarding process improved by June 2012
Clearing and forwarding operations were facilitated
177,106,625.20
Handling and distribution system improved by June 2012
Fourteen dispensing pumps were
installed at Dar es Salaam (10),
Mara, Tanga Mtwara and
Morogoro regions.
665,000.00
Four trucks were maintained and
handling equipment acquired
29,113,092.00
Storage facilities improved by June 2012
Rehabilitation of Kurasini petrol station was completed. Contract for construction of Dodoma petrol station was terminated due to non-performance of contractor
1,194,956,396.00
Procurement processing time reduced by June 2012
Procurement Plan prepared and adhered
88,275,000.00
Capacity of GPSA staff in areas of specialization enhanced by June 2012
15 staff attended training in various area of specializations
71,857,874.00
Scheme of services and staff regulations implemented by June 2012
Schemes of services and staff regulations were approved by Permanent Secretary (establishment) by letter ref. No.
ABC.10/348/04/4 of 1st December 2011. Implementation started on December 2011
1,679,400,165.00
Working environment improved by June 2012
Office facilities were acquired 33,451,014.95
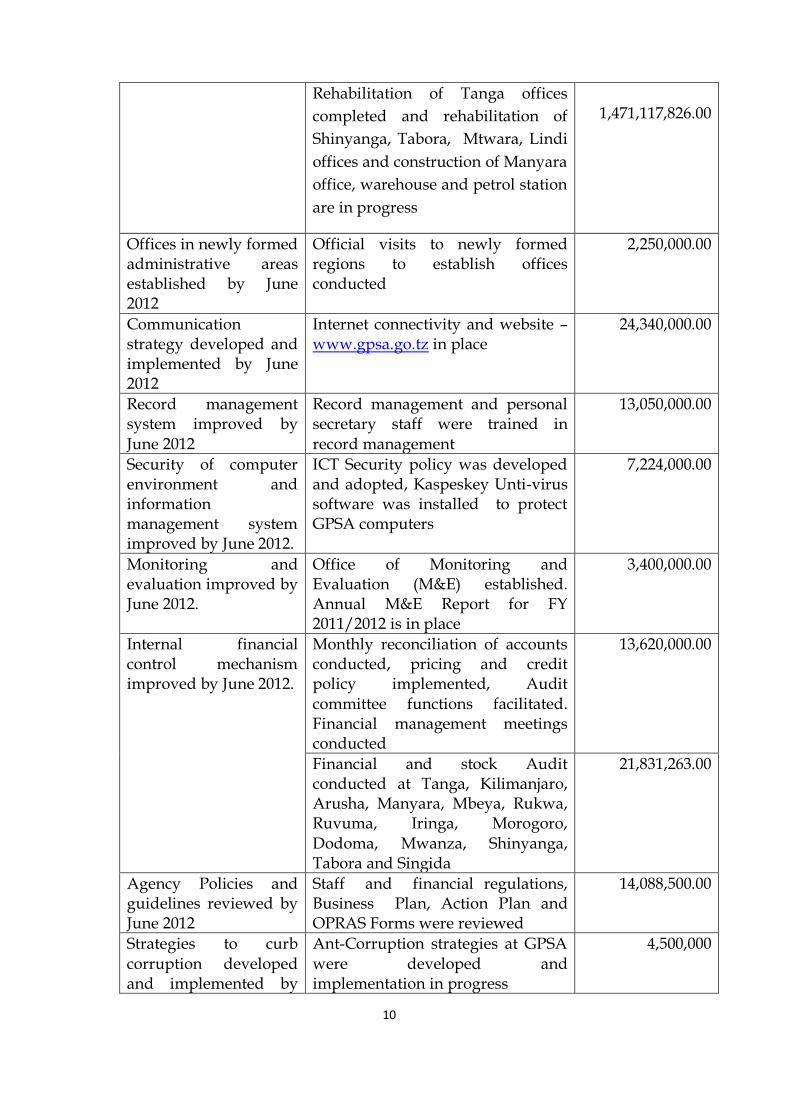
10
Rehabilitation of Tanga offices
completed and rehabilitation of
Shinyanga, Tabora, Mtwara, Lindi
offices and construction of Manyara
office, warehouse and petrol station
are in progress
1,471,117,826.00
Offices in newly formed administrative areas established by June 2012
Official visits to newly formed regions to establish offices conducted
2,250,000.00
Communication strategy developed and implemented by June 2012
Internet connectivity and website – www.gpsa.go.tz in place
24,340,000.00
Record management system improved by June 2012
Record management and personal secretary staff were trained in record management
13,050,000.00
Security of computer environment and information management system improved by June 2012.
ICT Security policy was developed and adopted, Kaspeskey Unti-virus software was installed to protect GPSA computers
7,224,000.00
Monitoring and evaluation improved by June 2012.
Office of Monitoring and Evaluation (M&E) established. Annual M&E Report for FY 2011/2012 is in place
3,400,000.00
Internal financial control mechanism improved by June 2012.
Monthly reconciliation of accounts conducted, pricing and credit policy implemented, Audit committee functions facilitated. Financial management meetings conducted
13,620,000.00
Financial and stock Audit conducted at Tanga, Kilimanjaro, Arusha, Manyara, Mbeya, Rukwa, Ruvuma, Iringa, Morogoro, Dodoma, Mwanza, Shinyanga, Tabora and Singida
21,831,263.00
Agency Policies and guidelines reviewed by June 2012
Staff and financial regulations, Business Plan, Action Plan and OPRAS Forms were reviewed
14,088,500.00
Strategies to curb corruption developed and implemented by
Ant-Corruption strategies at GPSA were developed and implementation in progress
4,500,000
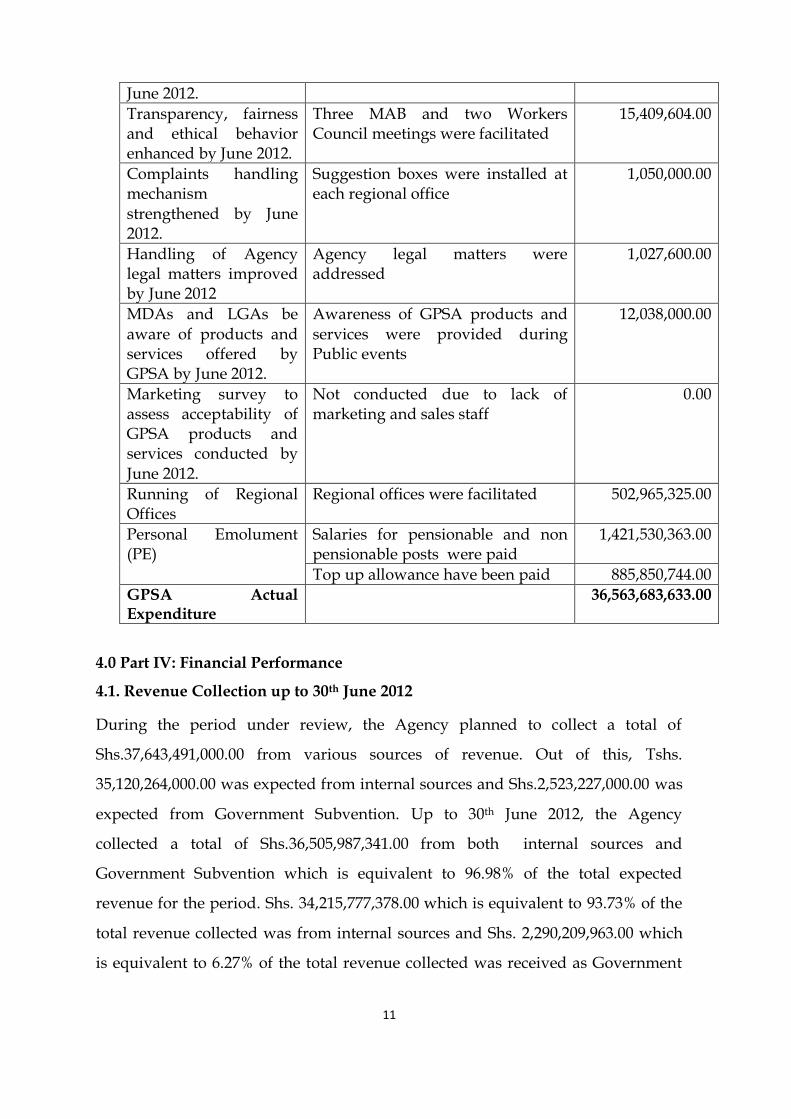
11
June 2012.
Transparency, fairness and ethical behavior enhanced by June 2012.
Three MAB and two Workers Council meetings were facilitated
15,409,604.00
Complaints handling mechanism strengthened by June 2012.
Suggestion boxes were installed at each regional office
1,050,000.00
Handling of Agency legal matters improved by June 2012
Agency legal matters were addressed
1,027,600.00
MDAs and LGAs be aware of products and services offered by GPSA by June 2012.
Awareness of GPSA products and services were provided during Public events
12,038,000.00
Marketing survey to assess acceptability of GPSA products and services conducted by June 2012.
Not conducted due to lack of marketing and sales staff
0.00
Running of Regional Offices
Regional offices were facilitated 502,965,325.00
Personal Emolument (PE)
Salaries for pensionable and non pensionable posts were paid
1,421,530,363.00
Top up allowance have been paid 885,850,744.00 GPSA Actual Expenditure
36,563,683,633.00
4.0 Part IV: Financial Performance
4.1. Revenue Collection up to 30th June 2012
During the period under review, the Agency planned to collect a total of
Shs.37,643,491,000.00 from various sources of revenue. Out of this, Tshs.
35,120,264,000.00 was expected from internal sources and Shs.2,523,227,000.00 was
expected from Government Subvention. Up to 30th June 2012, the Agency
collected a total of Shs.36,505,987,341.00 from both internal sources and
Government Subvention which is equivalent to 96.98% of the total expected
revenue for the period. Shs. 34,215,777,378.00 which is equivalent to 93.73% of the
total revenue collected was from internal sources and Shs. 2,290,209,963.00 which
is equivalent to 6.27% of the total revenue collected was received as Government
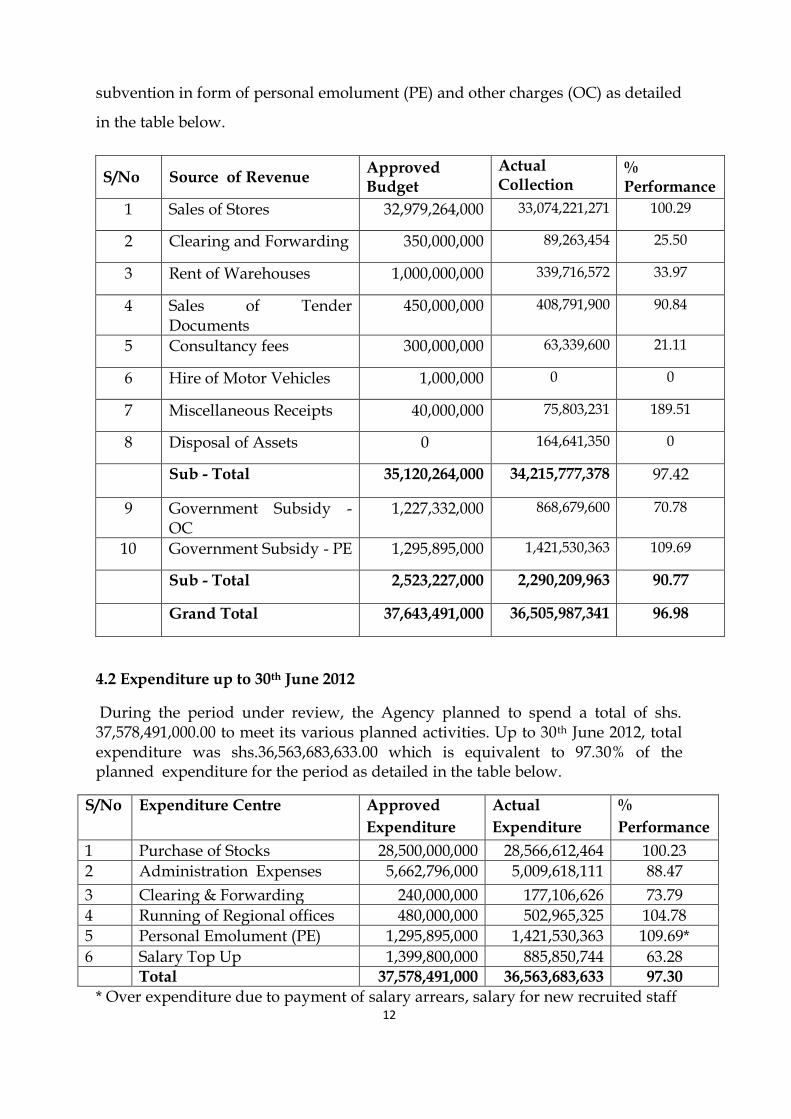
12
subvention in form of personal emolument (PE) and other charges (OC) as detailed
in the table below.
S/No Source of Revenue Approved Budget
Actual Collection
% Performance
1 Sales of Stores 32,979,264,000 33,074,221,271 100.29
2 Clearing and Forwarding 350,000,000 89,263,454 25.50
3 Rent of Warehouses 1,000,000,000 339,716,572 33.97
4 Sales of Tender Documents
450,000,000 408,791,900 90.84
5 Consultancy fees 300,000,000 63,339,600 21.11
6 Hire of Motor Vehicles 1,000,000 0 0
7 Miscellaneous Receipts 40,000,000 75,803,231 189.51
8 Disposal of Assets 0 164,641,350 0
Sub - Total 35,120,264,000 34,215,777,378 97.42
9 Government Subsidy - OC
1,227,332,000 868,679,600 70.78
10 Government Subsidy - PE 1,295,895,000 1,421,530,363 109.69
Sub - Total 2,523,227,000 2,290,209,963 90.77
Grand Total 37,643,491,000 36,505,987,341 96.98
4.2 Expenditure up to 30th June 2012
During the period under review, the Agency planned to spend a total of shs. 37,578,491,000.00 to meet its various planned activities. Up to 30th June 2012, total expenditure was shs.36,563,683,633.00 which is equivalent to 97.30% of the planned expenditure for the period as detailed in the table below.
S/No Expenditure Centre Approved
Expenditure
Actual
Expenditure
%
Performance
1 Purchase of Stocks 28,500,000,000 28,566,612,464 100.23
2 Administration Expenses 5,662,796,000 5,009,618,111 88.47
3 Clearing & Forwarding 240,000,000 177,106,626 73.79
4 Running of Regional offices 480,000,000 502,965,325 104.78
5 Personal Emolument (PE) 1,295,895,000 1,421,530,363 109.69*
6 Salary Top Up 1,399,800,000 885,850,744 63.28 Total 37,578,491,000 36,563,683,633 97.30
* Over expenditure due to payment of salary arrears, salary for new recruited staff
13
5.0 Part V: Human Resources Review
This section summarises key aspects of the management of human resource
(HR). It describes staffing levels and key human resource issues confronting
the Agency.
Staff level and recruitment
During the year under review, the existing staff was 313 and new recruited
staff was five (5). The actual spending on staff salaries and salary top up was
shs. 2,307,381,107.00 as shown in Appendix A
Human Resources Issues
In terms of human resource staffing, several issues arose during the
financial year 2011/2012. A total of eight staff retired, three resigned, two
terminated, one transferred and one member of the staff passed away as
shown in Appendix B
14
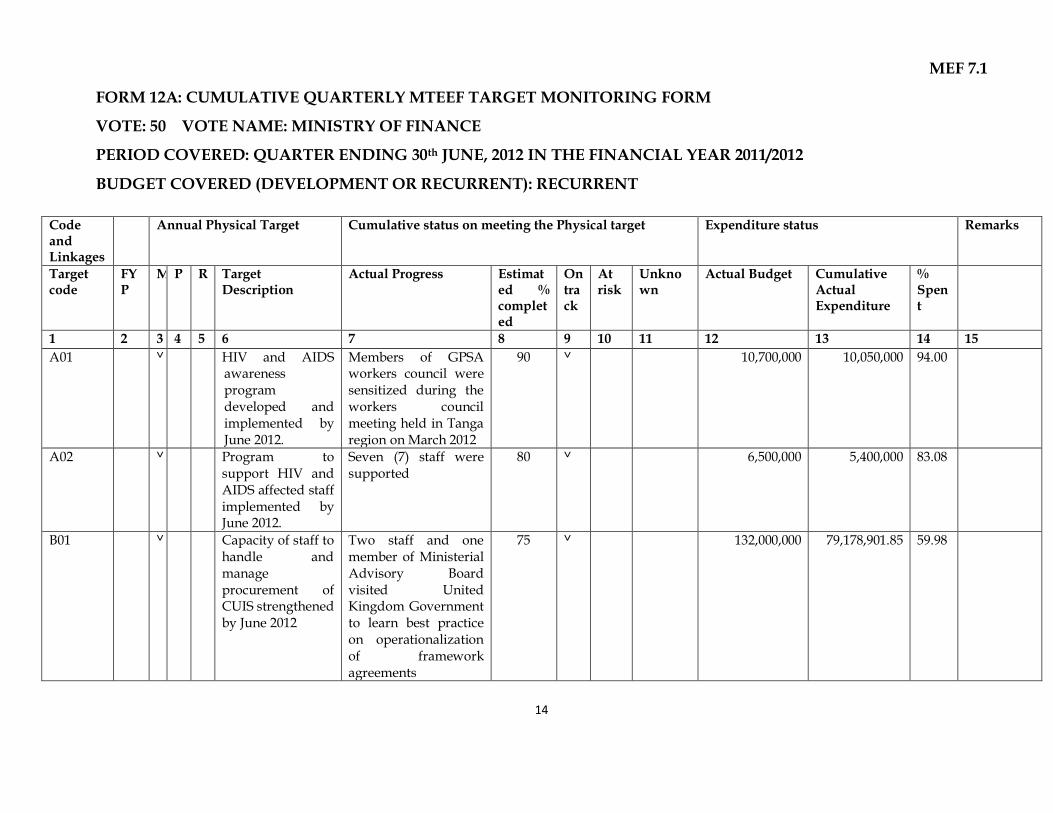
MEF 7.1
FORM 12A: CUMULATIVE QUARTERLY MTEEF TARGET MONITORING FORM
VOTE: 50 VOTE NAME: MINISTRY OF FINANCE
PERIOD COVERED: QUARTER ENDING 30th JUNE, 2012 IN THE FINANCIAL YEAR 2011/2012
BUDGET COVERED (DEVELOPMENT OR RECURRENT): RECURRENT
Code and Linkages
Annual Physical Target Cumulative status on meeting the Physical target Expenditure status Remarks
Target code
FYP
M P R Target Description
Actual Progress Estimated % completed
On track
At risk
Unknown
Actual Budget Cumulative Actual Expenditure
% Spent
1 2 3 4 5 6 7 8 9 10 11 12 13 14 15
A01 ˅ HIV and AIDS awareness program developed and implemented by June 2012.
Members of GPSA workers council were sensitized during the workers council meeting held in Tanga region on March 2012
90 ˅ 10,700,000 10,050,000 94.00
A02 ˅ Program to support HIV and AIDS affected staff implemented by June 2012.
Seven (7) staff were supported
80 ˅ 6,500,000 5,400,000 83.08
B01 ˅ Capacity of staff to handle and manage procurement of CUIS strengthened by June 2012
Two staff and one member of Ministerial Advisory Board visited United Kingdom Government to learn best practice on operationalization of framework agreements
75
˅ 132,000,000
79,178,901.85 59.98
15
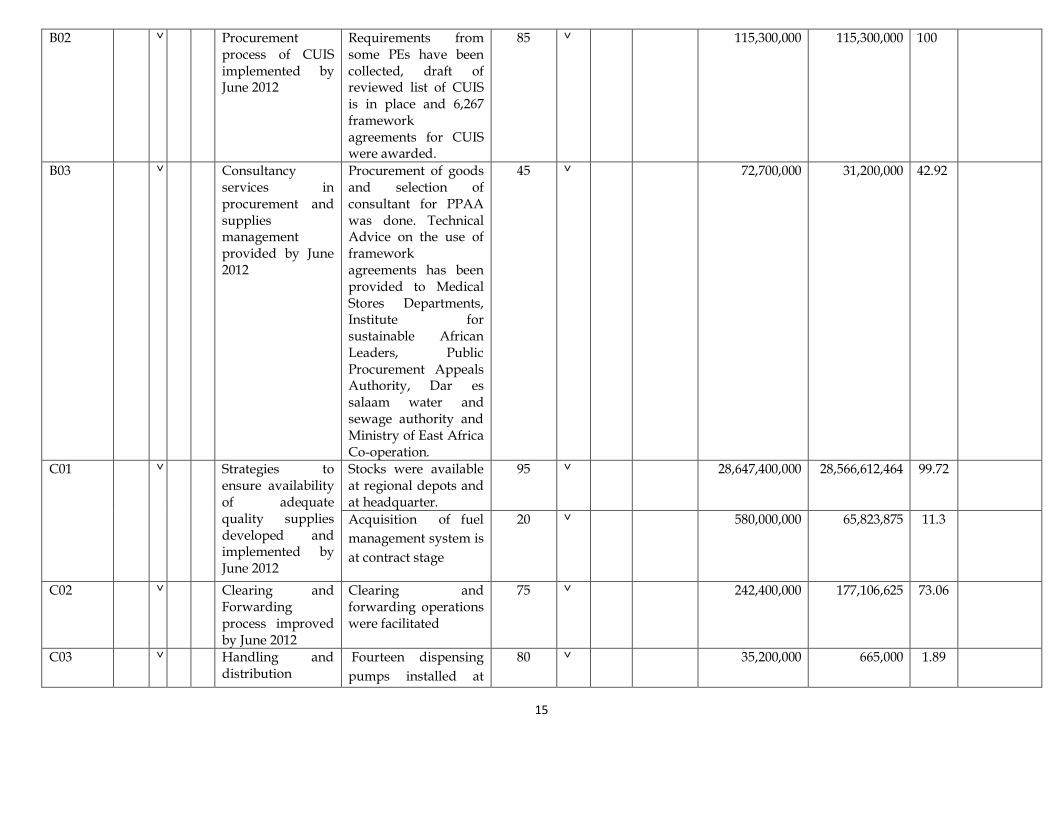
B02 ˅ Procurement process of CUIS implemented by June 2012
Requirements from some PEs have been collected, draft of reviewed list of CUIS is in place and 6,267 framework agreements for CUIS were awarded.
85
˅ 115,300,000 115,300,000 100
B03 ˅ Consultancy services in procurement and supplies management provided by June 2012
Procurement of goods and selection of consultant for PPAA was done. Technical Advice on the use of framework agreements has been provided to Medical Stores Departments, Institute for sustainable African Leaders, Public Procurement Appeals Authority, Dar es salaam water and sewage authority and Ministry of East Africa Co-operation.
45 ˅ 72,700,000 31,200,000 42.92
C01 ˅ Strategies to ensure availability of adequate quality supplies developed and implemented by June 2012
Stocks were available at regional depots and at headquarter.
95 ˅ 28,647,400,000 28,566,612,464 99.72
Acquisition of fuel
management system is
at contract stage
20 ˅ 580,000,000 65,823,875 11.3
C02 ˅ Clearing and Forwarding process improved by June 2012
Clearing and forwarding operations were facilitated
75 ˅ 242,400,000 177,106,625 73.06
C03 ˅ Handling and distribution
Fourteen dispensing
pumps installed at
80 ˅ 35,200,000 665,000 1.89
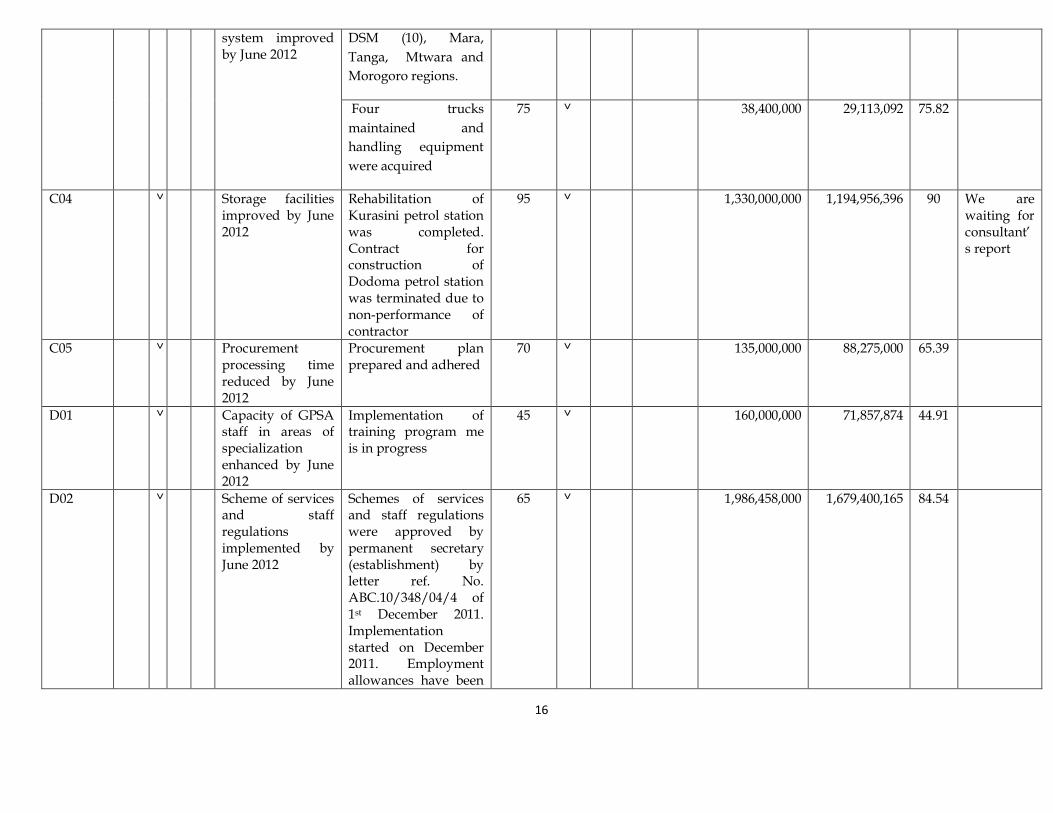
16
system improved by June 2012
DSM (10), Mara,
Tanga, Mtwara and
Morogoro regions.
Four trucks
maintained and
handling equipment
were acquired
75 ˅ 38,400,000 29,113,092 75.82
C04 ˅ Storage facilities improved by June 2012
Rehabilitation of Kurasini petrol station was completed. Contract for construction of Dodoma petrol station was terminated due to non-performance of contractor
95 ˅ 1,330,000,000 1,194,956,396 90 We are waiting for consultant’s report
C05 ˅ Procurement processing time reduced by June 2012
Procurement plan prepared and adhered
70 ˅ 135,000,000 88,275,000 65.39
D01 ˅ Capacity of GPSA staff in areas of specialization enhanced by June 2012
Implementation of training program me is in progress
45 ˅ 160,000,000 71,857,874 44.91
D02 ˅ Scheme of services and staff regulations implemented by June 2012
Schemes of services and staff regulations were approved by permanent secretary (establishment) by letter ref. No. ABC.10/348/04/4 of 1st December 2011. Implementation started on December 2011. Employment allowances have been
65 ˅ 1,986,458,000
1,679,400,165
84.54
17
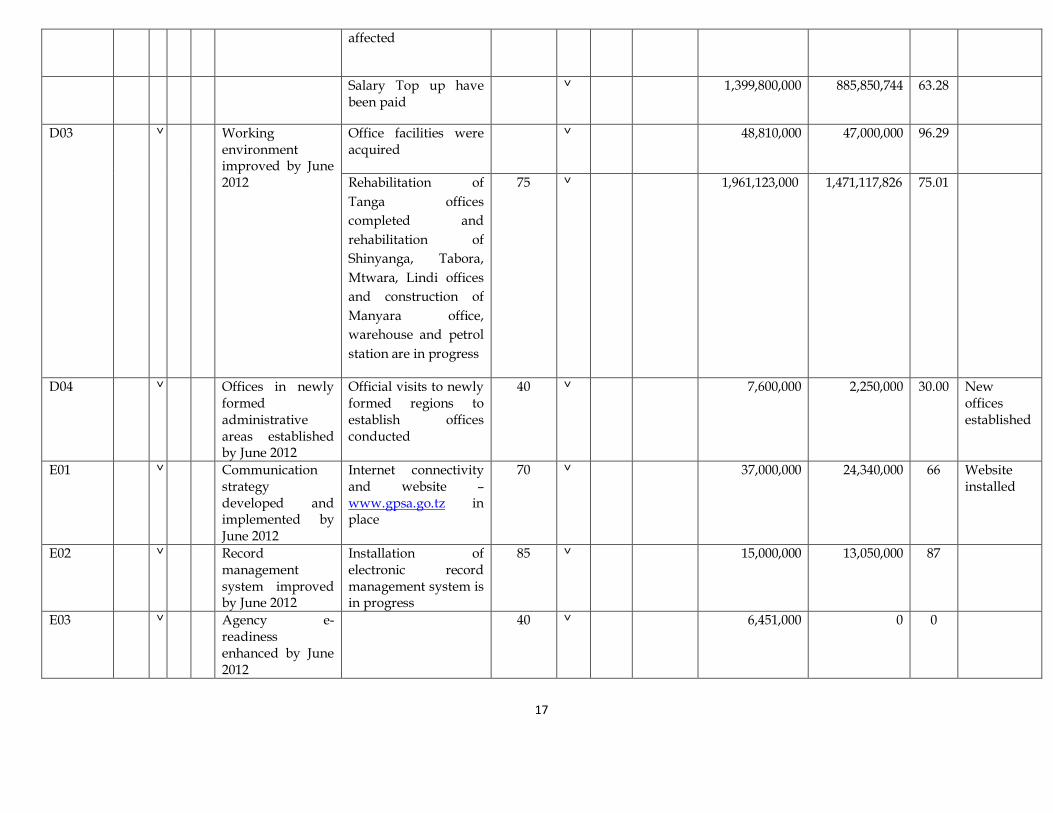
affected
Salary Top up have been paid
˅
1,399,800,000 885,850,744 63.28
D03 ˅ Working environment improved by June 2012
Office facilities were acquired
˅
48,810,000
47,000,000
96.29
Rehabilitation of
Tanga offices
completed and
rehabilitation of
Shinyanga, Tabora,
Mtwara, Lindi offices
and construction of
Manyara office,
warehouse and petrol
station are in progress
75 ˅ 1,961,123,000 1,471,117,826 75.01
D04 ˅ Offices in newly formed administrative areas established by June 2012
Official visits to newly formed regions to establish offices conducted
40 ˅ 7,600,000 2,250,000 30.00 New offices established
E01 ˅ Communication strategy developed and implemented by June 2012
Internet connectivity and website – www.gpsa.go.tz in place
70 ˅ 37,000,000 24,340,000 66 Website installed
E02 ˅ Record management system improved by June 2012
Installation of electronic record management system is in progress
85 ˅ 15,000,000 13,050,000 87
E03 ˅ Agency e-readiness enhanced by June 2012
40 ˅ 6,451,000 0 0
18
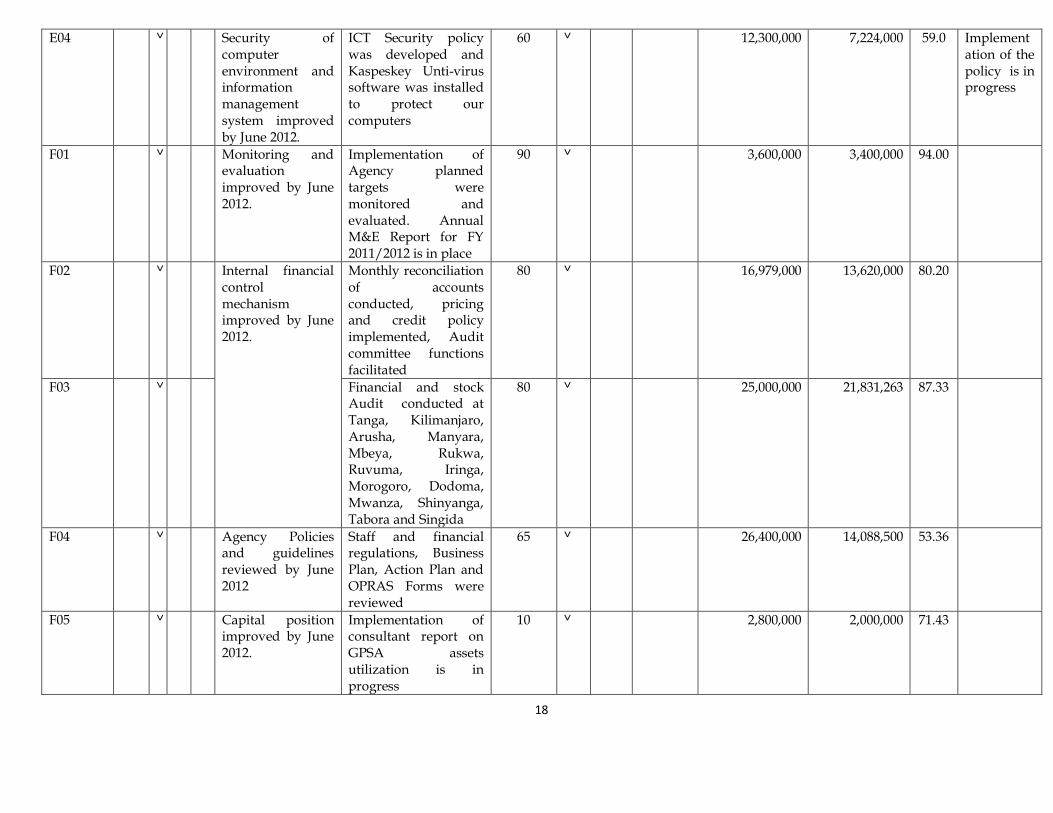
E04 ˅ Security of computer environment and information management system improved by June 2012.
ICT Security policy was developed and Kaspeskey Unti-virus software was installed to protect our computers
60 ˅ 12,300,000 7,224,000 59.0 Implementation of the policy is in progress
F01 ˅ Monitoring and evaluation improved by June 2012.
Implementation of Agency planned targets were monitored and evaluated. Annual M&E Report for FY 2011/2012 is in place
90 ˅ 3,600,000 3,400,000 94.00
F02 ˅ Internal financial control mechanism improved by June 2012.
Monthly reconciliation of accounts conducted, pricing and credit policy implemented, Audit committee functions facilitated
80 ˅ 16,979,000 13,620,000 80.20
F03 ˅ Financial and stock Audit conducted at Tanga, Kilimanjaro, Arusha, Manyara, Mbeya, Rukwa, Ruvuma, Iringa, Morogoro, Dodoma, Mwanza, Shinyanga, Tabora and Singida
80 ˅ 25,000,000 21,831,263 87.33
F04 ˅ Agency Policies and guidelines reviewed by June 2012
Staff and financial regulations, Business Plan, Action Plan and OPRAS Forms were reviewed
65 ˅ 26,400,000 14,088,500 53.36
F05 ˅ Capital position improved by June 2012.
Implementation of consultant report on GPSA assets utilization is in progress
10 ˅ 2,800,000 2,000,000 71.43
19
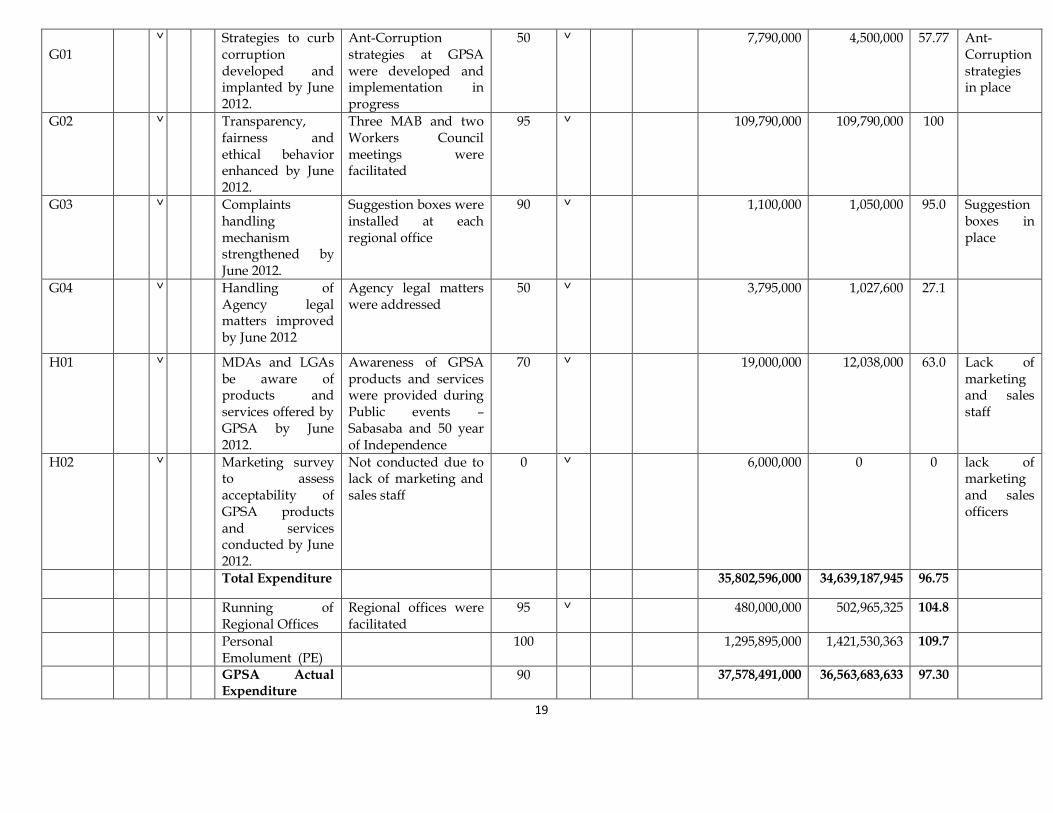
G01
˅ Strategies to curb corruption developed and implanted by June 2012.
Ant-Corruption strategies at GPSA were developed and implementation in progress
50 ˅ 7,790,000 4,500,000 57.77 Ant-Corruption strategies in place
G02 ˅ Transparency, fairness and ethical behavior enhanced by June 2012.
Three MAB and two Workers Council meetings were facilitated
95 ˅ 109,790,000 109,790,000 100
G03 ˅ Complaints handling mechanism strengthened by June 2012.
Suggestion boxes were installed at each regional office
90 ˅ 1,100,000 1,050,000 95.0 Suggestion boxes in place
G04 ˅ Handling of Agency legal matters improved by June 2012
Agency legal matters were addressed
50 ˅ 3,795,000 1,027,600 27.1
H01 ˅ MDAs and LGAs be aware of products and services offered by GPSA by June 2012.
Awareness of GPSA products and services were provided during Public events – Sabasaba and 50 year of Independence
70 ˅ 19,000,000 12,038,000 63.0 Lack of marketing and sales staff
H02 ˅ Marketing survey to assess acceptability of GPSA products and services conducted by June 2012.
Not conducted due to lack of marketing and sales staff
0 ˅ 6,000,000 0 0 lack of marketing and sales officers
Total Expenditure 35,802,596,000 34,639,187,945 96.75
Running of Regional Offices
Regional offices were facilitated
95 ˅ 480,000,000 502,965,325 104.8
Personal Emolument (PE)
100 1,295,895,000 1,421,530,363 109.7
GPSA Actual Expenditure
90 37,578,491,000 36,563,683,633 97.30
20
MEF 7.2
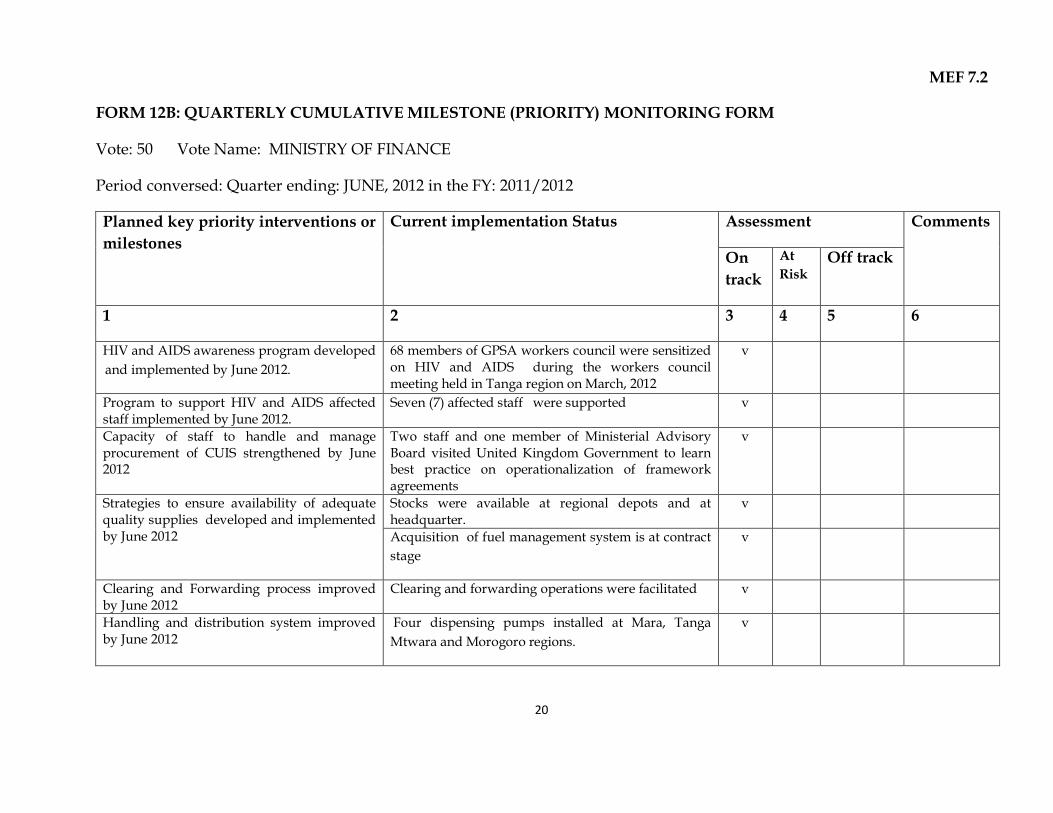
FORM 12B: QUARTERLY CUMULATIVE MILESTONE (PRIORITY) MONITORING FORM
Vote: 50 Vote Name: MINISTRY OF FINANCE
Period conversed: Quarter ending: JUNE, 2012 in the FY: 2011/2012
Planned key priority interventions or
milestones
Current implementation Status Assessment Comments
On
track
At
Risk Off track
1 2 3 4 5 6
HIV and AIDS awareness program developed
and implemented by June 2012.
68 members of GPSA workers council were sensitized on HIV and AIDS during the workers council meeting held in Tanga region on March, 2012
v
Program to support HIV and AIDS affected staff implemented by June 2012.
Seven (7) affected staff were supported v
Capacity of staff to handle and manage procurement of CUIS strengthened by June 2012
Two staff and one member of Ministerial Advisory Board visited United Kingdom Government to learn best practice on operationalization of framework agreements
v
Strategies to ensure availability of adequate quality supplies developed and implemented by June 2012
Stocks were available at regional depots and at headquarter.
v
Acquisition of fuel management system is at contract
stage
v
Clearing and Forwarding process improved by June 2012
Clearing and forwarding operations were facilitated v
Handling and distribution system improved by June 2012
Four dispensing pumps installed at Mara, Tanga
Mtwara and Morogoro regions.
v
21
Four trucks maintained and handling equipment
were acquired
v
Storage facilities improved by June 2012 Rehabilitation of Kurasini petrol station was completed. Contract for construction of Dodoma petrol station was terminated due to non-performance of contractor
v
Capacity of GPSA staff in areas of specialization enhanced by June 2012
Implementation of training program me is in progress v
Scheme of services and staff regulations implemented by June 2012
Schemes of services and staff regulations were approved by permanent secretary (establishment) by letter ref. No. ABC.10/348/04/4 of 1st December 2011. Implementation started on December 2011 and employment allowances have been affected
v
Working environment improved by June 2012 Rehabilitation of Tanga offices completed and rehabilitation of Shinyanga, Tabora, Mtwara, Lindi offices and construction of Manyara office, warehouse and petrol station are in progress
v
Offices in newly formed administrative areas established by June 2012
Official visits to newly formed regions to establish offices conducted
v
Communication strategy developed and implemented by June 2012
Internal connectivity and website – www.gpsa.go.tz in place
v
Security of computer environment and information management system improved by June 2012.
ICT Security policy was developed and Kaspeskey Unti-virus software was installed to protect GPSA computers
v
Monitoring and evaluation improved by June 2012.
Implementation of Agency planned targets were monitored and evaluated. Annual M&E Report for FY 2011/2012 is in place
v
Internal financial control mechanism improved by June 2012.
Monthly reconciliation of accounts conducted, pricing and credit policy implemented, Audit committee functions facilitated
v
Financial and stock Audit conducted at Tanga, Kilimanjaro, Arusha, Manyara, Mbeya, Rukwa, Ruvuma, Iringa, Morogoro, Dodoma, Mwanza, Shinyanga, Tabora and Singida
v
Agency Policies and guidelines reviewed by June 2012
Staff regulations, financial regulations, Business Plan, Action Plan and OPRAS Forms were reviewed
v
Capital position improved by June 2012. Implementation of consultant report on GPSA assets utilization is in progress
v
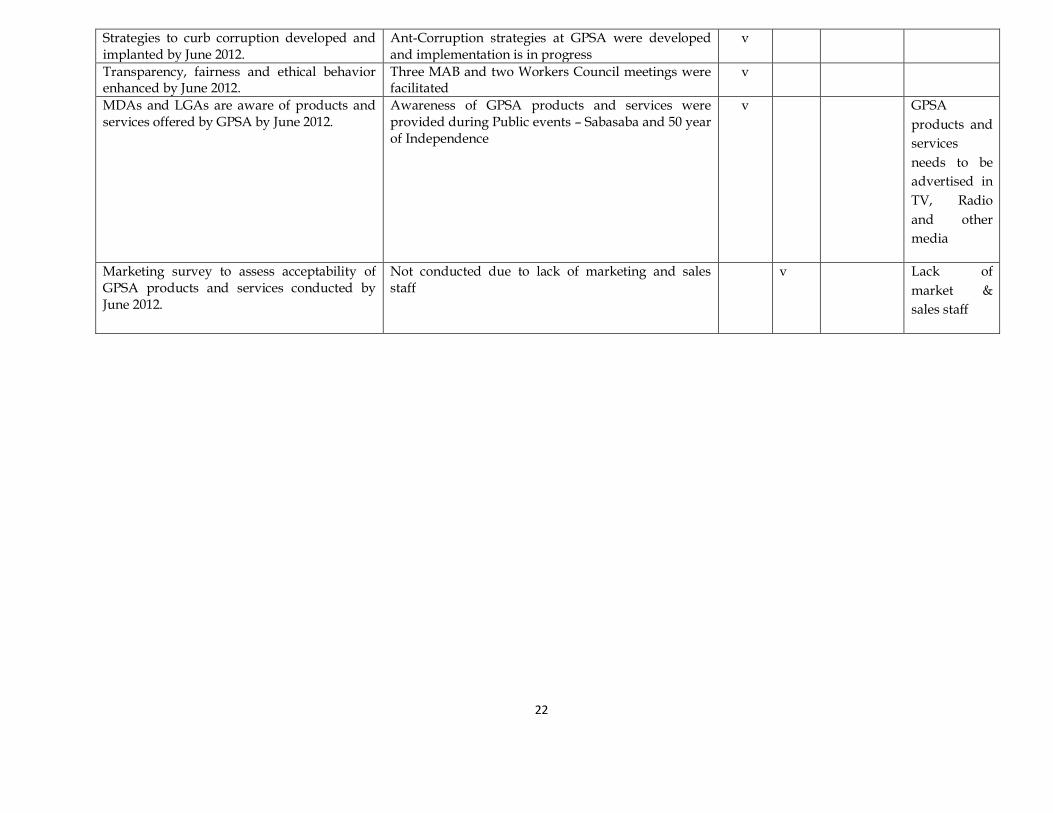
22
Strategies to curb corruption developed and implanted by June 2012.
Ant-Corruption strategies at GPSA were developed and implementation is in progress
v
Transparency, fairness and ethical behavior enhanced by June 2012.
Three MAB and two Workers Council meetings were facilitated
v
MDAs and LGAs are aware of products and services offered by GPSA by June 2012.
Awareness of GPSA products and services were provided during Public events – Sabasaba and 50 year of Independence
v GPSA
products and
services
needs to be
advertised in
TV, Radio
and other
media
Marketing survey to assess acceptability of GPSA products and services conducted by June 2012.
Not conducted due to lack of marketing and sales staff
v Lack of
market &
sales staff
23
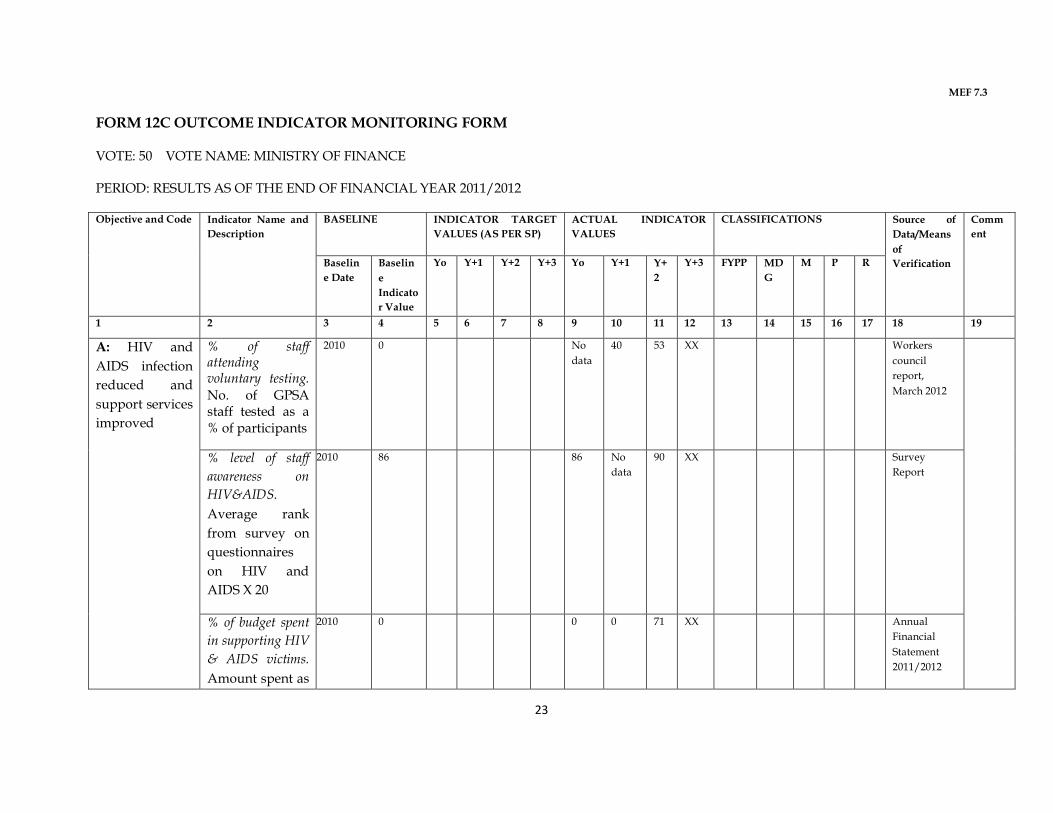
MEF 7.3
FORM 12C OUTCOME INDICATOR MONITORING FORM
VOTE: 50 VOTE NAME: MINISTRY OF FINANCE
PERIOD: RESULTS AS OF THE END OF FINANCIAL YEAR 2011/2012
Objective and Code Indicator Name and
Description
BASELINE INDICATOR TARGET
VALUES (AS PER SP)
ACTUAL INDICATOR
VALUES
CLASSIFICATIONS Source of
Data/Means
of
Verification
Comm
ent
Baselin
e Date
Baselin
e
Indicato
r Value
Yo Y+1 Y+2 Y+3 Yo Y+1 Y+
2
Y+3 FYPP MD
G
M P R
1 2 3 4 5 6 7 8 9 10 11 12 13 14 15 16 17 18 19
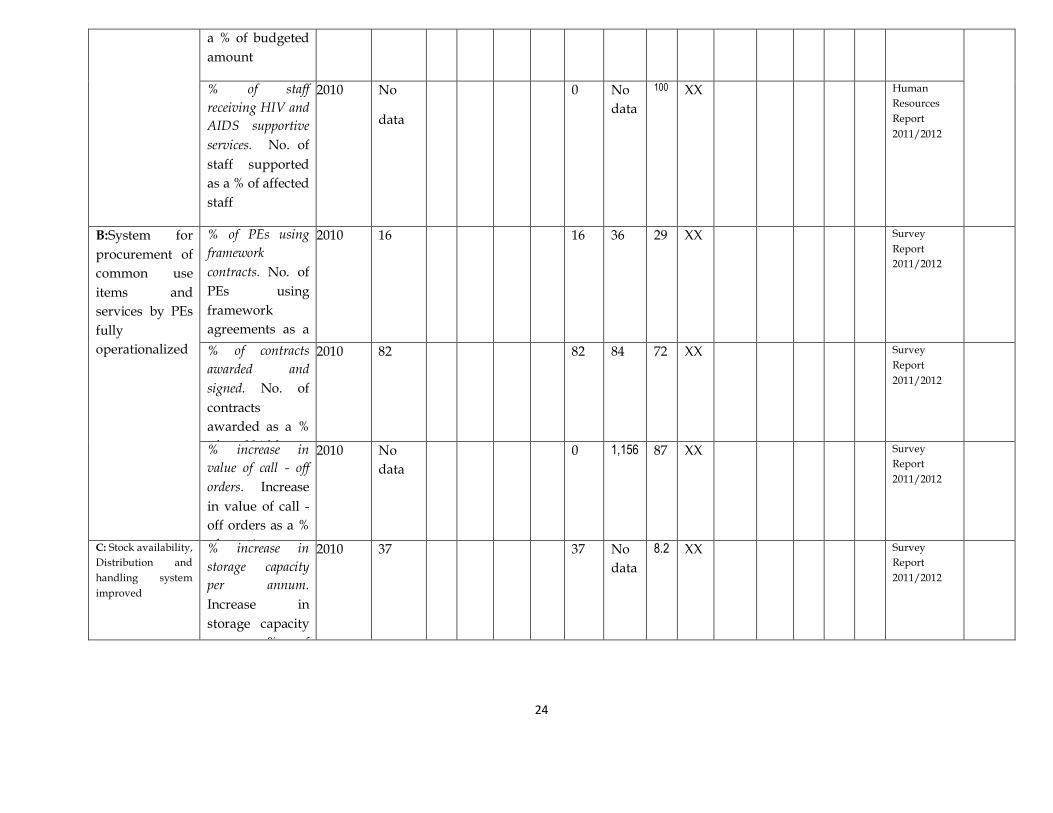
A: HIV and
AIDS infection
reduced and
support services
improved
% of staff attending voluntary testing.
No. of GPSA staff tested as a % of participants
2010 0 No
data
40 53 XX Workers
council
report,
March 2012
% level of staff
awareness on
HIV&AIDS.
Average rank
from survey on
questionnaires
on HIV and
AIDS X 20
2010 86 86 No
data
90 XX Survey
Report
% of budget spent
in supporting HIV
& AIDS victims.
Amount spent as
2010 0 0 0 71 XX Annual
Financial
Statement
2011/2012
24
a % of budgeted
amount
% of staff
receiving HIV and
AIDS supportive
services. No. of
staff supported
as a % of affected
staff
2010 No
data
0 No
data
100 XX Human
Resources
Report
2011/2012
B:System for
procurement of
common use
items and
services by PEs
fully
operationalized
% of PEs using
framework
contracts. No. of
PEs using
framework
agreements as a
% of total PEs.
2010 16 16 36 29 XX Survey
Report
2011/2012
% of contracts
awarded and
signed. No. of
contracts
awarded as a %
of total bidders
2010 82 82 84 72 XX Survey
Report
2011/2012
% increase in
value of call - off
orders. Increase
in value of call -
off orders as a %
of previous year
call -off orders
2010 No
data
0 1,156 87 XX Survey
Report
2011/2012
C: Stock availability,
Distribution and
handling system
improved
% increase in
storage capacity
per annum.
Increase in
storage capacity
as a % of
previous year
capacity
2010 37 37 No
data
8.2 XX Survey
Report
2011/2012
25
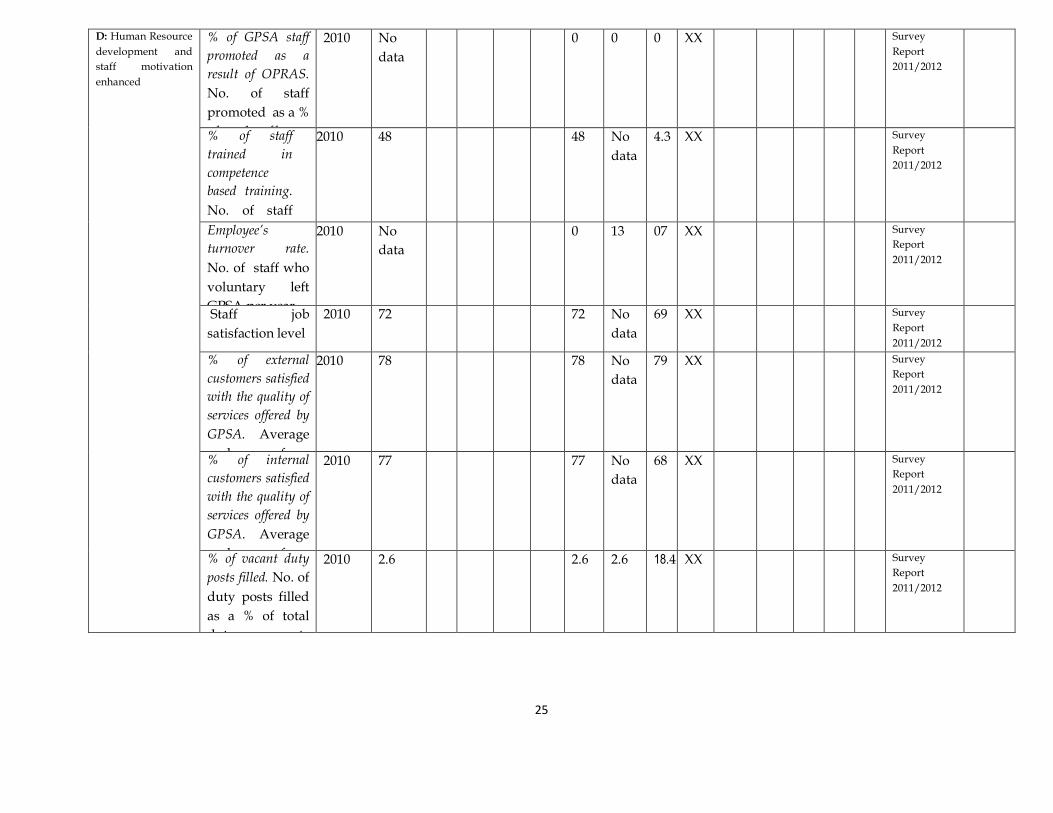
D: Human Resource
development and
staff motivation
enhanced
% of GPSA staff
promoted as a
result of OPRAS.
No. of staff
promoted as a %
of total staff
2010 No
data
0 0 0 XX Survey
Report
2011/2012
% of staff
trained in
competence
based training.
No. of staff
trained as a %
planned staff
2010 48 48 No
data
4.3 XX Survey
Report
2011/2012
Employee’s
turnover rate.
No. of staff who
voluntary left
GPSA per year
2010 No
data
0 13 07 XX Survey
Report
2011/2012
Staff job
satisfaction level
2010 72 72 No
data
69 XX Survey
Report
2011/2012
% of external
customers satisfied
with the quality of
services offered by
GPSA. Average
rank from
survey*20
2010 78 78 No
data
79 XX Survey
Report
2011/2012
% of internal
customers satisfied
with the quality of
services offered by
GPSA. Average
rank from
survey*20
2010 77 77 No
data
68 XX Survey
Report
2011/2012
% of vacant duty
posts filled. No. of
duty posts filled
as a % of total
duty posts
vacancies
2010 2.6 2.6 2.6 18.4 XX Survey
Report
2011/2012
26
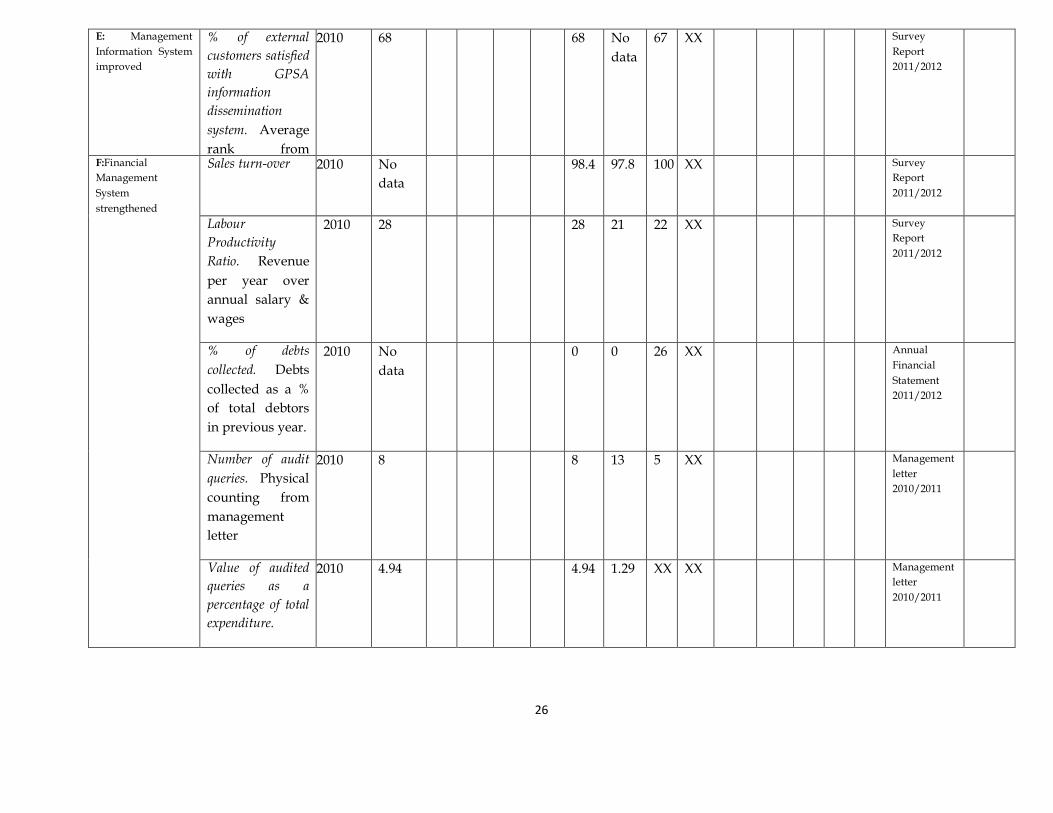
E: Management
Information System
improved
% of external
customers satisfied
with GPSA
information
dissemination
system. Average
rank from
survey* 20
2010 68 68 No
data
67 XX Survey
Report
2011/2012
F:Financial
Management
System
strengthened
Sales turn-over 2010 No
data
98.4 97.8 100 XX Survey
Report
2011/2012
Labour
Productivity
Ratio. Revenue
per year over
annual salary &
wages
2010 28 28 21 22 XX Survey
Report
2011/2012
% of debts
collected. Debts
collected as a %
of total debtors
in previous year.
2010 No
data
0 0 26 XX Annual
Financial
Statement
2011/2012
Number of audit
queries. Physical
counting from
management
letter
2010 8 8 13 5 XX Management
letter
2010/2011
Value of audited
queries as a
percentage of total
expenditure.
2010 4.94 4.94 1.29 XX XX Management
letter
2010/2011
27
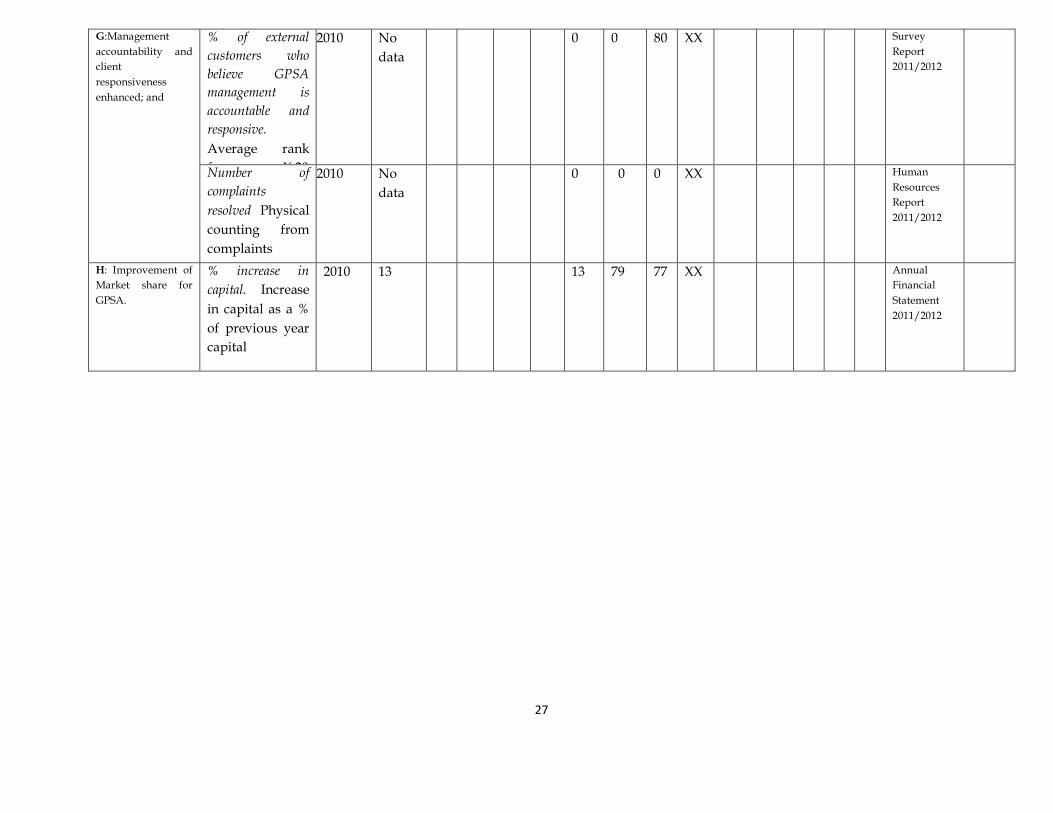
G:Management
accountability and
client
responsiveness
enhanced; and
% of external
customers who
believe GPSA
management is
accountable and
responsive.
Average rank
from survey X 20
2010 No
data
0 0 80 XX Survey
Report
2011/2012
Number of
complaints
resolved Physical
counting from
complaints
register
2010 No
data
0 0 0 XX Human
Resources
Report
2011/2012
H: Improvement of
Market share for
GPSA.
% increase in
capital. Increase
in capital as a %
of previous year
capital
2010 13 13 79 77 XX Annual
Financial
Statement
2011/2012
28
MEF 7.4(a) FORM 13A QIARTERLY; CUMULATIVE FINANCIAL OVERVIEW FORM VOTE: 50 VOTE NAME: MINISTRY OF FINANCE PERIOD CUMULATIVE RESULTS FOR THE QUARTER ENDING JUNE, 2012 IN THE FINANCIAL YEAR 2011/2012
ITEM/COMPOSITION BUDGET RELEASED ACTUAL EXPENDITURE
Amount
in TShs
(millions)
% of Total Amount in
TShs
(millions)
Amount Released as a
% of the Budget
Amount (4 /2)
Amounting in
TShs (Millions)
Actual Value as a %
of the Budget
amount (6/2)
% of
Total
1 2 3 4 5 6 7 8
EXPENDITURE BY BUDGET
CATEGORY
P.E 1,296 3.45 1,451 111.96 1,422 109.72 3.45
O.C - Subvention 1,227 3.27 869 70.82 869 70.82 3.27
- Own Source 35,055 93.29 34,273 97.77 34,273 97.77 93.29
Development Local Fund 0 0 0 0 0 0 0
Development Foreign Funds 0 0 0 0 0 0 0
Total 37,578 100 36,593 97.38 36,564 97.30 100%
EXPENDITURE BY FYDP I
CATEGORY (Excludes PE)
FYDP 1 Strategic projects 0
FYDP 1 Other projects 0
Total 0 100 100%
EXPENDITURE BY FYDP I
CATEGORY (Excludes PE)
MKUKUTA II
NON-MKUKUTA II
Total 100 100%
EXPENDITURE BY MKUKUTAN II
CLUSTERS (Exclusive PE)
Cluster 1
Cluster 2
Cluster 3
Total 100 100%
Note:This report should be printed from the integrated financial management system (IFMS)
29
MEF 7.4 (b) (b) FORM 13B: QUALITERLY CUMULATIVE DETAILED FORMS PERIOD: CUMMULATIVE FOR THE QUARTER ENDING: JUNE, 2012 IN FY 2011/2012
ITEM/COMPOSITION BUDGET RELEASED ACTUAL REVENUE/EXPENDITURE
Amount in
TShs
(Million)
% of Total Amount in
TShs
(Million)
Amount
Released as % of
the Budget
Amount (4/ 2)
Amount in
TShs
(Million)
Actual Value as a
% of the Budget
Amount (6/2)
% of Total
1 2 3 4 5 6 7 8
EXPENDITURE BY SUB-VOTE (Recurrent Only)
Sub-vote 1003
Subvention (PE + OC) 2,523 6.71 2,320 91.95 2,291 90.80 6.71
Own Sources 35,055 93.29 34,273 91.20 34,273 91.20 93.29 Total 37,578 100.00 36,593 97.38 36,564 97.30 100%
EXPENDITURE BY SUB-VOTE BY PROJECT (Development Funds only
Sub-vote 1003
Project 1 0.00 0.00 0.00 0.00 0.00 0.00 0.00
Project 2 0.00 0.00 0.00 0.00 0.00 0.00 0.00
Total 0.00 0.00
REVENUES (NON-TAX) COLLECTION
Revenue Collected
Revenue Retained
SOURCE OF FUNDING (LGAs and Agencies ONLY
Subvention 2,523 6.70 2,290 90.76 2,290 90.76 6.48
Own Sources 35,120 93.30 34,216 97.43 34,216 93.95 93.52 Total 37,643 100.00 36,506 96.98 36,506 96.98 100%
Notes: this report should be printed from the integrated Financial Management System (IFMS)
I Submit
J. S. Mwambega Chief Executive Officer
Government Procurement Services Agency 30/09/2012
29
30
Appendix A: Staffing level and PE expenditure
Item No
Code No. Designation and Grade Description
Salary Scale TGS
Establishment Manning Level
Approved establishment Plan 2011/2012
Actual Expenditure 2011/2012
1 TZ3005 Chief Executive Officer TGS N 1 1 31,956,000
2 TZ3006 Directors TGS K 3 2 36,517,545
3 TZ3007 Head of Units TGS J 4 2 38,550,000
4 TZ3008 Section Managers TGS J 9 0 0
5 TZ3009 Regional Managers TGS J 25 0 0
6 TZ300152 Human Resource Officer II TGS D 3 2 10,706,400
7 TZ300147 Administrative Officer II TGS D 1 0 0
8 TZ200591 Legal Officer II TGS D 2 0 0
9 TZ200591 Principal Supplies Officer II TGS G 3 2 25,639,200
10 TZ300590 Senior Supplies Officer TGS F 25 24 226,540,000
11 TZ300591 Supplies Officer I TGS E 26 15 115,769,280
12 TZ300592 Supplies Officer II TGS D 47 43 226,587,600
13 TZ500590 Supplies Assistant TGS C 35 21 67,875,600
14 TZ300760 Principal Accountant I TGS H 1 0 0
15 TZ300761 Principal Accountant II TGS G 1 1 13,568,400
16 TZ300760 Senior Accountant TGS F 2 2 20,666,400
17 TZ300761 Accountant I TGS E 2 1 7,950,000
18 TZ300762 Accountant II TGS D 25 19 105,058,800
19 TZ300760 Assistant Accountant TGS C 14 7 26,451,600
20 TZ300761 Accounts Assistant TGS B 33 28 85,988,800
21 TZ300792 Internal Auditor II TGS D 4 1 5,461,200
22 TZ300782 Computer Systems Analyst II TGS D 2 0 0
23 TZ300783 Computer Systems Administrator II
TGS D 2 0 8,820,000
24 TZ500774 Assistant Computer operator TGS B 3 0 0
25 TZ500775 Transport Officer II TGS C 1 0 0
26 TZ700537 Driver II TGOS A 23 17 32,842,600
27 TZ700202 Office Assistant TGOS A 18 18 61,584,000
28 TZ700202 Assistant Security Officer TGS B 7 7 20,731,200
29 TZ700202 Security Guard TGOS A 65 40 94,921,138
30 TZ500212 Senior Records Management Asst
TGS D 1 1 5,677,200
31 TZ500213 Records Management Assistant I
TGS C 5 3 15,508,800
32 TZ500214 Records Management TGS B 18 14 42,129,600
31
Assistant II
33 TZ500192 Personal Secretary I TGS D 2 2 10,408,200
34 TZ500194 Personal Secretary III TGS B 28 23 65,168,400
35 TZ500172 Telephone Operator II TGS B 3 3 8,155,200
36 TZ500601 Trade Officer II TGS D 1 0 0
37 TZ500602 Planning Officer II TGS D 1 0 0
38 TZ500603 Civil Technician II TGS D 1 0 0
39 TZ500603 Electrical Technician II TGS D 1 0 0
40 TZ500604 Mechanical Technician II TGS C 1 1 4,173,600
41 TZ500934 Assistant Technician TGS A 1 1 2,176,800
42 TZ700887 Medical Attendant II TGOS C 0 1 3,946,800
Sub - Total 450 303 1,421,530,363
Salary Top Up
303 885,850,744
Total
303 2,307,381,107
32
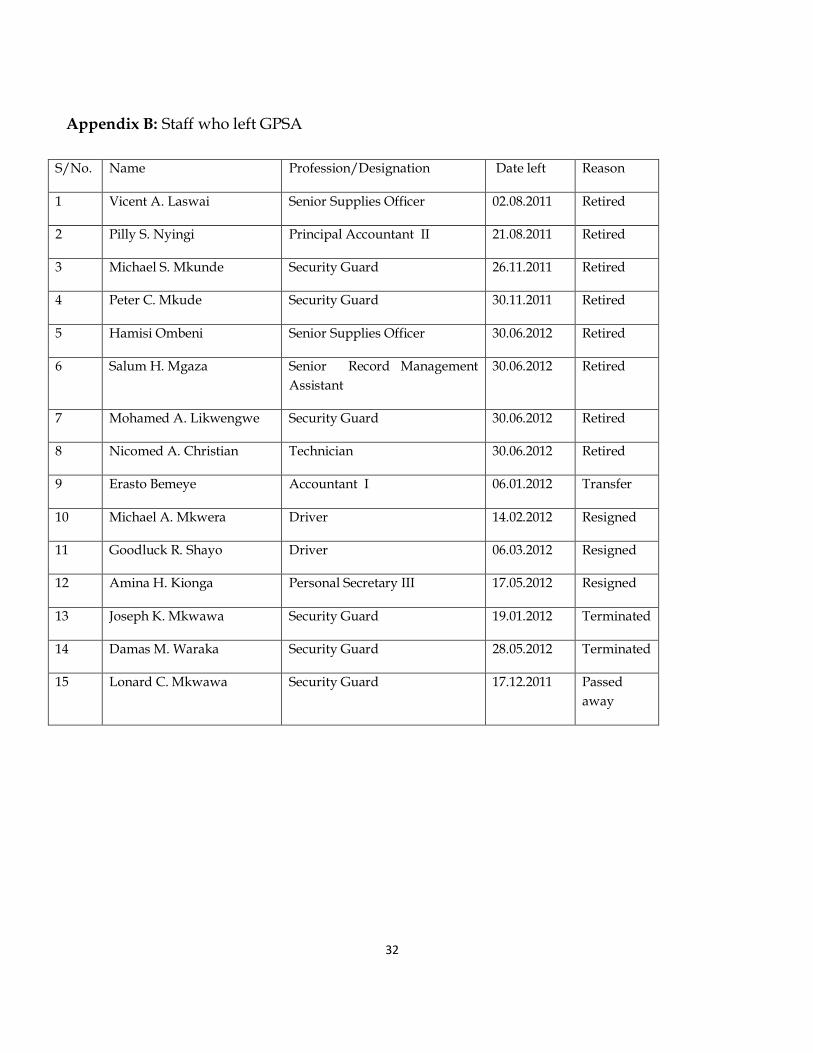
Appendix B: Staff who left GPSA
S/No. Name Profession/Designation Date left Reason
1 Vicent A. Laswai Senior Supplies Officer 02.08.2011 Retired
2 Pilly S. Nyingi Principal Accountant II 21.08.2011 Retired
3 Michael S. Mkunde Security Guard 26.11.2011 Retired
4 Peter C. Mkude Security Guard 30.11.2011 Retired
5 Hamisi Ombeni Senior Supplies Officer 30.06.2012 Retired
6 Salum H. Mgaza Senior Record Management
Assistant
30.06.2012 Retired
7 Mohamed A. Likwengwe Security Guard 30.06.2012 Retired
8 Nicomed A. Christian Technician 30.06.2012 Retired
9 Erasto Bemeye Accountant I 06.01.2012 Transfer
10 Michael A. Mkwera Driver 14.02.2012 Resigned
11 Goodluck R. Shayo Driver 06.03.2012 Resigned
12 Amina H. Kionga Personal Secretary III 17.05.2012 Resigned
13 Joseph K. Mkwawa Security Guard 19.01.2012 Terminated
14 Damas M. Waraka Security Guard 28.05.2012 Terminated
15 Lonard C. Mkwawa Security Guard 17.12.2011 Passed
away