Embed Size (px)
Citation preview
1
The University of Chicago Law Review
Volume 79 Winter 2012 Number 1
© 2012 by The University of Chicago
SYMPOSIUM
Making Courts Matter: Politics and the Implementation of State Supreme Court Decisions
Christopher Berry† & Charles Wysong††
INTRODUCTION
From Alexander Hamilton’s “least dangerous branch”1 to Gerald Rosenberg’s “hollow hope,”2 the ability of courts to bring about important policy change has long been the subject of controversy. Indeed, even as the success of the new institutionalism in the 1980s and 1990s has transformed “institutions matter” from a battle cry into an aphorism, the idea that courts matter still encounters a line of resistance that has long since fallen away from other branches of American government. If Rosenberg is extreme in his contention that “U.S. courts can almost never be effective producers of significant social reform,”3 his point of view is shared by other scholars who allow the courts only limited or indirect credit for important policy reforms or suggest that court decisions merely ratify the prevailing
† Associate Professor, Harris School of Public Policy, University of Chicago. †† JD 2012, Stanford Law School. The research presented in this article was previously summarized in Christopher Berry and Charles Wysong, School-Finance Reform in Red and Blue, 10 Educ Next 63 (Summer 2010), online at http://educationnext.org/files/EdNext_20103_62.pdf (visited Oct 24, 2011).
1 Federalist 78 (Hamilton), in The Federalist 521, 522 (Wesleyan 1961) (Jacob E. Cooke, ed). 2 See generally Gerald N. Rosenberg, The Hollow Hope: Can Courts Bring About Social
Change? (Chicago 1991).
3 Id at 338.
2 The University of Chicago Law Review [79:1
views of the governing elite.4 While the ranks of such revisionists appear to be growing, however, they remain opposed and outnumbered by those maintaining the traditional view of the courts as, in Justice Hugo Black’s words, “havens of refuge for those who might otherwise suffer because they are helpless, weak, outnumbered,” or otherwise vulnerable to majority tyranny.5
Whether the United States courts have, in fact, made important contributions to social change is ultimately an empirical question, not a matter of legal theory. Yet, even when examining the same facts on the ground, the two sides of this debate often reach opposing conclusions.6 Nowhere is this divergence more apparent than in the burgeoning literature evaluating the importance of Brown v Board of Education,7 where one can find scholars arguing that the Court made virtually no contribution to civil rights or school desegregation,8 others arguing that the case made a pivotal contribution in these areas and to United States history more generally,9 as well as those in between assigning the Court an important but more modest role.10
4 See, for example, Michael J. Klarman, Rethinking the Civil Rights and Civil Liberties
Revolutions, 82 Va L Rev 1, 7–18 (1996); Cornell W. Clayton and J. Mitchell Pickerill, The
Politics of Criminal Justice: How the New Right Regime Shaped the Rehnquist Court’s Criminal
Justice Jurisprudence, 94 Georgetown L J 1385, 1411–23 (2006); Michael J. Klarman, How
Great Were the “Great” Marshall Court Decisions?, 87 Va L Rev 1111, 1113–53, 1181–82 (2001); Robert G. McCloskey, The American Supreme Court 13–25, 224–29 (Chicago 1960); Robert A.
Dahl, Decision-Making in a Democracy: The Supreme Court as a National Policy-Maker, 6 J Pub L 279, 284–86 (1957). 5 Chambers v Florida, 309 US 227, 241 (1940). For explicit responses to the revisionist
critique, see, for example, Michael McCann, How the Supreme Court Matters in American
Politics: New Institutionalist Perspectives, in Howard Gillman and Cornell Clayton, eds, The
Supreme Court in American Politics 63, 63–76 (Kansas 1999); James F. Spriggs II, The Supreme
Court and Federal Administrative Agencies: A Resource-Based Theory and Analysis of Judicial
Impact, 40 Am J Pol Sci 1122, 1123–32, 1137–43 (1996). See also generally, for example, David J. Garrow, Hopelessly Hollow History: Revisionist Devaluing of Brown v. Board of Education,
80 Va L Rev 151 (1994). 6 For a collection of essays debating consequences of Supreme Court decisions, see generally David A. Schultz, ed, Leveraging the Law: Using the Courts to Achieve Social Change
(Peter Lang 1998). 7 347 US 483 (1954). 8 See, for example, Rosenberg, Hollow Hope at 70 (cited in note 2); Gerald N. Rosenberg, Brown Is Dead! Long Live Brown! The Endless Attempt to Canonize a Case, 80 Va L Rev 161, 163–67, 171 (1994). 9 See, for example, Paul Finkelman, Book Review, Civil Rights in Historical Context: In
Defense of Brown, 118 Harv L Rev 973, 1017–29 (2005); Morton J. Horwitz, The Warren Court
and the Pursuit of Justice 15 (Hill & Wang 1998); Jack Greenberg, Crusaders in the Courts:
How a Dedicated Band of Lawyers Fought for the Civil Rights Revolution 264–362 (Basic
Books 1994). 10 See, for example, Michael J. Klarman, Brown, Racial Change, and the Civil Rights
Movement, 80 Va L Rev 7, 10–11 (1994); Mark Tushnet, Some Legacies of Brown v. Board of Education, 90 Va L Rev 1693, 1693–96, 1705–20 (2004).
2012] Making Courts Matter 3
Little progress is likely to be made in this area by continuing to rehash the same small set of “landmark” Supreme Court decisions. The focus on singular court decisions has yielded fascinating historical case studies but little in the way of generalizable empirical evidence on the role of courts in the policymaking process. This Article shifts the spotlight to state supreme courts, where the operation of fifty institutionally comparable policymaking processes provides an ideal laboratory for studying when and how court rulings affect outcomes. A movement to reform school funding has spread through the state court systems, producing dozens of similar cases over thirty-five years. Because court-based education funding reforms are both widespread and relatively homogenous in goals and methods, they provide an excellent setting in which to empirically explore the ability of courts to enact social change. Comparing changes in funding between states where the funding system was ruled unconstitutional with those where it was not, as well as exploiting variation in the timing of the decisions, allows us to make a statistical, rather than anecdotal, assessment of the courts’ impact.
Part II of this Article briefly introduces the legal framework and background of school-finance judgments (SFJs) and surveys the social science literature on SJF outcomes. Part III explains the data and statistical strategy employed by this Article. Parts IV through VI present the basic findings, evidence of a partisan impact on SFJ outcomes, and the robustness of our results. In sum, our analysis challenges the idea that courts are ineffectual in initiating policy change, while providing some of the first quantitative evidence that implementation is contingent on interactions between courts and other political institutions.
I. BACKGROUND AND RELATED LITERATURE
The 1973 case of San Antonio Independent School District v Rodriguez11 closed the door on education-finance reform through the federal courts and directed plaintiffs to look to their respective state constitutions for relief.12 Most state constitutions contain education clauses that require the state to provide an “adequate education” or a “thorough and efficient” education for all children,13 and plaintiffs have relied on these provisions in seeking increases in the financial
11 411 US 1 (1973).
12 Id at 58–59. 13 See John C. Eastman, Reinterpreting the Education Clauses in State Constitutions, in Martin R. West and Paul E. Peterson, eds, School Money Trials: The Legal Pursuit of
Educational Adequacy 55–64 (Brookings 2007).
4 The University of Chicago Law Review [79:1
resources devoted to public schools.14 Although the legal theories and details vary from case to case, the goal of school-finance lawsuits is to improve public education by directing additional financial resources to underperforming and low-income schools.
Beginning with California’s Serrano v Priest15 in 1971, and spurred by the Rodriguez decision, the constitutionality of school-finance systems across the states has been under attack for nearly forty years. By 2005, education reform advocates had filed 139 separate lawsuits in 45 states challenging their education funding systems on constitutional grounds.16 In 28 of these states, the school-financing system has been ruled unconstitutional in one or more court challenges.17
While school-finance lawsuits have attracted significant attention in the legal community18 and a variety of state-specific studies have been produced,19 nationwide empirical studies of the effects of school-finance judgments (SFJs) have been relatively few. Existing nationwide analyses suggest SFJs have reduced within-state spending inequality by increasing state-financed education spending for poor districts.20 Though many states do not reduce support for the richest districts,21 the progressive increase in funding helps narrow the gap in total spending between the richest and poorest districts.22 One group of authors—Sheila Murray, William Evans, and Robert
14 For an up-to-date state-by-state catalog of school-funding lawsuits, see National Education Access Network, online at http://www.schoolfunding.info/ (visited Oct 24, 2011).
15 487 P2d 1241 (Cal 1971). 16 This data is based on West and Peterson, School Money Trials at 345–58 (cited in note 13). 17 “Equity” and “Adequacy” School Funding Liability Court Decisions (National Access
Network 2008), online at http://www.schoolfunding.info/litigation/equityandadequacytable.pdf (visited Oct 24, 2011). 18 See, for example, James E. Ryan and Thomas Saunders, Foreword to Symposium on
School Finance Litigation: Emerging Trends or Dead Ends?, 22 Yale L & Pol Rev 463, 468–80 (2004). 19 See, for example, William S. Koski, The Politics of Judicial Decision-Making in
Educational Policy Reform Litigation, 55 Hastings L J 1077, 1104–1227 (2004). 20 See, for example, Sheila E. Murray, William N. Evans, and Robert M. Schwab, Education-Finance Reform and the Distribution of Education Resources, 88 Am Econ Rev 789,
806 (1998) (examining data from 1972 to 1992 and finding inequality reduced by 19 to 34 percent). See also David Card and A. Abigail Payne, School Finance Reform, the Distribution of School
Spending, and the Distribution of Student Test Scores, 83 J Pub Econ 49, 64–67 (2002) (examining data from 1977 to 1992 and finding that “states in which the supreme court found the school financing system unconstitutional have altered their funding systems so as to redistribute aid to lower income districts”).
21 See Murray, Evans, and Schwab, 88 Am Econ Rev at 790 (cited in note 20). 22 See Card and Payne, 83 J Pub Econ at 49 (cited in note 20). David Card and Abigail Payne also demonstrate that only court decisions in which the school-financing system is found
unconstitutional affect spending, whereas cases in which a state’s system is challenged but upheld have no measurable effects, suggesting that the decision itself has a causal impact on funding. Id at 64. They also provide evidence that the equalization of spending resulting from SFJs leads to a narrowing of test scores across family background groups. Id at 76–79.
2012] Making Courts Matter 5
Schwab—argues that additional state funding for education resulting from SFJs was financed through higher taxes rather than shifting resources from other functions,23 although Katherine Baicker and Nora Gordon find roughly a dollar decrease in other state intergovernmental transfers to local government, for each dollar increase in state education spending.24 Card and Payne find that local governments also respond to increases in state education spending by reducing their own revenue and spending on education. In other words, there is evidence that localities “undo” state efforts at increasing education spending after SFJs. For each dollar of additional state aid for education, the net increase in total education funding is fifty to sixty-five cents, after local spending changes are taken into account.25
Researchers have also begun to explore variation among SFJ outcomes. Matthew Springer, Keke Liu, and James Guthrie,26 as well as Christopher Berry,27 attempt to differentiate the effects of equity- and adequacy-based SFJs on spending inequality. Prior to Rose v Council for Better Education,28 court challenges to school-finance systems rested on equity grounds.29 Rose, however, ushered in a series of recent cases challenging state funding systems on adequacy grounds.30 Although both equity and adequacy cases have usually been grounded in a demand to provide greater resources for poor students, adequacy cases acknowledge that resources may be distributed unequally, to the extent that high-needs students require
23 Murray, Evans, and Schwab, 88 Am Econ Rev at 807 (cited in note 20). 24 See generally Katherine Baicker and Nora Gordon, The Effect of State Education
Finance Reform on Total Local Resources, 90 J Pub Econ 1519 (2006) (examining county-level data from 1982 to 1997 estimating that SFJs result in a $48 per capita increase in state education spending, but a $51 per capita reduction in other intergovernmental transfers from the state).
25 Card and Payne, 83 J Pub Econ at 50 (cited in note 20) (noting that increases in state aid cause local governments to reduce taxes, generating a net increase of only fifty to sixty-five cents).
26 Matthew G. Springer, Keke Liu, and James W. Guthrie, The Impact of School Finance
Litigation on Resource Distribution: A Comparison of Court-Mandated Equity and Adequacy
Reforms?, 17 Educ Econ 421, 436–41 (2009). 27 Christopher Berry, The Impact of School Finance Judgments on State Fiscal Policy, in West and Peterson, eds, School Money Trials 213, 222–33 (cited in note 13). 28 790 SW2d 186 (Ky 1989).
29 See Koski, 55 Hastings L J at 1084–87 (cited in note 19). 30 See William S. Koski, The Evolving Role of the Courts in School Reform Twenty Years
after Rose, 98 Ky L J 789, 790–91 (2009). See generally, for example, Davis v South Dakota,
2011 WL 3849864 (SD); Connecticut Coalition for Justice in Education Funding, Inc v Rell, 990 A2d 206 (Conn 2008); Roosevelt Elementary School District No 66 v Bishop, 877 P2d 806 (Ariz 1994); Skeen v Minnesota, 505 NW2d 299 (Minn 1993); McDuffy v Secretary of Executive
Office of Education, 615 NE2d 516 (Mass 1993); Abbot v Burke, 575 A2d 359 (NJ 1990).
6 The University of Chicago Law Review [79:1
greater resources to obtain a satisfactory level of education.31 However, evidence so far does not demonstrate a statistically robust difference in the fiscal effects of equity and adequacy cases.32 Likewise, Caroline Hoxby explores variation in SFJ outcomes by abandoning the SFJ dummy-variable approach33 in favor of computing economically meaningful parameters of school-finance equalization plans on a state-by-state basis.34 She emphasizes that SFJs can have quite different effects depending on the price and income effects they impose, whereas the dummy-variable estimates capture at best the average effects. In the context of the present Article, Hoxby’s most important point is that the common SFJ dummy-variable approach masks significant heterogeneity in the experiences of different SFJs.35
In the remainder of this Article, we look to politics as one explanation for the heterogeneous effects of SFJs across states. We emphasize that a court’s ruling of the existing system as unconstitutional is only the first step toward reform. Some court orders provide instructions for how the legislature should fix the system, but most orders let state politicians provide the remedy by redesigning the finance system themselves.36 State leaders must then craft a new finance system that garners the approval of the state legislature and governor. Even after the court ruling, the reform must pass through the usual lawmaking process of the state. Therefore, even states with identical court rulings may end up with very different reforms depending on how the legislature and the governor respond to them. We investigate the relationship between political conditions and court impact by estimating models that allow the effects of an SFJ to vary depending on the partisan composition of the state government at the time of the ruling. While this approach captures only one of the many possible ways that politics
31 For a discussion of the different underlying conceptualizations of resource distribution in equity and adequacy lawsuits, see Anna Williams Shavers, Rethinking the Equity vs.
Adequacy Debate: Implications for Rural School Finance Reform Litigation, 82 Neb L Rev 133, 146–60 (2003). 32 See Springer, Liu, and Guthrie, 17 Educ Econ at 421 (cited in note 26); Berry, School
Finance Judgments at 222–27 (cited in note 27). 33 Earlier studies included in econometric models a simple on-off switch—a dummy variable—to indicate whether a court had issued an SFJ in a given state. This approach
captured only the average effect of SFJs and did not distinguish between legal, political, economic, or other variations in the SFJ decisions or the context surrounding those decisions. See, for example, Murray, Evans, and Schwab, 88 Econ L Rev at 801–04 (cited in note 20).
34 See Caroline M. Hoxby, All School Finance Equalizations Are Not Created Equal, 116 Q J Econ 1189, 1191–97 (2001). 35 Id at 1192. 36 See, for example, Rose, 790 SW2d at 215.
2012] Making Courts Matter 7
can influence the implementation of a court-ordered reform, our results suggest that partisan differences are important.
II. DATA AND EMPIRICAL STRATEGY
A. Data
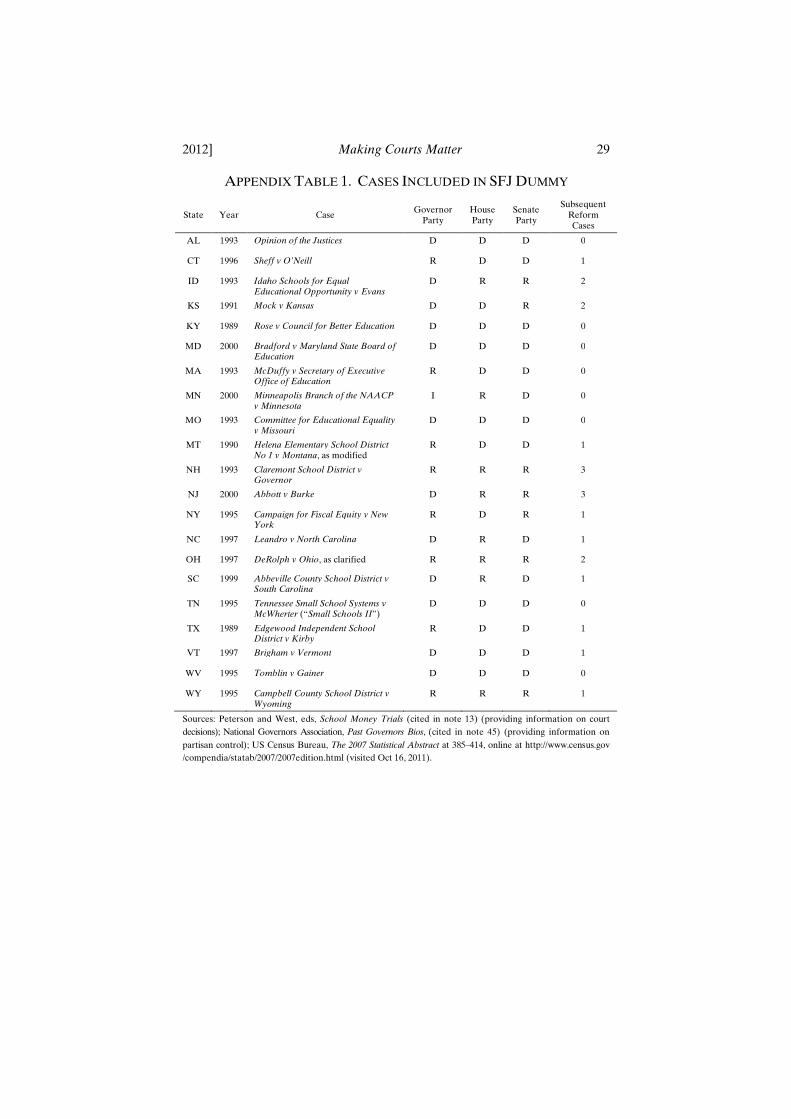
Our analysis examines information from Martin West and Paul Peterson about SFJs and their outcomes for judgments issued between 1988 and 2005. We exclude funding lawsuits not related to general education funding37 and cases that are not the first SFJ in a given state during our period of study. For the list of cases included in our analysis, see Appendix Table 1.
Annual district-level financial and demographic information comes from the Common Core of Data (CCD)38 and the US Census Bureau Elementary-Secondary School System Finance Survey (F-33)39 when CCD data was not available (1988–1992 and 2005). Our analysis considers only local school districts and parts of local supervisory unions with at least one hundred students, as identified
37 We exclude fifteen cases from West and Peterson based on the content of the cases. For a complete listing of all of the significant school-finance judgments from 1971 to 2005, see West and Peterson, eds, School Money Trials at 345–58 (cited in note 13). These cases are Kasayulie v Alaska, 1999 WL 34793400 (Alaska Super) (facilities); Crane Elementary School
District v Arizona, No 1 CA-CV 04-0076 (Ariz Ct App 2006) (capital funding); Hull v Albrecht,
950 P2d 1141 (Ariz 1997) and 960 P2d 634 (Ariz 1998) (capital funding); Roosevelt Elementary
School District Number 66 v Bishop, 877 P2d 806 (Ariz 1994) (capital funding); Haley v
Colorado Department of Education, No 02-CV-5149 (CO, Denver County District Court, 2002)
(special education); Idaho Schools for Equal Educational Opportunity v Idaho, 129 P3d 1199 (Idaho 2005) (facilities); School Administrative District No 1 v Commissioner, Department of
Education, 659 A2d 854 (Me 1995) (upholding method for reducing funding); Durant v
Michigan, 566 NW2d 272 (Mich 1997) (special education); Board of Education of the City of
Millville v New Jersey Department of Education, 872 A2d 1052 (NJ 2005) (preschool); Abbott v Burke, 748 A2d 82 (NJ 2000) (preschool); Zuni Public School District v New Mexico, No CV-98-14-II (NM,
McKinley County District Court, May 26, 1999) (facilities); Tennessee Small School Systems v
McWherter, 894 SW2d 734 (Tenn 1995); Tennessee Small School Systems v McWherter, 91 SW3d 232 (Tenn 2002) (teacher salaries); and Neeley v West Orange-Cove Consolidated
Independent School District, 176 SW3d 746 (Tex 2005) (addressing property taxes, not school funding). We include two cases that settled with an agreement for reform: Mock v Kansas, No 91-CV-1009 (KS, Shawnee County District Court, Oct 14, 1991), available at Philip C. Kissam, Constitutional Thought and Public Schools: An Essay on Mock v. State of Kansas, 31 Washburn L J 474, 489–504 (1992); and Minneapolis Branch of the NAACP v Minnesota, No 95-14800 (Minn, Hennepin County Dist Ct 2000), consolidated with Xiong v Minnesota, No 98-
2816 (Minn, Hennepin County Dist Ct 2000). 38 National Center for Education Statistics, Common Core of Data, online at http://nces.ed.gov/ccd/bat/ (visited Oct 24, 2011) (providing demographic and fiscal information
about public elementary and secondary schools). 39 US Census Bureau, Public School Finance Data, online at http://www.census.gov/govs /school/ (visited Oct 24, 2011) (providing finance data, including revenues, expenditures, debt, and assets, for elementary and secondary public school systems).
8 The University of Chicago Law Review [79:1
by the CCD. To address apparent data errors,40 we follow the approach of Murray, Evans, and Schwab,41 and therefore exclude districts with total spending per pupil above the ninety-ninth percentile for each given state-year.42 Additional district demographic information, such as the proportion of the population ages five to seventeen and the proportion of school-aged children living in poverty, comes from the US Census Bureau’s “Model-Based Small Area Income and Poverty Estimates” for most years.43 Because district poverty information is not available for every year, the poverty estimates from the closest available survey year are used. For example, the district poverty estimates for 1996, 1997, and 1998 all use the data from 1997. State-level political control and demographic information, including population and per capita income, come from the US Census Bureau’s “Statistical Abstract of the United States”44 and the National Governors Association website.45
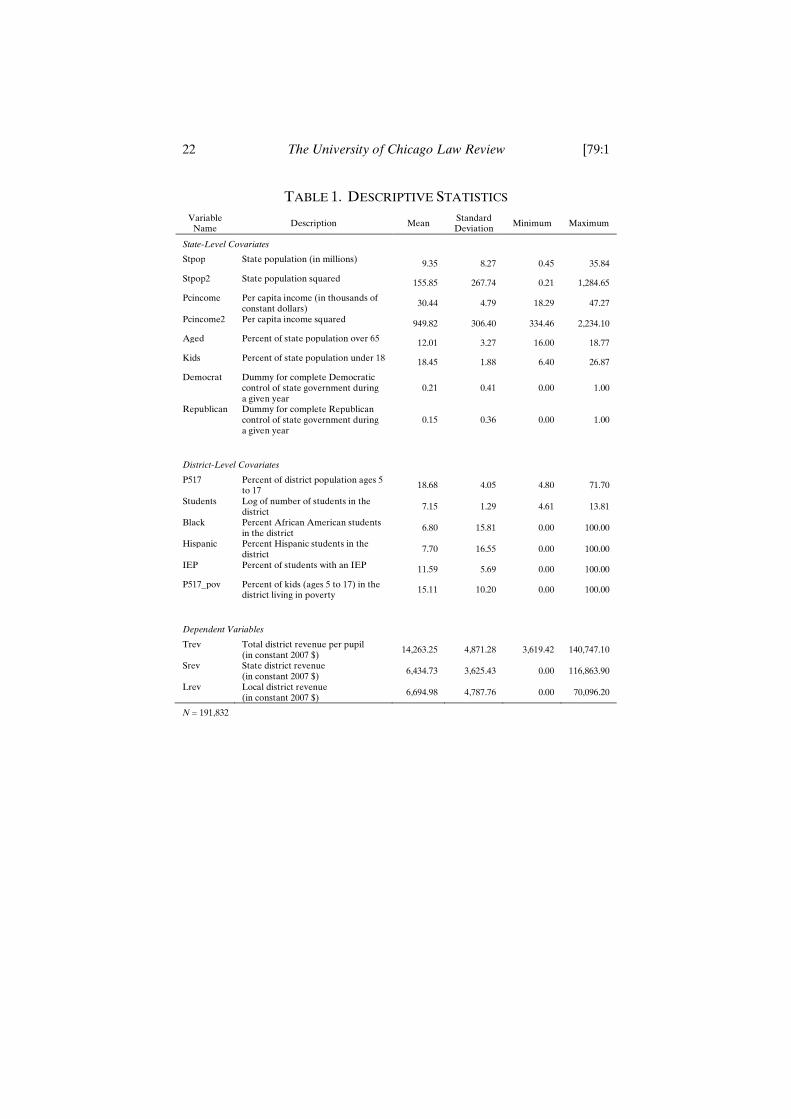
Local-school-district spending in the United States is financed by three sources of funding: local revenues raised by the district, primarily through property taxes; state aid; and federal aid. Together, state and local funding constitute over 90 percent of school funding.46 On average, state and local funding each account for roughly half of this total, although there is substantial variation across states in the allocation of funding responsibilities between state and local governments. Most state spending on education consists of transfers to local districts rather than direct delivery of
40 For example, one district that had 237 students reported over $500,000 in per-pupil total funding. 41 Murray, Evans, and Schwab, 88 Am Econ Rev at 795 (cited in note 20).
42 We also exclude two districts with implausibly low funding per pupil, as well as Hawaii and Washington, DC, because each has only one school district. 43 US Census Bureau, Model-Based Small Area Income and Poverty Estimates, online at
http://www.census.gov/did/www/saipe/ (visited Oct 24, 2011). Additionally, for 1989 and 2005, the district demographic information comes from National Center for Education Statistics, School District Demographics System, online at http://nces.ed.gov/surveys/sdds/index.aspx (visited Oct 24, 2011). 44 US Census Bureau, Statistical Abstract of the United States: 2007 253 table 400, online at http://www.census.gov/prod/2006pubs/07statab/election.pdf (visited Feb 15, 2011); US
Census Bureau, Statistical Abstract of the United States: 1990 259 table 434, online at http://www2.census.gov/prod2/statcomp/documents/1990-01.pdf (visited Feb 15, 2011). 45 National Governors Association, Past Governors Bios, online at http://www.nga.org/cms
/home/governors/past-governors-bios.html (visited Oct 24, 2011). 46 National Center for Education Statistics, Revenues and Expenditures for Public
Elementary and Secondary Education: School Year 2008–09 (Fiscal Year 2009) 5 (2011), online at http://nces.ed.gov/pubs2011/2011329.pdf (visited Oct 24, 2011).
2012] Making Courts Matter 9
educational services.47 The federal government has never provided a significant portion of funding for public education but rather limits its role to funding specific programs, such as the Free and Reduced Price Lunch Program, Title I funding for schools that serve students living in poverty, and various programs supporting special education.
B. Empirical Strategy
In the analyses that follow, we estimate the impact of SFJs on state, local, and total funding for school districts. While SFJs require a policy response from the state government, and therefore are expected to have a direct impact on state funding, they may also have an indirect effect on local funding—that is, the revenue raised by local school districts. Indeed, one concern over the efficacy of SFJs is that local districts may reduce their own taxes in response to increases in state aid, thereby undermining state-level efforts to increase school spending. For example, David Card and Abigail Payne find that a dollar of increased state aid to a local school district results in only fifty to sixty-five cents in increased spending.48 Therefore, to provide a more comprehensive picture of the effect of SFJs, we estimate models of both state and local funding. In addition, models of total funding capture the net effect of SFJs.49
We use a differences-in-differences strategy to identify the effect of court-ordered education reform on school district funding. Specifically, we estimate a series of regression models of the basic form:
���� = �� + �� + ∙ ��� + ∙ ��� + � ∙ ��� + ����
where ���� represents per-pupil funding (in constant 2007 dollars) for district � located in state � at time �, and �� and �� are district- and year-fixed effects, respectively. With the inclusion of district-fixed effects, identification in our models comes from within-district changes in funding following an SFJ. The fixed effects account for all, observable or unobservable, time-invariant attributes of the
47 A notable exception is Hawaii, which has the nation’s only entirely state-run school system. See Hawai’i State Department of Education, Introduction, Organization, online at http://doe.k12.hi.us/about/intro_org.htm (visited Oct 24, 2011). 48 Card and Payne, 83 J Pub Econ 49, 50 (cited in note 20). But see Baicker and Gordon,
90 J Pub Econ at 1532 (cited in note 24). 49 Because federal aid also contributes to local district spending, total funding is not simply the sum of state and local funding. However, because we do not expect federal funding
to be influenced by a state SFJ—an expectation that is borne out in the data, see Table 2—we do not estimate additional models for this variable. Nevertheless, estimates of federal funding are implicit in the difference between results for total funding and the sum of the results for state and local funding.
10 The University of Chicago Law Review [79:1
district, including the attributes of the state in which the district is located. Meanwhile, the year-fixed effects purge the estimates of national trends that affect all districts, such as economic conditions or changes in federal education policy. Our main variable of interest is ���, which is a dummy variable equal to 1 if the state’s school-finance system has been ruled unconstitutional in a court challenge. Specifically, the dummy variable is set to 1 in the year after the decision and each subsequent year.50 In most specifications, we also interact ��� with state partisan control or district poverty, as will be explained in the analyses that follow. ��� is a vector of time-varying district characteristics and ��� is a vector of time-varying state characteristics, both of which will be specified below. Finally, ���� are the errors, clustered by state, which account for arbitrary correlation in the residuals among districts within the same state and serial correlation of repeated observations from the same district.
We include time-varying state-level characteristics that are expected to influence state funding of education. We control for the fraction of the state’s population over sixty-five to account for the possibility that the elderly oppose increases in school spending.51 We also control for the fraction of the population that is of school age, which captures aggregate demand for educational services. At the same time, increasing per-pupil spending is proportionally more expensive where children constitute a larger fraction of the population. We control for per capita income in the state, reflecting “Wagner’s Law” that demand for government services increases with income52—that is, the elasticity of government spending with respect to individual income is greater than 1. We also include the square of state income to allow for the possibility that the demand for educational spending is not unbounded. Finally, we include two dummy variables for years of unified Democratic and unified Republican control, respectively, of the upper chamber, the lower chamber, and the governorship, which capture partisan differences in state education funding. The omitted category is divided government.
We also control for time-varying characteristics of school districts that are expected to influence either their receipt of state funding or their propensity to raise their own local revenue. We include the
50 We allow for a one-year lag for the SFJ to take effect because we assume that any changes in policy made as a result of the decision will be reflected in the next year’s budget at the earliest.
51 James M. Poterba, Demographic Structure and the Political Economy of Public
Education, 16 J Pol Analysis & Mgmt 48, 49 (1997). 52 Adolf Wagner, Three Extracts on Public Finance, in Richard A. Musgrave and Alan T. Peacock, eds, Classics in the Theory of Public Finance 1, 7 (Macmillan 1958).
2012] Making Courts Matter 11
number of students in the district to allow for the possibility that large districts operate differently from small districts, perhaps due to economies of scale.53 We control for the percentage of the student population living in poverty, which we expect to make the district more likely to receive state funding and less able to raise local funding. The fraction of students with an individualized education plan (IEP) is an indicator of special needs, which we expect to result in higher spending. We also include the proportion of the student population that is African American and the proportion that is Hispanic. Although we have no reason to believe that these two variables directly cause changes in education funding, we have access to relatively few district covariates and include these due to the possibility that they are correlated with other relevant factors in the district, such as property values or population growth.54
Descriptive statistics for all the variables used in our analysis are presented in Table 1.
III. BASELINE RESULTS
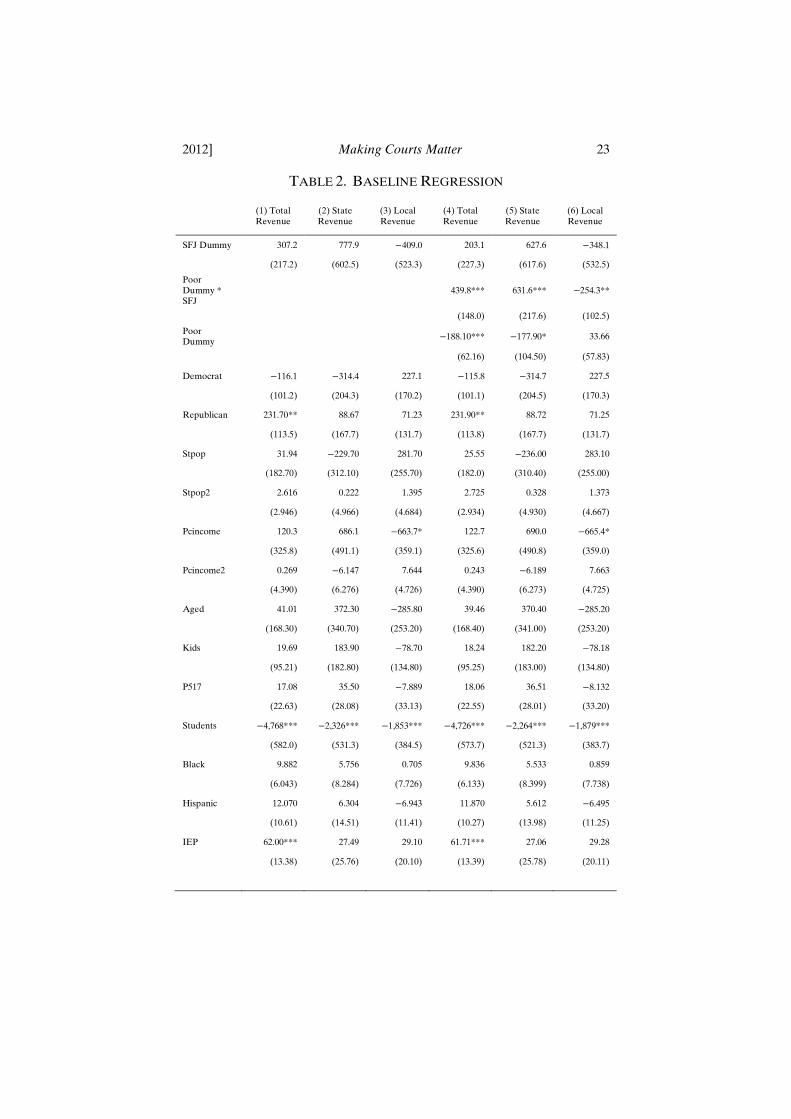
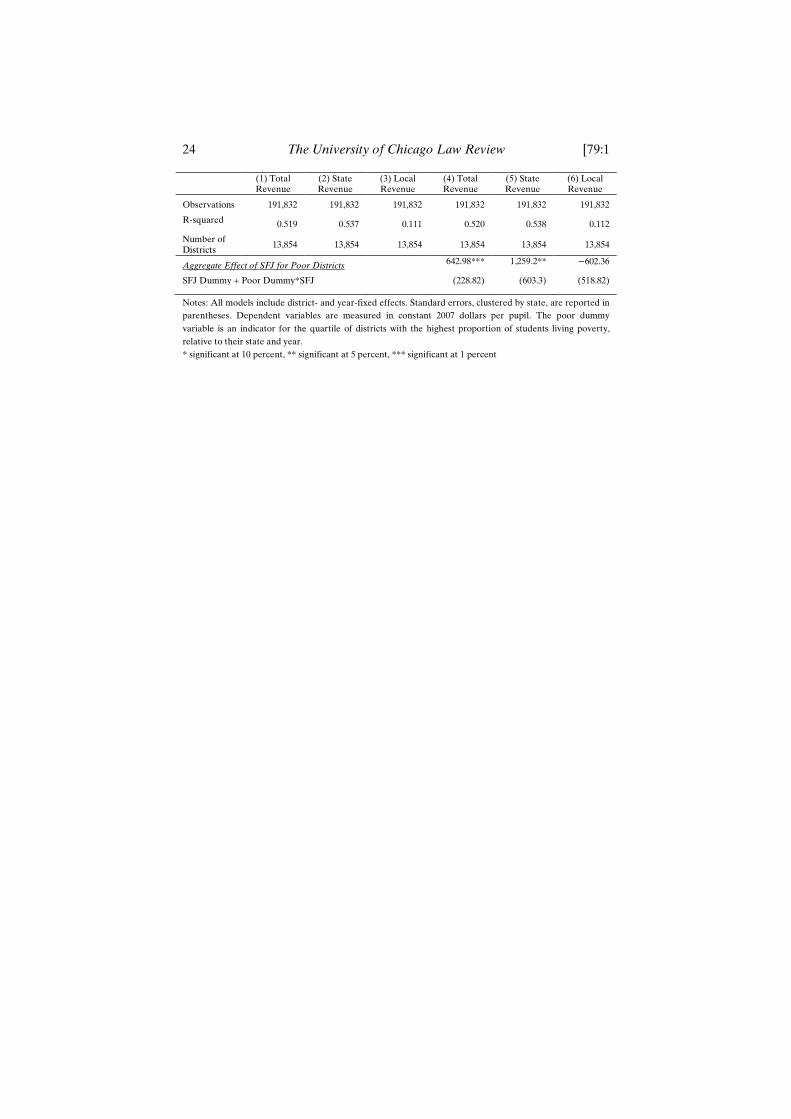
We begin by estimating a set of baseline models that assess the overall impact of SFJs on education funding. Models 1 through 3 of Table 2 present the within-district estimates for total, state, and local funding. The point estimates indicate that state funding (Model 2) increases following an SFJ by about $775 per pupil, while local funding (Model 3) declines by roughly $400. Total funding (Model 1) increases by a little over $300.55 This pattern is broadly consistent with the results shown by Berry, who finds, using state aggregate data and a longer time series going back to 1971, that SFJs lead to increasing centralization of education funding to the state level.56 However, none of the SFJ effects estimated in Models 1 through 3 achieve statistical significance. In other words, although on average SFJs led to increases in total and state funding and reductions in local funding, there is substantial variation across states and districts in the impact of SFJs.
53 See Murray, Evans, and Schwab, 88 Am Econ Rev at 803 (cited in note 20). With the dependent variable measured in per-pupil terms, a negative coefficient on the number of students indicates economies of scale. 54 For a more general analysis of the role of district racial composition in school-finance
litigation, see generally James E. Ryan, The Influence of Race in School Finance Reform, 98 Mich L Rev 432 (1999). 55 The change in total funding is not exactly equal to the change in state funding plus the
change in local funding because federal funding, which we do not estimate directly, may also change after an SFJ. As is implicit in this table and those that follow, changes in federal funding after an SFJ are a negligible part of the total changes in funding. 56 See Berry, School Finance Judgments at 214, 227–31 (cited in note 27).
12 The University of Chicago Law Review [79:1
Models 4 through 6 isolate one important source of variation in the impact of SFJs by estimating an interaction between the SFJ dummy and an indicator for district poverty. Because most lawsuits were aimed, in one way or another, at increasing funding for poor districts specifically, there is no reason that an SFJ must affect funding for the average district. Our estimated interaction term allows for the impact of an SFJ to be different for poor districts relative to other districts. Specifically, we use an indicator for whether a district is in the highest quartile, defined relative to its state and year, in the proportion of students living in poverty.57 All of the estimated interactions between district poverty and SFJ status are highly significant statistically, indicating that SFJs led to changes in funding disproportionately for poor districts. The total effect of SFJs on the funding of poor districts is the sum of the SFJ main effect plus the SFJ times poor interaction, which is reported at the bottom of the table along with the corresponding standard errors. Taking this sum, one can see that poor districts received $1,260 more in state funding, $600 less in local funding, and $640 more in total funding as a result of SFJs, although the estimates for local revenue are very imprecise. The net increase of $640 in total funding for poor districts is fairly modest substantively, considering that total per-pupil funding in our sample is a little over $14,000 on average. Put differently, $640 represents about one-eighth of a standard deviation in total per-pupil funding. The results for nonpoor districts follow the same pattern—a shift from local to state revenue resulting in a modest increase in total funding—but are even smaller in magnitude and insignificant statistically.
The main effect of the district-poverty dummy variable—which can be interpreted as the effect of being in the highest poverty quartile in the absence of an SFJ—is negative and significant for total revenue (Model 4). Interestingly, the negative differential in total funding is due to poor districts receiving less state aid (Model 5), rather than to differences in locally raised revenue (Model 6). Again, according to the SFJ-poverty interaction, SFJs lead to significant increases in state funding, as well as total funding, resulting in poor districts receiving more total revenue after an SFJ, compared both to nonpoor districts with an SFJ and to poor districts without an SFJ.
57 Continuous measures of poverty yield comparable results, as will be discussed below.
We begin with the dichotomous variable because we have theoretical reasons to expect that the relationship between the impact of an SFJ and district-level poverty will not be continuous. That is, we expect an SFJ to result in increases in funding for poor districts, though not necessarily reductions in funding for other districts.
2012] Making Courts Matter 13
Overall, the results shown in Models 4 through 6 are consistent with results from prior studies finding that SFJs result in modest reductions in the inequality of education funding within a state.58 At the same time, while these prior studies utilize state-aggregate measures of inequality, we are the first to produce estimates from district-level data, demonstrating that SFJs generate increases in state aid to high-poverty districts specifically.
Among the control variables, the point estimates are generally in the expected direction, although only a few achieve statistical significance. Districts spend less per student when enrollment increases, suggesting the existence of economies of scale. Districts spend more when the proportion of students with an IEP increases. Given that IEPs generally apply to students with special needs, this result is unsurprising. Finally, districts receive more funding in the years when Republicans control the state government.59 This result is somewhat surprising in light of the popular perception that Republicans are the party of fiscal conservatism, although it is possible that increased education funding comes at the expense of reductions in other expenditures. We will have more to say about partisan differences in the next Section.
IV. PARTISAN DIFFERENCES
The results presented in the previous Section recapitulate the major findings from prior studies—namely, that SFJs lead to transfers of fiscal responsibilities from local to state governments, increases in the overall level of education funding, and reductions in funding inequality. In this Section, we investigate whether the impact of an SFJ varies depending on the partisan control of the state government at the time of the decision. We focus on patterns of partisan control at the time of the decision because the sitting government is the one obliged to craft a policy response to the court’s order.60 While later governments are also constrained by the court’s prior rulings, they are not charged with bringing the school-funding system into compliance in the first place. Ultimately, whether the government in place at the time of the decision leaves
58 See, for example, Berry, School Finance Judgments at 233 (cited in note 27); Card and
Payne, 83 J Pub Econ at 66 (cited in note 20). But see Murray, Evans, and Schwab, 88 Am Econ Rev at 806 (cited in note 20). High poverty does not necessarily imply low spending, so the results in Table 2 do not speak directly to the issue of spending inequality.
59 See Table 2. 60 Of course, there are instances in which the sitting legislature and governor fail to agree on a response to the court’s order before their term is up, thereby leaving the problem for their successors to tackle. We discuss these issues below.
14 The University of Chicago Law Review [79:1
an enduring mark on the system is an empirical question, and later we will discuss the robustness of our results as compared to alternative ways of modeling partisan influence.
We begin by creating three dummy variables representing, respectively, unified Democratic control of the state legislature and governorship at the time of the court decision, unified Republican control, and divided government. For example, the first dummy variable will equal 1 for years after an SFJ if Democrats controlled both houses of the legislature and the governorship in the year of the decision, 0 otherwise. This approach allows us to test whether the within-district difference in funding before versus after an SFJ is different depending on the partisan composition of the state government at the time of the decision. The omitted category is again no SFJ. Thus, identification in these models comes both from within-district variation (to estimate the change in spending after an SFJ) and from between-state variation (to estimate the differential effects of the three configurations of partisan control). We continue to include the full set of state and district control variables used in Table 2, although to conserve space we do not report their results.
Appendix Table 1 lists the cases used in our analysis and the configuration of partisan control of the state government at the time of the decision. From the outset, we caution that there are only three SFJs issued during periods of unified Republican government.61 There are seven SFJs handed down to unified Democratic governments,62 and eleven SFJs delivered to divided governments.63 While we have nearly 200,000 district-level observations in our data set, our ability to test for partisan differences in outcomes is limited by the number of cases decided under each regime.
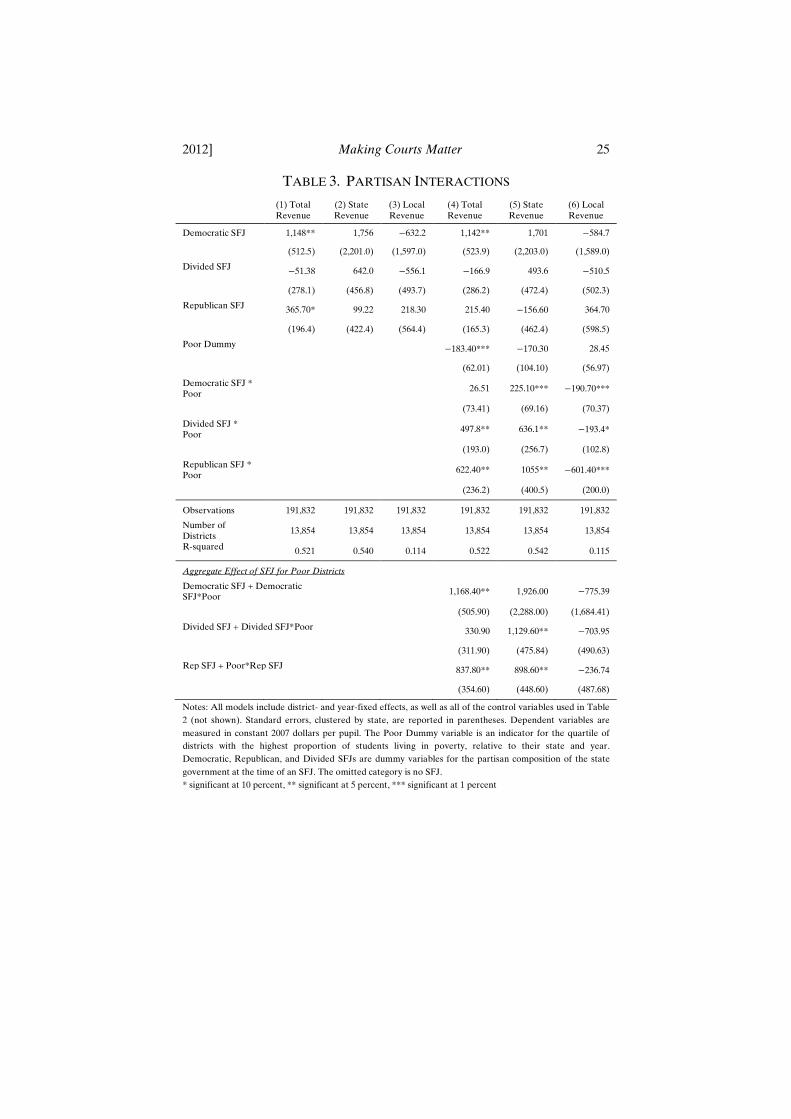
Models 1 through 3 of Table 3 indicate that SFJs handed down to Democratic state governments result in the greatest changes in education funding. Specifically, when Democrats are in control at the time of an SFJ, state revenue subsequently increases by $1,750 per pupil, while local revenue declines by $630, resulting in an increase in total funding of $1,150. Meanwhile, SFJs implemented under divided government result in roughly offsetting increases in state funding and decreases in local funding, with negligible average effects on total funding. Finally, when a Republican-controlled government responds to an SFJ, the result is modest increases in both state and
61 These SFJs were issued for New Hampshire, Ohio, and Wyoming.
62 These SFJs were handed down to Alabama, Kentucky, Maryland, Missouri, Tennessee, Vermont, and West Virginia. 63 These SFJs were delivered to Connecticut, Idaho, Kansas, Massachusetts, Minnesota, Montana, North Carolina, New Jersey, New York, South Carolina, and Texas.
2012] Making Courts Matter 15
local funding, summing to a total increase in funding of $365 per student. Most of the coefficients are imprecisely estimated, however. Only the effect of Democratic reform on total funding is significant at the conventional 5 percent level, while the Republican effect on total funding is significant at 10 percent.
The hypothesis tests implicit in Table 3 indicate whether each type of partisan reform results in a difference in spending compared
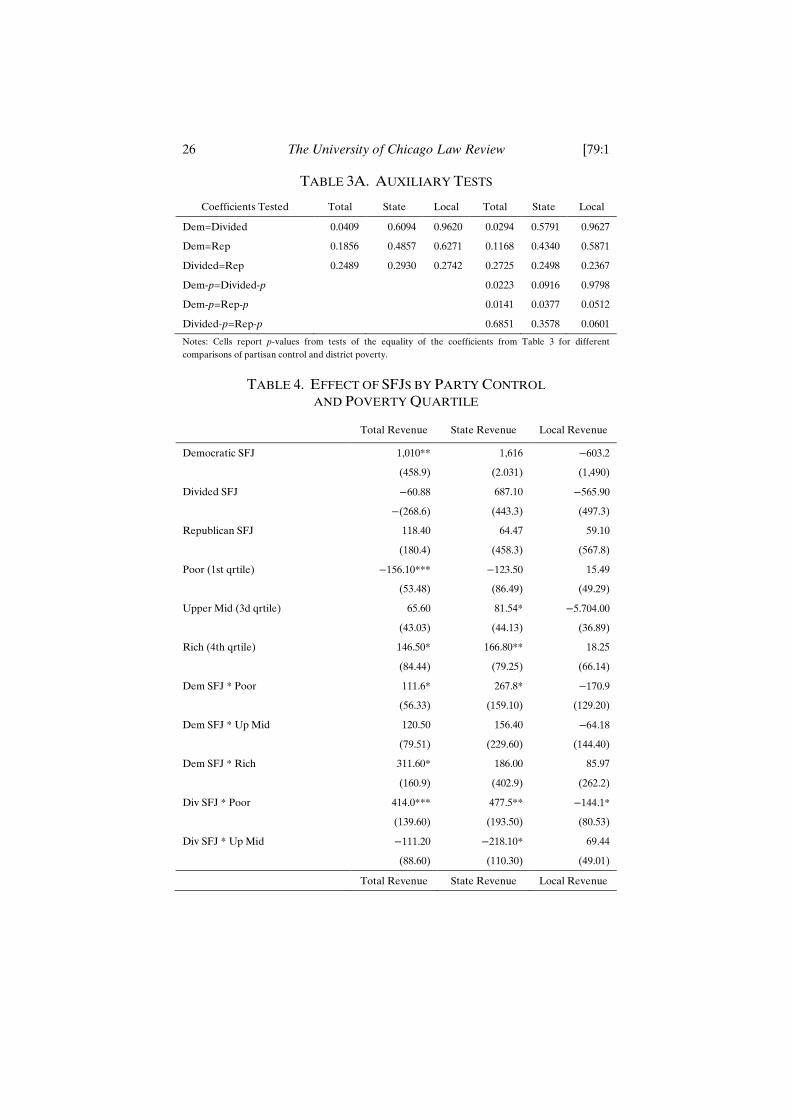
with not having had an SFJ. It is also important to test whether the different configurations of partisan control have different effects from each other. These hypothesis tests are reported in Table 3A. The evidence shows that Democratic-controlled reforms do not have the same total effect as a reform implemented under divided government. However, all of the other tests fail to reject the hypothesis that reforms issued under different partisan configurations have equal effects.
The imprecision of the estimated effects in Models 1 through 3 again suggests that there is substantial heterogeneity across districts in the effects of SFJs, even under the same regime of partisan control. In Models 4 through 6, we allow the effects of SFJs to differ for poor and nonpoor districts within each regime type. That is, we have a quadruple-difference model in which we estimate the difference in the change in spending after an SFJ between poor and nonpoor districts across three different regimes of partisan control. Using this strategy, it becomes apparent that the reforms implemented by Democratic state governments have significantly different effects from those implemented by divided or Republican governments.
First, note that the Democratic-reform-times-poor-district-interaction term is substantively small and statistically insignificant for total revenue, indicating that poor districts do not fare differently than other districts under a Democratically controlled SFJ. The main effect of Democratic reform remains positive and significant. In other words, all districts—poor and nonpoor alike—see increases in funding following an SFJ implemented by a Democratic state government. According to Models 5 and 6, poor districts do experience a greater shift from local to state funding than nonpoor districts under a Democratic SFJ, but the decrement to local revenue essentially offsets the increment to state revenue, hence the null result for total revenue.
By contrast, SFJs implemented by divided or Republican state governments generate significant increases in funding for poor districts, relative to other districts. That is, the main effects for split and Republican SFJs are insignificant, while the interactions with the
16 The University of Chicago Law Review [79:1
poor-district indicator are positive and significant. Under both types of regimes, poor districts see reductions in local funding that are more than offset by increases in state funding, resulting in increases in total funding. Although the point estimate for the SFJ times poor-district interaction is larger for Republican governments ($622) than for divided governments ($498), we cannot reject the hypothesis that they are equal, as shown in Table 3A.
In sum, an SFJ under each type of partisan regime results in a change to the school-funding system after the ruling, and Democratically implemented SFJs have significantly different effects from SFJs implemented under Republican or divided state governments. Specifically, Democratic SFJs result in increases in total funding for both poor and nonpoor districts, whereas a Republican or divided government SFJ results in increases in funding for poor districts disproportionately. All three types of SFJs lead to a shift in funding responsibility from local to state governments, though to differing degrees.
Thus far in our analysis, we have lumped together all nonpoor districts within a state into a single category. To produce a more comprehensive picture of the partisan effects of SFJs, we next extend our analysis to include interactions between SFJ status, partisan regime type at the time of the decision, and indicators for four quartiles of the within-state distribution of district-level poverty. In other words, we divide each state’s districts into four quartiles based on the proportion of students in poverty and then allow each of the three different types of SFJs—Democratic, Republican, and divided state government—to have differential effects for each quartile. This allows us to assess, in a nonparametric fashion, the effect of an SFJ across the spectrum of district poverty. As before, the inclusion of district- and year-fixed effects means that our estimates of the effect of an SFJ come from within-district changes in spending after the decision. We simply compare these within-district changes across different combinations of partisan control and district poverty.
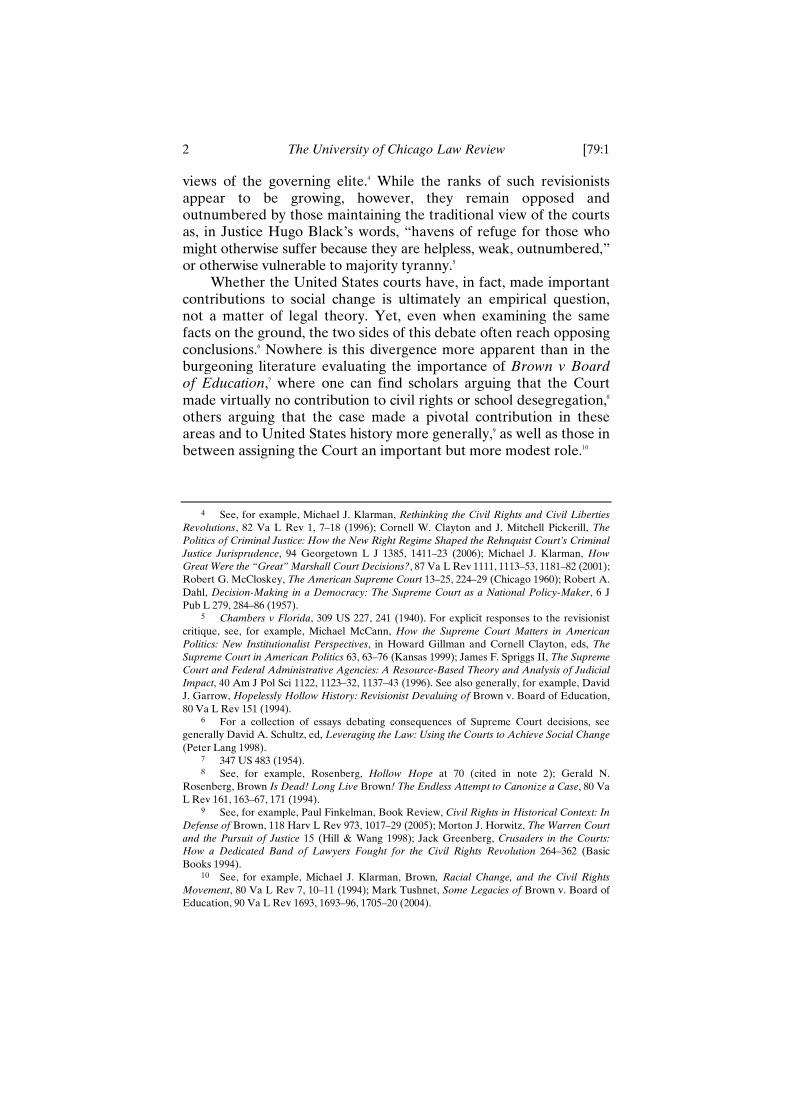
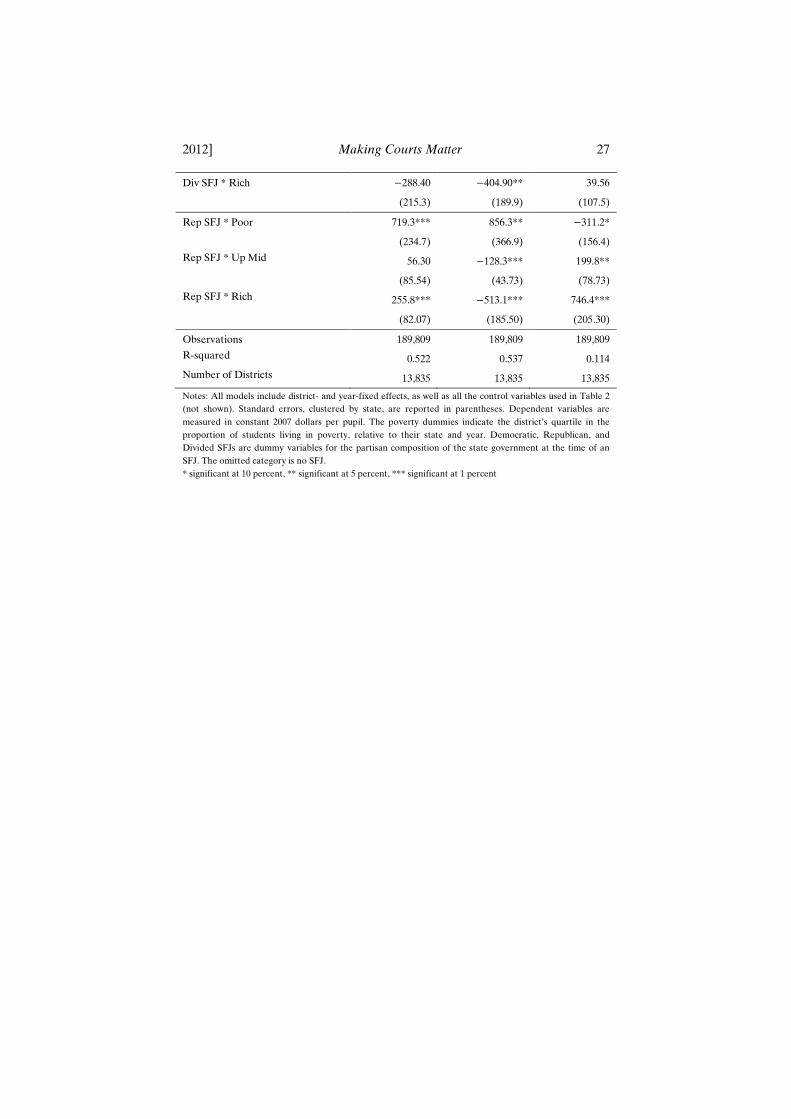
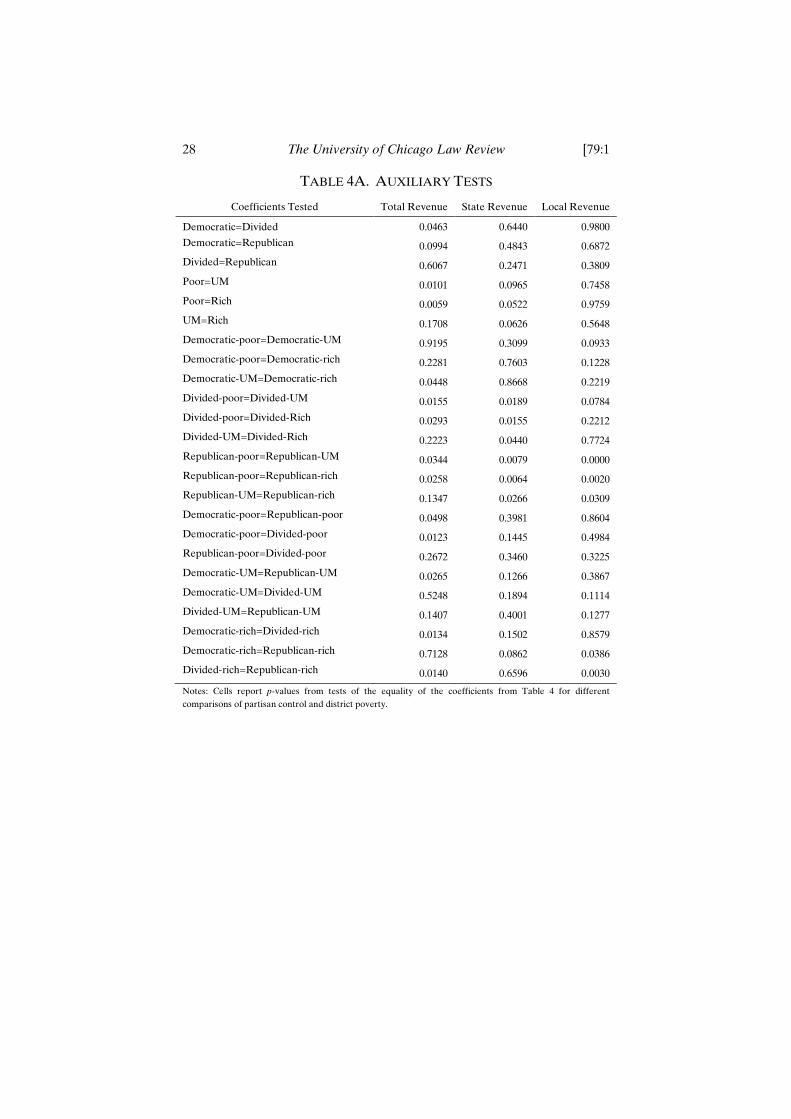
The results of this analysis are presented in Table 4. The omitted category of district poverty is the second-poorest quartile, so the coefficients for the remaining quartiles should be interpreted as differences with respect to this omitted category. However, these complex interactions are more easily presented graphically, which we do in Figure 1. Each bar in the graph represents the total effect of an SFJ—that is, the within-district change in spending after the decision—for each category of partisan control and district poverty, computed from the coefficients shown in Table 4. Meanwhile,
2012] Making Courts Matter 17
Table 4A presents associated tests for differences in the effects of SFJs across various partisan and poverty groups.
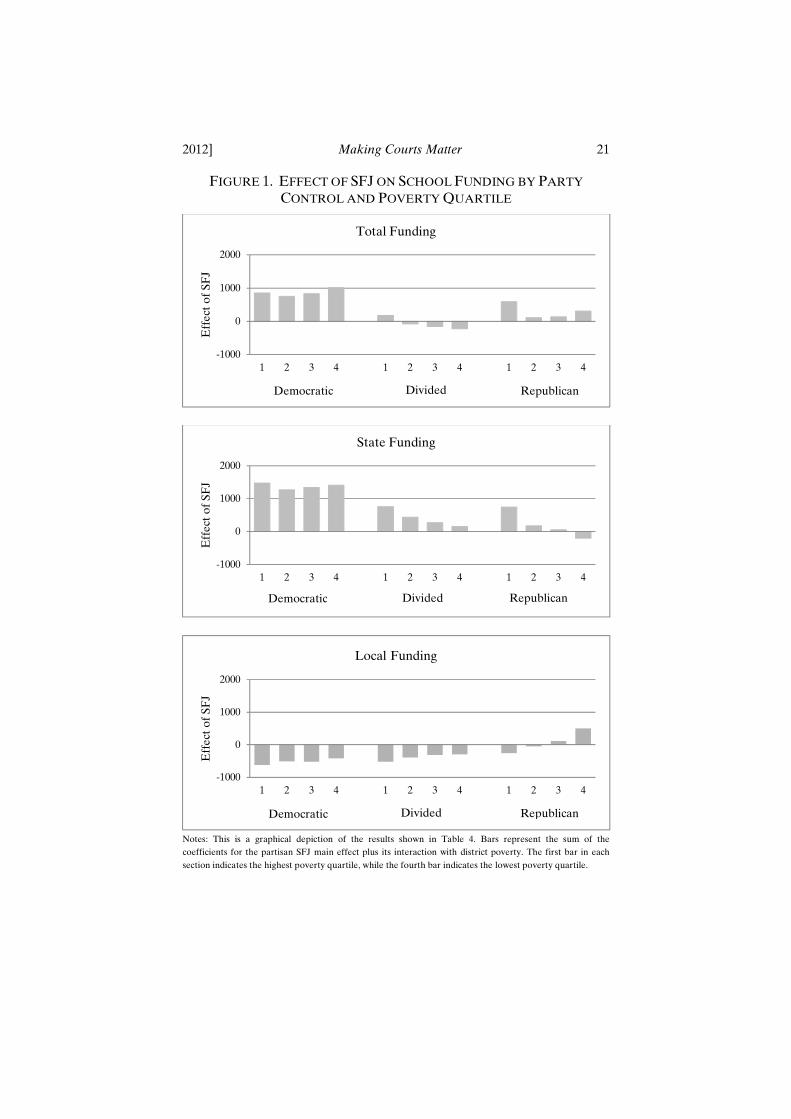
The more detailed results depicted in Figure 1 indicate that SFJs crafted by Democratic governments result in total funding increases across the board. Districts in every poverty quartile see a shift from local to state funding after an SFJ, with a net increase in funding ranging from roughly $1,000 to $1,300 per pupil. While a few of the differences between quartiles are significant statistically, they are substantively small relative to the overall level of the funding increases. Indeed, if anything, the results indicate that the most affluent districts fare better than the poorest districts, in terms of total funding, after a Democratic SFJ, although this difference is not statistically significant.
SFJ reforms implemented under divided government produce decidedly different results. There is a shift from local to state funding, but the change in state funding is monotonically increasing district poverty. The poorest quartile of districts receives significantly greater increases in state funding than any other quartile. Moreover, the poorest quartile is the only one to see positive net changes in total funding. Overall, divided government SFJs appear to represent a more or less straightforward redistribution of funding toward the poorest districts. The net effects on state education funding appear to be neutral, as further evidenced by Model 1 of Table 3, showing little change in total education funding after an SFJ under divided government. That said, the net increase in total funding for poor districts is substantively small, amounting to roughly $350 per student, or only 7 percent of a standard deviation in total funding.
Republican-controlled SFJs present yet a third distinct pattern of funding reforms. Under Republican reforms, there is a shift from local to state funding only for the poorest districts. Districts in the most affluent quartile face cuts in state funding, but they are able to more than compensate for these reductions by increasing their own local revenue. In other words, Republican SFJs involve increasing centralization of funding for the poorest districts and increasing decentralization of funding for the richest districts. The middle two quartiles are essentially unaffected. On net, both the poorest and the richest districts see increases in total funding, the former courtesy of state aid and the latter financed from their own tax base. Indeed, the richest districts in Republican states are the only quartile under any partisan regime to experience an increase in local funding following an SFJ.
Which partisan arrangement leads to the best results for poor districts after an SFJ? Clearly, SFJs implemented by Democrats
18 The University of Chicago Law Review [79:1
produce the largest net increases in funding. However, by delivering roughly equivalent funding increases to districts at all income levels, Democratic SFJs will do little to reduce the overall level of funding inequality in their states. On the other hand, SFJs implemented by divided or Republican governments deliver concentrated benefits to poor districts, thereby reducing, albeit moderately, the funding differential between poor and more affluent districts. However, especially under divided government SFJs, the actual flow of new dollars into poor districts is more meager than when Democrats are in control. Assessing which sort of reform produces the greatest benefits would require a richer theory and empirical analysis of the connection between student outcomes and the level and inequality of school funding.
We do not offer a substantive political explanation for the differential partisan responses to state SFJs. One simple conjecture would be that political actors use the court rulings as a pretense to enact policy changes that they were otherwise predisposed to make anyway. Yet, it is not clear why such a pretense would be necessary in a state dominated by one party. For example, when Democrats control the legislature and governorship, they presumably will set the policy they want absent court intervention, so it is not obvious why an SFJ should elicit a greater response from Democrats than from Republicans. It is possible that supermajoritarian voting requirements within the legislature prevent the dominant party from attaining its ideal policies even under unified government, and that court rulings help surmount such hurdles. However, a comprehensive account of court influence over state policymaking is beyond the scope of this paper and so we leave the theoretical underpinnings of our results as fodder for future research.
V. ROBUSTNESS
In additional analyses not reported, we have explored the robustness of our results to various changes in model specification and variable definitions. First, we examined sensitivity to our treatment of partisan control. In the models reported above, we coded each SFJ according to the partisan alignment in the year of the decision. As an alternative, we also reran the models using contemporaneous measures of partisan control—that is, interacting the SFJ dummy with indicators of partisan control in the current year for all years after the decision. The signs of the coefficients were unchanged, but they became much less precisely estimated when using the contemporaneous measures of partisanship. This leads us to conclude that state party control at the time of the decision
2012] Making Courts Matter 19
captures an important determinant of the political response to the court decision.
As noted in our discussion of the school-finance litigation movement, many states have had more than one court ruling on education finance.64 The rulings that determine our coding of the SFJ dummy variable are listed in Appendix Table 1. However, some states had rulings in place prior to the beginning of our study period, and some states had additional rulings that came later. We have explored various sensitivity analyses as to the coding of the SFJ dummy. For example, we recoded the dummy variable to reflect cases decided before the beginning of our study period and reran the models. We also tried including indicator variables for the existence of reform decisions that came before or after the cases used in our analysis. Our results did not change importantly, although we did observe that the first reform case tends to have the largest effect on fiscal outcomes.
A lingering concern with our results may be that the filing of lawsuits is endogenously related to political control of the state government. First, we note that because nearly all states—forty-five of fifty—were subject to at least one education-finance lawsuit, the central issue is not whether a state would face a suit but when. One possibility is that education-reform advocates may time the filing of their lawsuits to take advantage of what they view as particularly favorable political conditions. Another possibility is that advocates might resort to litigation only when the legislative and political process fails to provide reform. Therefore, endogenous timing by litigants might potentially bias our results in either direction.
We believe that the possibility of endogenous lawsuit timing vis-à-vis political regime is not a major concern for three reasons: the amount of time between lawsuit filing and the court decision is unpredictable, political regimes often change between the lawsuit filing and decision, and lawsuits do not appear to be precipitated by changes in political regime. Among the twenty-three cases that contribute to our estimate of SFJ reform, the length of time from the initial filing through the final appellate court decision ranged from less than a year to nine years. On average, the process took four years. Due to the length of time the suits take and the variability of the speed of the adjudication process, advocates could not effectively time their lawsuits to specific political regimes. In almost half of the cases—eleven out of twenty-three—the political regime changed between the time of filing and time of decision. When political
64 See note 16 and accompanying text.
20 The University of Chicago Law Review [79:1
control changes more rapidly than lawsuits can be adjudicated, reform advocates cannot time their lawsuits to be decided under a specific regime. Further, SFJ lawsuits do not appear to be motivated by a change in regime preceding case filing. On average, the political regime in the state was stable for six years prior to the filing of a case. In only three cases did the regime change in the year of the lawsuit filing, and for each of those three cases, the political regime changed again before the lawsuit was decided. Thus, we do not see evidence that endogenous timing of lawsuits is likely to be an important source of bias for our results.
CONCLUSION
The state experience with school-finance litigation provides evidence that courts have played a significant role in at least this one realm of social reform. We find statistically significant differences in education funding following court judgments overturning a state’s school-financing system. In particular, Democratic, Republican, and divided state governments produce significantly different education spending patterns following an SFJ, once we account for the relative poverty of the school districts. Further, SFJ reforms overall had a significantly different impact on low-spending school districts than on high-spending school districts. The effects of a court decision are contingent on the pattern of partisan control in place at the time. Thus, our analysis challenges the idea that courts are ineffectual in initiating policy change while providing some of the first quantitative evidence that implementation is contingent on interactions between courts and other political institutions.
2012] Making Courts Matter 21
FIGURE 1. EFFECT OF SFJ ON SCHOOL FUNDING BY PARTY
CONTROL AND POVERTY QUARTILE
Notes: This is a graphical depiction of the results shown in Table 4. Bars represent the sum of the
coefficients for the partisan SFJ main effect plus its interaction with district poverty. The first bar in each
section indicates the highest poverty quartile, while the fourth bar indicates the lowest poverty quartile.
-1000
0
1000
2000
1 2 3 4 1 2 3 4 1 2 3 4
Eff
ect
of
SF
J
Divided
Total Funding
Democratic Republican
-1000
0
1000
2000
1 2 3 4 1 2 3 4 1 2 3 4
Eff
ect
of
SF
J
Divided
State Funding
Democratic Republican
-1000
0
1000
2000
1 2 3 4 1 2 3 4 1 2 3 4
Eff
ect
of
SF
J
Divided
Local Funding
Democratic Republican
22 The University of Chicago Law Review [79:1
TABLE 1. DESCRIPTIVE STATISTICS
Variable Name
Description Mean Standard Deviation
Minimum Maximum
State-Level Covariates
Stpop State population (in millions) 9.35 8.27 0.45 35.84
Stpop2 State population squared 155.85 267.74 0.21 1,284.65
Pcincome Per capita income (in thousands of constant dollars)
30.44 4.79 18.29 47.27
Pcincome2 Per capita income squared 949.82 306.40 334.46 2,234.10
Aged Percent of state population over 65 12.01 3.27 16.00 18.77
Kids Percent of state population under 18 18.45 1.88 6.40 26.87
Democrat Dummy for complete Democratic control of state government during a given year
0.21 0.41 0.00 1.00
Republican Dummy for complete Republican control of state government during a given year
0.15 0.36 0.00 1.00
District-Level Covariates
P517 Percent of district population ages 5 to 17
18.68 4.05 4.80 71.70
Students Log of number of students in the district
7.15 1.29 4.61 13.81
Black Percent African American students in the district
6.80 15.81 0.00 100.00
Hispanic Percent Hispanic students in the district
7.70 16.55 0.00 100.00
IEP Percent of students with an IEP 11.59 5.69 0.00 100.00
P517_pov Percent of kids (ages 5 to 17) in the district living in poverty
15.11 10.20 0.00 100.00
Dependent Variables
Trev Total district revenue per pupil (in constant 2007 $)
14,263.25 4,871.28 3,619.42 140,747.10
Srev State district revenue (in constant 2007 $)
6,434.73 3,625.43 0.00 116,863.90
Lrev Local district revenue (in constant 2007 $)
6,694.98 4,787.76 0.00 70,096.20
N = 191,832
2012] Making Courts Matter 23
TABLE 2. BASELINE REGRESSION
(1) Total Revenue
(2) State Revenue
(3) Local Revenue
(4) Total Revenue
(5) State Revenue
(6) Local Revenue
SFJ Dummy 307.2 777.9 −409.0 203.1 627.6 −348.1
(217.2) (602.5) (523.3) (227.3) (617.6) (532.5)
Poor Dummy * SFJ
439.8*** 631.6*** −254.3**
(148.0) (217.6) (102.5)
Poor Dummy
−188.10*** −177.90* 33.66
(62.16) (104.50) (57.83)
Democrat −116.1 −314.4 227.1 −115.8 −314.7 227.5
(101.2) (204.3) (170.2) (101.1) (204.5) (170.3)
Republican 231.70** 88.67 71.23 231.90** 88.72 71.25
(113.5) (167.7) (131.7) (113.8) (167.7) (131.7)
Stpop 31.94 −229.70 281.70 25.55 −236.00 283.10
(182.70) (312.10) (255.70) (182.0) (310.40) (255.00)
Stpop2 2.616 0.222 1.395 2.725 0.328 1.373
(2.946) (4.966) (4.684) (2.934) (4.930) (4.667)
Pcincome 120.3 686.1 −663.7* 122.7 690.0 −665.4*
(325.8) (491.1) (359.1) (325.6) (490.8) (359.0)
Pcincome2 0.269 −6.147 7.644 0.243 −6.189 7.663
(4.390) (6.276) (4.726) (4.390) (6.273) (4.725)
Aged 41.01 372.30 −285.80 39.46 370.40 −285.20
(168.30) (340.70) (253.20) (168.40) (341.00) (253.20)
Kids 19.69 183.90 −78.70 18.24 182.20 −78.18
(95.21) (182.80) (134.80) (95.25) (183.00) (134.80)
P517 17.08 35.50 −7.889 18.06 36.51 −8.132
(22.63) (28.08) (33.13) (22.55) (28.01) (33.20)
Students −4,768*** −2,326*** −1,853*** −4,726*** −2,264*** −1,879***
(582.0) (531.3) (384.5) (573.7) (521.3) (383.7)
Black 9.882 5.756 0.705 9.836 5.533 0.859
(6.043) (8.284) (7.726) (6.133) (8.399) (7.738)
Hispanic 12.070 6.304 −6.943 11.870 5.612 −6.495
(10.61) (14.51) (11.41) (10.27) (13.98) (11.25)
IEP 62.00*** 27.49 29.10 61.71*** 27.06 29.28
(13.38) (25.76) (20.10) (13.39) (25.78) (20.11)
24 The University of Chicago Law Review [79:1
(1) Total Revenue
(2) State Revenue
(3) Local Revenue
(4) Total Revenue
(5) State Revenue
(6) Local Revenue
Observations 191,832 191,832 191,832 191,832 191,832 191,832
R-squared 0.519 0.537 0.111 0.520 0.538 0.112
Number of Districts
13,854 13,854 13,854 13,854 13,854 13,854
Aggregate Effect of SFJ for Poor Districts 642.98*** 1,259.2** −602.36
SFJ Dummy + Poor Dummy*SFJ (228.82) (603.3) (518.82)
Notes: All models include district- and year-fixed effects. Standard errors, clustered by state, are reported in
parentheses. Dependent variables are measured in constant 2007 dollars per pupil. The poor dummy
variable is an indicator for the quartile of districts with the highest proportion of students living poverty,
relative to their state and year.
* significant at 10 percent, ** significant at 5 percent, *** significant at 1 percent
2012] Making Courts Matter 25
TABLE 3. PARTISAN INTERACTIONS
(1) Total Revenue
(2) State Revenue
(3) Local Revenue
(4) Total Revenue
(5) State Revenue
(6) Local Revenue
Democratic SFJ 1,148** 1,756 −632.2 1,142** 1,701 −584.7
(512.5) (2,201.0) (1,597.0) (523.9) (2,203.0) (1,589.0)
Divided SFJ −51.38 642.0 −556.1 −166.9 493.6 −510.5
(278.1) (456.8) (493.7) (286.2) (472.4) (502.3)
Republican SFJ 365.70* 99.22 218.30 215.40 −156.60 364.70
(196.4) (422.4) (564.4) (165.3) (462.4) (598.5)
Poor Dummy −183.40*** −170.30 28.45
(62.01) (104.10) (56.97)
Democratic SFJ * Poor
26.51 225.10*** −190.70***
(73.41) (69.16) (70.37)
Divided SFJ * Poor
497.8** 636.1** −193.4*
(193.0) (256.7) (102.8)
Republican SFJ * Poor
622.40** 1055** −601.40***
(236.2) (400.5) (200.0)
Observations 191,832 191,832 191,832 191,832 191,832 191,832
Number of Districts
13,854 13,854 13,854 13,854 13,854 13,854
R-squared 0.521 0.540 0.114 0.522 0.542 0.115
Aggregate Effect of SFJ for Poor Districts
Democratic SFJ + Democratic SFJ*Poor
1,168.40** 1,926.00 −775.39
(505.90) (2,288.00) (1,684.41)
Divided SFJ + Divided SFJ*Poor 330.90 1,129.60** −703.95
(311.90) (475.84) (490.63)
Rep SFJ + Poor*Rep SFJ 837.80** 898.60** −236.74
(354.60) (448.60) (487.68)
Notes: All models include district- and year-fixed effects, as well as all of the control variables used in Table
2 (not shown). Standard errors, clustered by state, are reported in parentheses. Dependent variables are
measured in constant 2007 dollars per pupil. The Poor Dummy variable is an indicator for the quartile of
districts with the highest proportion of students living in poverty, relative to their state and year.
Democratic, Republican, and Divided SFJs are dummy variables for the partisan composition of the state
government at the time of an SFJ. The omitted category is no SFJ.
* significant at 10 percent, ** significant at 5 percent, *** significant at 1 percent
26 The University of Chicago Law Review [79:1
TABLE 3A. AUXILIARY TESTS
Coefficients Tested Total State Local Total State Local
Dem=Divided 0.0409 0.6094 0.9620 0.0294 0.5791 0.9627
Dem=Rep 0.1856 0.4857 0.6271 0.1168 0.4340 0.5871
Divided=Rep 0.2489 0.2930 0.2742 0.2725 0.2498 0.2367
Dem-p=Divided-p 0.0223 0.0916 0.9798
Dem-p=Rep-p 0.0141 0.0377 0.0512
Divided-p=Rep-p 0.6851 0.3578 0.0601
Notes: Cells report p-values from tests of the equality of the coefficients from Table 3 for different
comparisons of partisan control and district poverty.
TABLE 4. EFFECT OF SFJS BY PARTY CONTROL AND POVERTY QUARTILE
Total Revenue State Revenue Local Revenue
Democratic SFJ 1,010** 1,616 −603.2
(458.9) (2.031) (1,490)
Divided SFJ −60.88 687.10 −565.90
−(268.6) (443.3) (497.3)
Republican SFJ 118.40 64.47 59.10
(180.4) (458.3) (567.8)
Poor (1st qrtile) −156.10*** −123.50 15.49
(53.48) (86.49) (49.29)
Upper Mid (3d qrtile) 65.60 81.54* −5.704.00
(43.03) (44.13) (36.89)
Rich (4th qrtile) 146.50* 166.80** 18.25
(84.44) (79.25) (66.14)
Dem SFJ * Poor 111.6* 267.8* −170.9
(56.33) (159.10) (129.20)
Dem SFJ * Up Mid 120.50 156.40 −64.18
(79.51) (229.60) (144.40)
Dem SFJ * Rich 311.60* 186.00 85.97
(160.9) (402.9) (262.2)
Div SFJ * Poor 414.0*** 477.5** −144.1*
(139.60) (193.50) (80.53)
Div SFJ * Up Mid −111.20 −218.10* 69.44
(88.60) (110.30) (49.01)
Total Revenue State Revenue Local Revenue
2012] Making Courts Matter 27
Div SFJ * Rich −288.40 −404.90** 39.56
(215.3) (189.9) (107.5)
Rep SFJ * Poor 719.3*** 856.3** −311.2*
(234.7) (366.9) (156.4)
Rep SFJ * Up Mid 56.30 −128.3*** 199.8**
(85.54) (43.73) (78.73)
Rep SFJ * Rich 255.8*** −513.1*** 746.4***
(82.07) (185.50) (205.30)
Observations 189,809 189,809 189,809
R-squared 0.522 0.537 0.114
Number of Districts 13,835 13,835 13,835
Notes: All models include district- and year-fixed effects, as well as all the control variables used in Table 2
(not shown). Standard errors, clustered by state, are reported in parentheses. Dependent variables are
measured in constant 2007 dollars per pupil. The poverty dummies indicate the district’s quartile in the
proportion of students living in poverty, relative to their state and year. Democratic, Republican, and
Divided SFJs are dummy variables for the partisan composition of the state government at the time of an
SFJ. The omitted category is no SFJ.
* significant at 10 percent, ** significant at 5 percent, *** significant at 1 percent
28 The University of Chicago Law Review [79:1
TABLE 4A. AUXILIARY TESTS
Coefficients Tested Total Revenue State Revenue Local Revenue
Democratic=Divided 0.0463 0.6440 0.9800
Democratic=Republican 0.0994 0.4843 0.6872
Divided=Republican 0.6067 0.2471 0.3809
Poor=UM 0.0101 0.0965 0.7458
Poor=Rich 0.0059 0.0522 0.9759
UM=Rich 0.1708 0.0626 0.5648
Democratic-poor=Democratic-UM 0.9195 0.3099 0.0933
Democratic-poor=Democratic-rich 0.2281 0.7603 0.1228
Democratic-UM=Democratic-rich 0.0448 0.8668 0.2219
Divided-poor=Divided-UM 0.0155 0.0189 0.0784
Divided-poor=Divided-Rich 0.0293 0.0155 0.2212
Divided-UM=Divided-Rich 0.2223 0.0440 0.7724
Republican-poor=Republican-UM 0.0344 0.0079 0.0000
Republican-poor=Republican-rich 0.0258 0.0064 0.0020
Republican-UM=Republican-rich 0.1347 0.0266 0.0309
Democratic-poor=Republican-poor 0.0498 0.3981 0.8604
Democratic-poor=Divided-poor 0.0123 0.1445 0.4984
Republican-poor=Divided-poor 0.2672 0.3460 0.3225
Democratic-UM=Republican-UM 0.0265 0.1266 0.3867
Democratic-UM=Divided-UM 0.5248 0.1894 0.1114
Divided-UM=Republican-UM 0.1407 0.4001 0.1277
Democratic-rich=Divided-rich 0.0134 0.1502 0.8579
Democratic-rich=Republican-rich 0.7128 0.0862 0.0386
Divided-rich=Republican-rich 0.0140 0.6596 0.0030
Notes: Cells report p-values from tests of the equality of the coefficients from Table 4 for different
comparisons of partisan control and district poverty.
2012] Making Courts Matter 29
APPENDIX TABLE 1. CASES INCLUDED IN SFJ DUMMY
State Year Case Governor
Party House Party
Senate Party
Subsequent Reform Cases
AL 1993 Opinion of the Justices D D D 0
CT 1996 Sheff v O’Neill R D D 1
ID 1993 Idaho Schools for Equal Educational Opportunity v Evans
D R R 2
KS 1991 Mock v Kansas D D R 2
KY 1989 Rose v Council for Better Education D D D 0
MD 2000 Bradford v Maryland State Board of Education
D D D 0
MA 1993 McDuffy v Secretary of Executive Office of Education
R D D 0
MN 2000 Minneapolis Branch of the NAACP v Minnesota
I R D 0
MO 1993 Committee for Educational Equality v Missouri
D D D 0
MT 1990 Helena Elementary School District No 1 v Montana, as modified
R D D 1
NH 1993 Claremont School District v Governor
R R R 3
NJ 2000 Abbott v Burke D R R 3
NY 1995 Campaign for Fiscal Equity v New York
R D R 1
NC 1997 Leandro v North Carolina D R D 1
OH 1997 DeRolph v Ohio, as clarified R R R 2
SC 1999 Abbeville County School District v South Carolina
D R D 1
TN 1995 Tennessee Small School Systems v McWherter (“Small Schools II”)
D D D 0
TX 1989 Edgewood Independent School District v Kirby
R D D 1
VT 1997 Brigham v Vermont D D D 1
WV 1995 Tomblin v Gainer D D D 0
WY 1995 Campbell County School District v Wyoming
R R R 1
Sources: Peterson and West, eds, School Money Trials (cited in note 13) (providing information on court
decisions); National Governors Association, Past Governors Bios, (cited in note 45) (providing information on
partisan control); US Census Bureau, The 2007 Statistical Abstract at 385–414, online at http://www.census.gov
/compendia/statab/2007/2007edition.html (visited Oct 16, 2011).