Embed Size (px)
Citation preview
1
THE UNIVERSITY OF NORTH CAROLINA
REMEDIAL/DEVELOPMENTAL ACTIVITIES REPORT
2011-12
The University of North Carolina General Administration
February 2013
2
Remedial/Developmental Activities in UNC Institutions: 2011-12
Executive Summary
Remedial/Developmental Activities and Expenditures
• In 2011-12, the annual unduplicated enrollment in remedial instruction was 3,900: a
decrease of 735 (-16%) from the previous year.
• Expenditures for remedial/developmental activities in 2011-12 totaled $1,821,321: a
decrease of 26% over the previous year ($2,445,367). A sum of $951,511 (52% of
total remedial/developmental expenditures) was spent on courses.
• State funds provided $1,366,989 (75%) of the total amount expended for remediation.
This amount represents less than one tenth of a percent (0.04%) of the total system-
wide budget coming from state funds. Non-state funds provided an additional
$454,332 (25%) in remedial support.
o State funds dedicated to remediation are taken from institutions’ instructional
budgets and are not appropriated as a separate line item.
Students taking any remedial course(s) had a freshman-to-sophomore retention rate of
76% at any UNC institution compared with 86% for students who took no remedial
courses.
Students who took any remedial course(s) had lower graduation rates than students
who did not. Nevertheless, 45% of those who took any remedial course(s) did receive
their degree within six years of matriculation compared to 66% percent of students
taking no remedial courses.
Long-Term Trends in Remedial/Developmental Activities & Expenditures
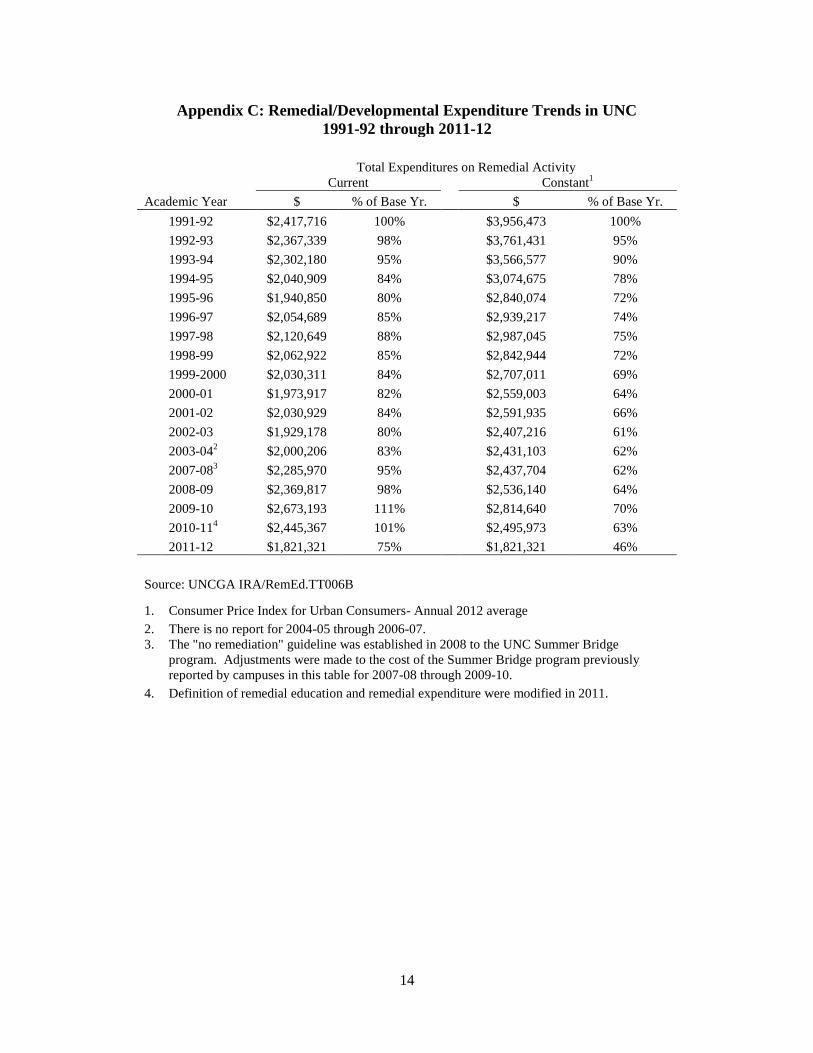
Expenditures for remedial education (in inflation-adjusted dollars) declined by 54%
between 1992 and 2012.
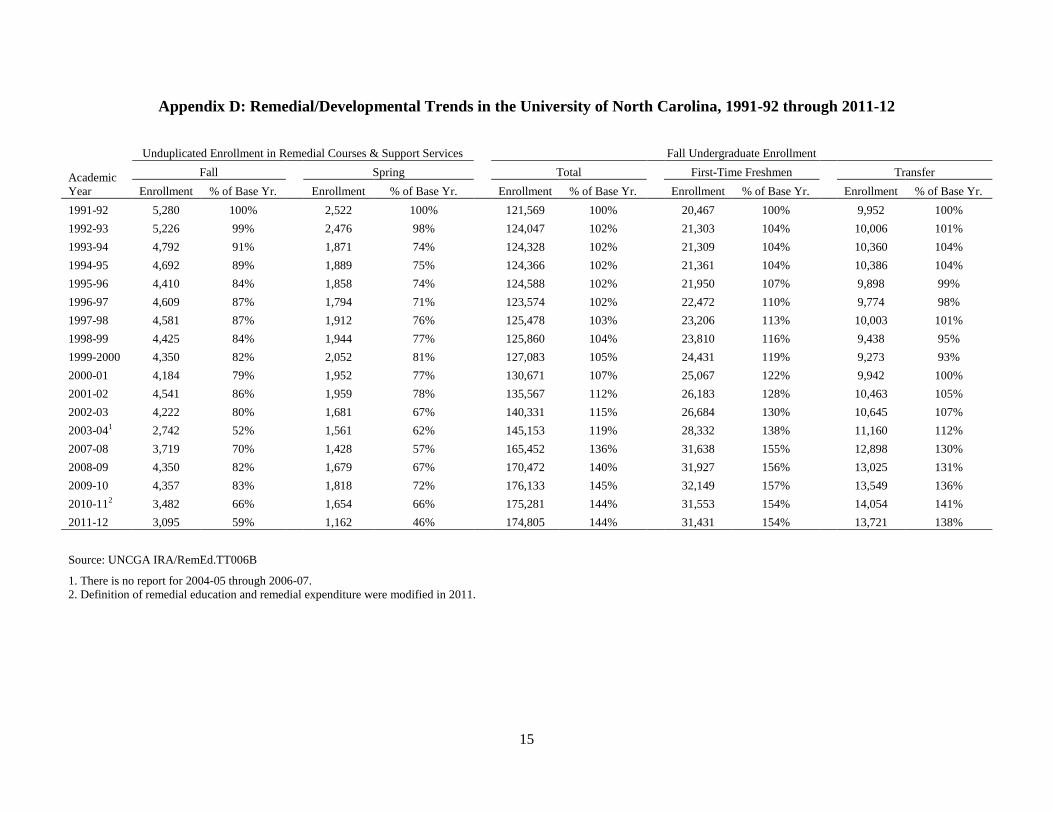
Remedial and developmental enrollment declined by 41% in Fall semesters and by
54% in Spring semesters (a combined 45% decline) between 1992 and 2012.
3
Remedial/Developmental Instruction in University of North Carolina: 2011-12
Introduction
Remedial and developmental courses and services at the University of North Carolina
(UNC) are designed to address differences in pre-college preparation among our diverse student
body.1 Often the instruction aims to address gaps in knowledge (remediation) and provide
students with the skills needed for continued learning and college success (developmental).
These efforts occur in traditional classroom settings and through additional delivery methods that
vary both within and among the campuses (e.g., scheduled classes, additional break-out sessions,
skill labs, and special tutorial sessions). Remedial instruction occurs at a greater frequency in the
fall and is provided to incoming students. As a practice, these courses do not bear credit towards
graduation, but do count towards the student’s semester course load. A common definition of
remedial/developmental activity was adopted by UNC in September 2011 and is used across all
UNC campuses. The official definition is provided in Appendix A.
The funds that UNC campuses use to support remedial instruction are not received as a
special appropriation. Rather, the campuses direct some of their general instructional funds to
support this requirement, which comes from a mix of state and non-state sources.
In this report, four measures around remediation are provided: course sections,
enrollments (duplicated and unduplicated)2, expenditures for all remedial activities (classroom
and alternate delivery methods), and continued student success (retention and graduation rates of
freshmen who took remedial courses). Total expenditures include both the costs of the actual
course delivery and related academic support services. Taken as a whole, we find continued
decline in remedial/developmental activity at UNC.
1 See the Integrated Postsecondary Education Data System (IPEDS) definition of remedial courses and services.
2 Students may enroll in several forms of remedial/developmental education, requiring the need to show both
unduplicated and duplicated headcounts. Unduplicated headcount addresses the number of individual students
participating in these activities across the UNC system. Duplicated headcount (i.e. the same student will be counted
in both math and English if he or she takes both) is used to assess the relative magnitude of remedial/developmental
activity across subject matter.
4
2011-12 Course Sections and Enrollments
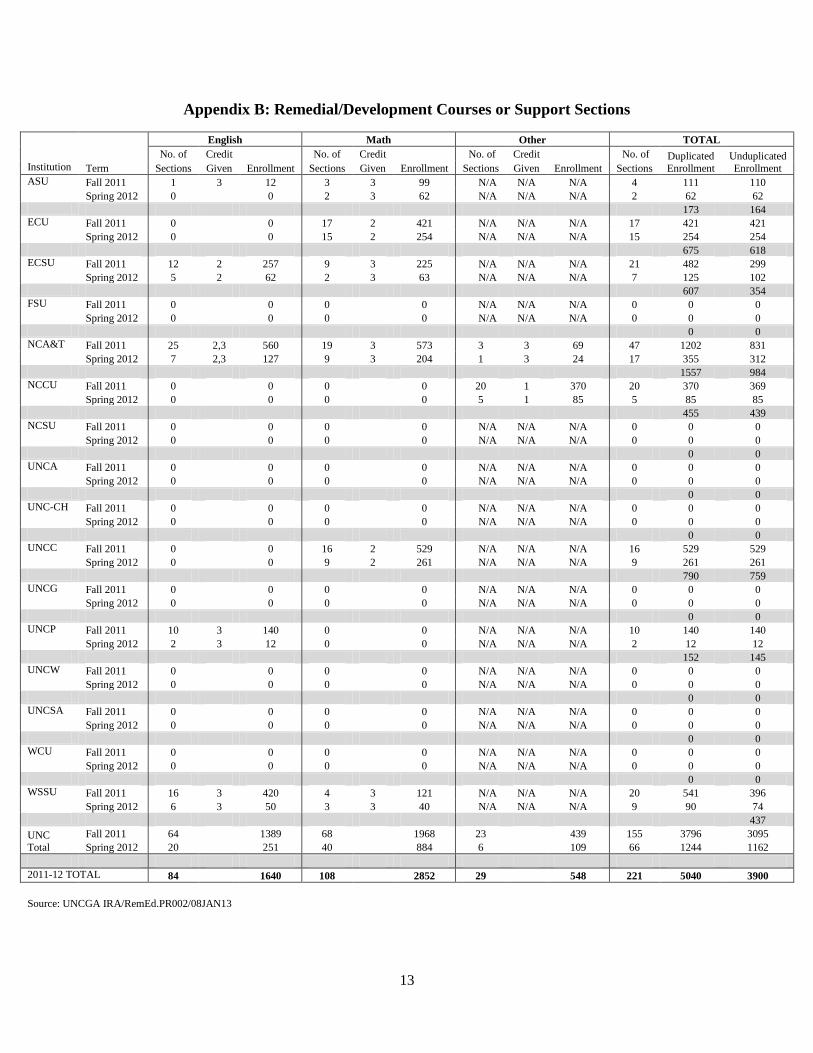
In 2011-12 (fall and spring semesters), 84 sections of remedial English (enrolling 1,640
students) and 108 sections of math (enrolling 2,852 students) were offered across the UNC
system.3 At two campuses, an additional 548 students enrolled in 29 sections of other remedial
courses.4 In total, 221 sections of remedial/developmental instruction were provided with a
combined (duplicated) enrollment of 5,040. The total duplicated enrollment was down 1,303 (a
21% decrease) from 2010-11. The number of unduplicated students in remedial/developmental
classes was 3,900 in 2011-12, down 735 (16%) from the previous year.
Please see Appendix B for the table detailing the duplicated and unduplicated
remedial/developmental activity enrollment by campus.
Figures 1 illustrates longer term trends in unduplicated head count. Between 1992 and
2012, remedial and developmental activities have declined in both fall and spring semesters,
from 5280 to 3095 (-41%) and 2522 to 1162 (-54%), respectively. Overall, there has been a 45%
decrease over the past two decades.
3 For details on the methods UNC institutions use to place students in remedial courses, see Appendix F and G.
4 NCA&T offers remediation for Chemistry and NCCU offers remediation for reading.
Remedial/Developmental Enrollments
5
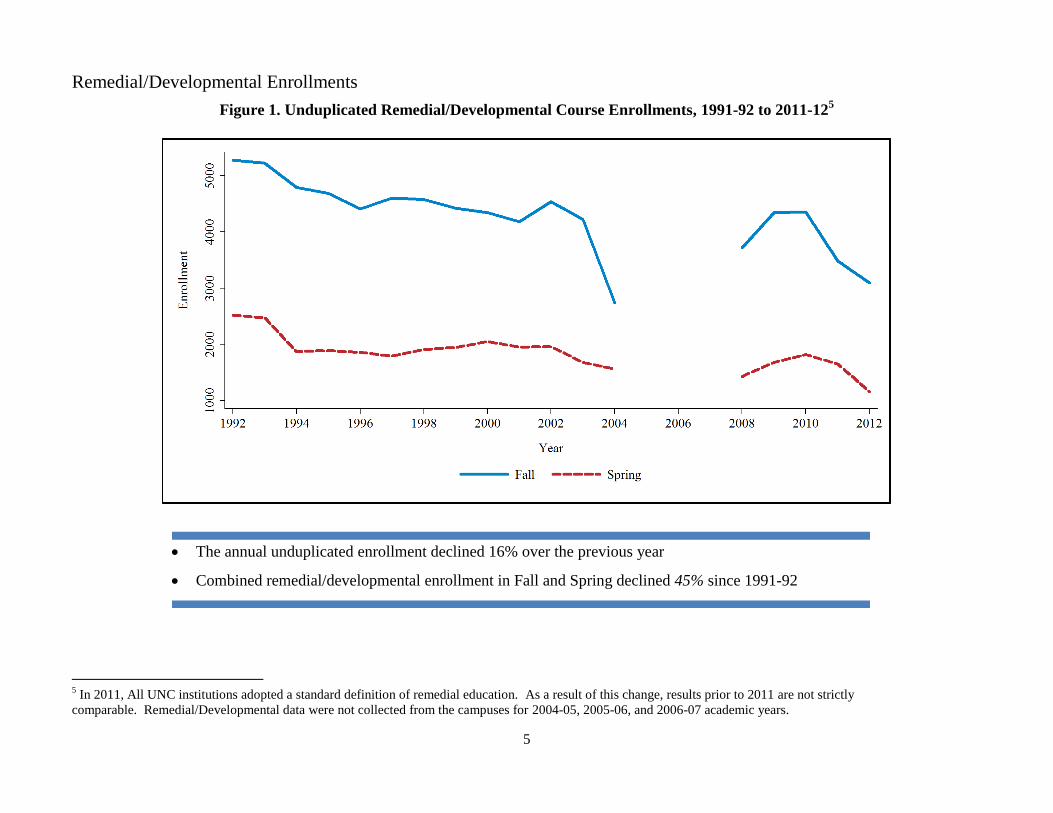
Figure 1. Unduplicated Remedial/Developmental Course Enrollments, 1991-92 to 2011-125
5 In 2011, All UNC institutions adopted a standard definition of remedial education. As a result of this change, results prior to 2011 are not strictly
comparable. Remedial/Developmental data were not collected from the campuses for 2004-05, 2005-06, and 2006-07 academic years.
The annual unduplicated enrollment declined 16% over the previous year
Combined remedial/developmental enrollment in Fall and Spring declined 45% since 1991-92
6
Expenditures
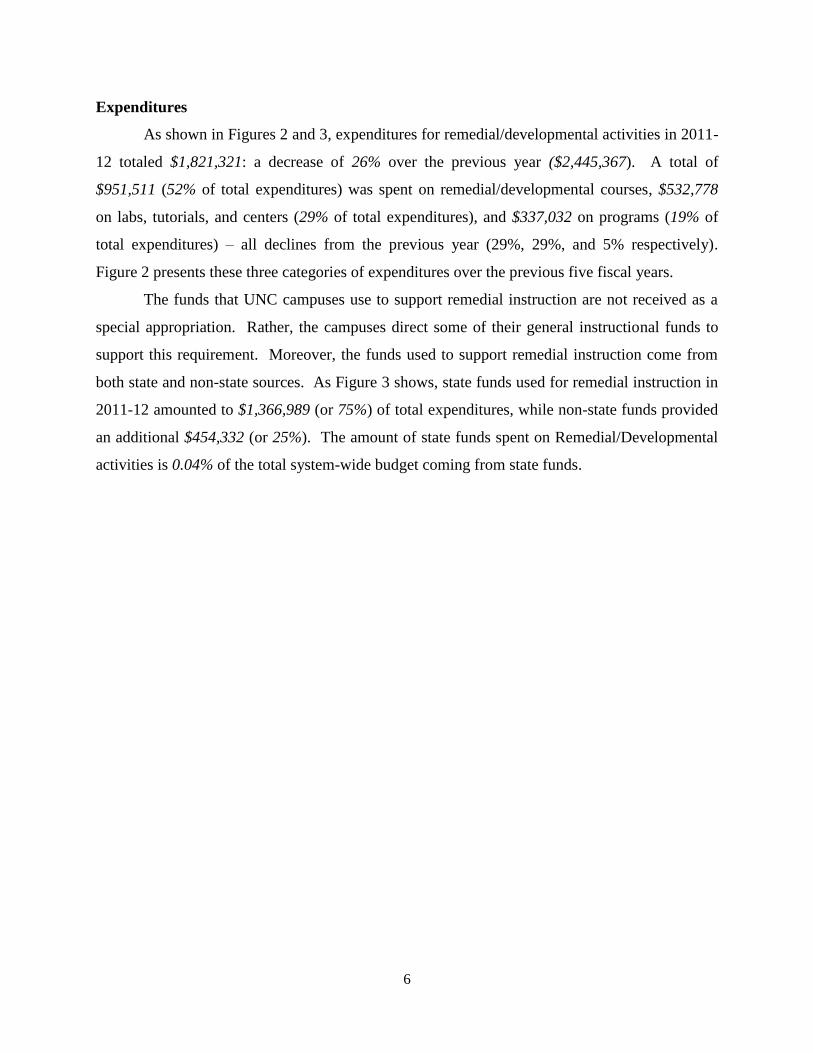
As shown in Figures 2 and 3, expenditures for remedial/developmental activities in 2011-
12 totaled $1,821,321: a decrease of 26% over the previous year ($2,445,367). A total of
$951,511 (52% of total expenditures) was spent on remedial/developmental courses, $532,778
on labs, tutorials, and centers (29% of total expenditures), and $337,032 on programs (19% of
total expenditures) – all declines from the previous year (29%, 29%, and 5% respectively).
Figure 2 presents these three categories of expenditures over the previous five fiscal years.
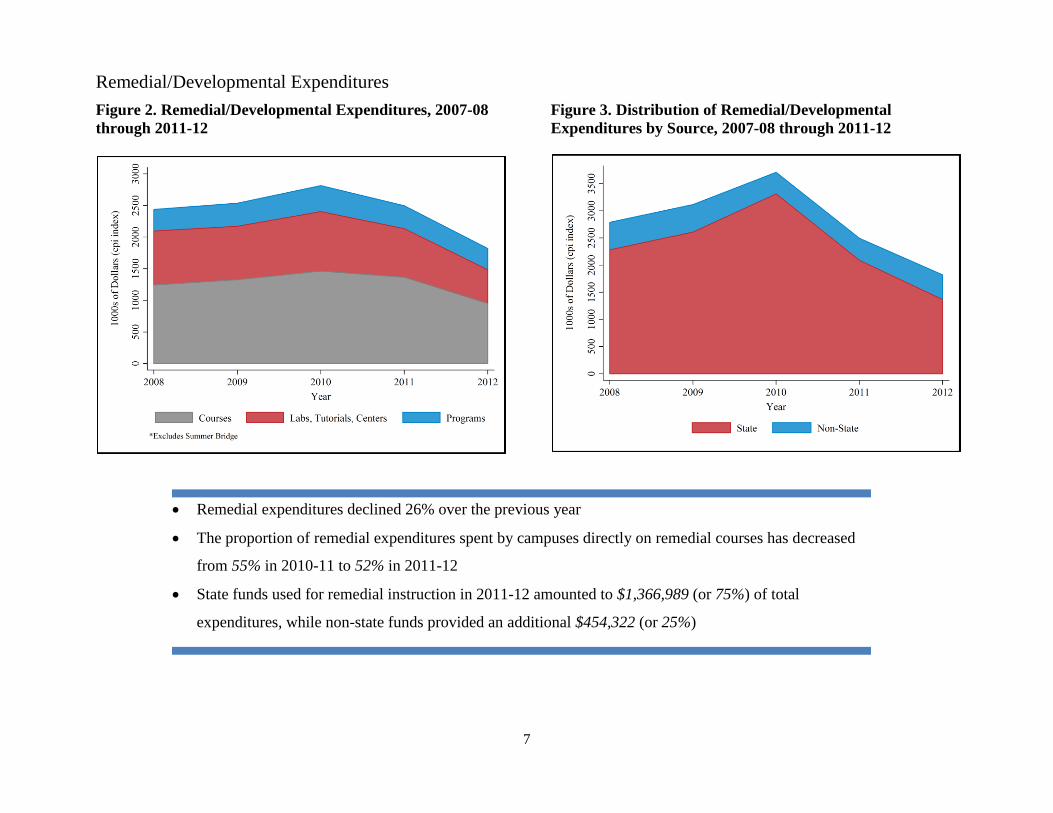
The funds that UNC campuses use to support remedial instruction are not received as a
special appropriation. Rather, the campuses direct some of their general instructional funds to
support this requirement. Moreover, the funds used to support remedial instruction come from
both state and non-state sources. As Figure 3 shows, state funds used for remedial instruction in
2011-12 amounted to $1,366,989 (or 75%) of total expenditures, while non-state funds provided
an additional $454,332 (or 25%). The amount of state funds spent on Remedial/Developmental
activities is 0.04% of the total system-wide budget coming from state funds.
Remedial/Developmental Expenditures
7
Figure 2. Remedial/Developmental Expenditures, 2007-08
through 2011-12
Figure 3. Distribution of Remedial/Developmental
Expenditures by Source, 2007-08 through 2011-12
Remedial expenditures declined 26% over the previous year
The proportion of remedial expenditures spent by campuses directly on remedial courses has decreased
from 55% in 2010-11 to 52% in 2011-12
State funds used for remedial instruction in 2011-12 amounted to $1,366,989 (or 75%) of total
expenditures, while non-state funds provided an additional $454,322 (or 25%)
8
Remedial/Developmental Activities Trend
The data in this report show that during the two decades under consideration there was a
general decline in the number of sections of remedial instruction, unduplicated enrollment in
remedial instruction, and expenditures for remedial instruction (both actual and inflation-
adjusted).
The data in Appendix D show that the unduplicated enrollment in all remedial courses
during the last two decades was at a high during 1991-92, with a fall enrollment of 5,280 and a
spring enrollment of 2,522. The decline in remedial instruction since 1991-92 occurred at a time
when enrollments among total undergraduates, freshmen, and transfer students increased. For
example, unduplicated enrollment in remedial instruction in Fall 2011 was 59% of what it was in
Fall 1991, while total fall undergraduate enrollment increased by 44% during the same period.
Figure 4 displays the percent change in remedial/developmental expenditures,
enrollment, and total fall unduplicated enrollment since 1991-92. The fall unduplicated remedial
enrollment has declined 41% and inflation-adjusted expenditures for remedial education have
declined by 54%, while total fall undergraduate enrollment has increased by 44%.
Change in Remedial and Developmental Activity
9
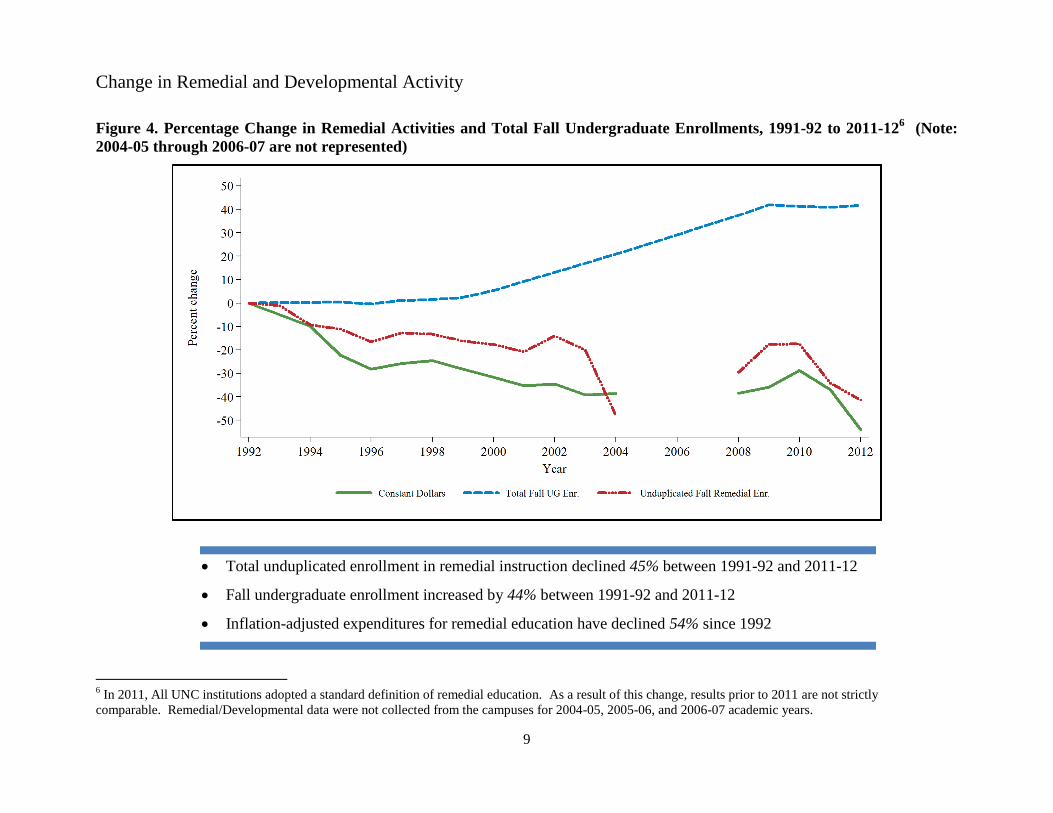
Figure 4. Percentage Change in Remedial Activities and Total Fall Undergraduate Enrollments, 1991-92 to 2011-126 (Note:
2004-05 through 2006-07 are not represented)
6 In 2011, All UNC institutions adopted a standard definition of remedial education. As a result of this change, results prior to 2011 are not strictly
comparable. Remedial/Developmental data were not collected from the campuses for 2004-05, 2005-06, and 2006-07 academic years.
Total unduplicated enrollment in remedial instruction declined 45% between 1991-92 and 2011-12
Fall undergraduate enrollment increased by 44% between 1991-92 and 2011-12
Inflation-adjusted expenditures for remedial education have declined 54% since 1992
10
Retention and Graduation Rates
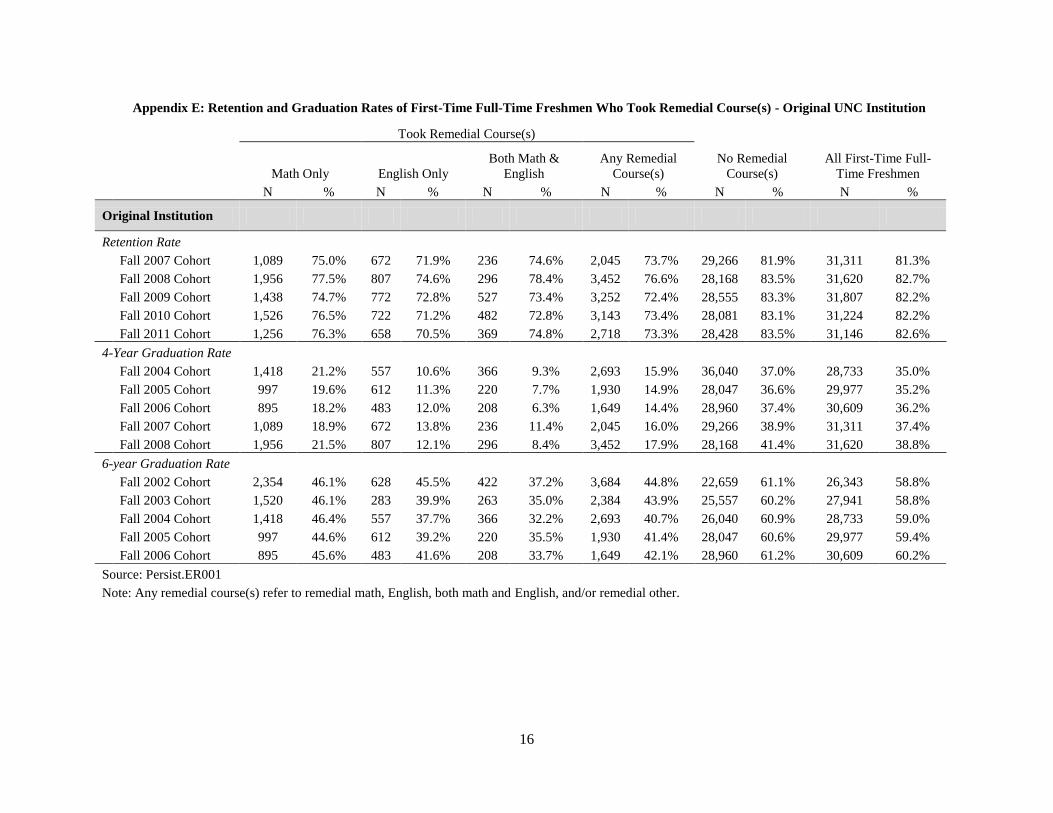
In order to measure the success of students who took remedial courses, we track the
retention and graduation rates of first-time full-time freshmen who took remedial course(s). Data
in Appendix E show the retention and graduation rates by category of remedial instruction (math
only, English only, both math and English, or any remedial course(s)). The rates for all first-time
full-time freshmen and those who did not take any remedial courses are also provided for
comparison purposes.
As shown in Figure 5, those who took only remedial English tended to have the lowest
retention rate, while students taking both remedial math and English on average have the lowest
graduation rate. In both retention and graduation measures, those students taking math only had
the highest success rates among students involved in remedial activities. As expected, those
first-time full-time freshmen who did not take any remedial courses had the highest retention
rate.
Although there are more students enrolled in remedial math than remedial English, as a
percentage, students enrolled in English remediation underperform students receiving only math
remediation in our conventional measures of student success. When reviewed at the campus
level, the retention and graduation rates between students participating in English-only or math-
only remedial/development activities have small cohorts, which make comparisons difficult.7
7 See Appendix B for detailed enrollments in remedial courses by campus.
Remedial/Developmental Retention & Graduation
11
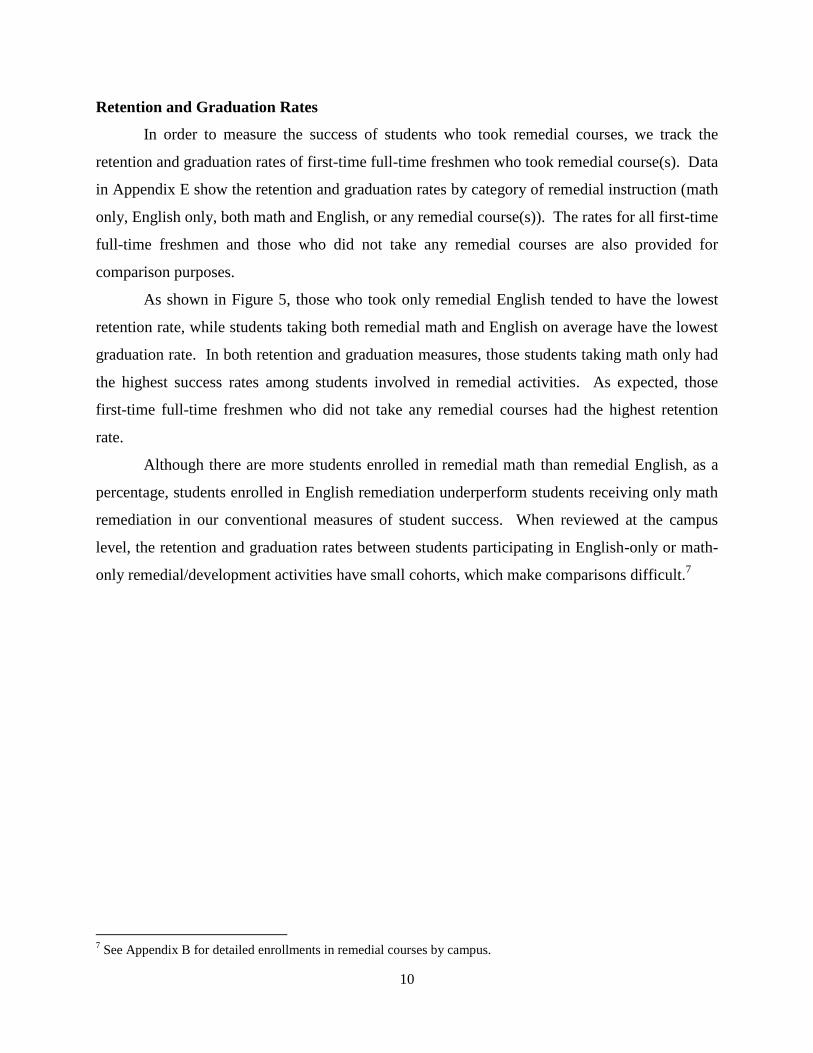
Figure 5. Retention and Six-year Graduation Rates of First-Time Full-Time Freshmen at any UNC Institution, by Remedial
Activity (Fall 2011 and 2006 Cohorts)
First-time full-time freshmen taking any remedial course at any UNC institution had a retention rate of 75.8%
o First-time full-time freshmen taking remedial math only at any UNC institution had a higher retention rate
(78.7%) than those taking remedial English only (72.5%)
First-time full-time freshmen taking any remedial course at any UNC institution had a six-year graduation rate of 45.2%
o First-time full-time freshmen taking remedial math only at any UNC institution had a higher six-year graduation
rate (48.6%) than those taking remedial English only (45.5%)
Students taking remedial math courses are 2.9% of the UNC student population
Students taking remedial English courses are 1.6% of the UNC student population
Students enrolled in remedial math (2,852) are nearly double those enrolled in remedial English (1,640)
12
Appendix A: Remedial and Developmental Courses and Activities Definition
The need for remedial instruction has been defined, determined, and delivered as defined
at the institutional level since the inception of this report. In order to create a University-wide
definition of “remedial instruction” to be used when determining the extent of such instruction
across UNC, the campus Chief Academic Officers and General Administration agreed in
September 2011 to adopt a common definition for future reports. This University-wide
definition consists of two parts:
1. Remedial courses shall be defined as “courses in reading, writing, or mathematics for
college-level students lacking those skills necessary to perform college-level work at the
level required by the institution. Students participating in remedial education while in
college may not earn credit toward their degrees by completion of these courses." (Note:
Courses in other disciplines, such as chemistry, that are classified as remedial by a
campus should be reported as remedial education courses.)
2. In addition to remedial courses, there are related services such as academic skill labs,
tutorials, learning assistance centers, and special services programs. Only those services
that are provided exclusively for the purposes of supporting students needing remediation
shall be included in cost summaries. Support services provided to any student are
excluded. For example:
Excluded is the cost of student advising, placement testing, and tutoring that are
provided to undergraduates generally.
Included would be the cost of any additional advising and testing services
provided only to students needing remedial assistance.
Salaries of regular administrators such as vice chancellors, deans, and directors
are excluded unless they have direct responsibility for some aspect of remedial
instruction or associated services.
This definition will guide the remedial instruction practice on campuses and the generation of the
Remedial/Developmental Activities Report going forward.
13
Appendix B: Remedial/Development Courses or Support Sections
English Math Other TOTAL
No. of Credit
Enrollment
No. of Credit
Enrollment
No. of Credit
Enrollment
No. of Duplicated
Enrollment
Unduplicated
Enrollment Institution Term Sections Given Sections Given Sections Given Sections
ASU Fall 2011 1 3 12 3 3 99 N/A N/A N/A 4 111 110
Spring 2012 0
0 2 3 62 N/A N/A N/A 2 62 62
173 164
ECU Fall 2011 0
0 17 2 421 N/A N/A N/A 17 421 421
Spring 2012 0
0 15 2 254 N/A N/A N/A 15 254 254
675 618
ECSU Fall 2011 12 2 257 9 3 225 N/A N/A N/A 21 482 299
Spring 2012 5 2 62 2 3 63 N/A N/A N/A 7 125 102
607 354
FSU Fall 2011 0
0 0
0 N/A N/A N/A 0 0 0
Spring 2012 0
0 0
0 N/A N/A N/A 0 0 0
0 0
NCA&T Fall 2011 25 2,3 560 19 3 573 3 3 69 47 1202 831
Spring 2012 7 2,3 127 9 3 204 1 3 24 17 355 312
1557 984
NCCU Fall 2011 0
0 0
0 20 1 370 20 370 369
Spring 2012 0
0 0
0 5 1 85 5 85 85
455 439
NCSU Fall 2011 0
0 0
0 N/A N/A N/A 0 0 0
Spring 2012 0
0 0
0 N/A N/A N/A 0 0 0
0 0
UNCA Fall 2011 0
0 0
0 N/A N/A N/A 0 0 0
Spring 2012 0
0 0
0 N/A N/A N/A 0 0 0
0 0
UNC-CH Fall 2011 0
0 0
0 N/A N/A N/A 0 0 0
Spring 2012 0
0 0
0 N/A N/A N/A 0 0 0
0 0
UNCC Fall 2011 0
0 16 2 529 N/A N/A N/A 16 529 529
Spring 2012 0
0 9 2 261 N/A N/A N/A 9 261 261
790 759
UNCG Fall 2011 0
0 0
0 N/A N/A N/A 0 0 0
Spring 2012 0
0 0
0 N/A N/A N/A 0 0 0
0 0
UNCP Fall 2011 10 3 140 0
0 N/A N/A N/A 10 140 140
Spring 2012 2 3 12 0
0 N/A N/A N/A 2 12 12
152 145
UNCW Fall 2011 0
0 0
0 N/A N/A N/A 0 0 0
Spring 2012 0
0 0
0 N/A N/A N/A 0 0 0
0 0
UNCSA Fall 2011 0
0 0
0 N/A N/A N/A 0 0 0
Spring 2012 0
0 0
0 N/A N/A N/A 0 0 0
0 0
WCU Fall 2011 0
0 0
0 N/A N/A N/A 0 0 0
Spring 2012 0
0 0
0 N/A N/A N/A 0 0 0
0 0
WSSU Fall 2011 16 3 420 4 3 121 N/A N/A N/A 20 541 396
Spring 2012 6 3 50 3 3 40 N/A N/A N/A 9 90 74
437
UNC
Total
Fall 2011 64
1389 68
1968 23
439 155 3796 3095
Spring 2012 20 251 40 884 6 109 66 1244 1162
2011-12 TOTAL 84 1640 108 2852 29 548 221 5040 3900
Source: UNCGA IRA/RemEd.PR002/08JAN13
14
Appendix C: Remedial/Developmental Expenditure Trends in UNC
1991-92 through 2011-12
Total Expenditures on Remedial Activity
Current
Constant1
Academic Year $ % of Base Yr. $ % of Base Yr.
1991-92 $2,417,716 100%
$3,956,473 100%
1992-93 $2,367,339 98%
$3,761,431 95%
1993-94 $2,302,180 95%
$3,566,577 90%
1994-95 $2,040,909 84%
$3,074,675 78%
1995-96 $1,940,850 80%
$2,840,074 72%
1996-97 $2,054,689 85%
$2,939,217 74%
1997-98 $2,120,649 88%
$2,987,045 75%
1998-99 $2,062,922 85%
$2,842,944 72%
1999-2000 $2,030,311 84%
$2,707,011 69%
2000-01 $1,973,917 82%
$2,559,003 64%
2001-02 $2,030,929 84%
$2,591,935 66%
2002-03 $1,929,178 80%
$2,407,216 61%
2003-042 $2,000,206 83%
$2,431,103 62%
2007-083 $2,285,970 95%
$2,437,704 62%
2008-09 $2,369,817 98%
$2,536,140 64%
2009-10 $2,673,193 111%
$2,814,640 70%
2010-114 $2,445,367 101%
$2,495,973 63%
2011-12 $1,821,321 75%
$1,821,321 46%
Source: UNCGA IRA/RemEd.TT006B
1. Consumer Price Index for Urban Consumers- Annual 2012 average
2. There is no report for 2004-05 through 2006-07.
3. The "no remediation" guideline was established in 2008 to the UNC Summer Bridge
program. Adjustments were made to the cost of the Summer Bridge program previously
reported by campuses in this table for 2007-08 through 2009-10.
4. Definition of remedial education and remedial expenditure were modified in 2011.
15
Appendix D: Remedial/Developmental Trends in the University of North Carolina, 1991-92 through 2011-12
Academic
Year
Unduplicated Enrollment in Remedial Courses & Support Services
Fall Undergraduate Enrollment
Fall
Spring
Total
First-Time Freshmen
Transfer
Enrollment % of Base Yr. Enrollment % of Base Yr. Enrollment % of Base Yr. Enrollment % of Base Yr. Enrollment % of Base Yr.
1991-92 5,280 100%
2,522 100%
121,569 100%
20,467 100%
9,952 100%
1992-93 5,226 99%
2,476 98%
124,047 102%
21,303 104%
10,006 101%
1993-94 4,792 91%
1,871 74%
124,328 102%
21,309 104%
10,360 104%
1994-95 4,692 89%
1,889 75%
124,366 102%
21,361 104%
10,386 104%
1995-96 4,410 84%
1,858 74%
124,588 102%
21,950 107%
9,898 99%
1996-97 4,609 87%
1,794 71%
123,574 102%
22,472 110%
9,774 98%
1997-98 4,581 87%
1,912 76%
125,478 103%
23,206 113%
10,003 101%
1998-99 4,425 84%
1,944 77%
125,860 104%
23,810 116%
9,438 95%
1999-2000 4,350 82%
2,052 81%
127,083 105%
24,431 119%
9,273 93%
2000-01 4,184 79%
1,952 77%
130,671 107%
25,067 122%
9,942 100%
2001-02 4,541 86%
1,959 78%
135,567 112%
26,183 128%
10,463 105%
2002-03 4,222 80%
1,681 67%
140,331 115%
26,684 130%
10,645 107%
2003-041 2,742 52%
1,561 62%
145,153 119%
28,332 138%
11,160 112%
2007-08 3,719 70%
1,428 57%
165,452 136%
31,638 155%
12,898 130%
2008-09 4,350 82%
1,679 67%
170,472 140%
31,927 156%
13,025 131%
2009-10 4,357 83%
1,818 72%
176,133 145%
32,149 157%
13,549 136%
2010-112 3,482 66%
1,654 66%
175,281 144%
31,553 154%
14,054 141%
2011-12 3,095 59% 1,162 46% 174,805 144% 31,431 154% 13,721 138%
Source: UNCGA IRA/RemEd.TT006B
1. There is no report for 2004-05 through 2006-07.
2. Definition of remedial education and remedial expenditure were modified in 2011.
16
Appendix E: Retention and Graduation Rates of First-Time Full-Time Freshmen Who Took Remedial Course(s) - Original UNC Institution
Took Remedial Course(s)
Math Only English Only
Both Math &
English
Any Remedial
Course(s)
No Remedial
Course(s)
All First-Time Full-
Time Freshmen
N % N % N % N % N % N %
Original Institution
Retention Rate
Fall 2007 Cohort 1,089 75.0% 672 71.9% 236 74.6% 2,045 73.7% 29,266 81.9% 31,311 81.3%
Fall 2008 Cohort 1,956 77.5% 807 74.6% 296 78.4% 3,452 76.6% 28,168 83.5% 31,620 82.7%
Fall 2009 Cohort 1,438 74.7% 772 72.8% 527 73.4% 3,252 72.4% 28,555 83.3% 31,807 82.2%
Fall 2010 Cohort 1,526 76.5% 722 71.2% 482 72.8% 3,143 73.4% 28,081 83.1% 31,224 82.2%
Fall 2011 Cohort 1,256 76.3% 658 70.5% 369 74.8% 2,718 73.3% 28,428 83.5% 31,146 82.6%
4-Year Graduation Rate
Fall 2004 Cohort 1,418 21.2% 557 10.6% 366 9.3% 2,693 15.9% 36,040 37.0% 28,733 35.0%
Fall 2005 Cohort 997 19.6% 612 11.3% 220 7.7% 1,930 14.9% 28,047 36.6% 29,977 35.2%
Fall 2006 Cohort 895 18.2% 483 12.0% 208 6.3% 1,649 14.4% 28,960 37.4% 30,609 36.2%
Fall 2007 Cohort 1,089 18.9% 672 13.8% 236 11.4% 2,045 16.0% 29,266 38.9% 31,311 37.4%
Fall 2008 Cohort 1,956 21.5% 807 12.1% 296 8.4% 3,452 17.9% 28,168 41.4% 31,620 38.8%
6-year Graduation Rate
Fall 2002 Cohort 2,354 46.1% 628 45.5% 422 37.2% 3,684 44.8% 22,659 61.1% 26,343 58.8%
Fall 2003 Cohort 1,520 46.1% 283 39.9% 263 35.0% 2,384 43.9% 25,557 60.2% 27,941 58.8%
Fall 2004 Cohort 1,418 46.4% 557 37.7% 366 32.2% 2,693 40.7% 26,040 60.9% 28,733 59.0%
Fall 2005 Cohort 997 44.6% 612 39.2% 220 35.5% 1,930 41.4% 28,047 60.6% 29,977 59.4%
Fall 2006 Cohort 895 45.6% 483 41.6% 208 33.7% 1,649 42.1% 28,960 61.2% 30,609 60.2%
Source: Persist.ER001
Note: Any remedial course(s) refer to remedial math, English, both math and English, and/or remedial other.
17
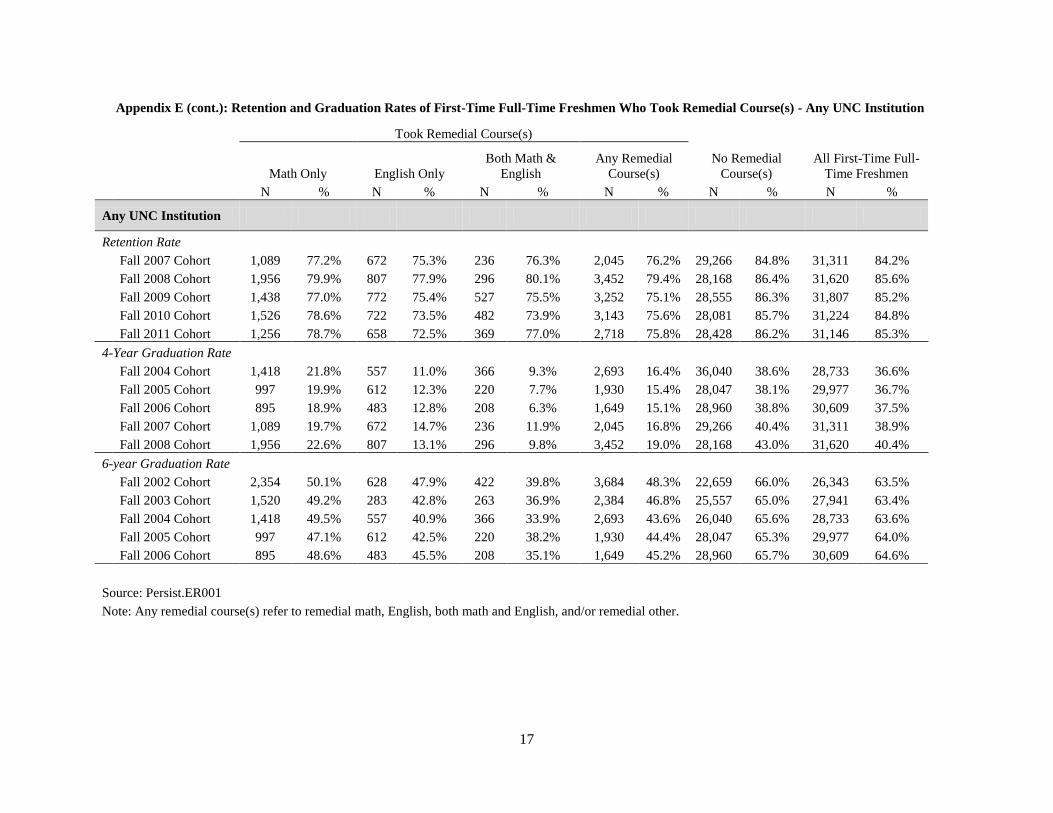
Appendix E (cont.): Retention and Graduation Rates of First-Time Full-Time Freshmen Who Took Remedial Course(s) - Any UNC Institution
Took Remedial Course(s)
Math Only English Only
Both Math &
English
Any Remedial
Course(s)
No Remedial
Course(s)
All First-Time Full-
Time Freshmen
N % N % N % N % N % N %
Any UNC Institution
Retention Rate
Fall 2007 Cohort 1,089 77.2% 672 75.3% 236 76.3% 2,045 76.2% 29,266 84.8% 31,311 84.2%
Fall 2008 Cohort 1,956 79.9% 807 77.9% 296 80.1% 3,452 79.4% 28,168 86.4% 31,620 85.6%
Fall 2009 Cohort 1,438 77.0% 772 75.4% 527 75.5% 3,252 75.1% 28,555 86.3% 31,807 85.2%
Fall 2010 Cohort 1,526 78.6% 722 73.5% 482 73.9% 3,143 75.6% 28,081 85.7% 31,224 84.8%
Fall 2011 Cohort 1,256 78.7% 658 72.5% 369 77.0% 2,718 75.8% 28,428 86.2% 31,146 85.3%
4-Year Graduation Rate
Fall 2004 Cohort 1,418 21.8% 557 11.0% 366 9.3% 2,693 16.4% 36,040 38.6% 28,733 36.6%
Fall 2005 Cohort 997 19.9% 612 12.3% 220 7.7% 1,930 15.4% 28,047 38.1% 29,977 36.7%
Fall 2006 Cohort 895 18.9% 483 12.8% 208 6.3% 1,649 15.1% 28,960 38.8% 30,609 37.5%
Fall 2007 Cohort 1,089 19.7% 672 14.7% 236 11.9% 2,045 16.8% 29,266 40.4% 31,311 38.9%
Fall 2008 Cohort 1,956 22.6% 807 13.1% 296 9.8% 3,452 19.0% 28,168 43.0% 31,620 40.4%
6-year Graduation Rate
Fall 2002 Cohort 2,354 50.1% 628 47.9% 422 39.8% 3,684 48.3% 22,659 66.0% 26,343 63.5%
Fall 2003 Cohort 1,520 49.2% 283 42.8% 263 36.9% 2,384 46.8% 25,557 65.0% 27,941 63.4%
Fall 2004 Cohort 1,418 49.5% 557 40.9% 366 33.9% 2,693 43.6% 26,040 65.6% 28,733 63.6%
Fall 2005 Cohort 997 47.1% 612 42.5% 220 38.2% 1,930 44.4% 28,047 65.3% 29,977 64.0%
Fall 2006 Cohort 895 48.6% 483 45.5% 208 35.1% 1,649 45.2% 28,960 65.7% 30,609 64.6%
Source: Persist.ER001
Note: Any remedial course(s) refer to remedial math, English, both math and English, and/or remedial other.
18
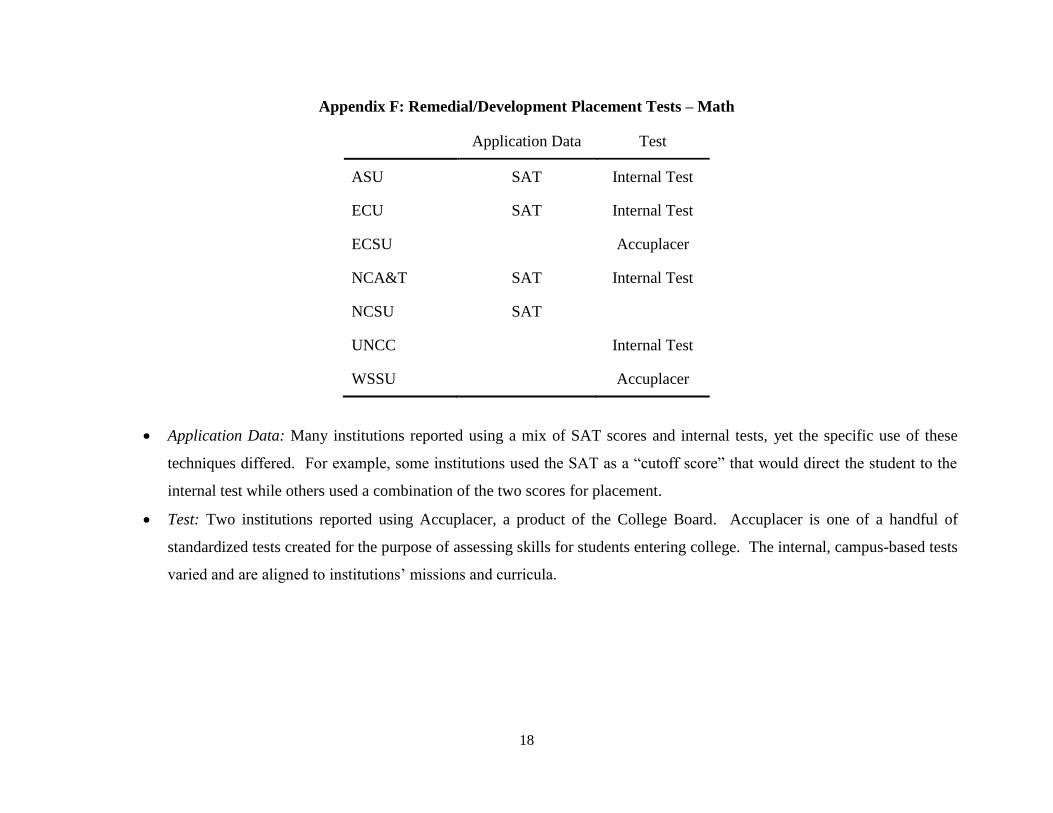
Appendix F: Remedial/Development Placement Tests – Math
Application Data Test
ASU SAT Internal Test
ECU SAT Internal Test
ECSU Accuplacer
NCA&T SAT Internal Test
NCSU SAT
UNCC Internal Test
WSSU Accuplacer
Application Data: Many institutions reported using a mix of SAT scores and internal tests, yet the specific use of these
techniques differed. For example, some institutions used the SAT as a “cutoff score” that would direct the student to the
internal test while others used a combination of the two scores for placement.
Test: Two institutions reported using Accuplacer, a product of the College Board. Accuplacer is one of a handful of
standardized tests created for the purpose of assessing skills for students entering college. The internal, campus-based tests
varied and are aligned to institutions’ missions and curricula.
19
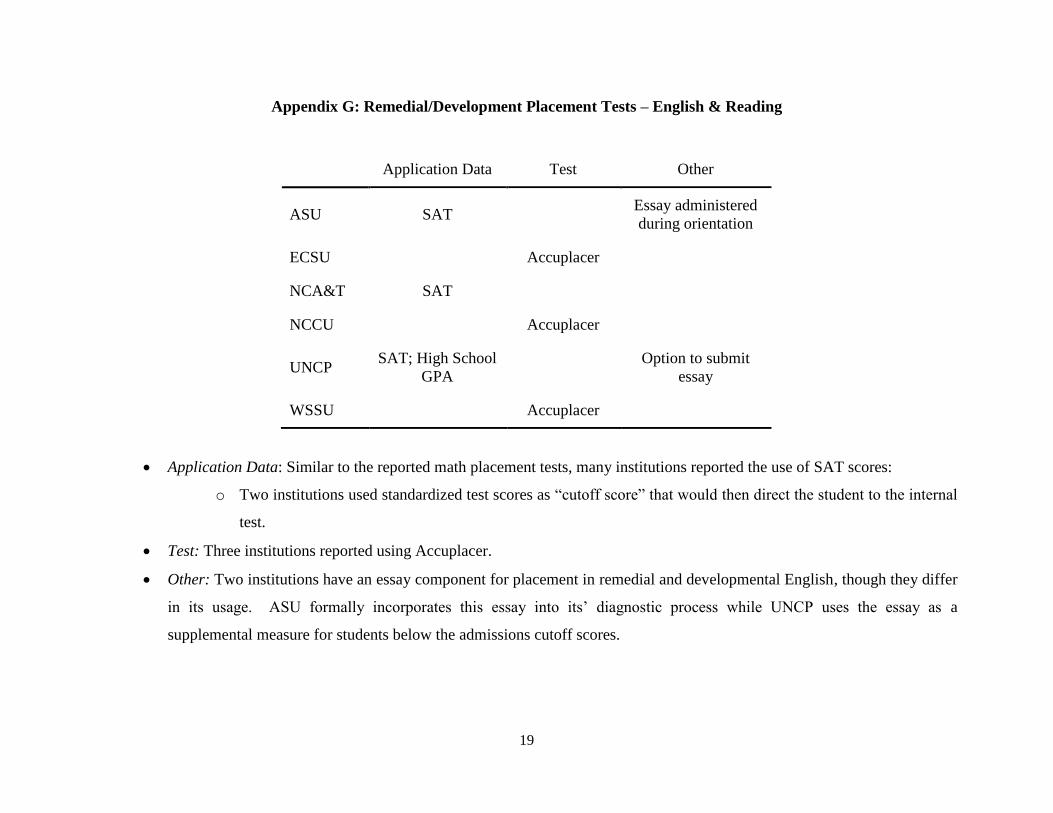
Appendix G: Remedial/Development Placement Tests – English & Reading
Application Data Test Other
ASU SAT Essay administered
during orientation
ECSU Accuplacer
NCA&T SAT
NCCU Accuplacer
UNCP SAT; High School
GPA
Option to submit
essay
WSSU Accuplacer
Application Data: Similar to the reported math placement tests, many institutions reported the use of SAT scores:
o Two institutions used standardized test scores as “cutoff score” that would then direct the student to the internal
test.
Test: Three institutions reported using Accuplacer.
Other: Two institutions have an essay component for placement in remedial and developmental English, though they differ
in its usage. ASU formally incorporates this essay into its’ diagnostic process while UNCP uses the essay as a
supplemental measure for students below the admissions cutoff scores.