Embed Size (px)
Citation preview
275
RAFAEL LA PORTADartmouth College
ANDREI SHLEIFERHarvard University
The Unofficial Economy and Economic Development
ABSTRACT In developing countries, informal firms account for up to abouthalf of all economic activity. Using data from World Bank firm-level surveys,we find that informal firms are small and extremely unproductive comparedwith even the small formal firms in the sample, and especially relative to thelarger formal firms. Formal firms are run by much better educated managersthan informal ones and use more capital, have different customers, markettheir products, and use more external finance. Few formal firms have ever oper-ated informally. This evidence supports the dual economy (“Wal-Mart”) theoryof development, in which growth comes about from the creation of highly pro-ductive formal firms. Informal firms keep millions of people alive but disappearas the economy develops.
In many developing countries, unofficial economic activity—that con-ducted by unregistered firms or by registered firms but hidden from
taxation—accounts for between a third and a half of the total. This sharedeclines sharply as the economy develops. Despite the sheer magnitude ofunofficial activity, little is understood about its role in economic develop-ment, and in particular about how important “officializing” this hiddenactivity and the resources devoted to it might be for economic growth.
In this paper we attempt to shed some light on these issues by presentingsome new facts about the unofficial (also called “informal”) economy andinterpreting them in light of various theories. We begin by reviewing thebasic stylized facts: that the unofficial economy is huge, that it shrinkssharply in relative terms as the economy develops, and that various policyvariables that determine the costs and benefits of becoming and stayingofficial influence its size. This evidence is consistent with the generally
11472-06_La Porta_rev2.qxd 3/6/09 1:13 PM Page 275
accepted view that unofficial firms avoid paying taxes and adhering to reg-ulations, but lose access to public goods and other benefits of official status,such as external finance. Much of the existing literature on the unofficialeconomy emphasizes these public policy aspects of the problem.1
Yet crucial as this perspective might be, it says little about the role ofunofficial firms in development. There are three broad views of this role,which we refer to as the romantic view, the parasite view, and the dualeconomy (“dual” for short) view. According to the romantic view, whichwe associate with the work of Hernando de Soto,2 unofficial firms are eitheractually or potentially extremely productive but are held back by govern-ment taxes and regulations, as well as by lack of secure property rights andaccess to finance. Pending the necessary legal reforms, “four billion peoplearound the world are robbed of the chance to better their lives and climb outof poverty, because they are excluded from the rule of law.”3 If the barriersto official status were lowered and capital supplied through microfinance,unofficial firms would register, borrow, and take advantage of other benefitsof official status, and by doing so expand and spark economic growth. Thekey aspect of this optimistic view is that unofficial firms are fundamentallysimilar to official ones but are kept down by policy. In particular, unofficialfirms should look similar to official firms with respect to characteristics notaffected by government policies, such as the characteristics of their entre-preneurs (for example, their education).
The other two views are more skeptical about unofficial firms and in par-ticular see them as quite unproductive, not just because they are deprived ofthe benefits of official status, but also because they are run by entrepreneurswith lower human capital. In these alternative views, development comesabout not so much from the unleashing of informal firms as from their dis-placement by efficient formal firms, usually run by totally different people.This is the “Wal-Mart” theory of development.
The latter two views differ in what they see as the benefits and theharms of the unofficial sector. The parasite view, associated primarily withthe excellent empirical studies by the McKinsey Global Institute, seesunofficial firms primarily from the perspective of their illegality. These
276 Brookings Papers on Economic Activity, Fall 2008
1. This literature includes de Soto (1989), Loayza (1996), Johnson, Kaufmann, andShleifer (1997), Friedman and others (2001), Djankov and others (2002), Almeida andCarneiro (2006), Dabla-Norris, Gradstein, and Inchauste (2008), and Russo (2008), as wellas the recent work on Brazil by De Paula and Scheinkman (2008), Monteiro and Assunção(2006), and Fajnzylber, Maloney, and Montes Rojas (2006).
2. De Soto (1989, 2000).3. United Nations (2008, p. 1).
11472-06_La Porta_rev2.qxd 3/6/09 1:13 PM Page 276
firms need to stay small to avoid detection and therefore lack the necessaryscale to produce efficiently. However, the “substantial cost advantage thatinformal companies gain by avoiding taxes and regulations more than off-sets their low productivity and small scale.”4 This cost advantage allowsunofficial firms to undercut the prices of official firms. Informal firms, then,hurt growth both because their small scale makes them unproductive andbecause they take away market share from bigger, more productive formalcompetitors. According to one McKinsey report, “The high proportion ofsmall firms in service industries makes them particularly likely to operateinformally, ignoring tax requirements, employee benefits, and other regu-lations. This is a much larger barrier to growth than most policymakersin emerging—and developed—economies acknowledge. Steps to reduceinformality in local service sectors will be rewarded by rapid increases intheir productivity, growth, and employment.”5 The first step in redressingthe problems created by informal firms is to “add resources and beef up agovernment’s audit capabilities.”6 More broadly, government policy shouldaim to eradicate informal firms by reducing tax evasion and increasing theenforcement of government regulations.
The dual view, associated in our minds with traditional developmenteconomics,7 likewise emphasizes the inherent inefficiency of unofficialfirms. This view is intimately related to the “big push” models of develop-ment economics, which see the coordinated transition from the informal,preindustrial economy to the formal, industrial one as the crucial strategyof economic development.8 The earliest formal model of the unofficialeconomy is that of James Rauch,9 who uses the framework of Robert Lucasto consider the allocation of talent between the unofficial and the officialsectors.10 In Rauch’s framework, workers with lower human capital workin informal and smaller firms and receive lower wages, whereas those withhigher human capital are allocated to the larger and more productive firmsand receive higher wages.11
Unlike the romantic view, the dual view predicts that unofficial firmsshould look very different from official firms in their characteristics not
RAFAEL LA PORTA and ANDREI SHLEIFER 277
4. Farrell (2004, p. 28).5. Baily, Farrell, and Remes (2005, p. 18).6. Farrell (2004, p. 34).7. Harris and Todaro (1970).8. For example, Rosenstein-Rodan (1943); Rostow (1960); Murphy, Shleifer, and
Vishny (1989).9. Rauch (1991).
10. Lucas (1978).11. See also Amaral and Quintin (2006) and de Paula and Scheinkman (2008).
11472-06_La Porta_rev2.qxd 3/6/09 1:13 PM Page 277
affected by government policies. Productive entrepreneurs are willing topay taxes and bear the cost of government regulation in order to advertisetheir products, raise outside capital, and access public goods. Such entre-preneurs find it more profitable to run the bigger, official firms than thesmaller, unofficial ones. In contrast, the increase in firm value that less ableentrepreneurs or managers could generate by operating formally is notlarge enough to offset the additional costs from taxes and regulations. Thestrong prediction of the dual view is that managers and assets are matchedthrough a sorting process that results in low-ability managers being pairedwith low-quality assets.
Unlike the parasite view, the dual view does not see the unofficial firmsas threatening the official ones, because they are hugely inefficient andhence unlikely to be able to charge lower prices for the same products.Indeed, official and unofficial firms operate largely in different marketsand have different customers. The dual view sees the unofficial firms asproviders of a livelihood to millions, perhaps billions, of extremely poorpeople,12 and it cautions against any policies that would raise the costs ofthese firms. This view sees the hope of economic development in policies,such as human capital, tax, and regulatory policies, that promote the creationof official firms, letting the unofficial ones die as the economy develops.The official firms thus created will be new firms run by new people, notpreviously unofficial firms.13
To shed light on these alternative views, this paper follows the presen-tation of basic correlations with a comparative analysis of the characteris-tics and productivity of official and unofficial firms in several developingcountries. We use three sets of surveys of both official and unofficial firmsconducted recently by the World Bank. The first set, known as EnterpriseSurveys, covers small, medium-size, and large registered firms in nearly100 countries. We use these surveys largely for comparison. The secondset, known as Informal Surveys, covers primarily unregistered, but alsosome registered, small firms in about a dozen countries. The third set, knownas Micro Surveys, covers primarily registered, but also some unregistered,small firms in about a dozen countries (mostly different from those coveredby the Informal Surveys). These surveys enable us to make comparative
278 Brookings Papers on Economic Activity, Fall 2008
12. Tokman (1992).13. The sharp distinction we have drawn between the parasite and the dual views is too
extreme. For example, informal firms may compete with formal ones in some industries andnot in others, and they might pose a greater competitive threat at higher levels of economicdevelopment, when they perhaps become more similar to formal firms. We will return to thediscussion of the relevance of the two views after presenting some of the data.
11472-06_La Porta_rev2.qxd 3/6/09 1:13 PM Page 278
statements about the size, inputs, management characteristics, and—in arough way—productivity of both official and unofficial firms.
We note from the start that the data we use have many problems, notleast because we focus on firms that are by definition avoiding the gov-ernment’s notice. Nonetheless, our findings tend to favor the dual viewover the romantic and the parasite views. The unofficial firms in the sur-veys tend to be small and unproductive compared even with the small butregistered firms (which themselves are much less productive than largerregistered firms). The unofficial firms also use lower-quality inputs andhave less access to public goods and finance. Extremely few of the regis-tered firms have ever operated as unregistered, again suggesting, as arguedby Rauch,14 that the two groups are very separate animals. The evidencepoints to a substantial difference between the registered and the unregis-tered firms in the human capital of their managers and suggests that thisgap in human capital drives many other differences, including the qualityof inputs and access to finance. The unregistered firms pay sharply lowerwages to their employees, again consistent with the dual model.
As a final step, we consider how firms perceive their obstacles todoing business as reported in the three surveys. Informal firms see lackof access to markets and finance as their biggest problems. Formal firmsalso emphasize those, but taxes, tax administration, and problems withelectricity supply as well. The legal system, regulations, and registrationprocedures rank lower as obstacles to doing business among both formaland informal firms. Finally, the surveys offer little evidence that theunregistered firms pose much of a competitive threat to the registered ones:the latter do not treat such competition (or unfair competition more gen-erally) as a serious problem. This last result does not support the parasiteview of the unofficial economy, which focuses on price undercutting byinformal firms.
Over all, the evidence paints a relatively consistent picture. There isvery little support for the romantic view, and indeed the differences in pro-ductivity between formal and informal firms are so large that it is hard tobelieve that simply registering unregistered firms would eliminate the gap.On the other hand, there is little support for the parasite view either, and theevidence suggests that subjecting unofficial firms to stronger enforcementwould devastate the livelihood of millions of people surviving near sub-sistence. The evidence rather points to the dual view, with the fairly stan-dard implication that the hope of economic development lies in the creation
RAFAEL LA PORTA and ANDREI SHLEIFER 279
14. Rauch (1991).
11472-06_La Porta_rev2.qxd 3/6/09 1:13 PM Page 279
of large registered firms, run by educated managers and utilizing modernpractices, including modern technology, marketing, and finance.
The Size of the Informal Economy and Its Determinants
Measuring the informal economy is inherently difficult. To start with, theinformal economy encompasses very different phenomena. One is hiddenfirms. Such firms hide all of their output from the police, the tax authorities,or the regulators. Another phenomenon is hidden output. Output may behidden even by registered firms to reduce their tax liability. Both phenom-ena occur in all developing countries. Indeed, the face of informality maychange as the economy develops, from near-universal informality at earlierstages to mere tax avoidance as the economy grows richer.
Beyond these conceptual issues, there are serious practical problemsin measuring hidden firms and output. Nevertheless, a variety of methodshave been proposed. Since each method has its strengths and weaknesses,we gathered data on seven measures of the informal economy based onalternative methodologies and sources. All these measures of the informaleconomy are, if anything, likely to understate its true size.
Surveys are the most direct, although necessarily subjective, measure.We assembled data on two survey measures. The first is an indicator ofunofficial or unregistered business activity from the World EconomicForum’s Global Competitiveness Report 2006–2007.15 Top businessleaders from 125 countries were asked to estimate the size of the infor-mal sector using a 1-to-7 scale, where 1 indicates that more than 50 per-cent of economic activity is unrecorded and 7 that all of it is registered.For comparability with the other measures, we rescaled this index on ascale from 0 to 50 percent of GDP. The 50 percent cutoff adopted by theGlobal Competitiveness Report is arbitrary and introduces a downwardbias in this measure. The second survey measure is the percentage oftotal sales that a typical establishment reports for tax purposes, from theWorld Bank Enterprise Surveys. The respondents are the top managersof registered businesses in (mostly) developing countries. Accordingly,this measure of tax evasion likely understates the size of the informaleconomy, as entrepreneurs in the informal sector are not surveyed. Thismeasure of tax evasion is available for 95 countries. Most countries havebeen surveyed twice, and we average the available observations between2002 and 2006.
280 Brookings Papers on Economic Activity, Fall 2008
15. World Economic Forum (2007).
11472-06_La Porta_rev2.qxd 3/6/09 1:13 PM Page 280
An alternative method infers the size of the informal economy fromobservable variables, such as the incidence of micro- and small enterprises,the male participation rate in the labor force, the fraction of workers con-tributing to social security, electricity consumption, and currency in circu-lation. We gathered data on three such indicators.
The first is the percentage of the active labor force that is self-employed,where self-employment is defined by the International Labour Office toinclude “jobs where the remuneration is directly dependent upon the profitsderived from the goods and services produced,”16 but not work by unpaidfamily workers, although the incidence of informality among the latter isprobably high. This is admittedly a crude measure. In most developingcountries there is a strong association between self-employment and infor-mal activity, as most self-employed tend to be low-skilled, unregisteredworkers.17 Of course, self-employment in developing countries may be highnot only because informality is prevalent, but also because self-employmentis common in agriculture. For this reason our second objective indicatoris the percentage of workers in the nonagricultural sector who are self-employed. Other interpretations of self-employment are also possible. Inparticular, self-employment has been used as an indicator of entrepreneurialactivity in the United States. However, the vast majority of self-employedworkers in our data are, in fact, “own-account” workers who do not hire per-sons to work for them. Camilo Mondragón-Vélez and Ximena Peña-Pargashow along these lines that the self-employed are rarely business ownersin Colombia.18 Data on self-employment are collected through populationcensuses as well as through household or labor force surveys.19 Data on totaland nonagricultural self-employment are available for 133 countries and96 countries, respectively, from the International Labour Organization.
The third objective indicator is based on electricity consumption. Foreach country the ratio of electricity consumption to GDP for a base periodis calculated and then extrapolated to the present, assuming that the elastic-ity of electricity consumption to GDP is one.20 The size of the informalsector is then computed as the difference between GDP as estimated from
RAFAEL LA PORTA and ANDREI SHLEIFER 281
16. International Labour Office (2007).17. Loayza and Rigolini (2006).18. Mondragón-Vélez and Peña-Parga (2008).19. There are two known biases in the self-employment data. First, OECD statistics
relate to civilian employment and, as such, leave out the armed forces. Second, self-employment statistics in most Latin American countries relate to urban areas only. Bothbiases tend to understate the true size of self-employment.
20. Johnson and others (1997); Ernste and Schneider (1998).
11472-06_La Porta_rev2.qxd 3/6/09 1:13 PM Page 281
this ratio and official GDP. This measure of the informal economy under-states its size to the extent that informal activities are less electricity inten-sive than formal activities, and to the extent that technological progressallows for increased output per unit of electricity. This indicator is avail-able for 57 countries from Eric Friedman and coauthors.21
Still another approach to measuring the informal economy models hid-den output as a latent variable, using several indicator and causal variables.This is the approach followed by Friedrich Schneider to estimate a multi-ple indicators, multiple causes (MIMIC) model.22 The indicator variablesinclude the labor force participation rate among persons aged 18–64, annualGDP growth, and the change in local currency in circulation per capita.The causal variables are the tax-to-GDP ratio, the Heritage Foundationindex of economic freedom, the unemployment rate, GDP per capita, andlagged values of the latent variable. This measure of the informal economy,which is available for 145 countries,23 is only as good as the model thatsupports it. Later in this section we present evidence that the correlationbetween the size of the informal economy and variables such as tax rates isnot particularly robust.
As a final robustness check, we gathered data on a direct measure of theformal economy: the number of registered businesses per 1,000 inhabitants.This measure, too, has problems. The number of firms per capita mayincrease with development, for example, as product variety expands. Itmay also be affected by cross-country differences in entrepreneurship.Finally, the data on total registered firms may be biased upward, especiallyin developing countries, because of underreporting of firms that have closedor exited. Data on the number of registered businesses are available for83 countries from the World Bank’s World Development Indicators dataset.
We group the determinants of the size of the unofficial economy intothree broad categories: the cost of becoming formal, the cost of stayingformal, and the benefits of being formal. As a proxy for the cost of becom-ing formal, we use the logarithm of the number of procedures required tolegally start a business, from the 2002 paper by Simeon Djankov andcoauthors and the World Bank’s Doing Business 2008.24 The costs of stay-ing formal include paying taxes and obeying government regulations; weuse six proxies for these costs. First, we use two measures of the cost of
282 Brookings Papers on Economic Activity, Fall 2008
21. Friedman and others (2001).22. Schneider (2007).23. Schneider (2007).24. World Bank (2007); Djankov and others (2002).
11472-06_La Porta_rev2.qxd 3/6/09 1:13 PM Page 282
paying taxes, from a 2008 paper by Djankov and coauthors:25 total taxes(except for labor taxes) payable by businesses after accounting for deduc-tions and exemptions; and the time it takes to prepare, file, and pay (orwithhold) corporate income tax, value-added tax, and social security con-tributions, in hours per year. Second, we capture the cost of complyingwith labor laws with three variables: an index of the difficulty of hiring anew worker; an index of the difficulty and expense of firing a redundantworker; and the nonwage labor costs (payroll taxes and social security pay-ments) associated with hiring a new worker as a percentage of the worker’ssalary. Data on complying with labor laws are from Juan Botero and coau-thors and Doing Business 2008.26 Third, we capture the cost of red tapeusing the percentage of senior management’s time spent in dealing withrequirements imposed by government regulations (such as taxes, cus-toms, labor regulations, licensing, and registration); this includes timespent interacting with officials, completing forms, and other tasks. Thisvariable is from the World Bank’s Enterprise Surveys.
The benefits of being formal include expanded access to both publicgoods and finance. Regarding public goods, registered business may find iteasier than unregistered ones to use the courts to enforce property rightsand adjudicate disputes. We use two proxies for the efficiency of courts:the log of the number of steps required to collect on a bounced check, fromthe 2003 paper by Djankov and coauthors and Doing Business 2008;27
and the efficiency of the bankruptcy procedure, from a recent paper byDjankov and coauthors.28 We measure the quality of property rights usingindices of corruption and the rule of law from Daniel Kaufmann, Aart Kraay,and Massimo Mastruzzi.29 In addition, we use the density of the paved roadnetwork from World Development Indicators as a rough proxy for thescope of the domestic market. Finally, we measure the benefits of access tofinance using three indicators of the size of financial markets. The firsttwo indicators are standard: private credit and the market capitalization ofdomestic firms, both as a ratio to GDP. These two variables are also fromthe World Development Indicators. The third measure of the size of finan-cial markets is a subjective indicator of the ease of access to credit, fromthe World Economic Forum’s Global Competitiveness Report 2006–2007.The index ranges from 1 (impossible) to 7 (easy).
RAFAEL LA PORTA and ANDREI SHLEIFER 283
25. Djankov and others (2008b).26. Botero and others (2004).27. Djankov and others (2003).28. Djankov and others (2008a).29. Kaufmann, Kraay, and Mastruzzi (2005).
11472-06_La Porta_rev2.qxd 3/6/09 1:13 PM Page 283
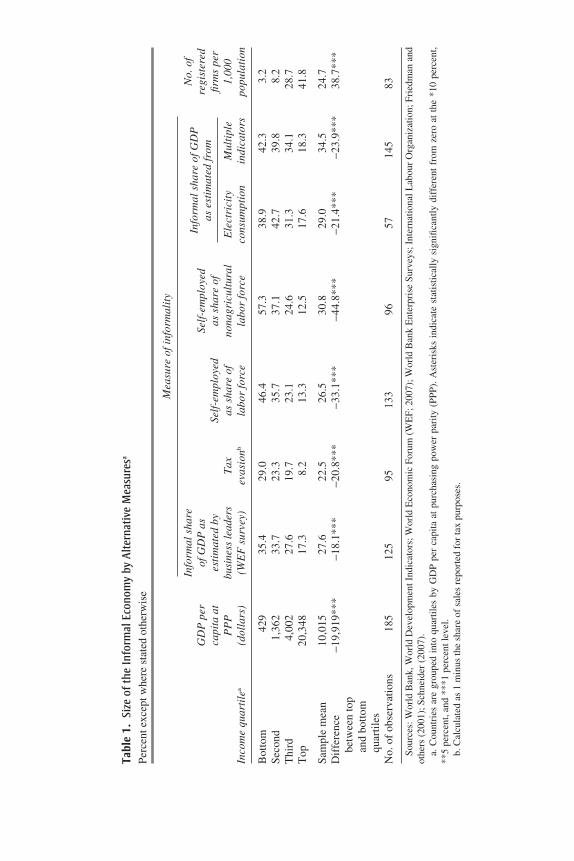
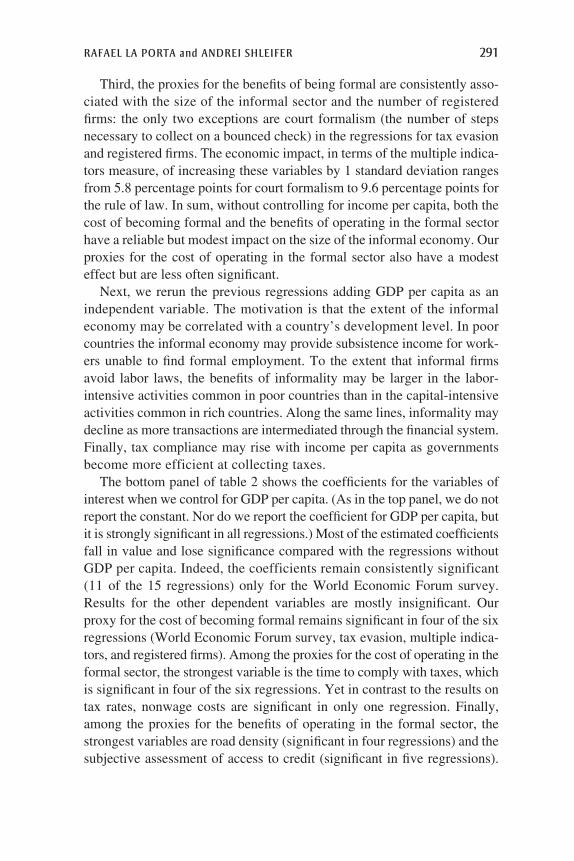
Table 1 presents our measures of the size of the informal economy.Countries are grouped into quartiles based on average income per capita atpurchasing power parity (PPP) over the period 1996–2006. In practice,measures of the informal sector based on multiple indicators, energy con-sumption, self-employment, and the World Economic Forum survey arehighly correlated with each other (see the correlation table in the appendix).In contrast, tax evasion and the number of registered businesses are lesscorrelated with these other four indicators.
Two facts stand out. First, the informal economy in the average countryin the sample is large, ranging from 22.5 percent of the total economyaccording to the tax evasion measure to 34.5 percent according to the mul-tiple indicators approach. These numbers are especially large in light ofthe fact that our measures are likely biased down. About 26.5 percent ofa country’s workers, on average, are self-employed. That figure rises to30.8 percent in the nonagricultural sector. Respondents to the WorldEconomic Forum survey estimate that 27.6 percent of output is informal.Estimates based on electricity consumption suggest that 29.0 percent ofoutput is informal. The various estimates thus suggest that, in an averagecountry, roughly 30 percent of the economy is informal.
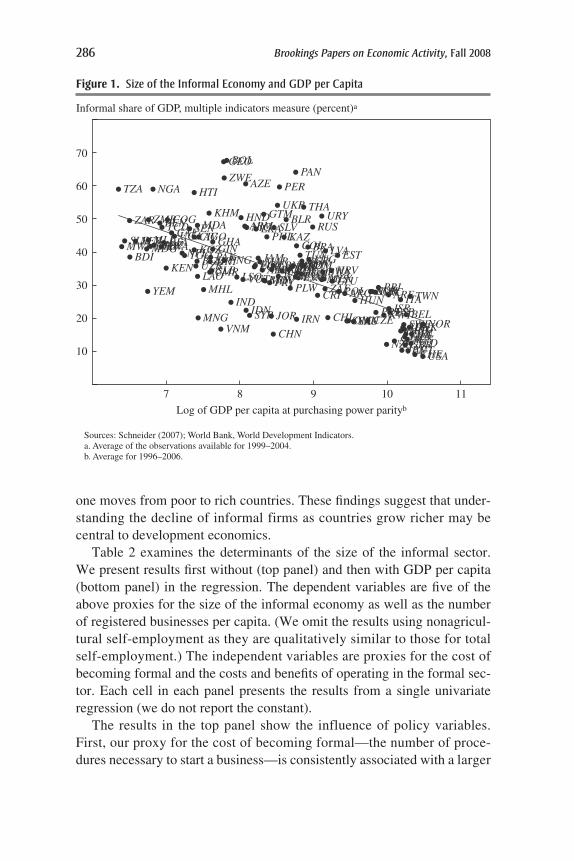
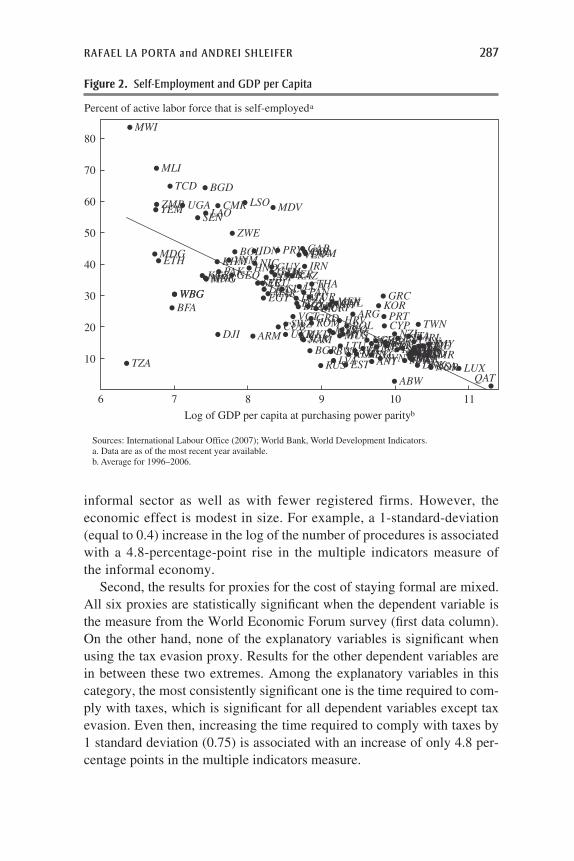
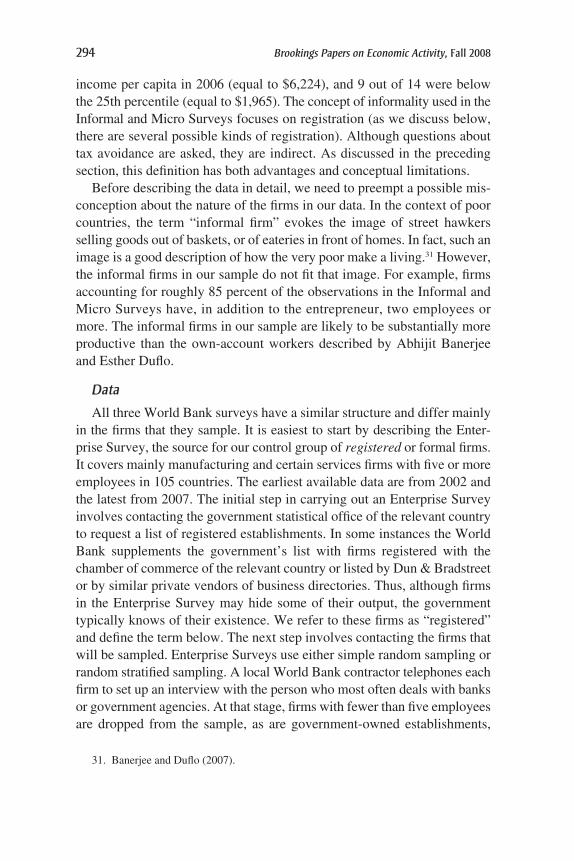
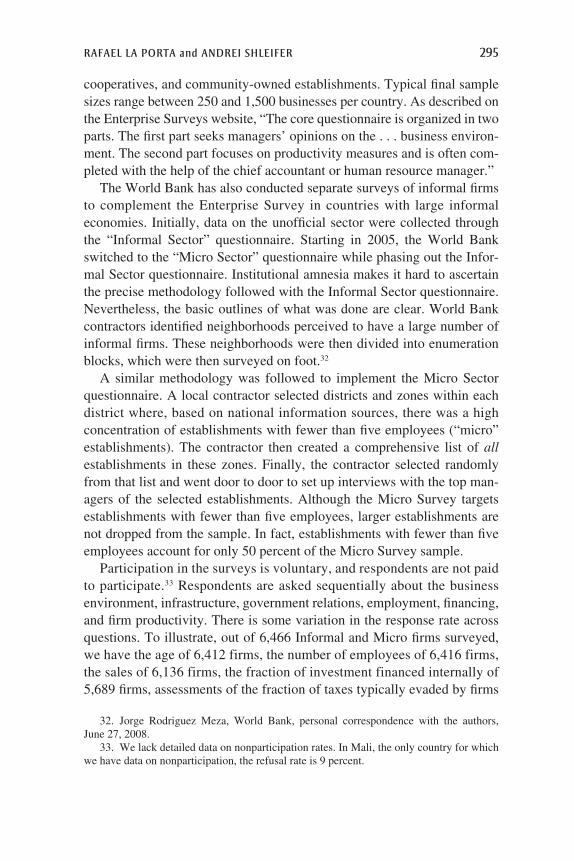
Second, the size of the informal economy is strongly negatively corre-lated with income per capita. Figure 1 illustrates this relationship, usingthe multiple indicators variable to measure the informal economy. Theother measures also show the informal economy to be very large in poorcountries, ranging from 29.0 percent according to the tax evasion measureto 57.3 percent according to the nonagricultural self-employment measure.The measure from the World Economic Forum survey suggests that theinformal economy is 18 percentage points larger in poor countries than inrich ones. Estimates based on electricity consumption and multiple indica-tors suggest that the informal economy is between 21 and 24 percentagepoints larger, respectively, in poor countries than in rich ones. Even taxevasion by registered businesses—which is likely to understate tax evasionin poor countries—is 21 percentage points higher in poor countries thanin rich ones. The self-employment statistics show that the fraction of self-employed workers rises from 13.3 percent in rich countries to 46.4 percentin poor ones. (Figure 2 illustrates the striking relationship between self-employment and income per capita.) The pattern for nonagriculturalself-employment is even more extreme: self-employment as a share ofnonagricultural employment rises by 44.8 percentage points as one movesfrom rich countries to poor ones. Consistent with this pattern, the numberof registered businesses rises from 3.2 to 41.8 per thousand inhabitants as
284 Brookings Papers on Economic Activity, Fall 2008
11472-06_La Porta_rev2.qxd 3/6/09 1:13 PM Page 284
Tabl
e 1.
Size
of t
he In
form
al E
cono
my
by A
ltern
ativ
e M
easu
resa
Perc
ent e
xcep
t whe
re s
tate
d ot
herw
ise
Mea
sure
of i
nfor
mal
ity
Info
rmal
sha
reN
o. o
f G
DP
per
of
GD
P a
s Se
lf-e
mpl
oyed
regi
ster
ed
capi
ta a
t es
tim
ated
by
Self
-em
ploy
edas
sha
re o
ffir
ms
per
PP
P
busi
ness
lead
ers
Tax
as
sha
re o
fno
nagr
icul
tura
lE
lect
rici
ty
Mul
tipl
e 1,
000
Inco
me
quar
tile
a(d
olla
rs)
(WE
F s
urve
y)ev
asio
nbla
bor
forc
ela
bor
forc
eco
nsum
ptio
nin
dica
tors
popu
lati
on
Bot
tom
429
35.4
29.0
46.4
57.3
38.9
42.3
3.2
Sec
ond
1,36
233
.723
.335
.737
.142
.739
.88.
2T
hird
4,00
227
.619
.723
.124
.631
.334
.128
.7T
op20
,348
17.3
8.2
13.3
12.5
17.6
18.3
41.8
Sam
ple
mea
n10
,015
27.6
22.5
26.5
30.8
29.0
34.5
24.7
Dif
fere
nce
−19,
919*
**−1
8.1*
**−2
0.8*
**−3
3.1*
**−4
4.8*
**−2
1.4*
**−2
3.9*
**38
.7**
*be
twee
n to
p an
d bo
ttom
qu
arti
les
No.
of
obse
rvat
ions
185
125
9513
396
5714
583
Sour
ces:
Wor
ld B
ank,
Wor
ld D
evel
opm
ent I
ndic
ator
s; W
orld
Eco
nom
ic F
orum
(W
EF;
200
7); W
orld
Ban
k E
nter
pris
e Su
rvey
s; I
nter
natio
nal L
abou
r O
rgan
izat
ion;
Fri
edm
an a
ndot
hers
(20
01);
Sch
neid
er (
2007
).a.
Cou
ntri
es a
re g
roup
ed i
nto
quar
tiles
by
GD
P pe
r ca
pita
at
purc
hasi
ng p
ower
par
ity (
PPP)
. Ast
eris
ks i
ndic
ate
stat
istic
ally
sig
nific
antly
dif
fere
nt f
rom
zer
o at
the
*10
per
cent
, **
5 pe
rcen
t, an
d **
*1 p
erce
nt le
vel.
b. C
alcu
late
d as
1 m
inus
the
shar
e of
sal
es r
epor
ted
for
tax
purp
oses
.
Info
rmal
sha
re o
f GD
P
as e
stim
ated
from
11472-06_La Porta_rev2.qxd 3/6/09 1:13 PM Page 285
one moves from poor to rich countries. These findings suggest that under-standing the decline of informal firms as countries grow richer may becentral to development economics.
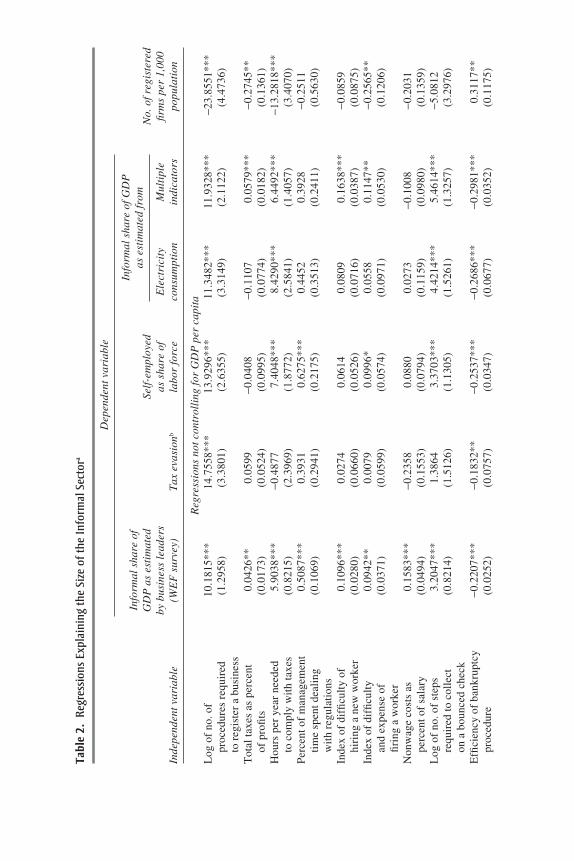
Table 2 examines the determinants of the size of the informal sector.We present results first without (top panel) and then with GDP per capita(bottom panel) in the regression. The dependent variables are five of theabove proxies for the size of the informal economy as well as the numberof registered businesses per capita. (We omit the results using nonagricul-tural self-employment as they are qualitatively similar to those for totalself-employment.) The independent variables are proxies for the cost ofbecoming formal and the costs and benefits of operating in the formal sec-tor. Each cell in each panel presents the results from a single univariateregression (we do not report the constant).
The results in the top panel show the influence of policy variables.First, our proxy for the cost of becoming formal—the number of proce-dures necessary to start a business—is consistently associated with a larger
286 Brookings Papers on Economic Activity, Fall 2008
AGO
ALB
AREARG
ARM
AUSAUT
AZE
BDI
BEL
BEN
BFA
BGD BGRBIH
BLR
BOL
BRA
BTNBWA
CAF
CAN
CHE
CHL
CHN
CIV
CMR
COG
COL
CRI
CZEDEUDNK
DOMDZAECUEGY
ESP
ESTETH
FIN
FJI
FRA
FSM
GBR
GEO
GHAGIN
GRC
GTM
HKG
HND
HRV
HTI
HUNIDN
IND
IRLIRN
ISRITA
JAM
JOR
JPN
KAZ
KEN
KGZ
KHM
KIR
KOR
KWT
LAOLBN
LKA
LSO LTU
LVAMAR
MDA
MDG
MDV MEXMHL
MKD
MLI
MNG
MOZ
MRTMWI
MYSNAM
NER
NGA
NIC
NLD
NOR
NPL
NZL
OMN
PAK
PANPER
PHL
PLW
PNG
POL PRI
PRT
PRY
ROM
RUS
RWA
SAU
SEN
SGP
SLB
SLESLV
SVK
SVN
SWESYR
TCD
TGO
THA
TONTUN
TUR
TWN
TZA
UGA
UKRURY
USA
UZB VEN
VNM
VUT WSMYEM
YUG
ZAF
ZARZMB
ZWE
70
60
50
40
30
20
10
7 8 9 10 11
Log of GDP per capita at purchasing power parityb
Informal share of GDP, multiple indicators measure (percent)a
Sources: Schneider (2007); World Bank, World Development Indicators.a. Average of the observations available for 1999–2004.b. Average for 1996–2006.
Figure 1. Size of the Informal Economy and GDP per Capita
11472-06_La Porta_rev2.qxd 3/6/09 1:13 PM Page 286
informal sector as well as with fewer registered firms. However, theeconomic effect is modest in size. For example, a 1-standard-deviation(equal to 0.4) increase in the log of the number of procedures is associatedwith a 4.8-percentage-point rise in the multiple indicators measure ofthe informal economy.
Second, the results for proxies for the cost of staying formal are mixed.All six proxies are statistically significant when the dependent variable isthe measure from the World Economic Forum survey (first data column).On the other hand, none of the explanatory variables is significant whenusing the tax evasion proxy. Results for the other dependent variables arein between these two extremes. Among the explanatory variables in thiscategory, the most consistently significant one is the time required to com-ply with taxes, which is significant for all dependent variables except taxevasion. Even then, increasing the time required to comply with taxes by1 standard deviation (0.75) is associated with an increase of only 4.8 per-centage points in the multiple indicators measure.
RAFAEL LA PORTA and ANDREI SHLEIFER 287
ABW
ANT
ARG
ARM ATG
AUSAUTBEL
BFA
BGD
BGRBHS
BLZ
BOL
BRA
BRBBWA
CANCHE
CHL
CMR
COL
CRI
CUB CYPCZE
DEU
DJI
DMA
DNK
DOM
DZA
ECUEGY
ESP
EST
ETH
FINFRA
GAB
GBR
GEO
GRC
GRD
GTMGUY
HKG
HND
HRV
HUN
IDN
IMYIRL
IRN
ISLISRITA
JAM
JPN
KAZKGZKHM
KNA
KOR
LAO
LCALKA
LSO
LTU
LUXLVA MAC
MARMDA
MDG
MDV
MEX
MKD
MLI
MLT
MNG
MUS
MWI
MYSNAM NCL
NIC
NLDNOR
NZL
OMN
PAK
PAN
PERPHL
POL
PRI
PRT
PRY
QAT
ROM
RUS
SEN
SGP
SLV
SMR
SURSVK
SVN SWE
SWZ
SYC
SYR
TCD
THA
TTO
TUNTUR
TWN
TZA
UGA
UKR
URY
USA
VCT
VENVNM
WBGWBG
YEM
ZAF
ZMB
ZWE
70
80
60
50
40
30
20
10
6 7 8 9 10 11
Log of GDP per capita at purchasing power parityb
Percent of active labor force that is self-employeda
Sources: International Labour Office (2007); World Bank, World Development Indicators.a. Data are as of the most recent year available.b. Average for 1996–2006.
Figure 2. Self-Employment and GDP per Capita
11472-06_La Porta_rev2.qxd 3/6/09 1:13 PM Page 287
Tabl
e 2.
Reg
ress
ions
Exp
lain
ing
the
Size
of t
he In
form
al S
ecto
ra
Dep
ende
nt v
aria
ble
Info
rmal
sha
re o
f G
DP
as
esti
mat
ed
Self
-em
ploy
ed
No.
of r
egis
tere
dby
bus
ines
s le
ader
s as
sha
re o
f E
lect
rici
tyM
ulti
ple
firm
s pe
r 1,
000
Inde
pend
ent v
aria
ble
(WE
F s
urve
y)T
ax e
vasi
onb
labo
r fo
rce
cons
umpt
ion
indi
cato
rspo
pula
tion
Reg
ress
ions
not
con
trol
ling
for
GD
P p
er c
apit
aL
og o
f no
. of
10.1
815*
**14
.755
8***
13.9
296*
**11
.348
2***
11.9
328*
**−2
3.85
51**
*pr
oced
ures
req
uire
d (1
.295
8)(3
.380
1)(2
.635
5)(3
.314
9)(2
.112
2)(4
.473
6)to
reg
iste
r a
busi
ness
Tot
al ta
xes
as p
erce
nt
0.04
26**
0.05
99−0
.040
8−0
.110
70.
0579
***
−0.2
745*
*of
pro
fits
(0.0
173)
(0.0
524)
(0.0
995)
(0.0
774)
(0.0
182)
(0.1
361)
Hou
rs p
er y
ear
need
ed
5.90
38**
*−0
.487
77.
4048
***
8.42
90**
*6.
4492
***
−13.
2818
***
to c
ompl
y w
ith
taxe
s(0
.821
5)(2
.396
9)(1
.877
2)(2
.584
1)(1
.405
7)(3
.407
0)P
erce
nt o
f m
anag
emen
t 0.
5087
***
0.39
310.
6275
***
0.44
520.
3928
−0.2
511
tim
e sp
ent d
eali
ng
(0.1
069)
(0.2
941)
(0.2
175)
(0.3
513)
(0.2
411)
(0.5
630)
wit
h re
gula
tion
sIn
dex
of d
iffi
cult
y of
0.
1096
***
0.02
740.
0614
0.08
090.
1638
***
−0.0
859
hiri
ng a
new
wor
ker
(0.0
280)
(0.0
660)
(0.0
526)
(0.0
716)
(0.0
387)
(0.0
875)
Inde
x of
dif
ficu
lty
0.09
42**
0.00
790.
0996
*0.
0558
0.11
47**
−0.2
565*
*an
d ex
pens
e of
(0
.037
1)(0
.059
9)(0
.057
4)(0
.097
1)(0
.053
0)(0
.120
6)fi
ring
a w
orke
rN
onw
age
cost
s as
0.
1583
***
−0.2
358
0.08
800.
0273
−0.1
008
−0.2
031
perc
ent o
f sa
lary
(0.0
494)
(0.1
553)
(0.0
794)
(0.1
159)
(0.0
980)
(0.1
359)
Log
of
no. o
f st
eps
3.20
47**
*1.
3864
3.37
03**
*4.
4214
***
5.46
14**
*−5
.081
2re
quir
ed to
col
lect
(0
.821
4)(1
.512
6)(1
.130
5)(1
.526
1)(1
.325
7)(3
.297
6)on
a b
ounc
ed c
heck
Effi
cien
cy o
f ba
nkru
ptcy
−0
.220
7***
−0.1
832*
*−0
.253
7***
−0.2
686*
**−0
.298
1***
0.31
17**
proc
edur
e(0
.025
2)(0
.075
7)(0
.034
7)(0
.067
7)(0
.035
2)(0
.117
5)
Info
rmal
sha
re o
f GD
P
as e
stim
ated
from
11472-06_La Porta_rev2.qxd 3/6/09 1:13 PM Page 288
Log
of
pave
d −0
.009
0***
−0.0
334*
*−0
.011
2***
−0.0
137*
**−0
.016
3***
0.02
97**
*ro
ads
per
km2
(0.0
019)
(0.0
130)
(0.0
020)
(0.0
023)
(0.0
018)
(0.0
109)
Cor
rupt
ion
inde
x−7
.477
8***
−7.1
143*
**−1
0.82
38**
*−8
.536
4***
−9.4
626*
**11
.902
9***
(0.3
604)
(1.8
722)
(0.9
804)
(1.6
594)
(0.5
970)
(1.9
284)
Rul
e of
law
inde
x−8
.028
6***
−6.0
779*
**−1
1.68
45**
*−9
.170
1***
−9.9
850*
**13
.311
2***
(0.3
697)
(1.7
659)
(0.9
440)
(2.0
373)
(0.6
170)
(2.0
744)
Pri
vate
cre
dit a
s −1
4.37
09**
*−1
4.86
12**
*−1
9.21
73**
*−1
1.79
83**
*−1
9.74
57**
*25
.430
1***
perc
ent o
f G
DP
(1.5
940)
(5.2
608)
(2.8
056)
(3.5
882)
(2.3
164)
(8.9
047)
Sto
ck m
arke
t −9
.315
2***
−6.9
204
−10.
5142
***
−9.4
449*
**−1
3.80
49**
*10
.284
5**
capi
tali
zati
on a
s (1
.719
1)(5
.890
6)(2
.505
7)(2
.548
3)(3
.035
8)(4
.238
3)pe
rcen
t of
GD
PA
cces
s to
cre
dit
51.5
059*
**32
.813
2***
60.4
548*
**71
.445
7***
62.0
713*
**−1
3.15
94(1
.659
6)(5
.336
0)(4
.808
2)(7
.893
9)(3
.315
5)(9
.725
1)
Reg
ress
ions
con
trol
ling
for
GD
P p
er c
apit
aL
og o
f no
. of
3.90
83**
*12
.152
6***
1.41
581.
7380
3.69
17*
−13.
1812
**pr
oced
ures
req
uire
d (1
.121
7)(3
.514
1)(2
.026
6)(3
.226
3)(1
.892
6)(5
.279
6)to
reg
iste
r a
busi
ness
Tot
al ta
xes
as p
erce
nt
−0.0
039
0.02
830.
0389
−0.2
306*
*−0
.004
9−0
.302
9***
of p
rofi
ts(0
.017
0)(0
.056
3)(0
.064
8)(0
.086
6)(0
.019
6)(0
.101
9)H
ours
per
yea
r ne
eded
3.
1399
***
−0.5
181
2.69
88*
2.52
813.
3539
***
−6.9
528*
*to
com
ply
wit
h ta
xes
(0.6
296)
(2.3
814)
(1.5
122)
(2.6
397)
(1.2
687)
(3.2
654)
Per
cent
of
man
agem
ent
0.39
50**
*0.
2007
0.26
100.
2312
0.24
000.
3767
tim
e sp
ent d
eali
ng
(0.0
725)
(0.3
011)
(0.1
829)
(0.3
418)
(0.1
962)
(0.4
977)
wit
h re
gula
tion
sIn
dex
of d
iffi
cult
y of
0.
0485
***
−0.0
033
−0.0
388
−0.0
201
0.07
77**
0.05
37hi
ring
a n
ew w
orke
r(0
.018
2)(0
.063
1)(0
.039
7)(0
.052
6)(0
.034
2)(0
.068
2)In
dex
of d
iffi
cult
y 0.
0311
−0.0
294
0.01
70−0
.046
90.
0274
−0.1
100
and
expe
nse
of
(0.0
275)
(0.0
547)
(0.0
420)
(0.0
752)
(0.0
470)
(0.1
007)
firi
ng a
wor
ker
Non
wag
e co
sts
as
0.08
06**
−0.1
075
−0.0
405
−0.0
966
0.09
17−0
.057
9pe
rcen
t of
sala
ry(0
.031
1)(0
.164
9)(0
.057
1)(0
.071
4)(0
.076
9)(0
.109
0)
(con
tinu
ed)
11472-06_La Porta_rev2.qxd 3/6/09 1:13 PM Page 289
Log
of
no. o
f st
eps
1.70
96**
*2.
2855
0.50
51−1
.930
83.
3370
***
−2.0
003
requ
ired
to c
olle
ct
(0.5
891)
(1.5
024)
(0.8
129)
(1.3
614)
(1.0
474)
(2.8
724)
on a
bou
nced
che
ckE
ffici
ency
of
bank
rupt
cy−0
.056
0−0
.049
1−0
.025
20.
2044
**−0
.035
60.
0752
proc
edur
e(0
.039
5)(0
.086
3)(0
.054
5)(0
.089
5)(0
.041
7)(0
.173
6)L
og o
f pa
ved
−0.0
025
−0.0
168*
−0.0
029*
**−0
.004
4**
−0.0
051*
**0.
0175
road
s pe
r km
2(0
.001
6)(0
.008
8)(0
.001
0)(0
.001
8)(0
.001
6)(0
.011
9)C
orru
ptio
n in
dex
−5.6
768*
**−3
.495
6−1
.831
50.
3169
−6.9
316*
**3.
8139
(0.6
844)
(3.0
779)
(1.9
129)
(3.1
140)
(1.1
440)
(3.7
512)
Rul
e of
law
inde
x−6
.479
3***
−2.1
094
−2.5
183
1.60
05−7
.798
4***
4.92
09(0
.709
5)(3
.071
5)(2
.288
6)(3
.919
6)(1
.392
0)(3
.366
8)P
riva
te c
redi
t as
−5.6
811*
**−6
.149
92.
7131
9.35
52**
−8.1
961*
**6.
2312
perc
ent o
f G
DP
(1.6
812)
(6.1
198)
(2.3
110)
(4.5
279)
(3.1
009)
(12.
5764
)S
tock
mar
ket
−3.3
739*
**−1
.178
50.
5142
0.63
96−5
.319
6***
−3.5
914
capi
tali
zati
on a
s (1
.031
3)(5
.778
7)(1
.478
2)(2
.065
2)(1
.835
2)(8
.083
8)pe
rcen
t of
GD
PA
cces
s to
cre
dit
68.5
488*
**−0
.363
912
5.79
42**
*16
4.04
24**
*99
.041
7***
−82.
9238
***
(4.2
760)
(1.7
380)
(17.
0908
)(2
1.01
87)
(7.5
245)
(14.
1297
)
Sour
ce: A
utho
rs’
regr
essi
ons.
a. E
ach
cell
repo
rts
the
estim
ated
reg
ress
ion
coef
ficie
nt f
or a
sin
gle
univ
aria
te r
egre
ssio
n. A
ll re
gres
sion
s in
clud
e a
cons
tant
(no
t rep
orte
d). R
obus
t sta
ndar
d er
rors
are
in p
aren
the-
ses.
Ast
eris
ks in
dica
te s
tatis
tical
sig
nific
ance
at t
he *
10 p
erce
nt, *
*5 p
erce
nt, a
nd *
**1
perc
ent l
evel
.b.
Cal
cula
ted
as 1
min
us th
e sh
are
of s
ales
rep
orte
d fo
r ta
x pu
rpos
es.
Tabl
e 2.
Reg
ress
ions
Exp
lain
ing
the
Size
of t
he In
form
al S
ecto
ra(C
onti
nued
)
Dep
ende
nt v
aria
ble
Info
rmal
sha
re o
f G
DP
as
esti
mat
ed
Self
-em
ploy
ed
No.
of r
egis
tere
dby
bus
ines
s le
ader
s as
sha
re o
f E
lect
rici
tyM
ulti
ple
firm
s pe
r 1,
000
Inde
pend
ent v
aria
ble
(WE
F s
urve
y)T
ax e
vasi
onb
labo
r fo
rce
cons
umpt
ion
indi
cato
rspo
pula
tion
Info
rmal
sha
re o
f GD
P
as e
stim
ated
from
11472-06_La Porta_rev2.qxd 3/6/09 1:13 PM Page 290
Third, the proxies for the benefits of being formal are consistently asso-ciated with the size of the informal sector and the number of registeredfirms: the only two exceptions are court formalism (the number of stepsnecessary to collect on a bounced check) in the regressions for tax evasionand registered firms. The economic impact, in terms of the multiple indica-tors measure, of increasing these variables by 1 standard deviation rangesfrom 5.8 percentage points for court formalism to 9.6 percentage points forthe rule of law. In sum, without controlling for income per capita, both thecost of becoming formal and the benefits of operating in the formal sectorhave a reliable but modest impact on the size of the informal economy. Ourproxies for the cost of operating in the formal sector also have a modesteffect but are less often significant.
Next, we rerun the previous regressions adding GDP per capita as anindependent variable. The motivation is that the extent of the informaleconomy may be correlated with a country’s development level. In poorcountries the informal economy may provide subsistence income for work-ers unable to find formal employment. To the extent that informal firmsavoid labor laws, the benefits of informality may be larger in the labor-intensive activities common in poor countries than in the capital-intensiveactivities common in rich countries. Along the same lines, informality maydecline as more transactions are intermediated through the financial system.Finally, tax compliance may rise with income per capita as governmentsbecome more efficient at collecting taxes.
The bottom panel of table 2 shows the coefficients for the variables ofinterest when we control for GDP per capita. (As in the top panel, we do notreport the constant. Nor do we report the coefficient for GDP per capita, butit is strongly significant in all regressions.) Most of the estimated coefficientsfall in value and lose significance compared with the regressions withoutGDP per capita. Indeed, the coefficients remain consistently significant(11 of the 15 regressions) only for the World Economic Forum survey.Results for the other dependent variables are mostly insignificant. Ourproxy for the cost of becoming formal remains significant in four of the sixregressions (World Economic Forum survey, tax evasion, multiple indica-tors, and registered firms). Among the proxies for the cost of operating in theformal sector, the strongest variable is the time to comply with taxes, whichis significant in four of the six regressions. Yet in contrast to the results ontax rates, nonwage costs are significant in only one regression. Finally,among the proxies for the benefits of operating in the formal sector, thestrongest variables are road density (significant in four regressions) and thesubjective assessment of access to credit (significant in five regressions).
RAFAEL LA PORTA and ANDREI SHLEIFER 291
11472-06_La Porta_rev2.qxd 3/6/09 1:13 PM Page 291
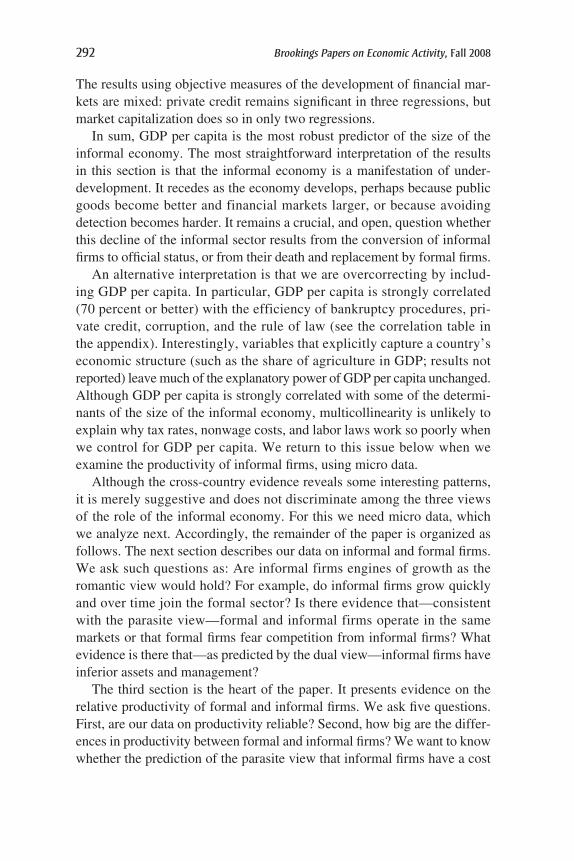
The results using objective measures of the development of financial mar-kets are mixed: private credit remains significant in three regressions, butmarket capitalization does so in only two regressions.
In sum, GDP per capita is the most robust predictor of the size of theinformal economy. The most straightforward interpretation of the resultsin this section is that the informal economy is a manifestation of under-development. It recedes as the economy develops, perhaps because publicgoods become better and financial markets larger, or because avoidingdetection becomes harder. It remains a crucial, and open, question whetherthis decline of the informal sector results from the conversion of informalfirms to official status, or from their death and replacement by formal firms.
An alternative interpretation is that we are overcorrecting by includ-ing GDP per capita. In particular, GDP per capita is strongly correlated(70 percent or better) with the efficiency of bankruptcy procedures, pri-vate credit, corruption, and the rule of law (see the correlation table inthe appendix). Interestingly, variables that explicitly capture a country’seconomic structure (such as the share of agriculture in GDP; results notreported) leave much of the explanatory power of GDP per capita unchanged.Although GDP per capita is strongly correlated with some of the determi-nants of the size of the informal economy, multicollinearity is unlikely toexplain why tax rates, nonwage costs, and labor laws work so poorly whenwe control for GDP per capita. We return to this issue below when weexamine the productivity of informal firms, using micro data.
Although the cross-country evidence reveals some interesting patterns,it is merely suggestive and does not discriminate among the three viewsof the role of the informal economy. For this we need micro data, whichwe analyze next. Accordingly, the remainder of the paper is organized asfollows. The next section describes our data on informal and formal firms.We ask such questions as: Are informal firms engines of growth as theromantic view would hold? For example, do informal firms grow quicklyand over time join the formal sector? Is there evidence that—consistentwith the parasite view—formal and informal firms operate in the samemarkets or that formal firms fear competition from informal firms? Whatevidence is there that—as predicted by the dual view—informal firms haveinferior assets and management?
The third section is the heart of the paper. It presents evidence on therelative productivity of formal and informal firms. We ask five questions.First, are our data on productivity reliable? Second, how big are the differ-ences in productivity between formal and informal firms? We want to knowwhether the prediction of the parasite view that informal firms have a cost
292 Brookings Papers on Economic Activity, Fall 2008
11472-06_La Porta_rev2.qxd 3/6/09 1:13 PM Page 292
advantage is borne out by the data. Third, what views of the informal econ-omy are consistent with the observed differences in productivity? We wantto examine whether it is plausible to believe—as in the romantic view—thatall that is holding back informal firms are high taxes and bad governmentregulation. Fourth, what accounts for the difference in the productivity offormal and informal firms? The goal is to see whether differences in pro-ductivity can be traced to differences in inputs. Finally, what evidence isthere that more-able managers run firms with better assets? Evidence of astrong selection effect would support the dual view and cast doubt on theprediction of the romantic view that relieving informal firms from oppres-sive taxes and regulation would put an end to poverty as we know it.
The fourth section focuses on obstacles to doing business, as reportedby firms in all three surveys. We ask which of several problems, such asmarket access, financing, taxes, and regulations, but also unfair competi-tion, are perceived as principal obstacles to doing business. These resultsshed light on the alternative theories but perhaps bear most directly on theparasite theory. The final section concludes with some implications of theevidence.
Characteristics of Informal Firms
In this section we describe our data and present simple descriptive statistics.Our basic approach is to compare, country by country, the relative perfor-mance of formal and informal firms. To do so, we combine data from threeWorld Bank surveys of individual firms. The first survey—the EnterpriseSurvey—covers formal firms and is available for 105 countries. The othertwo surveys—the Informal and Micro Surveys—contain information onboth informal and formal firms in a few poor countries. The InformalSurvey is available for 13 countries: Bangladesh, Brazil, Cambodia,Cape Verde, Guatemala, India, Indonesia, Kenya, Niger, Pakistan, Senegal,Tanzania, and Uganda.30 With the exception of Brazil, all these countrieswere below the world median income per capita in 2003 (equal to $5,322),and 7 out of 13 were below the 25th percentile (equal to $1,682). The MicroSurvey is available for 14 mostly African countries: Angola, Botswana,Burundi, Democratic Republic of the Congo, The Gambia, Guinea, Guinea-Bissau, India, Mauritania, Namibia, Rwanda, Swaziland, Tanzania, andUganda. With the exception of Botswana, all were below the world median
RAFAEL LA PORTA and ANDREI SHLEIFER 293
30. The World Bank also carried out an Informal Survey of Cameroon in 2006. How-ever, data on sales are missing from that survey.
11472-06_La Porta_rev2.qxd 3/6/09 1:13 PM Page 293
income per capita in 2006 (equal to $6,224), and 9 out of 14 were belowthe 25th percentile (equal to $1,965). The concept of informality used in theInformal and Micro Surveys focuses on registration (as we discuss below,there are several possible kinds of registration). Although questions abouttax avoidance are asked, they are indirect. As discussed in the precedingsection, this definition has both advantages and conceptual limitations.
Before describing the data in detail, we need to preempt a possible mis-conception about the nature of the firms in our data. In the context of poorcountries, the term “informal firm” evokes the image of street hawkersselling goods out of baskets, or of eateries in front of homes. In fact, such animage is a good description of how the very poor make a living.31 However,the informal firms in our sample do not fit that image. For example, firmsaccounting for roughly 85 percent of the observations in the Informal andMicro Surveys have, in addition to the entrepreneur, two employees ormore. The informal firms in our sample are likely to be substantially moreproductive than the own-account workers described by Abhijit Banerjeeand Esther Duflo.
Data
All three World Bank surveys have a similar structure and differ mainlyin the firms that they sample. It is easiest to start by describing the Enter-prise Survey, the source for our control group of registered or formal firms.It covers mainly manufacturing and certain services firms with five or moreemployees in 105 countries. The earliest available data are from 2002 andthe latest from 2007. The initial step in carrying out an Enterprise Surveyinvolves contacting the government statistical office of the relevant countryto request a list of registered establishments. In some instances the WorldBank supplements the government’s list with firms registered with thechamber of commerce of the relevant country or listed by Dun & Bradstreetor by similar private vendors of business directories. Thus, although firmsin the Enterprise Survey may hide some of their output, the governmenttypically knows of their existence. We refer to these firms as “registered”and define the term below. The next step involves contacting the firms thatwill be sampled. Enterprise Surveys use either simple random sampling orrandom stratified sampling. A local World Bank contractor telephones eachfirm to set up an interview with the person who most often deals with banksor government agencies. At that stage, firms with fewer than five employeesare dropped from the sample, as are government-owned establishments,
294 Brookings Papers on Economic Activity, Fall 2008
31. Banerjee and Duflo (2007).
11472-06_La Porta_rev2.qxd 3/6/09 1:13 PM Page 294
cooperatives, and community-owned establishments. Typical final samplesizes range between 250 and 1,500 businesses per country. As described onthe Enterprise Surveys website, “The core questionnaire is organized in twoparts. The first part seeks managers’ opinions on the . . . business environ-ment. The second part focuses on productivity measures and is often com-pleted with the help of the chief accountant or human resource manager.”
The World Bank has also conducted separate surveys of informal firmsto complement the Enterprise Survey in countries with large informaleconomies. Initially, data on the unofficial sector were collected throughthe “Informal Sector” questionnaire. Starting in 2005, the World Bankswitched to the “Micro Sector” questionnaire while phasing out the Infor-mal Sector questionnaire. Institutional amnesia makes it hard to ascertainthe precise methodology followed with the Informal Sector questionnaire.Nevertheless, the basic outlines of what was done are clear. World Bankcontractors identified neighborhoods perceived to have a large number ofinformal firms. These neighborhoods were then divided into enumerationblocks, which were then surveyed on foot.32
A similar methodology was followed to implement the Micro Sectorquestionnaire. A local contractor selected districts and zones within eachdistrict where, based on national information sources, there was a highconcentration of establishments with fewer than five employees (“micro”establishments). The contractor then created a comprehensive list of allestablishments in these zones. Finally, the contractor selected randomlyfrom that list and went door to door to set up interviews with the top man-agers of the selected establishments. Although the Micro Survey targetsestablishments with fewer than five employees, larger establishments arenot dropped from the sample. In fact, establishments with fewer than fiveemployees account for only 50 percent of the Micro Survey sample.
Participation in the surveys is voluntary, and respondents are not paidto participate.33 Respondents are asked sequentially about the businessenvironment, infrastructure, government relations, employment, financing,and firm productivity. There is some variation in the response rate acrossquestions. To illustrate, out of 6,466 Informal and Micro firms surveyed,we have the age of 6,412 firms, the number of employees of 6,416 firms,the sales of 6,136 firms, the fraction of investment financed internally of5,689 firms, assessments of the fraction of taxes typically evaded by firms
RAFAEL LA PORTA and ANDREI SHLEIFER 295
32. Jorge Rodriguez Meza, World Bank, personal correspondence with the authors, June 27, 2008.
33. We lack detailed data on nonparticipation rates. In Mali, the only country for whichwe have data on nonparticipation, the refusal rate is 9 percent.
11472-06_La Porta_rev2.qxd 3/6/09 1:13 PM Page 295
in their industry of 4,670 firms, and capacity utilization of 3,083 firms.Since Informal and Micro firms typically do not keep detailed records oftheir operations, some respondents may simply not have the informationbeing asked. Unfortunately, we have no way of quantifying the biases, ifany, from missing data.
Critically, the Informal and Micro Surveys cover registered firms as wellas firms that exist without the government’s knowledge (“unregistered”firms). In the remainder of this paper, we focus on informality understoodin terms of hidden firms rather than hidden output. To compare the perfor-mance of registered and unregistered firms, we need to define what it meansto be registered. The questions regarding the legal status of the firm areworded differently in the Informal and the Micro questionnaires. In theInformal Survey we rely on the respondent’s answer to whether firms are“registered with any agency of the central government.” In practical terms,firms are registered with an agency of the central government if they haveobtained a tax identification number. In the Micro Survey, we rely onthe respondent’s answer to whether firms have either “registered with theOffice of the Registrar . . . or other government institutions responsible forcommercial registration” or “obtained a tax identification number from thetax administration or other agency responsible for tax registration.”34 Bothsurveys also keep track of whether firms are registered with “any localgovernment agency” or with any “industry board or agency.” We focus onregistration with the central government because this form of registrationis more directly relevant to avoiding taxes, enforcing contracts, and raisingfinance. We will also present statistics on municipal and industry boardregistration. In sum, the Informal and Micro Surveys allow us to examinethe productivity of (small) registered and unregistered firms, whereas theEnterprise Survey provides information on the productivity of registeredfirms that have at least five employees.
Descriptive Statistics
Tables 3 and 4 list the countries surveyed and present the number ofobservations and average sales for the Informal and Micro samples, respec-tively. Most of the surveys (19 out of a total of 27) were carried out inAfrican countries, but 6 surveys were done in Asia and 2 in Latin America.India, Uganda, and Tanzania were surveyed with both the Informal and theMicro questionnaires. As indicated earlier, most countries covered by the
296 Brookings Papers on Economic Activity, Fall 2008
34. We obtain very similar results if the definition of “registered” firms in the MicroSurvey includes only firms that have a tax identification number.
11472-06_La Porta_rev2.qxd 3/6/09 1:13 PM Page 296
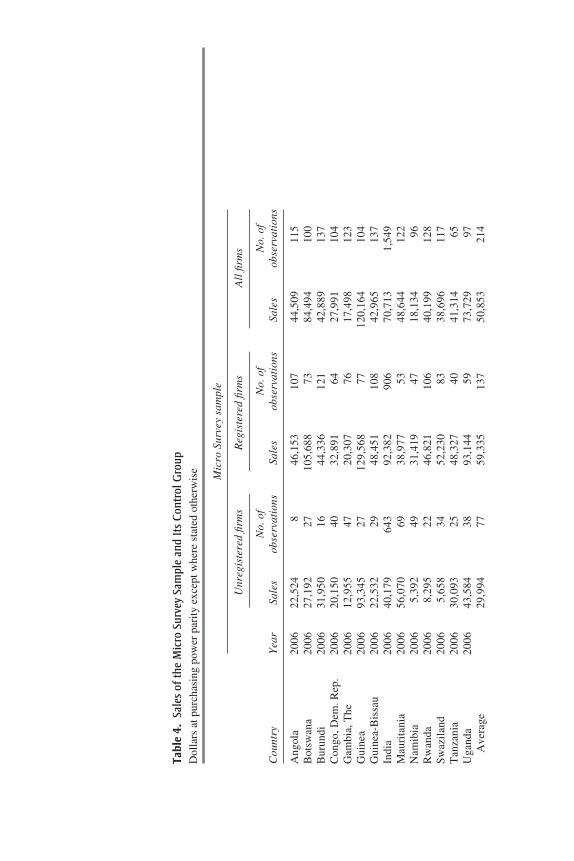
Informal and Micro Surveys are poor. The average income per capita incurrent purchasing power terms is roughly $2,400 and ranges from $281 inCongo to $12,744 in Botswana.
The Informal Survey covered 13 countries. The surveys were typicallycarried out in 2003 and, on average, have 223 firms with nonmissing salesin each country. The Micro Surveys were carried out in 14 countries in2006 and, on average, have 214 firms with nonmissing sales per country.The World Bank also carried out Enterprise Surveys in parallel with therelevant Informal and Micro Surveys. We use firms from the EnterpriseSurvey as the control group. The average number of firms in the controlgroup with available sales data is 474 for the Informal sample and 554 forthe Micro sample and ranges from 53 in Niger (table 3) to 3,860 in India(table 4).
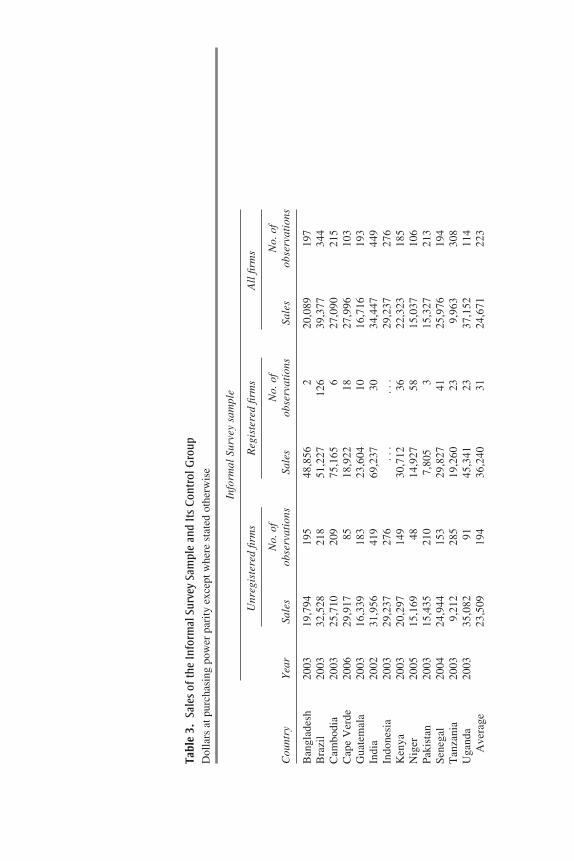
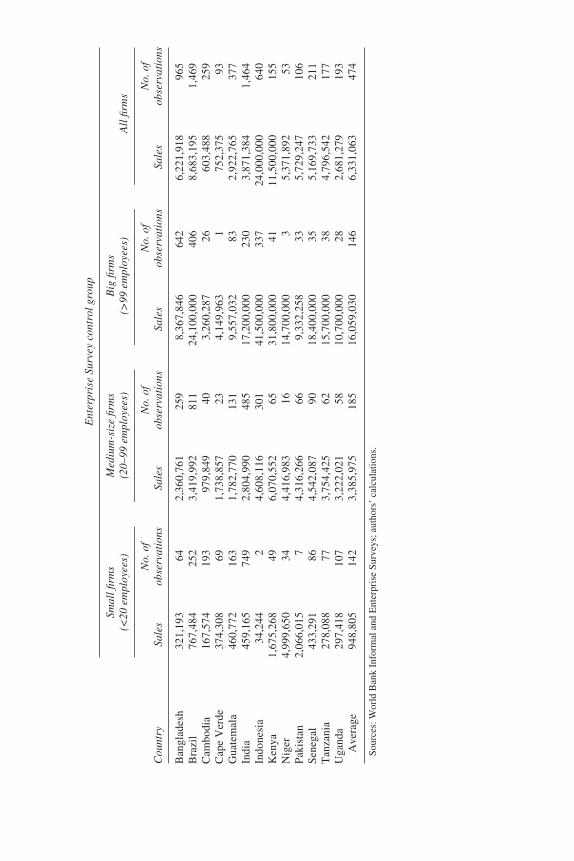
Throughout the paper we emphasize productivity differences betweenregistered and unregistered firms and between small and big firms. Criti-cally, whereas firms in the Informal Survey are typically unregistered, firmsin the Micro Survey are typically registered. The average Informal Surveyhas 31 registered firms out of a total of 223 firms, whereas the averageMicro Survey has 137 registered firms out of a total of 214 firms. Toexamine differences in size, we group Enterprise Survey firms into threecategories according to the number of employees: fewer than 20 (“small”),between 20 and 99 (“medium”), and 100 or more (“big”). When assessingsome of our results on productivity, it is worth keeping in mind that thedistribution of firms across these three categories is fairly uneven. Forexample, there is 1 big firm with nonmissing sales data (out of 93) in thecontrol group for firms in Cape Verde, but there are 337 (out of 640) in thecontrol group for firms in Indonesia (table 3). Perhaps because of the smallnumber of observations, there are few extreme outliers in the data; thesemost likely result from errors in currency units. To mitigate the role of out-liers, we cap at the 95th percentile the value of sales, sales per employee,and value added per employee in each country and in each survey. Cappingdoes not qualitatively change the results we present.
The most striking fact in tables 3 and 4 is that the average annual salesof firms in the Informal and Micro Surveys are tiny even in comparisonwith those of small firms in the Enterprise Survey. Specifically, averagesales are $24,671 for Informal Survey firms but $948,805 for small firms inthe Enterprise Survey control group for those countries. Similarly, averagesales are $50,853 for Micro Survey firms but $354,318 for small firms inthat control group. Unregistered firms are even smaller than the average firmin the Informal and Micro Surveys. For example, in the Informal Survey
RAFAEL LA PORTA and ANDREI SHLEIFER 297
11472-06_La Porta_rev2.qxd 3/6/09 1:13 PM Page 297
Tabl
e 3.
Sale
s of
the
Info
rmal
Sur
vey
Sam
ple
and
Its
Cont
rol G
roup
Dol
lars
at p
urch
asin
g po
wer
par
ity e
xcep
t whe
re s
tate
d ot
herw
ise
Info
rmal
Sur
vey
sam
ple
Unr
egis
tere
d fir
ms
Reg
iste
red
firm
sA
ll fi
rms
No.
of
No.
of
No.
of
Cou
ntry
Yea
rSa
les
obse
rvat
ions
Sale
sob
serv
atio
nsSa
les
obse
rvat
ions
Ban
glad
esh
2003
19,7
9419
548
,856
220
,089
197
Bra
zil
2003
32,5
2821
851
,227
126
39,3
7734
4C
ambo
dia
2003
25,7
1020
975
,165
627
,090
215
Cap
e V
erde
2006
29,9
1785
18,9
2218
27,9
9610
3G
uate
mal
a20
0316
,339
183
23,6
0410
16,7
1619
3In
dia
2002
31,9
5641
969
,237
3034
,447
449
Indo
nesi
a20
0329
,237
276
...
...
29,2
3727
6K
enya
2003
20,2
9714
930
,712
3622
,323
185
Nig
er20
0515
,169
4814
,927
5815
,037
106
Pak
ista
n20
0315
,435
210
7,80
53
15,3
2721
3S
eneg
al20
0424
,944
153
29,8
2741
25,9
7619
4T
anza
nia
2003
9,21
228
519
,260
239,
963
308
Uga
nda
2003
35,0
8291
45,3
4123
37,1
5211
4A
vera
ge23
,509
194
36,2
4031
24,6
7122
3
11472-06_La Porta_rev2.qxd 3/6/09 1:13 PM Page 298
Ent
erpr
ise
Surv
ey c
ontr
ol g
roup
Smal
l firm
sM
ediu
m-s
ize
firm
s B
ig fi
rms
(<20
em
ploy
ees)
(20–
99 e
mpl
oyee
s)(>
99 e
mpl
oyee
s)A
ll fi
rms
No.
of
No.
of
No.
of
No.
of
Cou
ntry
Sale
sob
serv
atio
nsSa
les
obse
rvat
ions
Sale
sob
serv
atio
nsSa
les
obse
rvat
ions
Ban
glad
esh
321,
193
642,
360,
761
259
8,36
7,84
664
26,
221,
918
965
Bra
zil
767,
484
252
3,41
9,99
281
124
,100
,000
406
8,68
3,19
51,
469
Cam
bodi
a16
7,57
419
397
9,84
940
3,26
0,28
726
603,
488
259
Cap
e V
erde
374,
308
691,
738,
857
234,
149,
963
175
2,37
593
Gua
tem
ala
460,
772
163
1,78
2,77
013
19,
557,
032
832,
922,
765
377
Indi
a45
9,16
574
92,
804,
990
485
17,2
00,0
0023
03,
871,
384
1,46
4In
done
sia
34,2
442
4,60
8,11
630
141
,500
,000
337
24,0
00,0
0064
0K
enya
1,67
5,26
849
6,07
0,55
265
31,8
00,0
0041
11,5
00,0
0015
5N
iger
4,99
9,65
034
4,41
6,98
316
14,7
00,0
003
5,37
1,89
253
Pak
ista
n2,
066,
015
74,
316,
266
669,
332,
258
335,
729,
247
106
Sen
egal
433,
291
864,
542,
087
9018
,400
,000
355,
169,
733
211
Tan
zani
a27
8,08
877
3,75
4,42
562
15,7
00,0
0038
4,79
6,54
217
7U
gand
a29
7,41
810
73,
222,
021
5810
,700
,000
282,
681,
279
193
Ave
rage
948,
805
142
3,38
5,97
518
516
,059
,030
146
6,33
1,06
347
4
Sour
ces:
Wor
ld B
ank
Info
rmal
and
Ent
erpr
ise
Surv
eys;
aut
hors
’ ca
lcul
atio
ns.
11472-06_La Porta_rev2.qxd 3/6/09 1:13 PM Page 299
Tabl
e 4.
Sale
s of
the
Mic
ro S
urve
y Sa
mpl
e an
d It
s Co
ntro
l Gro
upD
olla
rs a
t pur
chas
ing
pow
er p
arity
exc
ept w
here
sta
ted
othe
rwis
e
Mic
ro S
urve
y sa
mpl
e
Unr
egis
tere
d fir
ms
Reg
iste
red
firm
sA
ll fi
rms
No.
of
No.
of
No.
of
Cou
ntry
Yea
rSa
les
obse
rvat
ions
Sale
sob
serv
atio
nsSa
les
obse
rvat
ions
Ang
ola
2006
22,5
248
46,1
5310
744
,509
115
Bot
swan
a20
0627
,192
2710
5,68
873
84,4
9410
0B
urun
di20
0631
,950
1644
,336
121
42,8
8913
7C
ongo
, Dem
. Rep
.20
0620
,150
4032
,891
6427
,991
104
Gam
bia,
The
2006
12,9
5547
20,3
0776
17,4
9812
3G
uine
a20
0693
,345
2712
9,56
877
120,
164
104
Gui
nea-
Bis
sau
2006
22,5
3229
48,4
5110
842
,965
137
Indi
a20
0640
,179
643
92,3
8290
670
,713
1,54
9M
auri
tani
a20
0656
,070
6938
,977
5348
,644
122
Nam
ibia
2006
5,39
249
31,4
1947
18,1
3496
Rw
anda
2006
8,29
522
46,8
2110
640
,199
128
Sw
azil
and
2006
5,65
834
52,2
3083
38,6
9611
7T
anza
nia
2006
30,0
9325
48,3
2740
41,3
1465
Uga
nda
2006
43,5
8438
93,1
4459
73,7
2997
Ave
rage
29,9
9477
59,3
3513
750
,853
214
11472-06_La Porta_rev2.qxd 3/6/09 1:13 PM Page 300
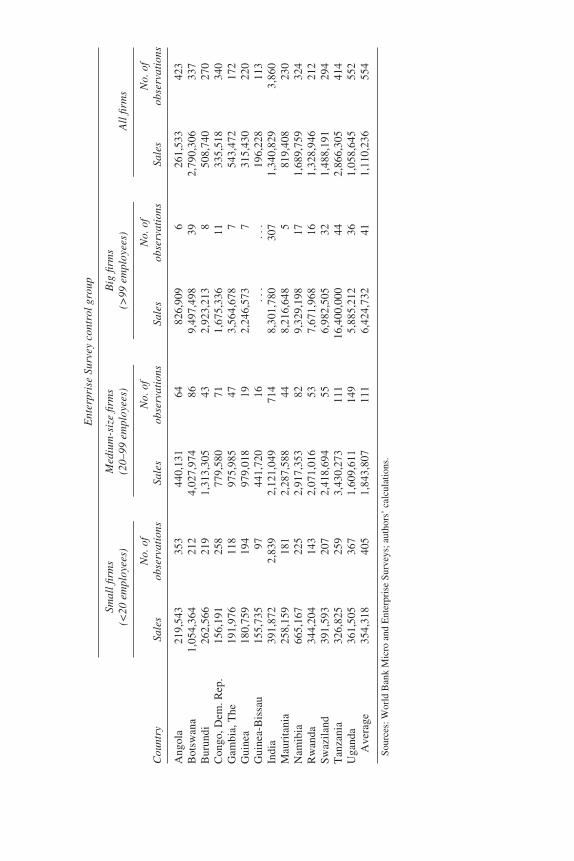
Ent
erpr
ise
Surv
ey c
ontr
ol g
roup
Smal
l firm
s M
ediu
m-s
ize
firm
s B
ig fi
rms
(<20
em
ploy
ees)
(20–
99 e
mpl
oyee
s)(>
99 e
mpl
oyee
s)A
ll fi
rms
No.
of
No.
of
No.
of
No.
of
Cou
ntry
Sale
sob
serv
atio
nsSa
les
obse
rvat
ions
Sale
sob
serv
atio
nsSa
les
obse
rvat
ions
Ang
ola
219,
543
353
440,
131
6482
6,90
96
261,
533
423
Bot
swan
a1,
054,
364
212
4,02
7,97
486
9,49
7,49
839
2,79
0,30
633
7B
urun
di26
2,56
621
91,
313,
305
432,
923,
213
850
8,74
027
0C
ongo
, Dem
. Rep
.15
6,19
125
877
9,58
071
1,67
5,33
611
335,
518
340
Gam
bia,
The
191,
976
118
975,
985
473,
564,
678
754
3,47
217
2G
uine
a18
0,75
919
497
9,01
819
2,24
6,57
37
315,
430
220
Gui
nea-
Bis
sau
155,
735
9744
1,72
016
...
...
196,
228
113
Indi
a39
1,87
22,
839
2,12
1,04
971
48,
301,
780
307
1,34
0,82
93,
860
Mau
rita
nia
258,
159
181
2,28
7,58
844
8,21
6,64
85
819,
408
230
Nam
ibia
665,
167
225
2,91
7,35
382
9,32
9,19
817
1,68
9,75
932
4R
wan
da34
4,20
414
32,
071,
016
537,
671,
968
161,
328,
946
212
Sw
azil
and
391,
593
207
2,41
8,69
455
6,98
2,50
532
1,48
8,19
129
4T
anza
nia
326,
825
259
3,43
0,27
311
116
,400
,000
442,
866,
305
414
Uga
nda
361,
505
367
1,60
9,61
114
95,
885,
212
361,
058,
645
552
Ave
rage
354,
318
405
1,84
3,80
711
16,
424,
732
411,
110,
236
554
Sour
ces:
Wor
ld B
ank
Mic
ro a
nd E
nter
pris
e Su
rvey
s; a
utho
rs’
calc
ulat
ions
.
11472-06_La Porta_rev2.qxd 3/6/09 1:13 PM Page 301
sample, average sales for unregistered Brazilian firms are $32,528, com-pared with $51,227 for registered firms. Looking across countries, unregis-tered firms in the Informal Survey sample have average sales of $23,509,compared with $36,240 for registered firms. Similarly, unregistered firmsin the Micro Survey sample have average sales of $29,994, compared with$59,335 for registered firms. It is natural to worry that the reported sales ofunregistered firms may be low because respondents lie about their output.We address this issue in the third section of the paper.
What do unregistered firms do? Tables 5 and 6 shed light on some of thebasic characteristics of firms in the Informal and Micro Surveys, respec-tively. The two tables have a similar—but not identical—structure, sincethere are only small differences between the two questionnaires. For eachvariable we present the mean for each group (for example, unregistered,registered, small, medium, and big) as well as the differences between themeans for selected groups of interest (for example, small versus unregis-tered) and their statistical significance. So that the results are not driven bythe countries with the most observations, we first average all observationswithin a country and then compute means and t statistics across countries.
The first block of variables in table 5 shows some general characteristicsof the firms. Unregistered firms, although younger (9.9 years on average)than the average firm in the control group (17.8 years), have been operatingfor quite a long time. By definition, unregistered firms are not registeredwith the central government. Yet 34 percent of them are registered with alocal government agency, and 7.2 percent are registered with an industryboard or agency.
The next four variables describe the assets owned by firms in the Infor-mal Survey. Unregistered firms own, on average, 52.3 percent of the landand 45.1 percent of the buildings that they occupy. Registered firms havecomparable figures (55.5 percent and 48.1 percent). In contrast, firms inthe Enterprise Survey control group own a significantly larger fractionof the land and buildings that they occupy (on average, 67.4 percent and71.2 percent, respectively). The ownership of electric generators—a keyasset in poor countries—shows a similar pattern. Few firms, unregisteredor registered, in the Informal Survey own a generator (5.5 percent and5.1 percent, respectively). In contrast, 20.1 percent of small firms and77.0 percent of big firms in the Enterprise Survey own a generator. Capac-ity utilization rates vary little between unregistered Informal Survey firmsand Enterprise Survey firms (61.9 percent versus 68.2 percent, respectively).The evidence also suggests that unregistered and registered firms may notshare the same clients. In the Informal Survey, only 1.2 percent of the
302 Brookings Papers on Economic Activity, Fall 2008
11472-06_La Porta_rev2.qxd 3/6/09 1:13 PM Page 302
unregistered firms make the largest fraction of their sales to large firms.In contrast, large firms are the main client of 13.5 percent of registeredfirms—a percentage comparable to the average firm in the EnterpriseSurvey (15.1 percent).
The next block of variables describes the employees and their humancapital in the Informal Survey. Unsurprisingly, unregistered firms have thesmallest average number of employees (3.9). More interestingly, registeredfirms in the Informal Survey and small firms in the Enterprise Survey havevery similar employment levels (9.8 and 10.3 employees, respectively).The key fact regarding informal firms is that—consistent with the dual viewbut not with the other two views—their top managers have low humancapital. For example, the probability that the top manager of a firm hassome college education is only 6.1 percent in the Informal Survey if thefirm is unregistered, compared with 15.9 percent for registered firms in thesame survey and 63.9 percent for all firms in the Enterprise Survey. Tosummarize the differences in human capital, we created an index rangingfrom 1 to 4 according to whether the top manager’s highest level of educa-tion attended was primary school, secondary school, vocational school,or college. This index equals 1.6 for managers of unregistered firms and3.3 for managers of Enterprise Survey firms. We constructed a similarindex for the employees, with strikingly different results. Employees ofInformal Survey firms have levels of education very similar to those ofEnterprise Survey firms (indexes of 2.4 and 2.3, respectively).
Next, we turn to how firms are financed. All views of informality agreethat greater access to finance is an important benefit of operating in theformal sector. In fact, roughly 75.1 percent of the unregistered InformalSurvey firms have never even had a commercial loan. Instead, they finance74.9 percent of investment with internal funds and 10.5 percent with helpfrom the owner’s family. The most striking fact about financing is that allsmall firms—not just unregistered ones—lack access to finance. In fact,small firms in the Enterprise Survey finance 67.8 percent of their invest-ment with internal funds and 6.3 percent with family funds. Big firms inthe Enterprise Survey have more access to external finance than small ones.For example, internal funds pay for 50.4 percent of the investment of bigfirms. Yet the fact that all small firms lack access to finance suggests that itmay be misguided to put access to finance for unregistered firms at thecenter of the development agenda.
Finally, contrary to the romantic view, there is no evidence in theInformal Survey that unregistered firms are dynamic engines of employ-ment creation. Two-year growth rates of employment are 5.2 percent for
RAFAEL LA PORTA and ANDREI SHLEIFER 303
11472-06_La Porta_rev2.qxd 3/6/09 1:13 PM Page 303
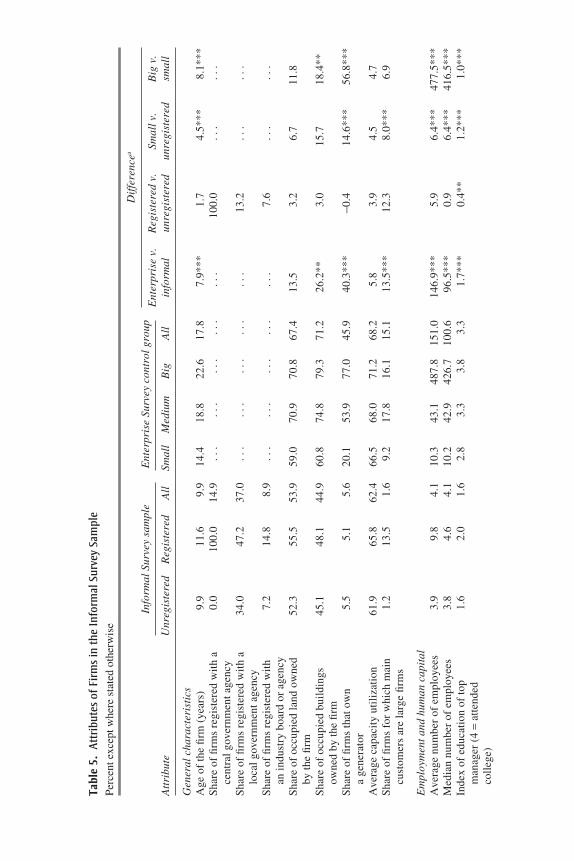
Tabl
e 5.
Attr
ibut
es o
f Fir
ms
in th
e In
form
al S
urve
y Sa
mpl
ePe
rcen
t exc
ept w
here
sta
ted
othe
rwis
e
Info
rmal
Sur
vey
sam
ple
Ent
erpr
ise
Surv
ey c
ontr
ol g
roup
Dif
fere
ncea
Ent
erpr
ise
v.
Reg
iste
red
v.
Smal
l v.
Big
v.
Att
ribu
teU
nreg
iste
red
Reg
iste
red
All
Smal
lM
ediu
mB
igA
llin
form
alun
regi
ster
edun
regi
ster
edsm
all
Gen
eral
cha
ract
eris
tics
Age
of
the
firm
(ye
ars)
9.9
11.6
9.9
14.4
18.8
22.6
17.8
7.9*
**1.
74.
5***
8.1*
**S
hare
of
firm
s re
gist
ered
wit
h a
0.0
100.
014
.9..
...
...
...
...
.10
0.0
...
...
cent
ral g
over
nmen
t age
ncy
Sha
re o
f fi
rms
regi
ster
ed w
ith
a 34
.047
.237
.0..
...
...
...
...
.13
.2..
...
.lo
cal g
over
nmen
t age
ncy
Sha
re o
f fi
rms
regi
ster
ed w
ith
7.2
14.8
8.9
...
...
...
...
...
7.6
...
...
an in
dust
ry b
oard
or
agen
cyS
hare
of
occu
pied
land
ow
ned
52.3
55.5
53.9
59.0
70.9
70.8
67.4
13.5
3.2
6.7
11.8
by th
e fi
rmS
hare
of
occu
pied
bui
ldin
gs
45.1
48.1
44.9
60.8
74.8
79.3
71.2
26.2
**3.
015
.718
.4**
owne
d by
the
firm
Sha
re o
f fi
rms
that
ow
n 5.
55.
15.
620
.153
.977
.045
.940
.3**
*−0
.414
.6**
*56
.8**
*a
gene
rato
rA
vera
ge c
apac
ity
util
izat
ion
61.9
65.8
62.4
66.5
68.0
71.2
68.2
5.8
3.9
4.5
4.7
Sha
re o
f fi
rms
for
whi
ch m
ain
1.2
13.5
1.6
9.2
17.8
16.1
15.1
13.5
***
12.3
8.0*
**6.
9cu
stom
ers
are
larg
e fi
rms
Em
ploy
men
t and
hum
an c
apit
alA
vera
ge n
umbe
r of
em
ploy
ees
3.9
9.8
4.1
10.3
43.1
487.
815
1.0
146.
9***
5.9
6.4*
**47
7.5*
**M
edia
n nu
mbe
r of
em
ploy
ees
3.8
4.6
4.1
10.2
42.9
426.
710
0.6
96.5
***
0.9
6.4*
**41
6.5*
**In
dex
of e
duca
tion
of
top
1.6
2.0
1.6
2.8
3.3
3.8
3.3
1.7*
**0.
4**
1.2*
**1.
0***
man
ager
(4
=at
tend
ed
coll
ege)
11472-06_La Porta_rev2.qxd 3/6/09 1:13 PM Page 304
Sha
re o
f to
p m
anag
ers
wit
h in
dica
ted
high
est
educ
atio
nal a
tten
danc
e:P
rim
ary
64.8
47.8
64.2
13.0
7.0
2.1
8.9
−55.
3***
−17.
0*−5
1.8*
**−1
0.9*
**S
econ
dary
19.3
20.8
18.6
34.8
19.5
5.9
18.1
−0.5
1.4
15.4
*−2
8.9*
**V
ocat
iona
l9.
815
.610
.410
.98.
24.
69.
1−1
.35.
81.
0−6
.3*
Col
lege
6.1
15.9
6.8
41.4
65.2
87.5
63.9
57.0
***
9.8*
*35
.3**
*46
.1**
*In
dex
of e
duca
tion
of
aver
age
2.4
2.5
2.4
2.3
2.3
2.4
2.3
−0.1
0.1
−0.1
0.2
empl
oyee
(4
=at
tend
ed
coll
ege)
Sha
re o
f em
ploy
ees
wit
h in
dica
ted
high
est e
duca
tion
al
atte
ndan
ce:
Pri
mar
y59
.050
.058
.252
.351
.545
.247
.9−1
0.3
−9.1
−6.8
−7.1
Sec
onda
ry34
.340
.234
.924
.427
.733
.532
.5−2
.45.
9−9
.99.
0C
olle
ge6.
79.
86.
921
.818
.317
.717
.410
.5**
*3.
215
.1**
−4.0
Fin
ance
Sha
re o
f fi
rms
that
hav
e ev
er
24.9
35.6
26.0
...
...
...
...
...
10.7
...
...
had
a co
mm
erci
al lo
anS
hare
of
fina
ncin
g fr
om:
Inte
rnal
fun
ds74
.971
.075
.767
.856
.350
.458
.2−1
7.5*
**−3
.9−7
.2−1
7.4*
*T
rade
4.6
6.2
4.7
4.9
6.2
7.2
5.9
1.2
1.7
0.4
2.2
Ow
ner’
s fa
mil
y10
.59.
19.
56.
36.
33.
76.
6−2
.9−1
.4−4
.2−2
.6B
anks
3.0
4.0
3.0
9.6
16.0
20.9
15.0
12.0
***
1.1
6.6*
*11
.4**
*D
urat
ion
of la
st lo
an (
mon
ths)
14.6
13.3
14.1
29.0
32.7
35.1
32.2
18.1
**−1
.214
.5**
6.1
Gro
wth
Ann
ual g
row
th in
em
ploy
men
t 5.
27.
15.
48.
111
.111
.610
.04.
6*1.
92.
93.
5ov
er p
revi
ous
two
year
s
Sour
ces:
Wor
ld B
ank
Info
rmal
and
Ent
erpr
ise
Surv
eys;
aut
hors
’ ca
lcul
atio
ns.
a. A
ster
isks
indi
cate
sig
nific
antly
dif
fere
nt f
rom
zer
o at
the
*10
perc
ent,
**5
perc
ent,
and
***1
per
cent
leve
l.
11472-06_La Porta_rev2.qxd 3/6/09 1:13 PM Page 305
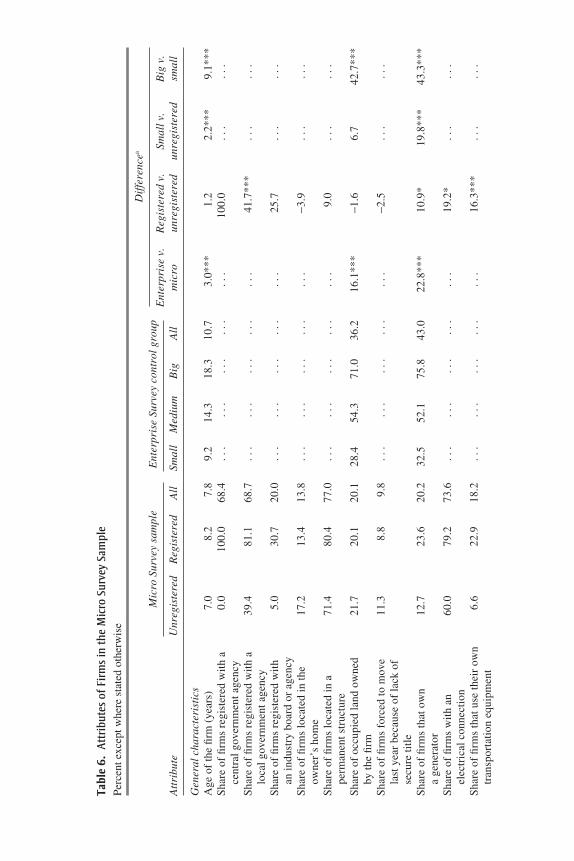
Tabl
e 6.
Attr
ibut
es o
f Fir
ms
in th
e M
icro
Sur
vey
Sam
ple
Perc
ent e
xcep
t whe
re s
tate
d ot
herw
ise
Mic
ro S
urve
y sa
mpl
eE
nter
pris
e Su
rvey
con
trol
gro
upD
iffe
renc
ea
Ent
erpr
ise
v.R
egis
tere
d v.
Sm
all v
. B
ig v
. A
ttri
bute
Unr
egis
tere
dR
egis
tere
dA
llSm
all
Med
ium
Big
All
mic
roun
regi
ster
edun
regi
ster
edsm
all
Gen
eral
cha
ract
eris
tics
Age
of
the
firm
(ye
ars)
7.0
8.2
7.8
9.2
14.3
18.3
10.7
3.0*
**1.
22.
2***
9.1*
**S
hare
of
firm
s re
gist
ered
wit
h a
0.0
100.
068
.4..
...
...
...
...
.10
0.0
...
...
cent
ral g
over
nmen
t age
ncy
Sha
re o
f fi
rms
regi
ster
ed w
ith
a 39
.481
.168
.7..
...
...
...
...
.41
.7**
*..
...
.lo
cal g
over
nmen
t age
ncy
Sha
re o
f fi
rms
regi
ster
ed w
ith
5.0
30.7
20.0
...
...
...
...
...
25.7
...
...
an in
dust
ry b
oard
or
agen
cyS
hare
of
firm
s lo
cate
d in
the
17.2
13.4
13.8
...
...
...
...
...
−3.9
...
...
owne
r’s
hom
eS
hare
of
firm
s lo
cate
d in
a
71.4
80.4
77.0
...
...
...
...
...
9.0
...
...
perm
anen
t str
uctu
reS
hare
of
occu
pied
land
ow
ned
21.7
20.1
20.1
28.4
54.3
71.0
36.2
16.1
***
−1.6
6.7
42.7
***
by th
e fi
rmS
hare
of
firm
s fo
rced
to m
ove
11.3
8.8
9.8
...
...
...
...
...
−2.5
...
...
last
yea
r be
caus
e of
lack
of
secu
re ti
tle
Sha
re o
f fi
rms
that
ow
n 12
.723
.620
.232
.552
.175
.843
.022
.8**
*10
.9*
19.8
***
43.3
***
a ge
nera
tor
Sha
re o
f fi
rms
wit
h an
60
.079
.273
.6..
...
...
...
...
.19
.2*
...
...
elec
tric
al c
onne
ctio
nS
hare
of
firm
s th
at u
se th
eir
own
6.6
22.9
18.2
...
...
...
...
...
16.3
***
...
...
tran
spor
tati
on e
quip
men
t
11472-06_La Porta_rev2.qxd 3/6/09 1:13 PM Page 306
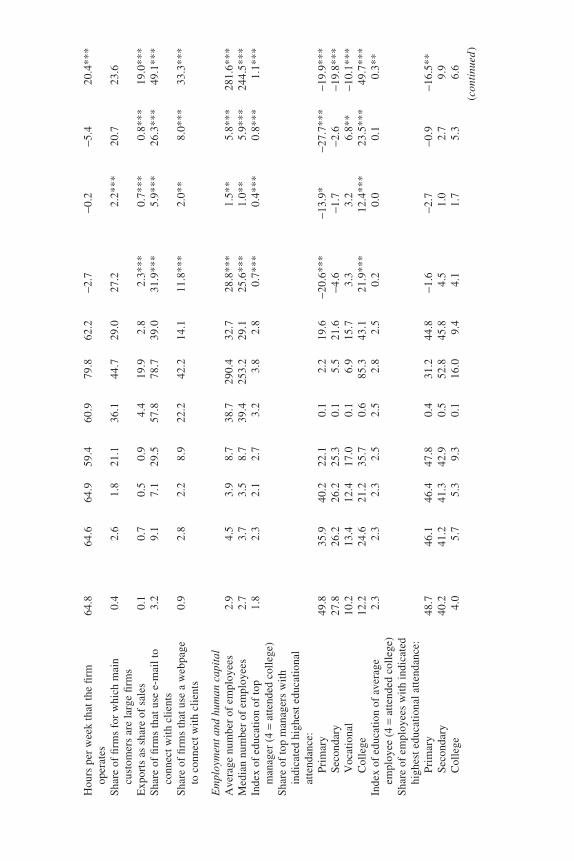
Hou
rs p
er w
eek
that
the
firm
64
.864
.664
.959
.460
.979
.862
.2−2
.7−0
.2−5
.420
.4**
*op
erat
esS
hare
of
firm
s fo
r w
hich
mai
n 0.
42.
61.
821
.136
.144
.729
.027
.22.
2***
20.7
23.6
cust
omer
s ar
e la
rge
firm
sE
xpor
ts a
s sh
are
of s
ales
0.1
0.7
0.5
0.9
4.4
19.9
2.8
2.3*
**0.
7***
0.8*
**19
.0**
*S
hare
of
firm
s th
at u
se e
-mai
l to
3.2
9.1
7.1
29.5
57.8
78.7
39.0
31.9
***
5.9*
**26
.3**
*49
.1**
*co
nnec
t wit
h cl
ient
sS
hare
of
firm
s th
at u
se a
web
page
0.
92.
82.
28.
922
.242
.214
.111
.8**
*2.
0**
8.0*
**33
.3**
*to
con
nect
wit
h cl
ient
s
Em
ploy
men
t and
hum
an c
apit
alA
vera
ge n
umbe
r of
em
ploy
ees
2.9
4.5
3.9
8.7
38.7
290.
432
.728
.8**
*1.
5**
5.8*
**28
1.6*
**M
edia
n nu
mbe
r of
em
ploy
ees
2.7
3.7
3.5
8.7
39.4
253.
229
.125
.6**
*1.
0**
5.9*
**24
4.5*
**In
dex
of e
duca
tion
of
top
1.8
2.3
2.1
2.7
3.2
3.8
2.8
0.7*
**0.
4***
0.8*
**1.
1***
man
ager
(4
=at
tend
ed c
olle
ge)
Sha
re o
f to
p m
anag
ers
wit
h in
dica
ted
high
est e
duca
tion
al
atte
ndan
ce:
Pri
mar
y49
.835
.940
.222
.10.
12.
219
.6−2
0.6*
**−1
3.9*
−27.
7***
−19.
9***
Sec
onda
ry27
.826
.226
.225
.30.
15.
521
.6−4
.6−1
.7−2
.6−1
9.8*
**V
ocat
iona
l10
.213
.412
.417
.00.
16.
915
.73.
33.
26.
8**
−10.
1***
Col
lege
12.2
24.6
21.2
35.7
0.6
85.3
43.1
21.9
***
12.4
***
23.5
***
49.7
***
Inde
x of
edu
cati
on o
f av
erag
e 2.
32.
32.
32.
52.
52.
82.
50.
20.
00.
10.
3**
empl
oyee
(4
=at
tend
ed c
olle
ge)
Sha
re o
f em
ploy
ees
wit
h in
dica
ted
high
est e
duca
tion
al a
tten
danc
e:P
rim
ary
48.7
46.1
46.4
47.8
0.4
31.2
44.8
−1.6
−2.7
−0.9
−16.
5**
Sec
onda
ry40
.241
.241
.342
.90.
552
.845
.84.
51.
02.
79.
9C
olle
ge4.
05.
75.
39.
30.
116
.09.
44.
11.
75.
36.
6
(con
tinu
ed)
11472-06_La Porta_rev2.qxd 3/6/09 1:13 PM Page 307
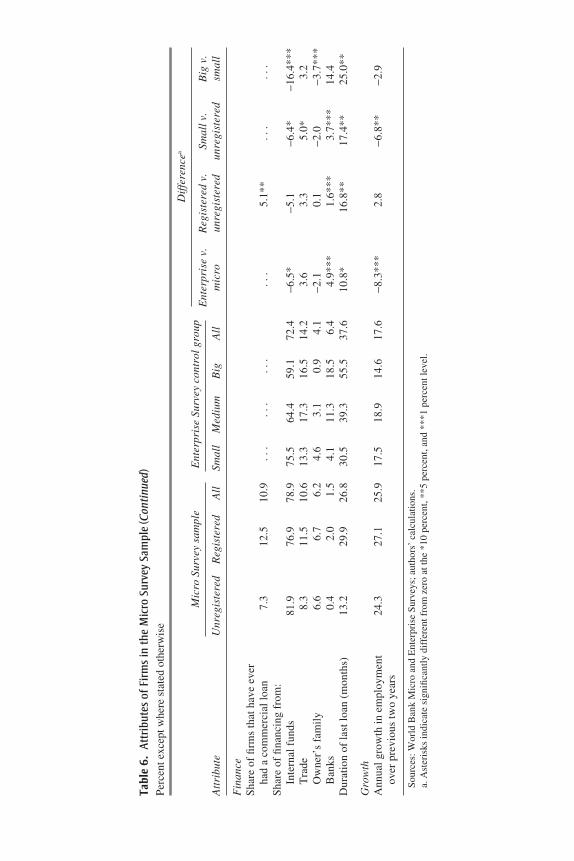
Fin
ance
Sha
re o
f fi
rms
that
hav
e ev
er
had
a co
mm
erci
al lo
an7.
312
.510
.9..
...
...
...
.5.
1**
...
...
Sha
re o
f fi
nanc
ing
from
:In
tern
al f
unds
81.9
76.9
78.9
75.5
64.4
59.1
72.4
−6.5
*−5
.1−6
.4*
−16.
4***
Tra
de8.
311
.510
.613
.317
.316
.514
.23.
63.
35.
0*3.
2O
wne
r’s
fam
ily
6.6
6.7
6.2
4.6
3.1
0.9
4.1
−2.1
0.1
−2.0
−3.7
***
Ban
ks0.
42.
01.
54.
111
.318
.56.
44.
9***
1.6*
**3.
7***
14.4
Dur
atio
n of
last
loan
(m
onth
s)13
.229
.926
.830
.539
.355
.537
.610
.8*
16.8
**17
.4**
25.0
**
Gro
wth
Ann
ual g
row
th in
em
ploy
men
t 24
.327
.125
.917
.518
.914
.617
.6−8
.3**
*2.
8−6
.8**
−2.9
over
pre
viou
s tw
o ye
ars
Sour
ces:
Wor
ld B
ank
Mic
ro a
nd E
nter
pris
e Su
rvey
s; a
utho
rs’
calc
ulat
ions
.a.
Ast
eris
ks in
dica
te s
igni
fican
tly d
iffe
rent
fro
m z
ero
at th
e *1
0 pe
rcen
t, **
5 pe
rcen
t, an
d **
*1 p
erce
nt le
vel.
Tabl
e 6.
Attr
ibut
es o
f Fir
ms
in th
e M
icro
Sur
vey
Sam
ple
(Con
tinu
ed)
Perc
ent e
xcep
t whe
re s
tate
d ot
herw
ise
Mic
ro S
urve
y sa
mpl
eE
nter
pris
e Su
rvey
con
trol
gro
upD
iffe
renc
ea
Ent
erpr
ise
v.R
egis
tere
d v.
Sm
all v
. B
ig v
. A
ttri
bute
Unr
egis
tere
dR
egis
tere
dA
llSm
all
Med
ium
Big
All
mic
roun
regi
ster
edun
regi
ster
edsm
all
11472-06_La Porta_rev2.qxd 3/6/09 1:13 PM Page 308
unregistered firms, 7.1 percent for registered firms, and 10.0 percent for allEnterprise Survey firms.
Firms in the Micro Survey sample show patterns very similar to thosein the Informal Survey sample (table 6). We therefore discuss them onlybriefly, focusing on the questions that are available only on the Micro Sur-vey questionnaire and on the few results that are different between the twoquestionnaires. The Micro questionnaire provides a bit more insight into thefirms’ assets. Only 17.2 percent of the unregistered firms and 13.4 percentof the registered ones are located in the owner’s house. Most unregistered(71.4 percent) and registered (80.4 percent) firms occupy a permanentstructure. However, there is evidence of hardship resulting from the lack ofsecure title:35 11.3 percent of unregistered firms and 8.8 percent of regis-tered firms were forced to move in the previous year for this reason.
Much like their counterparts in the Informal Survey, unregistered firmsin the Micro Survey sample are significantly less likely to own a genera-tor than all other firms. This lack of generators is suggestive of insuffi-cient capital, since unregistered firms are significantly less likely to havean electrical connection than registered ones (60 percent versus 79.2 per-cent). Furthermore, unregistered firms are much less likely to use theirown transportation equipment than registered firms (6.6 percent versus22.9 percent). Consistent with the view that unregistered firms and Enter-prise Survey firms may serve different clients, big Enterprise Survey firmsexport 19.9 percent of their sales, whereas unregistered firms export only0.1 percent of their sales. Finally, there is evidence that unregistered firmshave less access to computers than do other firms. In particular, unregis-tered firms are less likely to use e-mail to communicate with their clientsthan either registered firms or Enterprise Survey firms (3.2, 9.1, and39.0 percent, respectively). Similarly, unregistered firms are less likely touse a webpage to connect with clients than either registered firms or Enter-prise Survey firms (0.9, 2.8, and 14.1 percent, respectively). Consistentwith the dual view, unregistered firms tend to own low-quality assets.
Unregistered firms in the Micro sample—unlike their counterparts inthe Informal sample—have a faster growth rate of employment than firmsin the Enterprise Survey. Average annual employment growth amongunregistered firms (24.3 percent), although not quite matching that ofregistered firms (27.1 percent), exceeds that of Enterprise Survey firms(17.6 percent). The fast employment growth rate of unregistered MicroSurvey firms is consistent with the romantic view. However, this finding
RAFAEL LA PORTA and ANDREI SHLEIFER 309
35. De Soto (2000).
11472-06_La Porta_rev2.qxd 3/6/09 1:13 PM Page 309
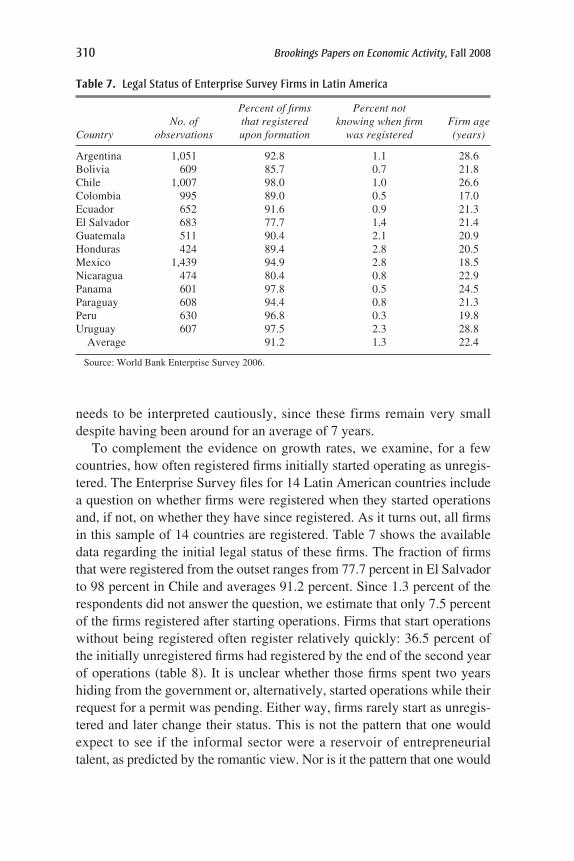
needs to be interpreted cautiously, since these firms remain very smalldespite having been around for an average of 7 years.
To complement the evidence on growth rates, we examine, for a fewcountries, how often registered firms initially started operating as unregis-tered. The Enterprise Survey files for 14 Latin American countries includea question on whether firms were registered when they started operationsand, if not, on whether they have since registered. As it turns out, all firmsin this sample of 14 countries are registered. Table 7 shows the availabledata regarding the initial legal status of these firms. The fraction of firmsthat were registered from the outset ranges from 77.7 percent in El Salvadorto 98 percent in Chile and averages 91.2 percent. Since 1.3 percent of therespondents did not answer the question, we estimate that only 7.5 percentof the firms registered after starting operations. Firms that start operationswithout being registered often register relatively quickly: 36.5 percent ofthe initially unregistered firms had registered by the end of the second yearof operations (table 8). It is unclear whether those firms spent two yearshiding from the government or, alternatively, started operations while theirrequest for a permit was pending. Either way, firms rarely start as unregis-tered and later change their status. This is not the pattern that one wouldexpect to see if the informal sector were a reservoir of entrepreneurialtalent, as predicted by the romantic view. Nor is it the pattern that one would
310 Brookings Papers on Economic Activity, Fall 2008
Table 7. Legal Status of Enterprise Survey Firms in Latin America
Percent of firms Percent not No. of that registered knowing when firm Firm age
Country observations upon formation was registered (years)
Argentina 1,051 92.8 1.1 28.6Bolivia 609 85.7 0.7 21.8Chile 1,007 98.0 1.0 26.6Colombia 995 89.0 0.5 17.0Ecuador 652 91.6 0.9 21.3El Salvador 683 77.7 1.4 21.4Guatemala 511 90.4 2.1 20.9Honduras 424 89.4 2.8 20.5Mexico 1,439 94.9 2.8 18.5Nicaragua 474 80.4 0.8 22.9Panama 601 97.8 0.5 24.5Paraguay 608 94.4 0.8 21.3Peru 630 96.8 0.3 19.8Uruguay 607 97.5 2.3 28.8
Average 91.2 1.3 22.4
Source: World Bank Enterprise Survey 2006.
11472-06_La Porta_rev2.qxd 3/6/09 1:13 PM Page 310
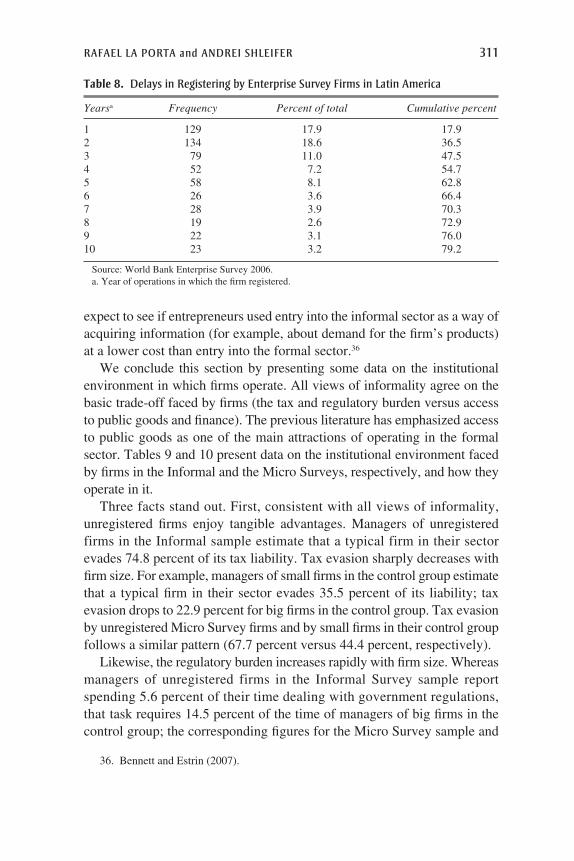
expect to see if entrepreneurs used entry into the informal sector as a way ofacquiring information (for example, about demand for the firm’s products)at a lower cost than entry into the formal sector.36
We conclude this section by presenting some data on the institutionalenvironment in which firms operate. All views of informality agree on thebasic trade-off faced by firms (the tax and regulatory burden versus accessto public goods and finance). The previous literature has emphasized accessto public goods as one of the main attractions of operating in the formalsector. Tables 9 and 10 present data on the institutional environment facedby firms in the Informal and the Micro Surveys, respectively, and how theyoperate in it.
Three facts stand out. First, consistent with all views of informality,unregistered firms enjoy tangible advantages. Managers of unregisteredfirms in the Informal sample estimate that a typical firm in their sectorevades 74.8 percent of its tax liability. Tax evasion sharply decreases withfirm size. For example, managers of small firms in the control group estimatethat a typical firm in their sector evades 35.5 percent of its liability; taxevasion drops to 22.9 percent for big firms in the control group. Tax evasionby unregistered Micro Survey firms and by small firms in their control groupfollows a similar pattern (67.7 percent versus 44.4 percent, respectively).
Likewise, the regulatory burden increases rapidly with firm size. Whereasmanagers of unregistered firms in the Informal Survey sample reportspending 5.6 percent of their time dealing with government regulations,that task requires 14.5 percent of the time of managers of big firms in thecontrol group; the corresponding figures for the Micro Survey sample and
RAFAEL LA PORTA and ANDREI SHLEIFER 311
36. Bennett and Estrin (2007).
Table 8. Delays in Registering by Enterprise Survey Firms in Latin America
Yearsa Frequency Percent of total Cumulative percent
1 129 17.9 17.92 134 18.6 36.53 79 11.0 47.54 52 7.2 54.75 58 8.1 62.86 26 3.6 66.47 28 3.9 70.38 19 2.6 72.99 22 3.1 76.010 23 3.2 79.2
Source: World Bank Enterprise Survey 2006.a. Year of operations in which the firm registered.
11472-06_La Porta_rev2.qxd 3/6/09 1:13 PM Page 311
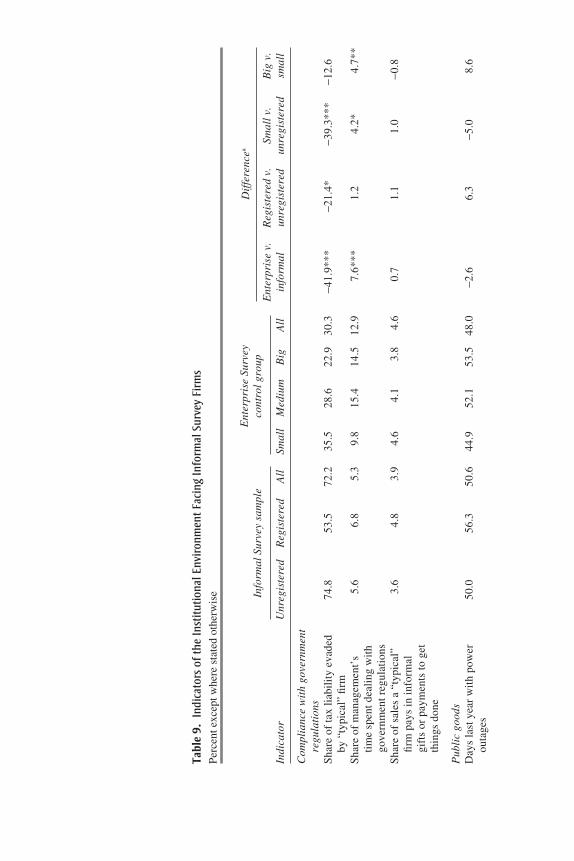
Tabl
e 9.
Indi
cato
rs o
f the
Inst
itutio
nal E
nvir
onm
ent F
acin
g In
form
al S
urve
y Fi
rms
Perc
ent e
xcep
t whe
re s
tate
d ot
herw
ise
Ent
erpr
ise
Surv
ey
Info
rmal
Sur
vey
sam
ple
cont
rol g
roup
Dif
fere
ncea
Ent
erpr
ise
v.
Reg
iste
red
v.
Smal
l v.
Big
v.
Indi
cato
rU
nreg
iste
red
Reg
iste
red
All
Smal
lM
ediu
mB
igA
llin
form
alun
regi
ster
edun
regi
ster
edsm
all
Com
plia
nce
wit
h go
vern
men
t re
gula
tion
sS
hare
of ta
x li
abil
ity
evad
ed
74.8
53.5
72.2
35.5
28.6
22.9
30.3
−41.
9***
−21.
4*−3
9.3*
**−1
2.6
by “
typi
cal”
firm
Sha
reof
man
agem
ent’
s 5.
66.
85.
39.
815
.414
.512
.97.
6***
1.2
4.2*
4.7*
*ti
me
spen
t dea
ling
wit
h go
vern
men
t reg
ulat
ions
Sha
reof
sal
es a
“ty
pica
l”
3.6
4.8
3.9
4.6
4.1
3.8
4.6
0.7
1.1
1.0
−0.8
firm
pay
s in
info
rmal
gi
fts
or p
aym
ents
to g
et
thin
gs d
one
Pub
lic
good
sD
ays
last
yea
r w
ith
pow
er
50.0
56.3
50.6
44.9
52.1
53.5
48.0
−2.6
6.3
−5.0
8.6
outa
ges
11472-06_La Porta_rev2.qxd 3/6/09 1:13 PM Page 312
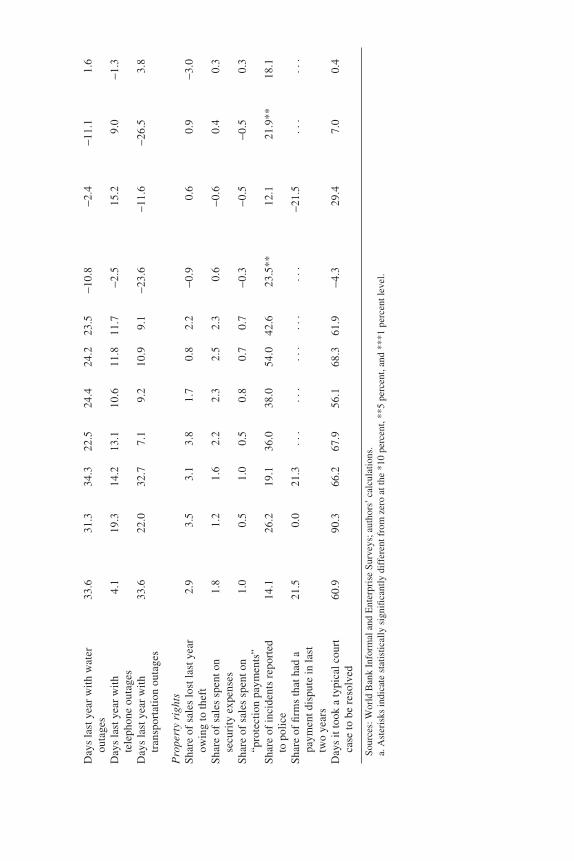
Day
sla
st y
ear
wit
h w
ater
33
.631
.334
.322
.524
.424
.223
.5−1
0.8
−2.4
−11.
11.
6ou
tage
sD
ays
last
yea
r w
ith
4.1
19.3
14.2
13.1
10.6
11.8
11.7
−2.5
15.2
9.0
−1.3
tele
phon
e ou
tage
sD
ays
last
yea
r w
ith
33.6
22.0
32.7
7.1
9.2
10.9
9.1
−23.
6−1
1.6
−26.
53.
8tr
ansp
orta
tion
out
ages
Pro
pert
yri
ghts
Sha
reof
sal
es lo
st la
st y
ear
2.9
3.5
3.1
3.8
1.7
0.8
2.2
−0.9
0.6
0.9
−3.0
owin
g to
thef
tS
hare
of s
ales
spe
nt o
n 1.
81.
21.
62.
22.
32.
52.
30.
6−0
.60.
40.
3se
curi
ty e
xpen
ses
Sha
reof
sal
es s
pent
on
1.0
0.5
1.0
0.5
0.8
0.7
0.7
−0.3
−0.5
−0.5
0.3
“pro
tect
ion
paym
ents
”S
hare
of in
cide
nts
repo
rted
14
.126
.219
.136
.038
.054
.042
.623
.5**
12.1
21.9
**18
.1to
pol
ice
Sha
reof
firm
s th
at h
ad a
21
.50.
021
.3..
...
...
...
...
.−2
1.5
...
...
paym
ent d
ispu
tein
last
tw
o ye
ars
Day
sit
took
a ty
pica
l cou
rt
60.9
90.3
66.2
67.9
56.1
68.3
61.9
−4.3
29.4
7.0
0.4
case
to b
e re
solv
ed
Sour
ces:
Wor
ld B
ank
Info
rmal
and
Ent
erpr
ise
Surv
eys;
aut
hors
’ ca
lcul
atio
ns.
a. A
ster
isks
indi
cate
sta
tistic
ally
sig
nific
antly
dif
fere
nt f
rom
zer
o at
the
*10
perc
ent,
**5
perc
ent,
and
***1
per
cent
leve
l.
11472-06_La Porta_rev2.qxd 3/6/09 1:13 PM Page 313
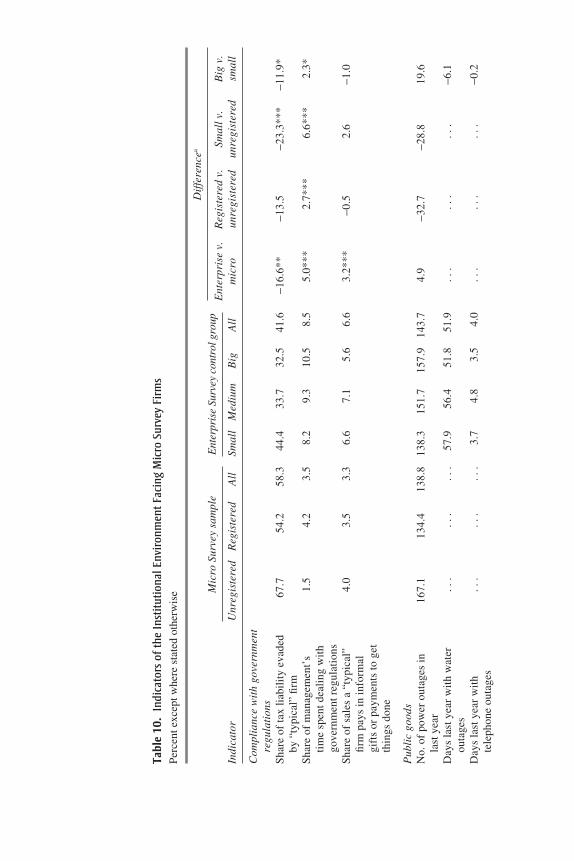
Tabl
e 10
.In
dica
tors
of t
he In
stitu
tiona
l Env
iron
men
t Fac
ing
Mic
ro S
urve
y Fi
rms
Perc
ent e
xcep
t whe
re s
tate
d ot
herw
ise M
icro
Sur
vey
sam
ple
Ent
erpr
ise
Surv
ey c
ontr
ol g
roup
Dif
fere
ncea
Ent
erpr
ise
v.
Reg
iste
red
v.
Smal
l v.
Big
v.
Indi
cato
rU
nreg
iste
red
Reg
iste
red
All
Smal
lM
ediu
mB
igA
llm
icro
unre
gist
ered
unre
gist
ered
smal
l
Com
plia
nce
wit
h go
vern
men
t re
gula
tion
sS
hare
of
tax
liab
ilit
y ev
aded
67
.754
.258
.344
.433
.732
.541
.6−1
6.6*
*−1
3.5
−23.
3***
−11.
9*by
“ty
pica
l” fi
rmS
hare
of
man
agem
ent’
s 1.
54.
23.
58.
29.
310
.58.
55.
0***
2.7*
**6.
6***
2.3*
tim
e sp
ent d
eali
ng w
ith
gove
rnm
ent r
egul
atio
nsS
hare
of
sale
s a
“typ
ical
”4.
03.
53.
36.
67.
15.
66.
63.
2***
−0.5
2.6
−1.0
firm
pay
s in
info
rmal
gi
fts
or p
aym
ents
to g
et
thin
gs d
one
Pub
lic
good
sN
o. o
f po
wer
out
ages
in
167.
113
4.4
138.
813
8.3
151.
715
7.9
143.
74.
9−3
2.7
−28.
819
.6la
st y
ear
Day
s la
st y
ear
wit
h w
ater
..
...
...
.57
.956
.451
.851
.9..
...
...
.−6
.1ou
tage
sD
ays
last
yea
r w
ith
...
...
...
3.7
4.8
3.5
4.0
...
...
...
−0.2
tele
phon
e ou
tage
s
11472-06_La Porta_rev2.qxd 3/6/09 1:13 PM Page 314
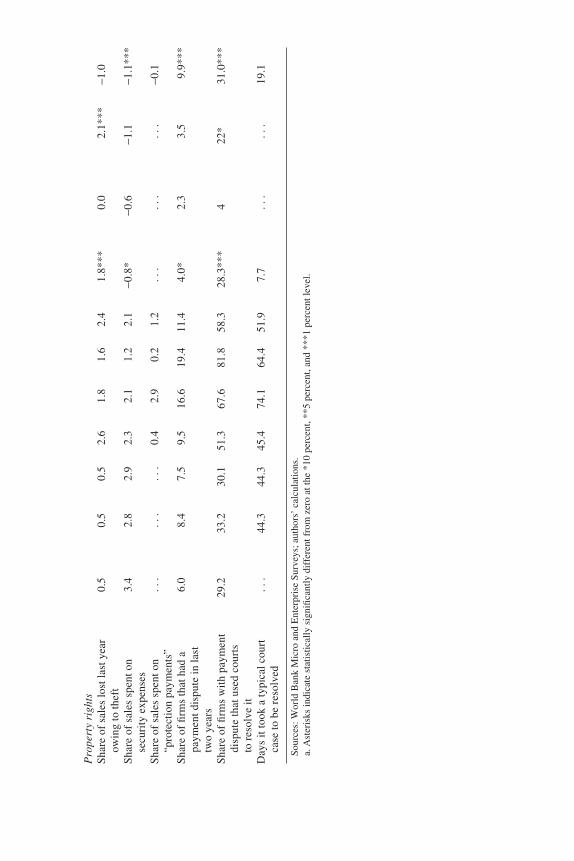
Pro
pert
y ri
ghts
Sha
re o
f sa
les
lost
last
yea
r 0.
50.
50.
52.
61.
81.
62.
41.
8***
0.0
2.1*
**−1
.0ow
ing
to th
eft
Sha
re o
f sa
les
spen
t on
3.4
2.8
2.9
2.3
2.1
1.2
2.1
−0.8
*−0
.6−1
.1−1
.1**
*se
curi
ty e
xpen
ses
Sha
re o
f sa
les
spen
t on
...
...
...
0.4
2.9
0.2
1.2
...
...
...
−0.1
“pro
tect
ion
paym
ents
”S
hare
of
firm
s th
at h
ad a
6.
08.
47.
59.
516
.619
.411
.44.
0*2.
33.
59.
9***
paym
ent d
ispu
te in
last
tw
o ye
ars
Sha
re o
f fi
rms
wit
h pa
ymen
t 29
.233
.230
.151
.367
.681
.858
.328
.3**
*4
22*
31.0
***
disp
ute
that
use
d co
urts
to
res
olve
itD
ays
it to
ok a
typi
cal c
ourt
..
.44
.344
.345
.474
.164
.451
.97.
7..
...
.19
.1ca
se to
be
reso
lved
Sour
ces:
Wor
ld B
ank
Mic
ro a
nd E
nter
pris
e Su
rvey
s; a
utho
rs’
calc
ulat
ions
.a.
Ast
eris
ks in
dica
te s
tatis
tical
ly s
igni
fican
tly d
iffe
rent
fro
m z
ero
at th
e *1
0 pe
rcen
t, **
5 pe
rcen
t, an
d **
*1 p
erce
nt le
vel.
11472-06_La Porta_rev2.qxd 3/6/09 1:13 PM Page 315
its control group are 1.5 and 10.5 percent, respectively. Finally, unregisteredfirms pay a smaller fraction of their sales in bribes than do firms in the con-trol group. Managers of unregistered firms in the Informal Survey estimatethat firms in their sectors pay 3.6 percent of their sales to “get things done.”In contrast, managers of registered firms in the Informal Survey report thatbribes equal 4.8 percent of sales, a percentage similar to that reported byfirms in the control group (4.6 percent). Similarly, managers of unregisteredfirms in the Micro Survey estimate that firms in their sector pay 4.0 percentof their sales to “get things done”; the comparable figures are 3.5 percentfor registered Micro Survey firms and 6.6 percent for firms in the controlgroup. In sum, lower taxes and less regulation confer a clear cost advantageon unregistered firms.
Second, the quality of public goods in our sample is very low. In theInformal Survey, unregistered firms report that they experienced poweroutages on 50 days of the previous year. Firms in the Enterprise Surveyfare only slightly better (48 days on average). On many days, firms experi-ence multiple power outages. For this reason the number of power outagesfor the Micro Survey is dramatically higher than the number of days with-out power in the Informal Survey: unregistered firms in the Micro surveyexperienced 167.1 power outages in the previous year. Once again, Enter-prise Survey firms do only marginally better (143.7 outages). In such anenvironment, only firms large enough to afford a generator can be produc-tive. Outages of water, phones, and transportation are less frequent thanpower outages but nevertheless very common by the standards of devel-oped countries. As a result, the performance of firms that are too small toprovide substitutes for these public goods (their own transportation equip-ment, for example) may be severely impaired.
Third, outright theft is very prevalent in our sample, but small firms donot make much use of police or the courts. Theft affects all small firms, notjust unregistered ones. Specifically, unregistered firms in the Informal Sur-vey report that, in a typical year, losses from theft amount to 2.9 percent ofannual sales. Registered firms in the same survey and small firms in theEnterprise Survey report even higher losses (3.5 percent and 3.8 percent,respectively). Somewhat surprisingly, losses as a result of theft appear to belower for Micro Survey firms (0.5 percent) than for small firms in the con-trol group (2.6 percent). To put these figures in context, note that EnterpriseSurvey respondents estimate losses as a result of theft equal to 0.54 percentof sales in Germany, 0.26 percent in Ireland, and 0.22 percent in Spain.
In response to theft, firms in our sample spend heavily on security andmake “protection” payments to gangsters. For example, security and pro-
316 Brookings Papers on Economic Activity, Fall 2008
11472-06_La Porta_rev2.qxd 3/6/09 1:13 PM Page 316
tection payments equal, respectively, 1.8 and 1.0 percent of the sales ofunregistered firms in the Informal Survey sample. Firms in their controlgroup spend a bit more on security and a bit less on protection, but theirtotal expenditure is similar (3 percent). The police do not appear to play acentral role in addressing theft. In fact, most theft is not even reported tothe police. Only 14.1 percent of incidents suffered by unregistered firmsin the Informal Survey were reported to the police. Registered firms in thesame survey reported 26.2 percent of incidents—still a low figure. Thispattern is consistent with the view that unregistered firms may have troubleprotecting their property rights. Alternatively, the absolute value of thelosses suffered by unregistered firms may be too low to justify filing apolice complaint. Firm size does play a role in reporting theft to the police.However, even big firms in the control group for the Informal Survey sam-ple report to the police only about half of theft incidents (54.0 percent).
Interestingly, small firms do not make much use of the courts to adju-dicate disputes either. Only 29.2 percent of unregistered and 33.2 percentof registered firms in the Micro Survey sample used the courts to resolvecommercial disputes during the previous year. In the control group, the useof the courts to solve commercial disputes rises quickly with firm size,from 51.3 percent for small firms to 81.8 percent for big firms. Surprisingly,the courts appear to work in a reasonably efficient manner. It takes roughly62 days to resolve a commercial dispute in the Informal Survey countriesand approximately 52 days in the Micro Survey countries. These figures arein line with the average length of court proceedings in Germany (35 days),Ireland (79 days), and Spain (91 days). The fact that unregistered firms andsmall firms in the control group behave similarly in solving commercialdisputes suggests that inadequate access to courts is unlikely to explaindifferences in productivity between the two groups of firms. The sameargument applies to lack of police protection.
The tentative picture that emerges from this section is inconsistentwith the romantic view. Unregistered firms have been around for a longtime (7 to 10 years on average), but their sales are still trivially small.Moreover, few registered firms started out unregistered. The small size ofunregistered firms is symptomatic of uneducated management and low-quality assets. When public goods are unreliable, unregistered firms aretoo small to afford substitutes such as generators, computers, or trans-portation equipment. They do not have large firms as clients. They do notexport. Despite de Soto’s emphasis on access to credit as the key to ignit-ing the growth of unregistered firms, lack of external finance appears to bean attribute of all small firms in poor countries, not just of unregistered
RAFAEL LA PORTA and ANDREI SHLEIFER 317
11472-06_La Porta_rev2.qxd 3/6/09 1:13 PM Page 317
firms. In sum, the limitations of unregistered firms appear to be far moresevere than acknowledged by proponents of the romantic view.
Productivity of Unregistered Firms
In this section we examine the productivity of unregistered firms and pre-sent the key findings of the paper. In measuring the productivity of thesefirms, we face severe data limitations. In particular, we lack information onhow much capital these firms have. The Informal and Micro questionnairesdo not collect such information, since unregistered entrepreneurs typicallylack detailed records to estimate the value of their assets. We thus have tomeasure productivity without capital.
To this end we use two crude measures of productivity: sales peremployee and (gross) value added per employee, the latter defined as salesnet of expenditure on raw materials and energy.37 Thus, we define valueadded per employee for firm i in industry s as
where PsiYsi is the level of sales, PmMsi is expenditure on raw materials,PEEsi is expenditure on energy, and Lsi is the number of employees (includ-ing both full- and part-time but not seasonal workers). To the extent thatseasonal employment is more prevalent in unregistered firms than in theformal sector, we overstate the productivity of unregistered firms. We useexpenditure on production inputs (such as energy) as a crude proxy forcapital invested.
This approach to productivity measurement has recently received con-siderable criticism, since the sales measure obviously combines physicaloutput and prices. But in a competitive equilibrium, prices may varyinversely with efficiency exactly to eliminate any variation in productivityas measured by sales (or value added) per employee. The recognition ofthis problem in the absence of firm-specific price indices is credited toTor Jakob Klette and Zvi Griliches;38 several more recent studies seek toaddress the problem.39 We follow the approach of Chang-Tai Hsieh and
VAP Y P M P E
Lsi
si si m si E si
si
=− −
,
318 Brookings Papers on Economic Activity, Fall 2008
37. Data on wages are unavailable for most countries in the Informal sample. For thisreason we are unable to remove labor costs from our measure of value added.
38. Klette and Griliches (1996).39. These include Bernard and others (2003); Katayama, Lu, and Tybout (2006); Foster,
Haltiwanger, and Syverson (2008); Hsieh and Klenow (2007).
11472-06_La Porta_rev2.qxd 3/6/09 1:13 PM Page 318
Peter Klenow,40 which assumes that all firms in an industry use the sameCobb-Douglas production technology and that industry output is a constant-elasticity-of-substitution (CES) aggregate of the outputs of all the firms.They then show that, in a competitive equilibrium, physical productivity Asi
(or real output per employee) can be estimated from nominal sales usingthe following formula:
where κs is an unobserved constant and σ is the elasticity of substitution ofoutput. Although we do not observe κs, relative productivities are unaffectedby setting κs equal to 1 for each industry s. Intuitively, goods sold by veryproductive firms must command lower prices to induce buyers to demandthe higher output. Raising sales to the power σ/(σ − 1) yields Ysi, makingit possible to infer real output from nominal revenue. Since registeredfirms tend to have higher sales, productivity differences between registeredand unregistered firms are increasing in σ. Empirically, estimates of σrange from 3 to 10. We follow Hsieh and Klenow and conservatively setσ equal to 3.41
Before turning to the results, we note the empirical finding of Lucia Fosterand coauthors that the correlation between the sales-based and the correctedmeasures of productivity is incredibly high, well over 0.9.42 Thus, althoughthe theoretical objection to the traditional measures is compelling, itsempirical significance appears minor. Indeed, Foster and coauthors havedata on both prices and sales. The correlation that they report betweennominal and real output is based on actual data rather than on a model.
Measurement Error
Even aside from the theoretical concerns, we need to deal with the factthat our sales numbers come from unofficial firms, raising concerns aboutmeasurement error. There is good reason to worry that our productivitymeasures may be biased, since unregistered entrepreneurs may choose tohide output not only from the government but also from the World Bankcontractors. For example, Suresh de Mel, David McKenzie, and Christo-pher Woodruff find that microenterprises underreport profits by 30 percent
AP Y
Lsi s
si si
si
=( ) −
κ
σσ 1
,
RAFAEL LA PORTA and ANDREI SHLEIFER 319
40. Hsieh and Klenow (2007).41. Hsieh and Klenow (2007).42. Foster and others (2008).
11472-06_La Porta_rev2.qxd 3/6/09 1:13 PM Page 319
to researchers, although they attribute this more to lack of recall than tointentional understatement.43
We offer two pieces of evidence that support the view that such biasesare unlikely to drive our main results. First, table 11 shows the availableinformation regarding expenditure on various production inputs (scaledby sales). If unregistered entrepreneurs lied only about sales, inputs as afraction of sales would be higher for unregistered firms than for other firms.In fact, expenditure on raw materials by small firms in the control group is12.7 percentage points higher than for unregistered firms in the Informalsample, and 2.7 percentage points higher than for unregistered firms in theMicro sample. Moreover, expenditure on energy by unregistered firms iscomparable to that by firms in the control group. Other variables show amixed pattern. In particular, expenditure on labor by small firms in thecontrol group is 8.1 percentage points higher than that by unregisteredfirms in the Informal sample, but 1.7 percentage points lower than that byunregistered firms in the Micro sample. Similarly, expenditure on machinesby small firms in the control group is 14.8 percentage points higher than thatby unregistered firms in the Micro sample, but equal to that by unregisteredfirms in the Informal sample. Finally, there is weak evidence that unregis-tered firms in the Informal Survey spend more on rent than do small firmsin the control group. In sum, there is no evidence that unregistered firmsconsistently spend a larger fraction of their sales on inputs than do smallfirms in the control group, as would be the case if unregistered entrepre-neurs lied only about their sales.
Second, table 12 shows the available data on wages per employee. Underthe dual hypothesis, unregistered firms should pay low wages.44 Theselow wages may be consistent with some on-the-job home production byworkers in unregistered firms. Alternatively, workers in these firms maybe less skilled than those in registered firms. Either way, the dual view pre-dicts that the measured output of unregistered firms should be low relativeto that of workers in the control group. In contrast, wages in the formal andinformal sectors should be comparable if observed differences in produc-tivity are due only to measurement error. The top panel of table 12 showswages per employee in Cape Verde, the only country in the Informal sam-ple with wage data. The bottom panel shows wages per employee for thecountries covered by the Micro sample. Wages in both panels are scaled byincome per capita.
320 Brookings Papers on Economic Activity, Fall 2008
43. De Mel, McKenzie, and Woodruff (2007).44. Harris and Todaro (1970).
11472-06_La Porta_rev2.qxd 3/6/09 1:13 PM Page 320
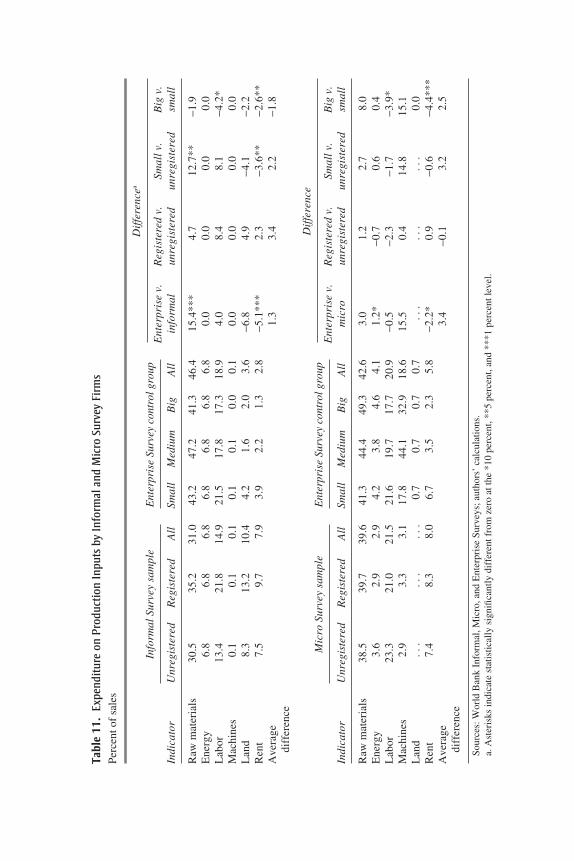
Tabl
e 11
.Ex
pend
iture
on
Prod
uctio
n In
puts
by
Info
rmal
and
Mic
ro S
urve
y Fi
rms
Perc
ent o
f sa
les
Info
rmal
Sur
vey
sam
ple
Ent
erpr
ise
Surv
ey c
ontr
ol g
roup
Dif
fere
ncea
Ent
erpr
ise
v.
Reg
iste
red
v.
Smal
l v.
Big
v.
Indi
cato
rU
nreg
iste
red
Reg
iste
red
All
Smal
lM
ediu
mB
igA
llin
form
alun
regi
ster
edun
regi
ster
edsm
all
Raw
mat
eria
ls30
.535
.231
.043
.247
.241
.346
.415
.4**
*4.
712
.7**
−1.9
Ene
rgy
6.8
6.8
6.8
6.8
6.8
6.8
6.8
0.0
0.0
0.0
0.0
Lab
or13
.421
.814
.921
.517
.817
.318
.94.
08.
48.
1−4
.2*
Mac
hine
s0.
10.
10.
10.
10.
10.
00.
10.
00.
00.
00.
0L
and
8.3
13.2
10.4
4.2
1.6
2.0
3.6
−6.8
4.9
−4.1
−2.2
Ren
t7.
59.
77.
93.
92.
21.
32.
8−5
.1**
*2.
3−3
.6**
−2.6
**A
vera
ge
1.3
3.4
2.2
−1.8
diff
eren
ce
Mic
ro S
urve
y sa
mpl
eE
nter
pris
e Su
rvey
con
trol
gro
upD
iffe
renc
e
Ent
erpr
ise
v.
Reg
iste
red
v.
Smal
l v.
Big
v.
Indi
cato
rU
nreg
iste
red
Reg
iste
red
All
Smal
lM
ediu
mB
igA
llm
icro
unre
gist
ered
unre
gist
ered
smal
l
Raw
mat
eria
ls38
.539
.739
.641
.344
.449
.342
.63.
01.
22.
78.
0E
nerg
y3.
62.
92.
94.
23.
84.
64.
11.
2*−0
.70.
60.
4L
abor
23.3
21.0
21.5
21.6
19.7
17.7
20.9
−0.5
−2.3
−1.7
−3.9
*M
achi
nes
2.9
3.3
3.1
17.8
44.1
32.9
18.6
15.5
0.4
14.8
15.1
Lan
d..
...
...
.0.
70.
70.
70.
7..
...
...
.0.
0R
ent
7.4
8.3
8.0
6.7
3.5
2.3
5.8
−2.2
*0.
9−0
.6−4
.4**
*A
vera
ge
3.4
−0.1
3.2
2.5
diff
eren
ce
Sour
ces:
Wor
ld B
ank
Info
rmal
, Mic
ro, a
nd E
nter
pris
e Su
rvey
s; a
utho
rs’
calc
ulat
ions
.a.
Ast
eris
ks in
dica
te s
tatis
tical
ly s
igni
fican
tly d
iffe
rent
fro
m z
ero
at th
e *1
0 pe
rcen
t, **
5 pe
rcen
t, an
d **
*1 p
erce
nt le
vel.
11472-06_La Porta_rev2.qxd 3/6/09 1:13 PM Page 321
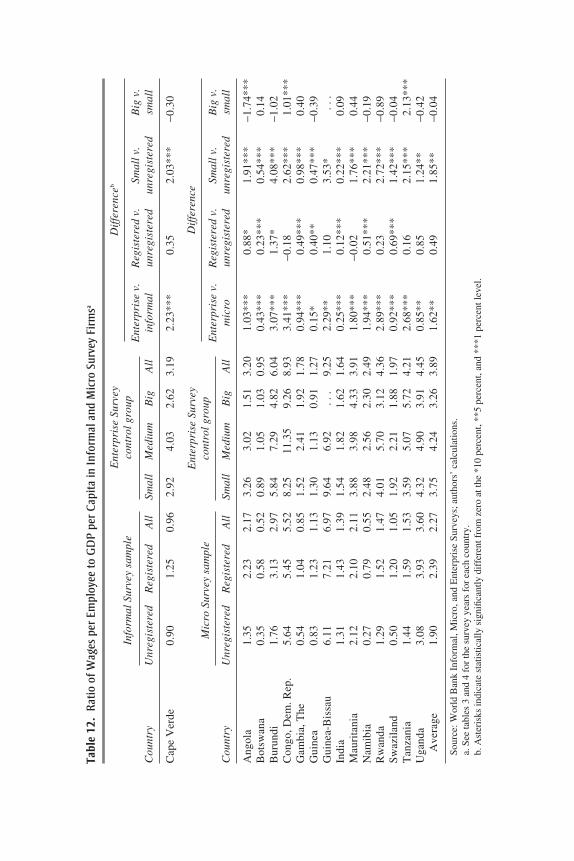
Ent
erpr
ise
Surv
ey
Info
rmal
Sur
vey
sam
ple
cont
rol g
roup
Dif
fere
nceb
Ent
erpr
ise
v.
Reg
iste
red
v.
Smal
l v.
Big
v.
Cou
ntry
Unr
egis
tere
dR
egis
tere
dA
llSm
all
Med
ium
Big
All
info
rmal
unre
gist
ered
unre
gist
ered
smal
l
Cap
e V
erde
0.90
1.25
0.96
2.92
4.03
2.62
3.19
2.23
***
0.35
2.03
***
−0.3
0
Mic
ro S
urve
y sa
mpl
eD
iffe
renc
e
Ent
erpr
ise
v.
Reg
iste
red
v.
Smal
l v.
Big
v.
Cou
ntry
Unr
egis
tere
dR
egis
tere
dA
llSm
all
Med
ium
Big
All
mic
roun
regi
ster
edun
regi
ster
edsm
all
Ang
ola
1.35
2.23
2.17
3.26
3.02
1.51
3.20
1.03
***
0.88
*1.
91**
*−1
.74*
**B
otsw
ana
0.35
0.58
0.52
0.89
1.05
1.03
0.95
0.43
***
0.23
***
0.54
***
0.14
Bur
undi
1.76
3.13
2.97
5.84
7.29
4.82
6.04
3.07
***
1.37
*4.
08**
*−1
.02
Con
go, D
em. R
ep.
5.64
5.45
5.52
8.25
11.3
59.
268.
933.
41**
*−0
.18
2.62
***
1.01
***
Gam
bia,
The
0.54
1.04
0.85
1.52
2.41
1.92
1.78
0.94
***
0.49
***
0.98
***
0.40
Gui
nea
0.83
1.23
1.13
1.30
1.13
0.91
1.27
0.15
*0.
40**
0.47
***
−0.3
9G
uine
a-B
issa
u6.
117.
216.
979.
646.
92..
.9.
252.
29**
1.10
3.53
*..
.In
dia
1.31
1.43
1.39
1.54
1.82
1.62
1.64
0.25
***
0.12
***
0.22
***
0.09
Mau
rita
nia
2.12
2.10
2.11
3.88
3.98
4.33
3.91
1.80
***
−0.0
21.
76**
*0.
44N
amib
ia0.
270.
790.
552.
482.
562.
302.
491.
94**
*0.
51**
*2.
21**
*−0
.19
Rw
anda
1.29
1.52
1.47
4.01
5.70
3.12
4.36
2.89
***
0.23
2.72
***
−0.8
9S
waz
ilan
d0.
501.
201.
051.
922.
211.
881.
970.
92**
*0.
69**
*1.
42**
*−0
.04
Tan
zani
a1.
441.
591.
533.
595.
075.
724.
212.
68**
*0.
162.
15**
*2.
13**
*U
gand
a3.
083.
933.
604.
324.
903.
914.
450.
85**
0.85
1.24
**−0
.42
Ave
rage
1.90
2.39
2.27
3.75
4.24
3.26
3.89
1.62
**0.
491.
85**
−0.0
4
Sour
ce: W
orld
Ban
k In
form
al, M
icro
, and
Ent
erpr
ise
Surv
eys;
aut
hors
’ ca
lcul
atio
ns.
a. S
ee ta
bles
3 a
nd 4
for
the
surv
ey y
ears
for
eac
h co
untr
y.b.
Ast
eris
ks in
dica
te s
tatis
tical
ly s
igni
fican
tly d
iffe
rent
fro
m z
ero
at th
e *1
0 pe
rcen
t, **
5 pe
rcen
t, an
d **
*1 p
erce
nt le
vel.
Tabl
e 12
.R
atio
of W
ages
per
Em
ploy
ee to
GD
P pe
r Ca
pita
in In
form
al a
nd M
icro
Sur
vey
Firm
sa
Ent
erpr
ise
Surv
eyco
ntro
l gro
up
11472-06_La Porta_rev2.qxd 3/6/09 1:13 PM Page 322
Three facts stand out. First, there is no clear correlation between firmsize and wages within the control group. Big firms pay higher wages thando small firms in Congo and Tanzania. The reverse is true in Angola. Onaverage, wages in big and small firms are essentially indistinguishable fromeach other. Second, unregistered firms consistently pay lower wages thando small firms in the control group. Cape Verde illustrates this point. Wagesin unregistered firms there are 10 percent lower than income per capita. Incontrast, wages in the control group of small firms are 2.92 times incomeper capita. On average, in the Micro sample, wages are 1.90 times incomeper capita in unregistered firms and 3.75 times income per capita in smallfirms in the control group. Third, although there is considerable hetero-geneity across countries, the workers of unregistered firms are not thepoorest among the poor. In India, for example, wages for the employees ofunregistered firms exceed GDP per capita by 31 percent. Similarly, in theMicro sample, the average wage of unregistered workers is roughly twiceGDP per capita. Taken at face value, the large wedge in wages betweenunregistered firms and the control group is strongly consistent with the dualview of unregistered firms. Of course, we cannot rule out the alternativeinterpretation that respondents shrewdly lie to the World Bank about sales,inputs, and wages. However, the findings on inputs and wages should allaysome of the concerns regarding data quality.
As a final point, it seems to us that concerns about intentional understate-ment of revenues should not be exaggerated for our data. Firms participatingin the surveys do so voluntarily. Virtually all of them answer questions aboutsales, even though they do not have to. They also give answers suggestingmassive underpayment of taxes and bribe payments by “firms like theirs.”This is not the behavior one would expect of those fearful that World Bankcontractors will turn them in (or that the authorities would do anything aboutit if they did). Our view is that most informal firms operate in the open, thatthey have done so for years, that they pay the police and other authorities toleave them alone, and that fear of reprisals for truly reporting revenues to theWorld Bank is very far from most of their minds. This particular concern isa rich-country fear rather than a poor-country reality.
Productivity of Unregistered Firms
Tables 13 and 14 present the main findings of the paper. Table 13 showsestimates of log value added (top panel), log sales per employee (middlepanel), and log real output per employee (bottom panel) for the Informalsample and its Enterprise Survey control group. Table 14 shows analogousdata for the Micro sample. Three key facts stand out. First, registered
RAFAEL LA PORTA and ANDREI SHLEIFER 323
11472-06_La Porta_rev2.qxd 3/6/09 1:13 PM Page 323
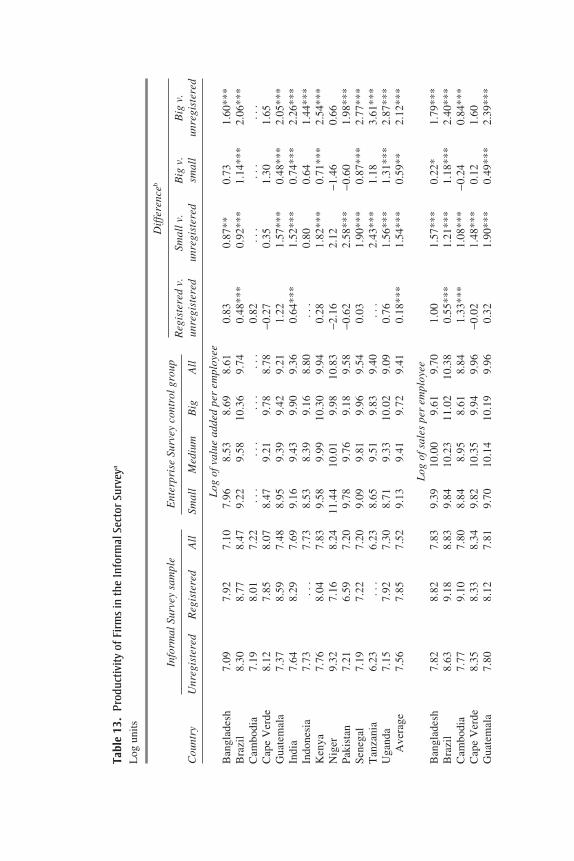
Tabl
e 13
.Pr
oduc
tivity
of F
irm
s in
the
Info
rmal
Sec
tor
Surv
eya
Log
uni
ts
Info
rmal
Sur
vey
sam
ple
Ent
erpr
ise
Surv
ey c
ontr
ol g
roup
Dif
fere
nceb
Reg
iste
red
v.
Smal
l v.
Big
v.
Big
v.
Cou
ntry
Unr
egis
tere
dR
egis
tere
dA
llSm
all
Med
ium
Big
All
unre
gist
ered
unre
gist
ered
smal
lun
regi
ster
ed
Log
of v
alue
add
ed p
er e
mpl
oyee
Ban
glad
esh
7.09
7.92
7.10
7.96
8.53
8.69
8.61
0.83
0.87
**0.
731.
60**
*B
razi
l8.
308.
778.
479.
229.
5810
.36
9.74
0.48
***
0.92
***
1.14
***
2.06
***
Cam
bodi
a7.
198.
017.
22..
...
...
...
.0.
82..
...
...
.C
ape
Ver
de8.
127.
858.
078.
479.
219.
788.
78−0
.27
0.35
1.30
1.65
Gua
tem
ala
7.37
8.59
7.48
8.95
9.39
9.42
9.21
1.22
1.57
***
0.48
***
2.05
***
Indi
a7.
648.
297.
699.
169.
439.
909.
360.
64**
*1.
52**
*0.
74**
*2.
26**
*In
done
sia
7.73
...
7.73
8.53
8.39
9.16
8.80
...
0.80
0.64
1.44
***
Ken
ya7.
768.
047.
839.
589.
9910
.30
9.94
0.28
1.82
***
0.71
***
2.54
***
Nig
er9.
327.
168.
2411
.44
10.0
19.
9810
.83
−2.1
62.
12−1
.46
0.66
Pak
ista
n7.
216.
597.
209.
789.
769.
189.
58−0
.62
2.58
***
−0.6
01.
98**
*S
eneg
al7.
197.
227.
209.
099.
819.
969.
540.
031.
90**
*0.
87**
*2.
77**
*T
anza
nia
6.23
...
6.23
8.65
9.51
9.83
9.40
...
2.43
***
1.18
3.61
***
Uga
nda
7.15
7.92
7.30
8.71
9.33
10.0
29.
090.
761.
56**
*1.
31**
*2.
87**
*A
vera
ge7.
567.
857.
529.
139.
419.
729.
410.
18**
*1.
54**
*0.
59**
2.12
***
Log
of s
ales
per
em
ploy
eeB
angl
ades
h7.
828.
827.
839.
3910
.00
9.61
9.70
1.00
1.57
***
0.22
*1.
79**
*B
razi
l8.
639.
188.
839.
8410
.23
11.0
210
.38
0.55
***
1.21
***
1.18
***
2.40
***
Cam
bodi
a7.
779.
107.
808.
848.
958.
618.
841.
33**
*1.
08**
*−0
.24
0.84
***
Cap
e V
erde
8.35
8.33
8.34
9.82
10.3
59.
949.
96−0
.02
1.48
***
0.12
1.60
Gua
tem
ala
7.80
8.12
7.81
9.70
10.1
410
.19
9.96
0.32
1.90
***
0.49
***
2.39
***
11472-06_La Porta_rev2.qxd 3/6/09 1:13 PM Page 324
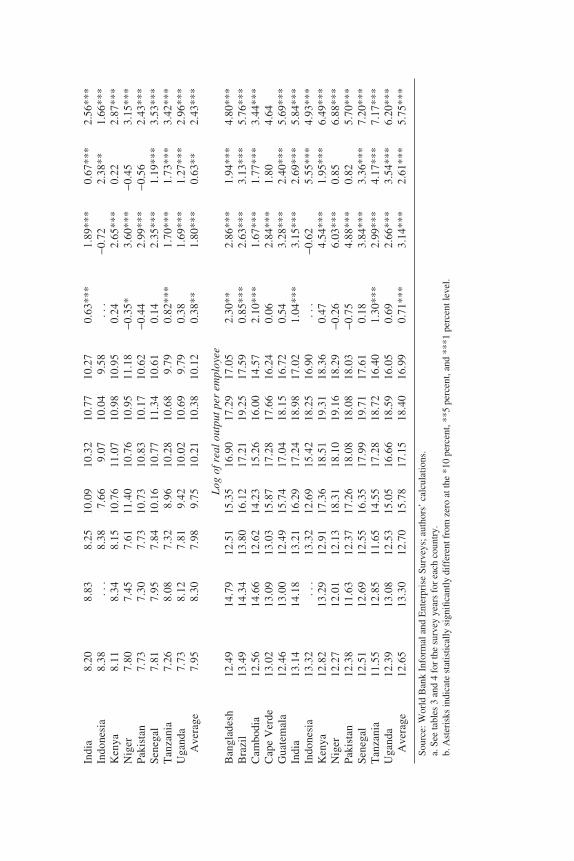
Indi
a8.
208.
838.
2510
.09
10.3
210
.77
10.2
70.
63**
*1.
89**
*0.
67**
*2.
56**
*In
done
sia
8.38
...
8.38
7.66
9.07
10.0
49.
58..
.−0
.72
2.38
**1.
66**
*K
enya
8.11
8.34
8.15
10.7
611
.07
10.9
810
.95
0.24
2.65
***
0.22
2.87
***
Nig
er7.
807.
457.
6111
.40
10.7
610
.95
11.1
8−0
.35*
3.60
***
−0.4
53.
15**
*P
akis
tan
7.73
7.30
7.73
10.7
310
.83
10.1
710
.62
−0.4
42.
99**
*−0
.56
2.43
***
Sen
egal
7.81
7.95
7.84
10.1
610
.77
11.3
410
.61
0.14
2.35
***
1.19
***
3.53
***
Tan
zani
a7.
268.
087.
328.
9610
.28
10.6
89.
790.
82**
*1.
70**
*1.
73**
*3.
42**
*U
gand
a7.
738.
127.
819.
4210
.02
10.6
99.
790.
381.
69**
*1.
27**
*2.
96**
*A
vera
ge7.
958.
307.
989.
7510
.21
10.3
810
.12
0.38
**1.
80**
*0.
63**
2.43
***
Log
of r
eal o
utpu
t per
em
ploy
eeB
angl
ades
h12
.49
14.7
912
.51
15.3
516
.90
17.2
917
.05
2.30
**2.
86**
*1.
94**
*4.
80**
*B
razi
l13
.49
14.3
413
.80
16.1
217
.21
19.2
517
.59
0.85
***
2.63
***
3.13
***
5.76
***
Cam
bodi
a12
.56
14.6
612
.62
14.2
315
.26
16.0
014
.57
2.10
***
1.67
***
1.77
***
3.44
***
Cap
e V
erde
13.0
213
.09
13.0
315
.87
17.2
817
.66
16.2
40.
062.
84**
*1.
804.
64G
uate
mal
a12
.46
13.0
012
.49
15.7
417
.04
18.1
516
.72
0.54
3.28
***
2.40
***
5.69
***
Indi
a13
.14
14.1
813
.21
16.2
917
.24
18.9
817
.02
1.04
***
3.15
***
2.69
***
5.84
***
Indo
nesi
a13
.32
...
13.3
212
.69
15.4
218
.25
16.9
0..
.−0
.62
5.55
***
4.93
***
Ken
ya12
.82
13.2
912
.91
17.3
618
.51
19.3
118
.36
0.47
4.54
***
1.95
***
6.49
***
Nig
er12
.27
12.0
112
.13
18.3
118
.10
19.1
618
.29
−0.2
66.
03**
*0.
856.
88**
*P
akis
tan
12.3
811
.63
12.3
717
.26
18.0
818
.08
18.0
3−0
.75
4.88
***
0.82
5.70
***
Sen
egal
12.5
112
.69
12.5
516
.35
17.9
919
.71
17.6
10.
183.
84**
*3.
36**
*7.
20**
*T
anza
nia
11.5
512
.85
11.6
514
.55
17.2
818
.72
16.4
01.
30**
*2.
99**
*4.
17**
*7.
17**
*U
gand
a12
.39
13.0
812
.53
15.0
516
.66
18.5
916
.05
0.69
2.66
***
3.54
***
6.20
***
Ave
rage
12.6
513
.30
12.7
015
.78
17.1
518
.40
16.9
90.
71**
*3.
14**
*2.
61**
*5.
75**
*
Sour
ce: W
orld
Ban
k In
form
al a
nd E
nter
pris
e Su
rvey
s; a
utho
rs’
calc
ulat
ions
.a.
See
tabl
es 3
and
4 f
or th
e su
rvey
yea
rs f
or e
ach
coun
try.
b. A
ster
isks
indi
cate
sta
tistic
ally
sig
nific
antly
dif
fere
nt f
rom
zer
o at
the
*10
perc
ent,
**5
perc
ent,
and
***1
per
cent
leve
l.
11472-06_La Porta_rev2.qxd 3/6/09 1:13 PM Page 325
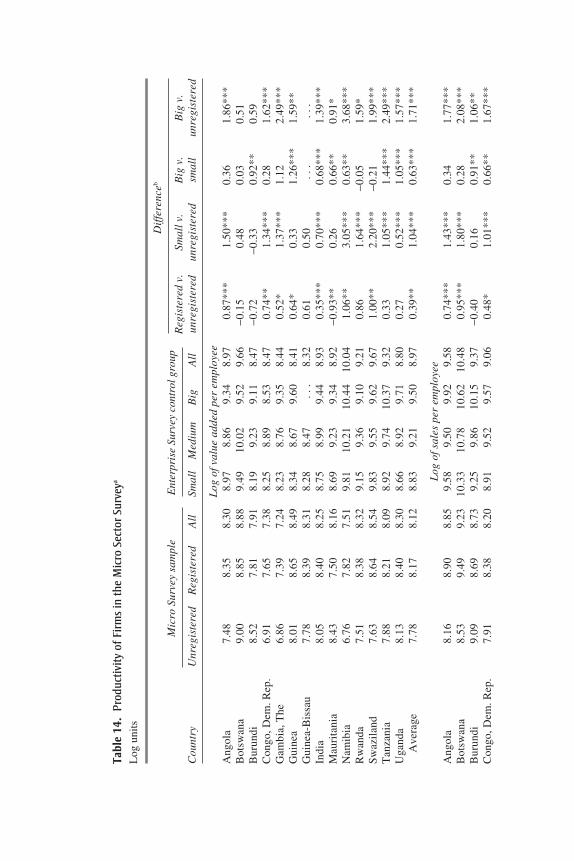
Tabl
e 14
.Pr
oduc
tivity
of F
irm
s in
the
Mic
ro S
ecto
r Su
rvey
a
Log
uni
ts
Mic
ro S
urve
y sa
mpl
eE
nter
pris
e Su
rvey
con
trol
gro
upD
iffe
renc
eb
Reg
iste
red
v.
Smal
l v.
Big
v.
Big
v.
Cou
ntry
Unr
egis
tere
dR
egis
tere
dA
llSm
all
Med
ium
Big
All
unre
gist
ered
unre
gist
ered
smal
lun
regi
ster
ed
Log
of v
alue
add
ed p
er e
mpl
oyee
Ang
ola
7.48
8.35
8.30
8.97
8.86
9.34
8.97
0.87
***
1.50
***
0.36
1.86
***
Bot
swan
a9.
008.
858.
889.
4910
.02
9.52
9.66
−0.1
50.
480.
030.
51B
urun
di8.
527.
817.
918.
199.
239.
118.
47−0
.72
−0.3
30.
92**
0.59
Con
go, D
em. R
ep.
6.91
7.65
7.38
8.25
8.89
8.53
8.47
0.74
**1.
34**
*0.
281.
62**
*G
ambi
a, T
he6.
867.
397.
248.
238.
769.
358.
440.
52*
1.37
***
1.12
2.49
***
Gui
nea
8.01
8.65
8.49
8.34
8.67
9.60
8.41
0.64
*0.
331.
26**
*1.
59**
Gui
nea-
Bis
sau
7.78
8.39
8.31
8.28
8.47
...
8.32
0.61
0.50
...
...
Indi
a8.
058.
408.
258.
758.
999.
448.
930.
35**
*0.
70**
*0.
68**
*1.
39**
*M
auri
tani
a8.
437.
508.
168.
699.
239.
348.
92−0
.93*
*0.
260.
66**
0.91
*N
amib
ia6.
767.
827.
519.
8110
.21
10.4
410
.04
1.06
**3.
05**
*0.
63**
3.68
***
Rw
anda
7.51
8.38
8.32
9.15
9.36
9.10
9.21
0.86
1.64
***
−0.0
51.
59*
Sw
azil
and
7.63
8.64
8.54
9.83
9.55
9.62
9.67
1.00
**2.
20**
*−0
.21
1.99
***
Tan
zani
a7.
888.
218.
098.
929.
7410
.37
9.32
0.33
1.05
***
1.44
***
2.49
***
Uga
nda
8.13
8.40
8.30
8.66
8.92
9.71
8.80
0.27
0.52
***
1.05
***
1.57
***
Ave
rage
7.78
8.17
8.12
8.83
9.21
9.50
8.97
0.39
**1.
04**
*0.
63**
*1.
71**
*
Log
of s
ales
per
em
ploy
eeA
ngol
a8.
168.
908.
859.
589.
509.
929.
580.
74**
*1.
43**
*0.
341.
77**
*B
otsw
ana
8.53
9.49
9.23
10.3
310
.78
10.6
210
.48
0.95
***
1.80
***
0.28
2.08
***
Bur
undi
9.09
8.69
8.73
9.25
9.86
10.1
59.
37−0
.40
0.16
0.91
**1.
06**
Con
go, D
em. R
ep.
7.91
8.38
8.20
8.91
9.52
9.57
9.06
0.48
*1.
01**
*0.
66**
1.67
***
11472-06_La Porta_rev2.qxd 3/6/09 1:13 PM Page 326
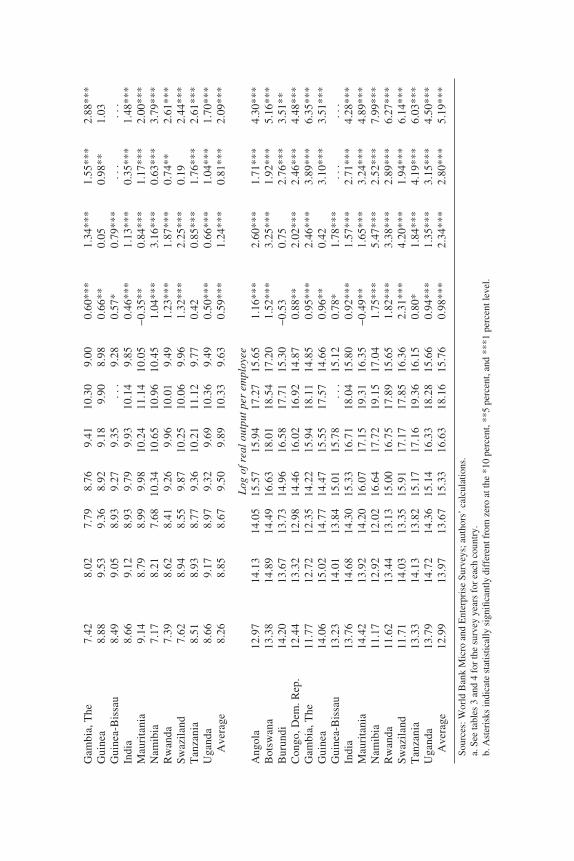
Gam
bia,
The
7.42
8.02
7.79
8.76
9.41
10.3
09.
000.
60**
*1.
34**
*1.
55**
*2.
88**
*G
uine
a8.
889.
539.
368.
929.
189.
908.
980.
66**
0.05
0.98
**1.
03G
uine
a-B
issa
u8.
499.
058.
939.
279.
35..
.9.
280.
57*
0.79
***
...
...
Indi
a8.
669.
128.
939.
799.
9310
.14
9.85
0.46
***
1.13
***
0.35
***
1.48
***
Mau
rita
nia
9.14
8.79
8.99
9.98
10.2
411
.14
10.0
5−0
.35*
*0.
84**
*1.
17**
*2.
00**
*N
amib
ia7.
178.
217.
6810
.34
10.6
510
.96
10.4
51.
04**
*3.
16**
*0.
63**
*3.
79**
*R
wan
da7.
398.
628.
419.
269.
9610
.01
9.49
1.23
***
1.87
***
0.74
**2.
61**
*S
waz
ilan
d7.
628.
948.
559.
8710
.25
10.0
69.
961.
32**
*2.
25**
*0.
192.
44**
*T
anza
nia
8.51
8.93
8.77
9.36
10.2
111
.12
9.77
0.42
0.85
***
1.76
***
2.61
***
Uga
nda
8.66
9.17
8.97
9.32
9.69
10.3
69.
490.
50**
*0.
66**
*1.
04**
*1.
70**
*A
vera
ge8.
268.
858.
679.
509.
8910
.33
9.63
0.59
***
1.24
***
0.81
***
2.09
***
Log
of r
eal o
utpu
t per
em
ploy
eeA
ngol
a12
.97
14.1
314
.05
15.5
715
.94
17.2
715
.65
1.16
***
2.60
***
1.71
***
4.30
***
Bot
swan
a13
.38
14.8
914
.49
16.6
318
.01
18.5
417
.20
1.52
***
3.25
***
1.92
***
5.16
***
Bur
undi
14.2
013
.67
13.7
314
.96
16.5
817
.71
15.3
0−0
.53
0.75
2.76
***
3.51
**C
ongo
, Dem
. Rep
.12
.44
13.3
212
.98
14.4
616
.02
16.9
214
.87
0.88
**2.
02**
*2.
46**
*4.
48**
*G
ambi
a, T
he11
.77
12.7
212
.35
14.2
215
.94
18.1
114
.85
0.95
***
2.46
***
3.89
***
6.35
***
Gui
nea
14.0
615
.02
14.7
714
.47
15.5
517
.57
14.6
60.
96**
0.42
3.10
***
3.51
***
Gui
nea-
Bis
sau
13.2
314
.01
13.8
415
.01
15.7
8..
.15
.12
0.78
*1.
78**
*..
...
.In
dia
13.7
614
.68
14.3
015
.33
16.7
118
.04
15.8
00.
92**
*1.
57**
*2.
71**
*4.
28**
*M
auri
tani
a14
.42
13.9
214
.20
16.0
717
.15
19.3
116
.35
−0.4
9**
1.65
***
3.24
***
4.89
***
Nam
ibia
11.1
712
.92
12.0
216
.64
17.7
219
.15
17.0
41.
75**
*5.
47**
*2.
52**
*7.
99**
*R
wan
da11
.62
13.4
413
.13
15.0
016
.75
17.8
915
.65
1.82
***
3.38
***
2.89
***
6.27
***
Sw
azil
and
11.7
114
.03
13.3
515
.91
17.1
717
.85
16.3
62.
31**
*4.
20**
*1.
94**
*6.
14**
*T
anza
nia
13.3
314
.13
13.8
215
.17
17.1
619
.36
16.1
50.
80*
1.84
***
4.19
***
6.03
***
Uga
nda
13.7
914
.72
14.3
615
.14
16.3
318
.28
15.6
60.
94**
*1.
35**
*3.
15**
*4.
50**
*A
vera
ge12
.99
13.9
713
.67
15.3
316
.63
18.1
615
.76
0.98
***
2.34
***
2.80
***
5.19
***
Sour
ces:
Wor
ld B
ank
Mic
ro a
nd E
nter
pris
e Su
rvey
s; a
utho
rs’
calc
ulat
ions
.a.
See
tabl
es 3
and
4 f
or th
e su
rvey
yea
rs f
or e
ach
coun
try.
b. A
ster
isks
indi
cate
sta
tistic
ally
sig
nific
antly
dif
fere
nt f
rom
zer
o at
the
*10
perc
ent,
**5
perc
ent,
and
***1
per
cent
leve
l.
11472-06_La Porta_rev2.qxd 3/6/09 1:13 PM Page 327
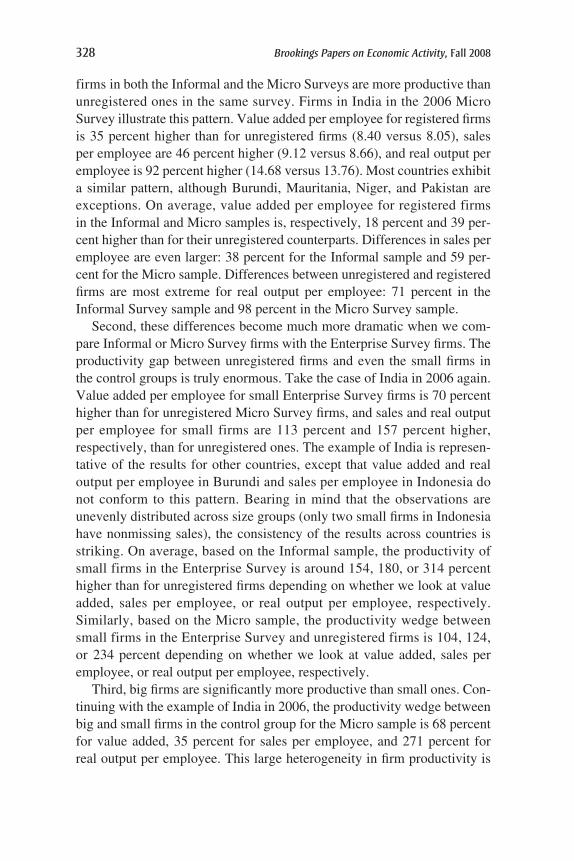
firms in both the Informal and the Micro Surveys are more productive thanunregistered ones in the same survey. Firms in India in the 2006 MicroSurvey illustrate this pattern. Value added per employee for registered firmsis 35 percent higher than for unregistered firms (8.40 versus 8.05), salesper employee are 46 percent higher (9.12 versus 8.66), and real output peremployee is 92 percent higher (14.68 versus 13.76). Most countries exhibita similar pattern, although Burundi, Mauritania, Niger, and Pakistan areexceptions. On average, value added per employee for registered firmsin the Informal and Micro samples is, respectively, 18 percent and 39 per-cent higher than for their unregistered counterparts. Differences in sales peremployee are even larger: 38 percent for the Informal sample and 59 per-cent for the Micro sample. Differences between unregistered and registeredfirms are most extreme for real output per employee: 71 percent in theInformal Survey sample and 98 percent in the Micro Survey sample.
Second, these differences become much more dramatic when we com-pare Informal or Micro Survey firms with the Enterprise Survey firms. Theproductivity gap between unregistered firms and even the small firms inthe control groups is truly enormous. Take the case of India in 2006 again.Value added per employee for small Enterprise Survey firms is 70 percenthigher than for unregistered Micro Survey firms, and sales and real outputper employee for small firms are 113 percent and 157 percent higher,respectively, than for unregistered ones. The example of India is represen-tative of the results for other countries, except that value added and realoutput per employee in Burundi and sales per employee in Indonesia donot conform to this pattern. Bearing in mind that the observations areunevenly distributed across size groups (only two small firms in Indonesiahave nonmissing sales), the consistency of the results across countries isstriking. On average, based on the Informal sample, the productivity ofsmall firms in the Enterprise Survey is around 154, 180, or 314 percenthigher than for unregistered firms depending on whether we look at valueadded, sales per employee, or real output per employee, respectively.Similarly, based on the Micro sample, the productivity wedge betweensmall firms in the Enterprise Survey and unregistered firms is 104, 124,or 234 percent depending on whether we look at value added, sales peremployee, or real output per employee, respectively.
Third, big firms are significantly more productive than small ones. Con-tinuing with the example of India in 2006, the productivity wedge betweenbig and small firms in the control group for the Micro sample is 68 percentfor value added, 35 percent for sales per employee, and 271 percent forreal output per employee. This large heterogeneity in firm productivity is
328 Brookings Papers on Economic Activity, Fall 2008
11472-06_La Porta_rev2.qxd 3/6/09 1:13 PM Page 328
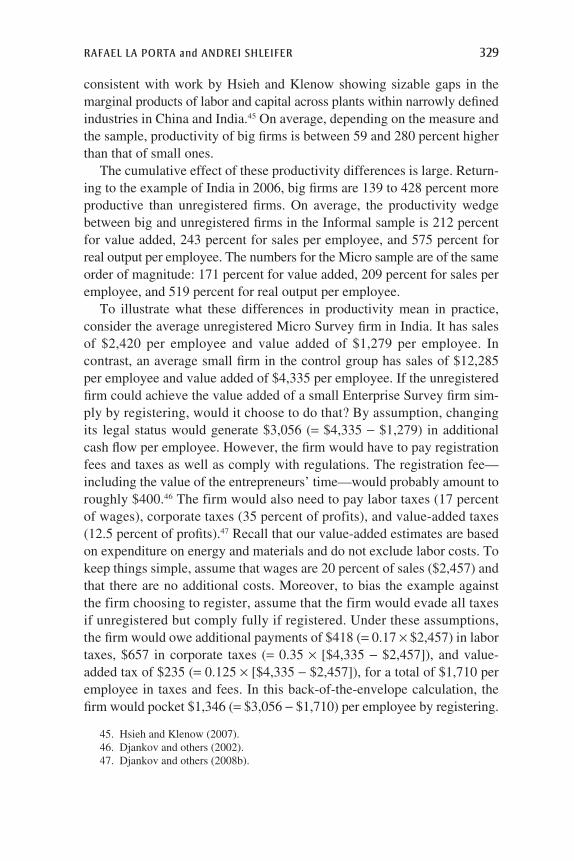
consistent with work by Hsieh and Klenow showing sizable gaps in themarginal products of labor and capital across plants within narrowly definedindustries in China and India.45 On average, depending on the measure andthe sample, productivity of big firms is between 59 and 280 percent higherthan that of small ones.
The cumulative effect of these productivity differences is large. Return-ing to the example of India in 2006, big firms are 139 to 428 percent moreproductive than unregistered firms. On average, the productivity wedgebetween big and unregistered firms in the Informal sample is 212 percentfor value added, 243 percent for sales per employee, and 575 percent forreal output per employee. The numbers for the Micro sample are of the sameorder of magnitude: 171 percent for value added, 209 percent for sales peremployee, and 519 percent for real output per employee.
To illustrate what these differences in productivity mean in practice,consider the average unregistered Micro Survey firm in India. It has salesof $2,420 per employee and value added of $1,279 per employee. Incontrast, an average small firm in the control group has sales of $12,285per employee and value added of $4,335 per employee. If the unregisteredfirm could achieve the value added of a small Enterprise Survey firm sim-ply by registering, would it choose to do that? By assumption, changingits legal status would generate $3,056 (= $4,335 − $1,279) in additionalcash flow per employee. However, the firm would have to pay registrationfees and taxes as well as comply with regulations. The registration fee—including the value of the entrepreneurs’ time—would probably amount toroughly $400.46 The firm would also need to pay labor taxes (17 percentof wages), corporate taxes (35 percent of profits), and value-added taxes(12.5 percent of profits).47 Recall that our value-added estimates are basedon expenditure on energy and materials and do not exclude labor costs. Tokeep things simple, assume that wages are 20 percent of sales ($2,457) andthat there are no additional costs. Moreover, to bias the example againstthe firm choosing to register, assume that the firm would evade all taxesif unregistered but comply fully if registered. Under these assumptions,the firm would owe additional payments of $418 (= 0.17 × $2,457) in labortaxes, $657 in corporate taxes (= 0.35 × [$4,335 − $2,457]), and value-added tax of $235 (= 0.125 × [$4,335 − $2,457]), for a total of $1,710 peremployee in taxes and fees. In this back-of-the-envelope calculation, thefirm would pocket $1,346 (= $3,056 − $1,710) per employee by registering.
RAFAEL LA PORTA and ANDREI SHLEIFER 329
45. Hsieh and Klenow (2007).46. Djankov and others (2002).47. Djankov and others (2008b).
11472-06_La Porta_rev2.qxd 3/6/09 1:13 PM Page 329
Of course, the gains would be even larger if the unregistered firm could,merely by registering, replicate the value added per employee of big firmsin the control group. On average, such firms have value added per employeeof $8,715 on sales per employee of $20,301. Calculations similar to thepreceding ones suggest that the unregistered firm would gain $4,135 peremployee if, simply by registering, it could replicate the value added peremployee of big firms.
A similar set of calculations illustrates that unregistered entrepreneurscan simply not afford to pay taxes unless sales sharply increase from merelyregistering. Assuming wages equal 20 percent of sales ($484), the averageunregistered firm has a pre-tax profit per employee of $795 (= $1,279 − $484)and owes taxes of $460 per employee.48 Unless sales dramatically increasedas a result of registering, the average unregistered firm would have consid-erable difficulty paying $400 to register.
In practice, these calculations mean that believers in the romantic viewneed to blame the precarious existence of unregistered firms on somethingbeyond costly entry procedures and high tax rates. Given the very large dif-ference in productivity between unregistered firms and the control group, thecost of complying with government regulations would have to be implausi-bly high to justify operating as an unregistered firm. A more realistic sce-nario is that—consistent with the dual view—unregistered firms would notbe able to achieve the performance of small firms in the control group justby registering. Perhaps, for example, unregistered firms lack the humancapital necessary to match the quality of the goods produced by formalfirms. The image of unregistered firms that is consistent with their observedproductivity is not that of predators but rather that of relics of the past.
What accounts for the large difference in productivity between unregis-tered firms and the control group? We begin by running simple ordinaryleast squares (OLS) regressions and discuss self-selection issues later. Inprinciple, the productivity differences that we document in tables 13 and 14could be driven by industry effects, by differences in inputs (includinghuman capital), or by differences in size. The goal of these regressions is toexamine whether unregistered firms remain unusually unproductive afterwe control for these factors. In simple terms, we interpret the estimatedcoefficient on the unregistered dummy as a measure of our ignoranceregarding the production function of unregistered firms. Omitting theunregistered dummy would not mean that unregistered firms are as pro-
330 Brookings Papers on Economic Activity, Fall 2008
48. Such a firm would owe $82 in labor taxes (= 0.17 × $484), $278 in corporate taxes(= 0.35 × [$1,279 − $484]), and $99 in value-added taxes (= 0.125 × [$1,279 − $484]).
11472-06_La Porta_rev2.qxd 3/6/09 1:13 PM Page 330
ductive as registered ones, but that differences in productivity are capturedby differences in inputs, as in Rauch’s selection story.49
All specifications include dummy variables equaling 1 under the fol-lowing conditions: the firm is in the Informal Survey; the firm is registeredand in the Informal Survey; the firm is in the Micro Survey; and the firm isregistered and in the Micro Survey. Firms in the Enterprise Survey are theomitted category. We then add to the regression—one at a time—logincome per capita, eight industry dummies, expenditure on raw materials,expenditure on energy, expenditure on machines, the index of managereducation, and log sales.50 All three expenditure variables are scaled by thenumber of employees.
Table 15 reports the results of OLS regressions in which log value addedper employee is the dependent variable. Tables 16 and 17 show similarregressions for log sales and real output per employee, respectively. All threesets of results are qualitatively similar. We discuss the findings on valueadded in some detail and point out where the results for sales and real outputper employee differ. The first regression reported in each table includes asindependent variables only the dummies for whether the firm is in theInformal Survey sample or in the Micro Survey sample and the interactionsbetween each of those two variables and whether the firm is registered.
The results confirm the findings in tables 13 and 14. The estimated coef-ficients in column 15-1 of table 15 are −1.78 for the Informal sampledummy and −1.29 for the Micro sample dummy. The coefficients forthe interactions of the Informal and the Micro dummies with whether thefirm is registered equal 0.81 and 0.35, respectively. All four dummies arehighly statistically significant. Adding GDP per capita to the regression(column 15-2) does not change the basic pattern. Similarly, the estimatedcoefficients for the four dummies barely change as we add industry con-trols (column 15-3). The coefficients do change when we add expenditureon raw materials: the estimated coefficients for each of the four dummies areroughly cut in half (column 15-4). Adding expenditure on energy furtherlowers the estimated coefficients on the four dummies, but not significantly(column 15-5). The four coefficients barely change as we add expenditureon machinery (column 15-6). The coefficients for expenditure on rawmaterials, energy, and machines are not only statistically significant butalso economically important. For example, increasing raw materials by
RAFAEL LA PORTA and ANDREI SHLEIFER 331
49. Rauch (1991).50. Errors are clustered at the country level. We do not include country fixed effects
since the frequency of unregistered firms in our sample may not reflect the incidence ofunregistered firms in the population.
11472-06_La Porta_rev2.qxd 3/6/09 1:13 PM Page 331

Tabl
e 15
.R
egre
ssio
ns E
xpla
inin
g Va
lue
Adde
d pe
r Em
ploy
eea
Reg
ress
ion
Inde
pend
ent v
aria
ble
15-1
15-2
15-3
15-4
15-5
15-6
15-7
15-8
Info
rmal
Sur
vey
dum
my
−1.7
788*
**−1
.789
4***
−1.8
135*
**−0
.887
5***
−0.7
075*
**−0
.690
1***
−0.5
574*
**0.
1247
(0.1
455)
(0.1
265)
(0.1
160)
(0.1
788)
(0.1
517)
(0.1
543)
(0.1
597)
(0.1
225)
Info
rmal
Sur
vey
dum
my
0.
8077
***
0.62
41**
*0.
5906
***
0.30
32**
0.16
120.
1705
0.12
810.
2948
***
× re
gist
ered
(0.2
476)
(0.1
499)
(0.1
204)
(0.1
449)
(0.1
223)
(0.1
237)
(0.1
226)
(0.0
939)
Mic
ro S
urve
y du
mm
y−1
.291
0***
−1.2
810*
**−1
.248
8***
−0.7
925*
**−0
.662
6***
−0.5
711*
**−0
.474
6***
0.37
20**
*(0
.146
4)(0
.096
3)(0
.103
5)(0
.112
7)(0
.125
6)(0
.121
8)(0
.113
3)(0
.066
0)M
icro
Sur
vey
dum
my
0.
3454
***
0.37
63**
*0.
3115
***
0.18
21**
*0.
1510
***
0.13
87**
*0.
0986
**−0
.072
8×
regi
ster
ed(0
.036
8)(0
.043
6)(0
.033
0)(0
.035
0)(0
.046
7)(0
.041
8)(0
.039
8)(0
.052
7)L
og o
f G
DP
per
cap
ita
0.39
60**
*0.
4279
***
0.32
72**
0.29
85**
0.27
39**
0.26
65**
0.05
84(a
t PP
P)
(0.1
164)
(0.1
333)
(0.1
184)
(0.1
166)
(0.0
983)
(0.0
966)
(0.0
760)
Log
of
expe
ndit
ure
on r
aw
0.28
73**
*0.
2140
***
0.20
34**
*0.
1977
***
0.03
81m
ater
ials
per
em
ploy
ee(0
.050
9)(0
.049
1)(0
.048
9)(0
.048
3)(0
.039
2)L
og o
f ex
pend
itur
e on
0.
2059
***
0.19
09**
*0.
1834
***
0.10
93**
*en
ergy
per
em
ploy
ee(0
.034
8)(0
.031
7)(0
.032
6)(0
.030
3)L
og o
f ex
pend
itur
e on
0.
0570
***
0.05
44**
*0.
0078
mac
hine
s pe
r em
ploy
ee(0
.010
2)(0
.010
0)(0
.011
2)M
anag
er e
duca
tion
0.
0986
***
−0.0
231
(4 =
atte
nded
col
lege
)(0
.029
2)(0
.016
0)L
og o
f sa
les
0.42
04**
*(0
.056
4)In
dust
ry d
umm
ies
No
No
Yes
Yes
Yes
Yes
Yes
Yes
Con
stan
t9.
2615
***
6.19
96**
*5.
7435
***
4.03
03**
*3.
6547
***
3.79
87**
*3.
6445
***
1.97
36**
*(0
.138
9)(0
.918
6)(1
.081
0)(0
.942
8)(0
.964
6)(0
.845
9)(0
.839
3)(0
.605
9)
Adj
uste
d R
2(p
erce
nt)
24.1
928
.07
29.9
043
.13
46.8
347
.94
48.4
764
.00
Sour
ce: A
utho
rs’
regr
essi
ons.
a. R
esul
ts o
f or
dina
ry le
ast s
quar
es r
egre
ssio
ns o
n da
ta f
rom
the
27 c
ount
ries
cov
ered
by
the
Info
rmal
and
Mic
ro S
urve
ys. T
he d
epen
dent
var
iabl
e is
the
loga
rith
m o
f va
lue
adde
d pe
r em
ploy
ee a
t pu
rcha
sing
pow
er p
arity
. The
num
ber
of o
bser
vatio
ns i
n al
l re
gres
sion
s is
8,4
78. S
tand
ard
erro
rs a
re c
lust
ered
at
the
coun
try
leve
l an
d re
port
ed i
npa
rent
hese
s. A
ster
isks
indi
cate
sta
tistic
al s
igni
fican
ce a
t the
*10
per
cent
, **5
per
cent
, and
***
1 pe
rcen
t lev
el.
11472-06_La Porta_rev2.qxd 3/6/09 1:13 PM Page 332
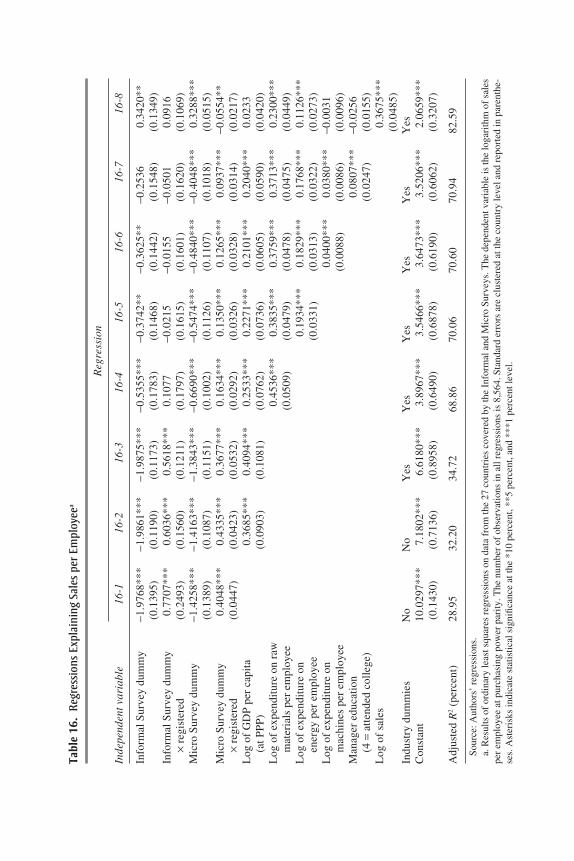
Tabl
e 16
.R
egre
ssio
ns E
xpla
inin
g Sa
les
per
Empl
oyee
a
Reg
ress
ion
Inde
pend
ent v
aria
ble
16-1
16-2
16-3
16-4
16-5
16-6
16-7
16-8
Info
rmal
Sur
vey
dum
my
−1.9
768*
**−1
.986
1***
−1.9
875*
**−0
.535
5***
−0.3
742*
*−0
.362
5**
−0.2
536
0.34
20**
(0.1
395)
(0.1
190)
(0.1
173)
(0.1
783)
(0.1
468)
(0.1
442)
(0.1
548)
(0.1
349)
Info
rmal
Sur
vey
dum
my
0.
7707
***
0.60
36**
*0.
5618
***
0.10
77−0
.021
5−0
.015
5−0
.050
10.
0916
× re
gist
ered
(0.2
493)
(0.1
560)
(0.1
211)
(0.1
797)
(0.1
615)
(0.1
601)
(0.1
620)
(0.1
069)
Mic
ro S
urve
y du
mm
y−1
.425
8***
−1.4
163*
**−1
.384
3***
−0.6
690*
**−0
.547
4***
−0.4
840*
**−0
.404
8***
0.32
88**
*(0
.138
9)(0
.108
7)(0
.115
1)(0
.100
2)(0
.112
6)(0
.110
7)(0
.101
8)(0
.051
5)M
icro
Sur
vey
dum
my
0.
4048
***
0.43
35**
*0.
3677
***
0.16
34**
*0.
1350
***
0.12
65**
*0.
0937
***
−0.0
554*
*×
regi
ster
ed(0
.044
7)(0
.042
3)(0
.053
2)(0
.029
2)(0
.032
6)(0
.032
8)(0
.031
4)(0
.021
7)L
og o
f G
DP
per
cap
ita
0.36
85**
*0.
4094
***
0.25
33**
*0.
2271
***
0.21
01**
*0.
2040
***
0.02
33(a
t PP
P)
(0.0
903)
(0.1
081)
(0.0
762)
(0.0
736)
(0.0
605)
(0.0
590)
(0.0
420)
Log
of
expe
ndit
ure
on r
aw
0.45
36**
*0.
3835
***
0.37
59**
*0.
3713
***
0.23
00**
*m
ater
ials
per
em
ploy
ee(0
.050
9)(0
.047
9)(0
.047
8)(0
.047
5)(0
.044
9)L
og o
f ex
pend
itur
e on
0.
1934
***
0.18
29**
*0.
1768
***
0.11
26**
*en
ergy
per
em
ploy
ee(0
.033
1)(0
.031
3)(0
.032
2)(0
.027
3)L
og o
f ex
pend
itur
e on
0.
0400
***
0.03
80**
*−0
.003
1m
achi
nes
per
empl
oyee
(0.0
088)
(0.0
086)
(0.0
096)
Man
ager
edu
cati
on
0.08
07**
*−0
.025
6(4
=at
tend
ed c
olle
ge)
(0.0
247)
(0.0
155)
Log
of
sale
s0.
3675
***
(0.0
485)
Indu
stry
dum
mie
sN
oN
oY
esY
esY
esY
esY
esY
esC
onst
ant
10.0
297*
**7.
1802
***
6.61
80**
*3.
8967
***
3.54
66**
*3.
6473
***
3.52
06**
*2.
0659
***
(0.1
430)
(0.7
136)
(0.8
958)
(0.6
490)
(0.6
878)
(0.6
190)
(0.6
062)
(0.3
207)
Adj
uste
d R
2(p
erce
nt)
28.9
532
.20
34.7
268
.86
70.0
670
.60
70.9
482
.59
Sour
ce: A
utho
rs’
regr
essi
ons.
a. R
esul
ts o
f or
dina
ry le
ast s
quar
es r
egre
ssio
ns o
n da
ta f
rom
the
27 c
ount
ries
cov
ered
by
the
Info
rmal
and
Mic
ro S
urve
ys. T
he d
epen
dent
var
iabl
e is
the
loga
rith
m o
f sa
les
per
empl
oyee
at p
urch
asin
g po
wer
par
ity. T
he n
umbe
r of
obs
erva
tions
in a
ll re
gres
sion
s is
8,5
64. S
tand
ard
erro
rs a
re c
lust
ered
at t
he c
ount
ry le
vel a
nd r
epor
ted
in p
aren
the-
ses.
Ast
eris
ks in
dica
te s
tatis
tical
sig
nific
ance
at t
he *
10 p
erce
nt, *
*5 p
erce
nt, a
nd *
**1
perc
ent l
evel
.
11472-06_La Porta_rev2.qxd 3/6/09 1:13 PM Page 333
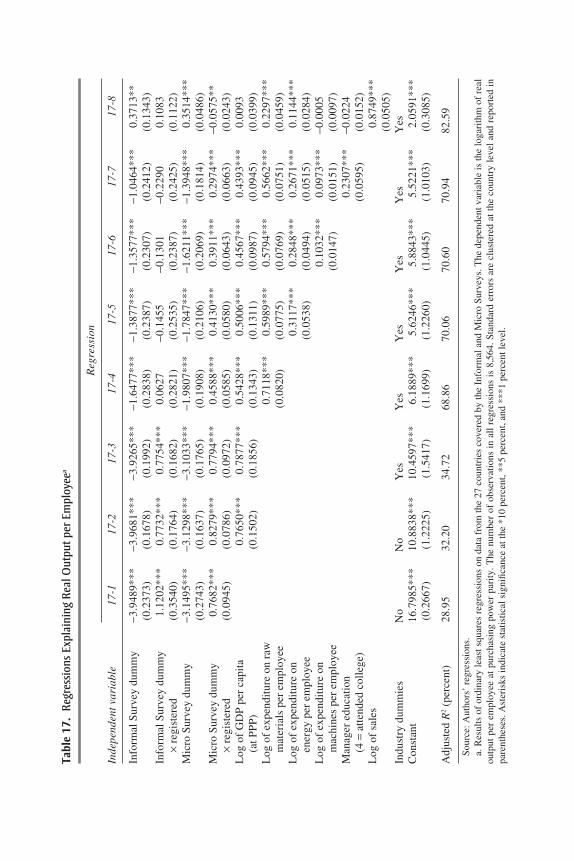
Tabl
e 17
.R
egre
ssio
ns E
xpla
inin
g R
eal O
utpu
t per
Em
ploy
eea
Reg
ress
ion
Inde
pend
ent v
aria
ble
17-1
17-2
17-3
17-4
17-5
17-6
17-7
17-8
Info
rmal
Sur
vey
dum
my
−3.9
489*
**−3
.968
1***
−3.9
265*
**−1
.647
7***
−1.3
877*
**−1
.357
7***
−1.0
464*
**0.
3713
**(0
.237
3)(0
.167
8)(0
.199
2)(0
.283
8)(0
.238
7)(0
.230
7)(0
.241
2)(0
.134
3)In
form
al S
urve
y du
mm
y
1.12
02**
*0.
7732
***
0.77
54**
*0.
0627
−0.1
455
−0.1
301
−0.2
290
0.10
83×
regi
ster
ed(0
.354
0)(0
.176
4)(0
.168
2)(0
.282
1)(0
.253
5)(0
.238
7)(0
.242
5)(0
.112
2)M
icro
Sur
vey
dum
my
−3.1
495*
**−3
.129
8***
−3.1
033*
**−1
.980
7***
−1.7
847*
**−1
.621
1***
−1.3
948*
**0.
3514
***
(0.2
743)
(0.1
637)
(0.1
765)
(0.1
908)
(0.2
106)
(0.2
069)
(0.1
814)
(0.0
486)
Mic
ro S
urve
y du
mm
y
0.76
82**
*0.
8279
***
0.77
94**
*0.
4588
***
0.41
30**
*0.
3911
***
0.29
74**
*−0
.057
5**
× re
gist
ered
(0.0
945)
(0.0
786)
(0.0
972)
(0.0
585)
(0.0
580)
(0.0
643)
(0.0
663)
(0.0
243)
Log
of
GD
P p
er c
apit
a 0.
7650
***
0.78
77**
*0.
5428
***
0.50
06**
*0.
4567
***
0.43
93**
*0.
0093
(at P
PP
)(0
.150
2)(0
.185
6)(0
.134
3)(0
.131
1)(0
.098
7)(0
.094
5)(0
.039
9)L
og o
f ex
pend
itur
e on
raw
0.
7118
***
0.59
89**
*0.
5794
***
0.56
62**
*0.
2297
***
mat
eria
ls p
er e
mpl
oyee
(0.0
820)
(0.0
775)
(0.0
769)
(0.0
751)
(0.0
459)
Log
of
expe
ndit
ure
on
0.31
17**
*0.
2848
***
0.26
71**
*0.
1144
***
ener
gy p
er e
mpl
oyee
(0.0
538)
(0.0
494)
(0.0
515)
(0.0
284)
Log
of
expe
ndit
ure
on
0.10
32**
*0.
0973
***
−0.0
005
mac
hine
s pe
r em
ploy
ee(0
.014
7)(0
.015
1)(0
.009
7)M
anag
er e
duca
tion
0.
2307
***
−0.0
224
(4 =
atte
nded
col
lege
)(0
.059
5)(0
.015
2)L
og o
f sa
les
0.87
49**
*(0
.050
5)In
dust
ry d
umm
ies
No
No
Yes
Yes
Yes
Yes
Yes
Yes
Con
stan
t16
.798
5***
10.8
838*
**10
.459
7***
6.18
89**
*5.
6246
***
5.88
43**
*5.
5221
***
2.05
91**
*(0
.266
7)(1
.222
5)(1
.541
7)(1
.169
9)(1
.226
0)(1
.044
5)(1
.010
3)(0
.308
5)
Adj
uste
d R
2(p
erce
nt)
28.9
532
.20
34.7
268
.86
70.0
670
.60
70.9
482
.59
Sour
ce: A
utho
rs’
regr
essi
ons.
a. R
esul
ts o
f or
dina
ry le
ast s
quar
es r
egre
ssio
ns o
n da
ta f
rom
the
27 c
ount
ries
cov
ered
by
the
Info
rmal
and
Mic
ro S
urve
ys. T
he d
epen
dent
var
iabl
e is
the
loga
rith
m o
f re
alou
tput
per
em
ploy
ee a
t pu
rcha
sing
pow
er p
arity
. The
num
ber
of o
bser
vatio
ns i
n al
l re
gres
sion
s is
8,5
64. S
tand
ard
erro
rs a
re c
lust
ered
at
the
coun
try
leve
l an
d re
port
ed i
npa
rent
hese
s. A
ster
isks
indi
cate
sta
tistic
al s
igni
fican
ce a
t the
*10
per
cent
, **5
per
cent
, and
***
1 pe
rcen
t lev
el.
11472-06_La Porta_rev2.qxd 3/6/09 1:13 PM Page 334
1 standard deviation is associated with a 43 percent increase in valueadded per employee.51 Similar increases in expenditure on energy andmachines have somewhat smaller effects (32 and 16 percent, respectively).Coefficients fall another notch when we add manager education to theregression (column 15-7). Interestingly, ignoring selection issues, the esti-mated coefficient on manager education suggests that a top manager withsome college education increases value added per employee by 27 percent(= 0.09 × 3) relative to a top manager with only some primary school edu-cation. Finally, there is no evidence that unregistered firms are unusuallyunproductive once we control for log sales: the estimated coefficients onboth the Informal and the Micro dummies switch signs when we add logsales to the regression (column 15-8). In fact, the coefficient on the Microdummy is not only positive but also significant. The interaction betweenthe registration dummy and the Informal dummy is the only interactionterm that remains statistically significant.
Again, the results on sales and real output per employee (tables 16and 17, respectively) are very similar to those for value added. In the fullspecification, the estimated coefficients for both the Informal and theMicro dummies are positive and significant. The interaction between theregistered and the Informal dummies is insignificant, whereas that betweenthe registered and the Micro dummies takes a small—but statisticallysignificant—negative value.
Selection
The OLS results in this section suggest that unregistered firms are notunusually unproductive once we take into account their expenditure oninputs, the human capital of their top managers, and their small size. Ofcourse, these are all endogenous variables. In fact, a key distinguishingfactor between the dual view and the other views of unregistered firms isthe emphasis on the sorting process that matches able managers with goodassets. High-quality managers are willing to pay taxes and bear the cost ofgovernment regulation in exchange for being able to advertise their prod-ucts, raise outside capital, and access public goods. In contrast, low-qualitymanagers avoid taxes and regulations, since the benefits of operating in theformal economy are less valuable for small firms.
Table 18 examines the sorting process. Specifically, we examine therelationship between the quality of the firm’s assets and the human capital
RAFAEL LA PORTA and ANDREI SHLEIFER 335
51. The standard deviations for raw materials, energy, and machines are 2.11, 1.66, and2.83, respectively.
11472-06_La Porta_rev2.qxd 3/6/09 1:13 PM Page 335
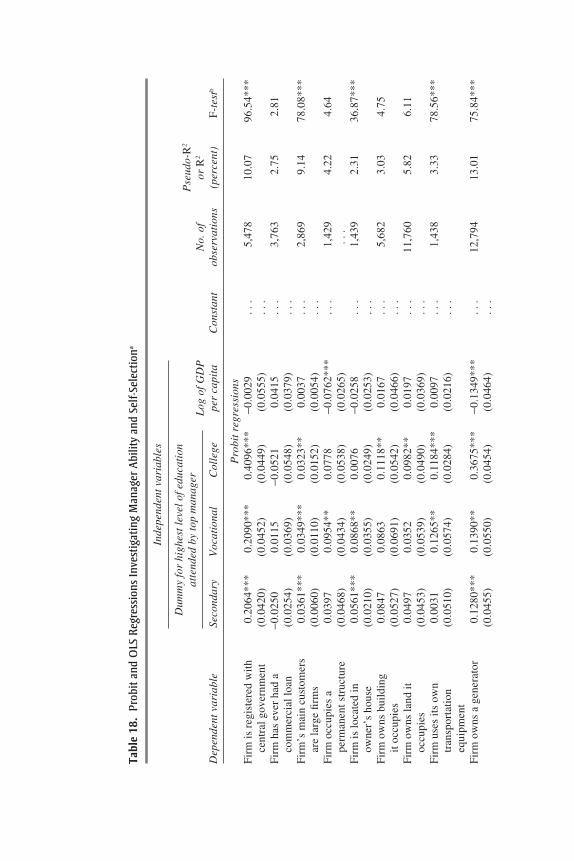
Tabl
e 18
.Pr
obit
and
OLS
Reg
ress
ions
Inve
stig
atin
g M
anag
er A
bilit
y an
d Se
lf-S
elec
tiona
Inde
pend
ent v
aria
bles
Dum
my
for
high
est l
evel
of e
duca
tion
P
seud
o-R
2
atte
nded
by
top
man
ager
Log
of G
DP
No.
of
or R
2
Dep
ende
nt v
aria
ble
Seco
ndar
yV
ocat
iona
lC
olle
gepe
r ca
pita
Con
stan
tob
serv
atio
ns(p
erce
nt)
F-t
estb
Pro
bit r
egre
ssio
nsF
irm
is r
egis
tere
d w
ith
0.20
64**
*0.
2090
***
0.40
96**
*−0
.002
9..
.5,
478
10.0
796
.54*
**ce
ntra
l gov
ernm
ent
(0.0
420)
(0.0
452)
(0.0
449)
(0.0
555)
...
Fir
m h
as e
ver
had
a −0
.025
00.
0115
−0.0
521
0.04
15..
.3,
763
2.75
2.81
com
mer
cial
loan
(0.0
254)
(0.0
369)
(0.0
548)
(0.0
379)
...
Fir
m’s
mai
n cu
stom
ers
0.03
61**
*0.
0349
***
0.03
23**
0.00
37..
.2,
869
9.14
78.0
8***
are
larg
e fi
rms
(0.0
060)
(0.0
110)
(0.0
152)
(0.0
054)
...
Fir
m o
ccup
ies
a 0.
0397
0.09
54**
0.07
78−0
.076
2***
...
1,42
94.
224.
64pe
rman
ent s
truc
ture
(0.0
468)
(0.0
434)
(0.0
538)
(0.0
265)
...
Fir
m is
loca
ted
in
0.05
61**
*0.
0868
**0.
0076
−0.0
258
...
1,43
92.
3136
.87*
**ow
ner’
s ho
use
(0.0
210)
(0.0
355)
(0.0
249)
(0.0
253)
...
Fir
m o
wns
bui
ldin
g 0.
0847
0.08
630.
1118
**0.
0167
...
5,68
23.
034.
75it
occ
upie
s(0
.052
7)(0
.069
1)(0
.054
2)(0
.046
6)..
.F
irm
ow
ns la
nd it
0.
0497
0.03
520.
0982
**0.
0197
...
11,7
605.
826.
11oc
cupi
es(0
.045
3)(0
.053
9)(0
.049
0)(0
.036
9)..
.F
irm
use
s it
s ow
n
0.00
310.
1265
**0.
1184
***
0.00
97..
.1,
438
3.33
78.5
6***
tran
spor
tati
on
(0.0
510)
(0.0
574)
(0.0
284)
(0.0
216)
...
equi
pmen
tF
irm
ow
ns a
gen
erat
or0.
1280
***
0.13
90**
0.36
75**
*−0
.134
9***
...
12,7
9413
.01
75.8
4***
(0.0
455)
(0.0
550)
(0.0
454)
(0.0
464)
...
11472-06_La Porta_rev2.qxd 3/6/09 1:13 PM Page 336
Firm
use
s e-
mai
l to
0.16
62**
*0.
2309
***
0.47
99**
*0.
1495
**..
.11
,081
21.6
215
8.61
***
com
mun
icat
e w
ith
(0.0
460)
(0.0
453)
(0.0
438)
(0.0
736)
...
clie
nts
Fir
m u
ses
web
site
to
0.11
59**
*0.
1676
***
0.25
74**
*0.
1358
**..
.11
,044
16.9
161
.46*
**co
mm
unic
ate
with
(0
.035
3)(0
.036
1)(0
.027
4)(0
.064
8)..
.cl
ient
sF
irm
has
ele
ctri
cal
0.18
37**
*0.
1901
***
0.28
33**
*−0
.020
0..
.1,
439
12.8
233
.1**
*co
nnec
tion
(0.0
503)
(0.0
579)
(0.0
597)
(0.0
517)
...
OL
S re
gres
sion
sP
erce
nt o
f in
vest
men
t 0.
9852
−2.9
315
−10.
1707
***
−5.3
383*
*11
1.37
20**
*13
,006
5.10
35.0
6***
fina
nced
wit
h (3
.608
3)(1
.998
2)(2
.102
4)(1
.946
8)(1
4.77
73)
inte
rnal
fun
dsE
xpen
ditu
re o
n ra
w
0.03
78**
*0.
0338
**0.
0874
***
−0.0
080
0.44
61**
*11
,966
3.83
11.3
2***
mat
eria
ls a
s pe
rcen
t (0
.013
0)(0
.014
7)(0
.019
3)(0
.015
4)(0
.134
0)of
sal
esE
xpen
ditu
re o
n en
ergy
−0
.001
5−0
.004
0−0
.007
7−0
.003
50.
0747
**12
,546
1.72
1.78
as p
erce
nt o
f sa
les
(0.0
039)
(0.0
041)
(0.0
047)
(0.0
040)
(0.0
302)
Exp
endi
ture
on
mac
hine
s −0
.004
70.
0162
***
0.00
19−0
.002
30.
0432
12,5
773.
267.
91**
*as
per
cent
of
sale
s(0
.004
0)(0
.005
2)(0
.004
1)(0
.004
6)(0
.036
1)C
apac
ity
util
izat
ion
0.62
301.
0456
5.48
10**
*1.
5761
57.7
676*
**9,
380
4.18
7.15
***
(per
cent
)(1
.043
0)(1
.847
6)(1
.320
8)(1
.173
7)(1
0.60
62)
Sour
ce: A
utho
rs’
regr
essi
ons.
a. M
argi
nal
effe
cts
of p
robi
t (t
op p
anel
) or
OL
S (b
otto
m p
anel
) re
gres
sion
s on
dat
a fr
om t
he 2
7 co
untr
ies
incl
uded
in
the
Info
rmal
and
Mic
ro S
urve
ys.
All
regr
essi
ons
incl
ude
indu
stry
dum
mie
s. R
obus
t sta
ndar
d er
rors
are
clu
ster
ed a
t the
cou
ntry
leve
l and
pre
sent
ed in
par
enth
eses
. Ast
eris
ks in
dica
te s
tatis
tical
sig
nific
ance
at t
he *
10 p
erce
nt,
**5
perc
ent,
and
***1
per
cent
leve
l.b.
Tes
t of
the
null
hypo
thes
is th
at tr
ue c
oeffi
cien
ts o
n al
l thr
ee to
p-m
anag
er e
duca
tion
dum
mie
s ar
e ze
ro.
11472-06_La Porta_rev2.qxd 3/6/09 1:13 PM Page 337
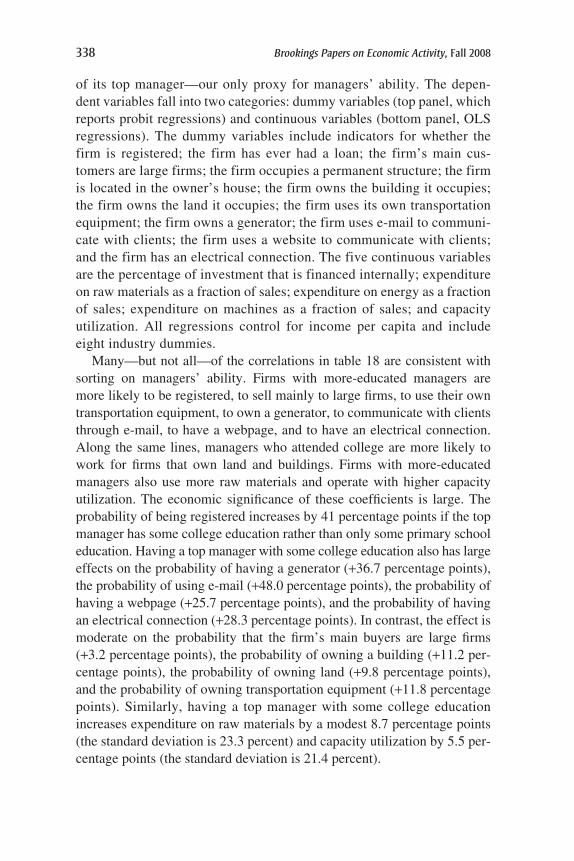
of its top manager—our only proxy for managers’ ability. The depen-dent variables fall into two categories: dummy variables (top panel, whichreports probit regressions) and continuous variables (bottom panel, OLSregressions). The dummy variables include indicators for whether thefirm is registered; the firm has ever had a loan; the firm’s main cus-tomers are large firms; the firm occupies a permanent structure; the firmis located in the owner’s house; the firm owns the building it occupies;the firm owns the land it occupies; the firm uses its own transportationequipment; the firm owns a generator; the firm uses e-mail to communi-cate with clients; the firm uses a website to communicate with clients;and the firm has an electrical connection. The five continuous variablesare the percentage of investment that is financed internally; expenditureon raw materials as a fraction of sales; expenditure on energy as a fractionof sales; expenditure on machines as a fraction of sales; and capacityutilization. All regressions control for income per capita and includeeight industry dummies.
Many—but not all—of the correlations in table 18 are consistent withsorting on managers’ ability. Firms with more-educated managers aremore likely to be registered, to sell mainly to large firms, to use their owntransportation equipment, to own a generator, to communicate with clientsthrough e-mail, to have a webpage, and to have an electrical connection.Along the same lines, managers who attended college are more likely towork for firms that own land and buildings. Firms with more-educatedmanagers also use more raw materials and operate with higher capacityutilization. The economic significance of these coefficients is large. Theprobability of being registered increases by 41 percentage points if the topmanager has some college education rather than only some primary schooleducation. Having a top manager with some college education also has largeeffects on the probability of having a generator (+36.7 percentage points),the probability of using e-mail (+48.0 percentage points), the probability ofhaving a webpage (+25.7 percentage points), and the probability of havingan electrical connection (+28.3 percentage points). In contrast, the effect ismoderate on the probability that the firm’s main buyers are large firms(+3.2 percentage points), the probability of owning a building (+11.2 per-centage points), the probability of owning land (+9.8 percentage points),and the probability of owning transportation equipment (+11.8 percentagepoints). Similarly, having a top manager with some college educationincreases expenditure on raw materials by a modest 8.7 percentage points(the standard deviation is 23.3 percent) and capacity utilization by 5.5 per-centage points (the standard deviation is 21.4 percent).
338 Brookings Papers on Economic Activity, Fall 2008
11472-06_La Porta_rev2.qxd 3/6/09 1:13 PM Page 338
The evidence on external finance is mixed. On the one hand, firms withmore-educated managers rely more on external finance (bottom panel oftable 18). On the other hand, the education of managers does not signifi-cantly affect the probability that the firm has ever had a loan (top panel).The evidence on investment in machines is also weak: in that regression theonly significant coefficient is the one for vocational schooling. Nor is thereevidence that expenditure on energy increases with managers’ education.Only one regression has statistically significant coefficients with the “wrong”sign: the likelihood that the firm operates in the house of the owner is higherwhen managers have attended secondary or vocational school rather thanprimary school only.
These results suggest an explanation for the puzzlingly low productivityof unregistered firms. The productivity gap between registered firms andthe control group disappears once we take into account crude proxies forphysical and human capital and control for size. Of course, size is anendogenous variable. These results on manager selection are broadly con-sistent with the view that part of the reason that unregistered firms are smallis that they are run by managers of low ability.52 These managers do notfind it worthwhile to pay the cost of running a formal firm. Unregisteredfirms are small because they are run by less able managers and, as such,face a high cost of capital, have few opportunities to advertise their prod-ucts, and are of insufficient scale to own critical assets such as generatorsand computers.
Obstacles to Doing Business
As a final step, we present information on obstacles to doing business asreported by respondents in the Informal, Micro, and Enterprise Surveys.All obstacles are reported on a 0-to-4 scale for their perceived significance,with 0 representing “no obstacle,” 1 “minor obstacle,” 2 “moderate obsta-cle,” 3 “major obstacle,” and 4 “very severe obstacle.” In table 19 we com-pare average responses about various obstacles for Informal Survey firms(top panel) and their Enterprise Survey counterparts, as well as for MicroSurvey firms and their control group (bottom panel).
Starting with the Informal Survey, the most striking finding is the simi-larity in many responses between the registered Informal Survey firms andthe Enterprise Survey firms. Both groups consider tax rates and tax admin-istration their most significant problems. Registered Informal Survey firms,
RAFAEL LA PORTA and ANDREI SHLEIFER 339
52. Rauch (1991).
11472-06_La Porta_rev2.qxd 3/6/09 1:13 PM Page 339
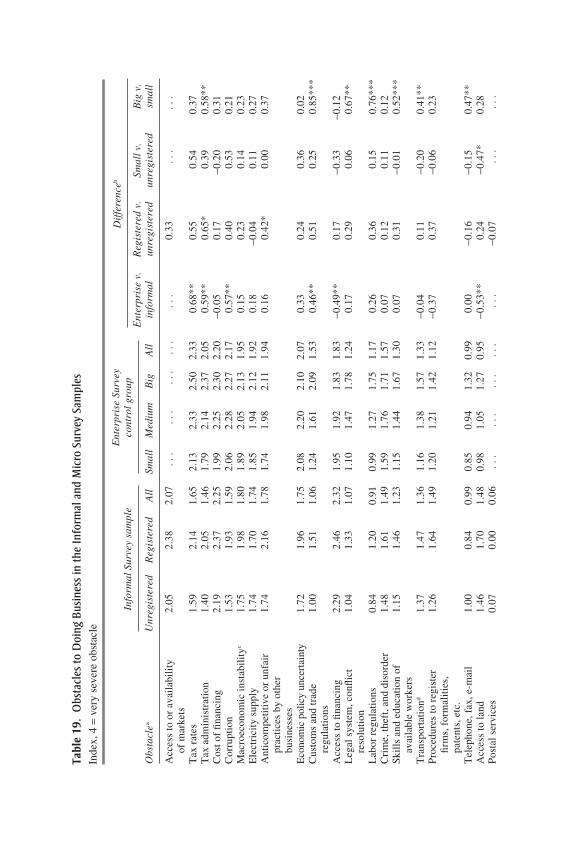
Ent
erpr
ise
Surv
ey
Info
rmal
Sur
vey
sam
ple
cont
rol g
roup
Dif
fere
nceb
Ent
erpr
ise
v.
Reg
iste
red
v.
Smal
l v.
Big
v.
Obs
tacl
eaU
nreg
iste
red
Reg
iste
red
All
Smal
lM
ediu
mB
igA
llin
form
alun
regi
ster
edun
regi
ster
edsm
all
Acc
ess
to o
r av
aila
bili
ty
2.05
2.38
2.07
...
...
...
...
...
0.33
...
...
of m
arke
tsT
ax r
ates
1.59
2.14
1.65
2.13
2.33
2.50
2.33
0.68
**0.
550.
540.
37T
ax a
dmin
istr
atio
n1.
402.
051.
461.
792.
142.
372.
050.
59**
0.65
*0.
390.
58**
Cos
t of
fina
ncin
g2.
192.
372.
251.
992.
252.
302.
20−0
.05
0.17
−0.2
00.
31C
orru
ptio
n1.
531.
931.
592.
062.
282.
272.
170.
57**
0.40
0.53
0.21
Mac
roec
onom
ic in
stab
ilit
yc1.
751.
981.
801.
892.
052.
131.
950.
150.
230.
140.
23E
lect
rici
ty s
uppl
y1.
741.
701.
741.
851.
942.
121.
920.
18−0
.04
0.11
0.27
Ant
icom
peti
tive
or
unfa
ir1.
742.
161.
781.
741.
982.
111.
940.
160.
42*
0.00
0.37
prac
tice
s by
oth
er
busi
ness
esE
cono
mic
pol
icy
unce
rtai
nty
1.72
1.96
1.75
2.08
2.20
2.10
2.07
0.33
0.24
0.36
0.02
Cus
tom
s an
d tr
ade
1.00
1.51
1.06
1.24
1.61
2.09
1.53
0.46
**0.
510.
250.
85**
*re
gula
tion
sA
cces
s to
fina
ncin
g2.
292.
462.
321.
951.
921.
831.
83−0
.49*
*0.
17−0
.33
−0.1
2L
egal
sys
tem
, con
flic
t 1.
041.
331.
071.
101.
471.
781.
240.
170.
290.
060.
67**
reso
luti
onL
abor
reg
ulat
ions
0.84
1.20
0.91
0.99
1.27
1.75
1.17
0.26
0.36
0.15
0.76
***
Cri
me,
thef
t, an
d di
sord
er1.
481.
611.
491.
591.
761.
711.
570.
070.
120.
110.
12S
kill
s an
d ed
ucat
ion
of
1.15
1.46
1.23
1.15
1.44
1.67
1.30
0.07
0.31
−0.0
10.
52**
*av
aila
ble
wor
kers
Tra
nspo
rtat
iond
1.37
1.47
1.36
1.16
1.38
1.57
1.33
−0.0
40.
11−0
.20
0.41
**P
roce
dure
s to
reg
iste
r 1.
261.
641.
491.
201.
211.
421.
12−0
.37
0.37
−0.0
60.
23fi
rms,
for
mal
itie
s,
pate
nts,
etc
.T
elep
hone
, fax
, e-m
ail
1.00
0.84
0.99
0.85
0.94
1.32
0.99
0.00
−0.1
6−0
.15
0.47
**A
cces
s to
land
1.46
1.70
1.48
0.98
1.05
1.27
0.95
−0.5
3**
0.24
−0.4
7*0.
28P
osta
l ser
vice
s0.
070.
000.
06..
...
...
...
...
.−0
.07
...
...
Tabl
e 19
.O
bsta
cles
to D
oing
Bus
ines
s in
the
Info
rmal
and
Mic
ro S
urve
y Sa
mpl
esIn
dex,
4 =
very
sev
ere
obst
acle
11472-06_La Porta_rev2.qxd 3/6/09 1:13 PM Page 340
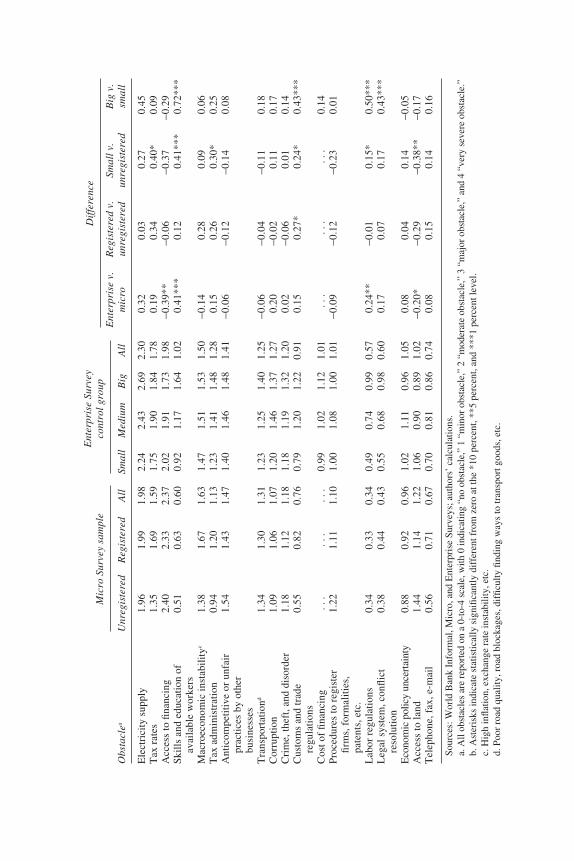
Ent
erpr
ise
Surv
eyM
icro
Sur
vey
sam
ple
cont
rol g
roup
Dif
fere
nce
Ent
erpr
ise
v.
Reg
iste
red
v.
Smal
l v.
Big
v.
Obs
tacl
eaU
nreg
iste
red
Reg
iste
red
All
Smal
lM
ediu
mB
igA
llm
icro
unre
gist
ered
unre
gist
ered
smal
l
Ele
ctri
city
sup
ply
1.96
1.99
1.98
2.24
2.43
2.69
2.30
0.32
0.03
0.27
0.45
Tax
rat
es1.
351.
691.
591.
751.
901.
841.
780.
190.
340.
40*
0.09
Acc
ess
to fi
nanc
ing
2.40
2.33
2.37
2.02
1.91
1.73
1.98
−0.3
9**
−0.0
6−0
.37
−0.2
9S
kill
s an
d ed
ucat
ion
of
0.51
0.63
0.60
0.92
1.17
1.64
1.02
0.41
***
0.12
0.41
***
0.72
***
avai
labl
e w
orke
rsM
acro
econ
omic
inst
abil
ityc
1.38
1.67
1.63
1.47
1.51
1.53
1.50
−0.1
40.
280.
090.
06T
ax a
dmin
istr
atio
n0.
941.
201.
131.
231.
411.
481.
280.
150.
260.
30*
0.25
Ant
icom
peti
tive
or
unfa
ir
1.54
1.43
1.47
1.40
1.46
1.48
1.41
−0.0
6−0
.12
−0.1
40.
08pr
acti
ces
by o
ther
bu
sine
sses
Tra
nspo
rtat
iond
1.34
1.30
1.31
1.23
1.25
1.40
1.25
−0.0
6−0
.04
−0.1
10.
18C
orru
ptio
n1.
091.
061.
071.
201.
461.
371.
270.
20−0
.02
0.11
0.17
Cri
me,
thef
t, an
d di
sord
er1.
181.
121.
181.
181.
191.
321.
200.
02−0
.06
0.01
0.14
Cus
tom
s an
d tr
ade
0.55
0.82
0.76
0.79
1.20
1.22
0.91
0.15
0.27
*0.
24*
0.43
***
regu
lati
ons
Cos
t of
fina
ncin
g..
...
...
.0.
991.
021.
121.
01..
...
...
.0.
14P
roce
dure
s to
reg
iste
r 1.
221.
111.
101.
001.
081.
001.
01−0
.09
−0.1
2−0
.23
0.01
firm
s, f
orm
alit
ies,
pa
tent
s, e
tc.
Lab
or r
egul
atio
ns0.
340.
330.
340.
490.
740.
990.
570.
24**
−0.0
10.
15*
0.50
***
Leg
al s
yste
m, c
onfl
ict
0.38
0.44
0.43
0.55
0.68
0.98
0.60
0.17
0.07
0.17
0.43
***
reso
luti
onE
cono
mic
pol
icy
unce
rtai
nty
0.88
0.92
0.96
1.02
1.11
0.96
1.05
0.08
0.04
0.14
−0.0
5A
cces
s to
land
1.44
1.14
1.22
1.06
0.90
0.89
1.02
−0.2
0*−0
.29
−0.3
8**
−0.1
7T
elep
hone
, fax
, e-m
ail
0.56
0.71
0.67
0.70
0.81
0.86
0.74
0.08
0.15
0.14
0.16
Sour
ces:
Wor
ld B
ank
Info
rmal
, Mic
ro, a
nd E
nter
pris
e Su
rvey
s; a
utho
rs’
calc
ulat
ions
.a.
All
obst
acle
s ar
e re
port
ed o
n a
0-to
-4 s
cale
, with
0 in
dica
ting
“no
obst
acle
,” 1
“m
inor
obs
tacl
e,”
2 “m
oder
ate
obst
acle
,” 3
“m
ajor
obs
tacl
e,”
and
4 “v
ery
seve
re o
bsta
cle.
” b.
Ast
eris
ks in
dica
te s
tatis
tical
ly s
igni
fican
tly d
iffe
rent
fro
m z
ero
at th
e *1
0 pe
rcen
t, **
5 pe
rcen
t, an
d **
*1 p
erce
nt le
vel.
c. H
igh
infla
tion,
exc
hang
e ra
te in
stab
ility
, etc
.d.
Poo
r ro
ad q
ualit
y, r
oad
bloc
kage
s, d
iffic
ulty
find
ing
way
s to
tran
spor
t goo
ds, e
tc.
11472-06_La Porta_rev2.qxd 3/6/09 1:13 PM Page 341
like Enterprise Survey firms, regard the cost of financing and access tofinancing as major obstacles as well. Neither the Informal Survey firms northe Enterprise Survey firms consider access to land, registration procedures,crime, low workforce skills, labor regulations (with the exception of bigfirms), or the legal system to be major obstacles to doing business (againwith the exception of big firms).
There are some significant differences as well. Informal Survey firmsconsider access to or availability of markets to be a huge problem. Theunregistered Informal Survey firms do not consider taxes or tax adminis-tration to be a huge problem, in obvious contrast to the registered firms.Corruption is a smaller problem for the unregistered firms than for the reg-istered ones. Indeed, both tax administration and corruption are perceivedas more serious obstacles by big firms than by small ones (but only differ-ences in the perception of tax administration as an obstacle are statisticallysignificant).
We can also use the information on obstacles to shed light on the para-site theory of the informal economy. Unfortunately, the question asked inthe surveys is not ideal. Respondents assess on a 0-to-4 scale whether“anticompetitive and informal practices” are an obstacle to their business.Of course, anticompetitive practices can come not only from the informalfirms, but also from formal firms with political or other connections.Nevertheless, several points emerge from these data. First, contrary to theparasite view, “anticompetitive and informal” practices are not among thekey obstacles perceived by managers of firms in either the Informal Surveyfirms (the average score is 1.78) or their Enterprise Survey control group(1.94).53 Second, the answer is only slightly higher for the EnterpriseSurvey firms than for the Informal Survey firms, which is not consistentwith the view that the informal firms undercut the formal ones. Third, onemight have guessed that it is the small registered firms in the EnterpriseSurvey that would be most severely affected by the informal firms. How-ever, these firms perceive anticompetitive and informal practices to be asmaller problem, on average, than do the larger firms. None of this evidenceis supportive of the parasite theory. The patterns in the Micro Survey aresimilar to those in the Informal Survey (except that some of the questionsdiffer). Access to financing and electricity emerge as by far the greatest
342 Brookings Papers on Economic Activity, Fall 2008
53. Among big firms, concern over “anticompetitive or informal practices” ranks afterconcerns over tax rates, tax administration, cost of financing, corruption, macroeconomicinstability, and electricity. On the other hand, it ranks ahead of, among other things, con-cerns over economic policy uncertainty, customs and trade regulations, access to financing,and crime, theft, and disorder.
11472-06_La Porta_rev2.qxd 3/6/09 1:13 PM Page 342
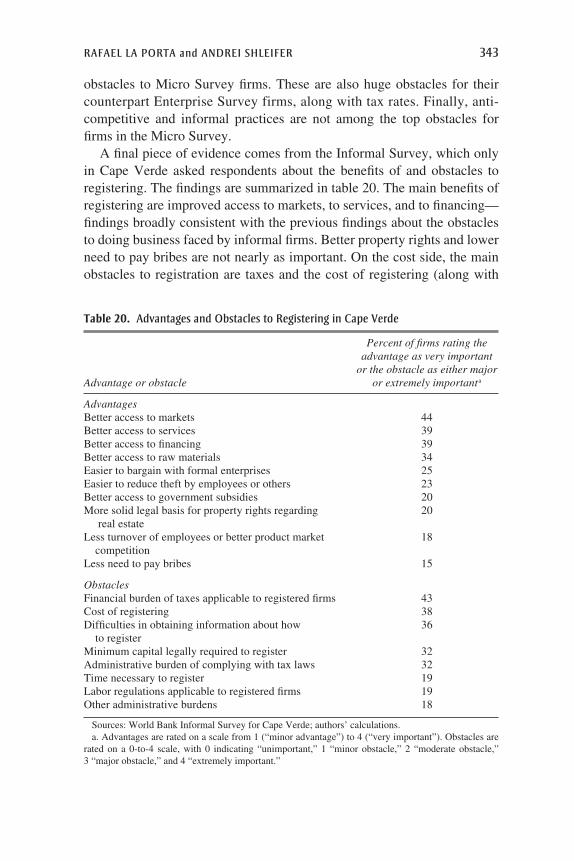
obstacles to Micro Survey firms. These are also huge obstacles for theircounterpart Enterprise Survey firms, along with tax rates. Finally, anti-competitive and informal practices are not among the top obstacles forfirms in the Micro Survey.
A final piece of evidence comes from the Informal Survey, which onlyin Cape Verde asked respondents about the benefits of and obstacles toregistering. The findings are summarized in table 20. The main benefits ofregistering are improved access to markets, to services, and to financing—findings broadly consistent with the previous findings about the obstaclesto doing business faced by informal firms. Better property rights and lowerneed to pay bribes are not nearly as important. On the cost side, the mainobstacles to registration are taxes and the cost of registering (along with
RAFAEL LA PORTA and ANDREI SHLEIFER 343
Table 20. Advantages and Obstacles to Registering in Cape Verde
Percent of firms rating the advantage as very important
or the obstacle as either major Advantage or obstacle or extremely importanta
AdvantagesBetter access to markets 44Better access to services 39Better access to financing 39Better access to raw materials 34Easier to bargain with formal enterprises 25Easier to reduce theft by employees or others 23Better access to government subsidies 20More solid legal basis for property rights regarding 20
real estateLess turnover of employees or better product market 18
competitionLess need to pay bribes 15
ObstaclesFinancial burden of taxes applicable to registered firms 43Cost of registering 38Difficulties in obtaining information about how 36
to registerMinimum capital legally required to register 32Administrative burden of complying with tax laws 32Time necessary to register 19Labor regulations applicable to registered firms 19Other administrative burdens 18
Sources: World Bank Informal Survey for Cape Verde; authors’ calculations.a. Advantages are rated on a scale from 1 (“minor advantage”) to 4 (“very important”). Obstacles are
rated on a 0-to-4 scale, with 0 indicating “unimportant,” 1 “minor obstacle,” 2 “moderate obstacle,” 3 “major obstacle,” and 4 “extremely important.”
11472-06_La Porta_rev2.qxd 3/6/09 1:13 PM Page 343
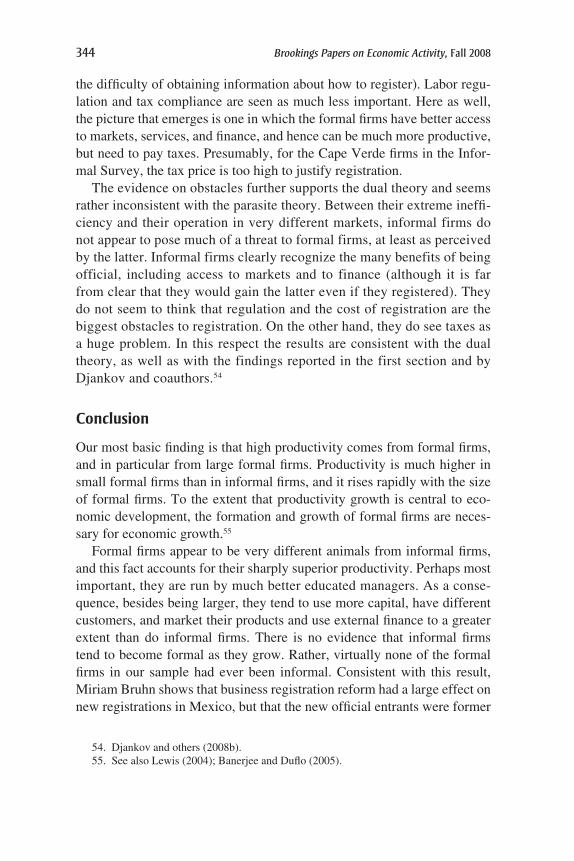
the difficulty of obtaining information about how to register). Labor regu-lation and tax compliance are seen as much less important. Here as well,the picture that emerges is one in which the formal firms have better accessto markets, services, and finance, and hence can be much more productive,but need to pay taxes. Presumably, for the Cape Verde firms in the Infor-mal Survey, the tax price is too high to justify registration.
The evidence on obstacles further supports the dual theory and seemsrather inconsistent with the parasite theory. Between their extreme ineffi-ciency and their operation in very different markets, informal firms donot appear to pose much of a threat to formal firms, at least as perceivedby the latter. Informal firms clearly recognize the many benefits of beingofficial, including access to markets and to finance (although it is farfrom clear that they would gain the latter even if they registered). Theydo not seem to think that regulation and the cost of registration are thebiggest obstacles to registration. On the other hand, they do see taxes asa huge problem. In this respect the results are consistent with the dualtheory, as well as with the findings reported in the first section and byDjankov and coauthors.54
Conclusion
Our most basic finding is that high productivity comes from formal firms,and in particular from large formal firms. Productivity is much higher insmall formal firms than in informal firms, and it rises rapidly with the sizeof formal firms. To the extent that productivity growth is central to eco-nomic development, the formation and growth of formal firms are neces-sary for economic growth.55
Formal firms appear to be very different animals from informal firms,and this fact accounts for their sharply superior productivity. Perhaps mostimportant, they are run by much better educated managers. As a conse-quence, besides being larger, they tend to use more capital, have differentcustomers, and market their products and use external finance to a greaterextent than do informal firms. There is no evidence that informal firmstend to become formal as they grow. Rather, virtually none of the formalfirms in our sample had ever been informal. Consistent with this result,Miriam Bruhn shows that business registration reform had a large effect onnew registrations in Mexico, but that the new official entrants were former
344 Brookings Papers on Economic Activity, Fall 2008
54. Djankov and others (2008b).55. See also Lewis (2004); Banerjee and Duflo (2005).
11472-06_La Porta_rev2.qxd 3/6/09 1:13 PM Page 344
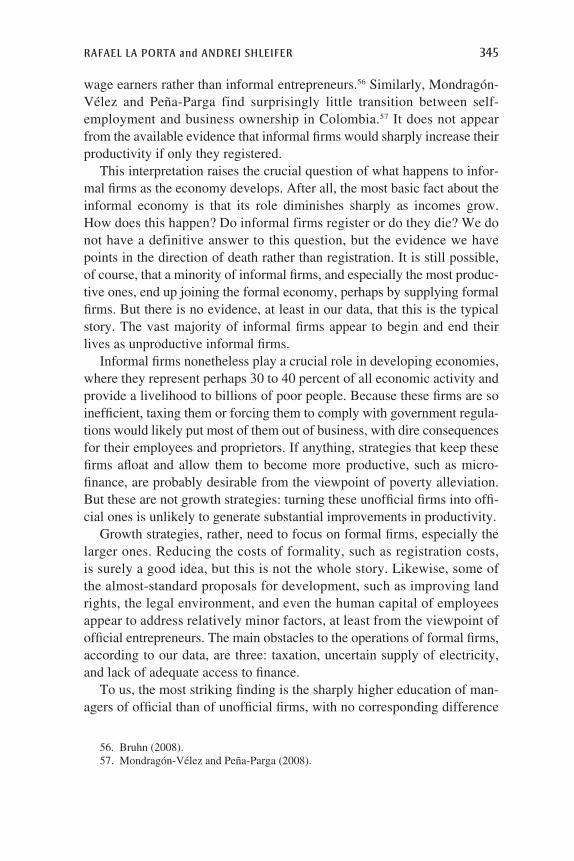
wage earners rather than informal entrepreneurs.56 Similarly, Mondragón-Vélez and Peña-Parga find surprisingly little transition between self-employment and business ownership in Colombia.57 It does not appearfrom the available evidence that informal firms would sharply increase theirproductivity if only they registered.
This interpretation raises the crucial question of what happens to infor-mal firms as the economy develops. After all, the most basic fact about theinformal economy is that its role diminishes sharply as incomes grow.How does this happen? Do informal firms register or do they die? We donot have a definitive answer to this question, but the evidence we havepoints in the direction of death rather than registration. It is still possible,of course, that a minority of informal firms, and especially the most produc-tive ones, end up joining the formal economy, perhaps by supplying formalfirms. But there is no evidence, at least in our data, that this is the typicalstory. The vast majority of informal firms appear to begin and end theirlives as unproductive informal firms.
Informal firms nonetheless play a crucial role in developing economies,where they represent perhaps 30 to 40 percent of all economic activity andprovide a livelihood to billions of poor people. Because these firms are soinefficient, taxing them or forcing them to comply with government regula-tions would likely put most of them out of business, with dire consequencesfor their employees and proprietors. If anything, strategies that keep thesefirms afloat and allow them to become more productive, such as micro-finance, are probably desirable from the viewpoint of poverty alleviation.But these are not growth strategies: turning these unofficial firms into offi-cial ones is unlikely to generate substantial improvements in productivity.
Growth strategies, rather, need to focus on formal firms, especially thelarger ones. Reducing the costs of formality, such as registration costs,is surely a good idea, but this is not the whole story. Likewise, some ofthe almost-standard proposals for development, such as improving landrights, the legal environment, and even the human capital of employeesappear to address relatively minor factors, at least from the viewpoint ofofficial entrepreneurs. The main obstacles to the operations of formal firms,according to our data, are three: taxation, uncertain supply of electricity,and lack of adequate access to finance.
To us, the most striking finding is the sharply higher education of man-agers of official than of unofficial firms, with no corresponding difference
RAFAEL LA PORTA and ANDREI SHLEIFER 345
56. Bruhn (2008).57. Mondragón-Vélez and Peña-Parga (2008).
11472-06_La Porta_rev2.qxd 3/6/09 1:13 PM Page 345
in the human capital of the employees. This suggests that educationalpolicies, particularly those emphasizing secondary education, might beconducive to the formation of entrepreneurial talent that can run formalfirms. We do not mean to suggest that formal education is either a necessaryor a sufficient condition for entrepreneurial skills. But the data seem toindicate quite clearly that some aspects of management (for example, mar-keting and finance) require education. One can also think of other sourcesof human capital, such as immigration, as supplying the required entrepre-neurial talent.
There is growing evidence that corporate income taxation deters invest-ment and formal entrepreneurship. Using a new dataset of corporate incometaxes in a large number of countries, Djankov and coauthors find strongevidence that these taxes reduce investment, foreign direct investment, andentrepreneurial activity.58 Our evidence similarly shows that official firmsperceive taxation as the top obstacle to doing business. To the extent thatthe formation and growth of official firms are the principal engines ofdevelopment, this perception must be taken seriously. Needless to say, oneneeds to also think about alternative sources of public finance, as well asthe size of government, in developing countries to determine whether cor-porate income tax cuts are warranted. But the evidence points to a poten-tially serious problem.
The evidence also suggests that official firms, just like unofficial ones,perceive lack of access to finance to be a serious obstacle to doing business.Recent research has pointed to a broad range of legal and regulatoryreforms that can underpin the development of financial markets; in generalthese reforms seek to improve the legal rights of creditors and (in the caseof very large firms) shareholders.59 Unlike with tax cuts, there seem to beno compelling counterarguments to improving the laws and institutions thatsupport financial markets.
Finally, the evidence indicates that problems with electricity supply,including disruptions, afflict unofficial as well as smaller official firms. Thiscontrasts with an interesting lack of concern on the part of respondents withother limitations of infrastructure, such as transport, telephone, and mail.Most large firms have their own generators, whereas smaller official firmsand unofficial firms do not and hence are more vulnerable.
The overall picture of economic development that emerges from thisanalysis is in many ways similar to the traditional pre-growth theory devel-
346 Brookings Papers on Economic Activity, Fall 2008
58. Djankov and others (2008b).59. See La Porta, Lopez-de-Silanes, and Shleifer (2008) for a survey.
11472-06_La Porta_rev2.qxd 3/6/09 1:13 PM Page 346
opment economics, although it is related to the modern reformulations ofeconomic growth through the lens of development economics.60 The recipefor productivity growth is the formation of official firms—the larger andthe more productive, the better. Their formation must perhaps be promotedthrough tax, human capital, infrastructure, and capital markets policies,very much along the lines of traditional dual economy theories. Fromthe perspective of economic growth, one should not expect much from theunofficial economy, with its millions of entrepreneurs, except to hope thatit disappears over time. This “Wal-Mart” theory of economic developmentreceives quite a bit of support from firm-level data.
ACKNOWLEDGMENTS We are grateful to Nicholas Coleman for excel-lent research assistance, to Jorge Rodriguez Mesa for help with the WorldBank surveys, and to Charles Jones, Peter Klenow, James Rauch, Jeremy Stein,and William Nordhaus for helpful comments. This research was supported bythe Kauffman Foundation.
RAFAEL LA PORTA and ANDREI SHLEIFER 347
60. Banerjee and Duflo (2005).
11472-06_La Porta_rev2.qxd 3/6/09 1:13 PM Page 347
AP
PE
ND
IXTa
ble
A1.
Corr
elat
ions
am
ong
the
Mai
n Va
riab
lesa
Cor
rela
tion
coef
ficie
nts
Info
rmal
Se
lf-
Reg
iste
red
Pro
cedu
res
Hou
rs p
er
shar
e of
em
ploy
ed
firm
s ne
cess
ary
Tax
es a
s ye
ar n
eede
d M
anag
emen
t G
DP
from
T
ax
as s
hare
of
Ele
ctri
city
M
ulti
ple
per
1,00
0 to
sta
rt
perc
ent
to c
ompl
y ti
me
deal
ing
Var
iabl
eW
EF
sur
vey
evas
ionb
labo
r fo
rce
cons
umpt
ion
indi
cato
rspo
pula
tion
a bu
sine
ssof
pro
fits
wit
h ta
xes
wit
h re
gula
tion
s
Tax
eva
sion
b0.
25**
Sel
f-em
ploy
ed a
s sh
are
0.70
***
0.25
**of
labo
r fo
rce
Info
rmal
sha
re o
f G
DP
, 0.
61**
*0.
35**
0.61
***
from
ele
ctri
city
Info
rmal
sha
re o
f G
DP
, 0.
70**
*0.
170.
47**
*0.
71**
*m
ulti
ple
indi
cato
rsR
egis
tere
d fi
rms
per
−0.4
3***
−0.1
6−0
.46*
**−0
.21
−0.3
8***
1,00
0 po
pula
tion
Pro
cedu
res
nece
ssar
y 0.
48**
*0.
32**
*0.
37**
*0.
30**
0.37
***
−0.5
0***
to s
tart
a b
usin
ess
Tax
es a
s pe
rcen
t of
profi
ts0.
16*
0.17
*−0
.04
−0.1
30.
16*
−0.1
9*0.
15*
Hou
rs p
er y
ear
need
ed to
0.
50**
*−0
.02
0.34
***
0.42
***
0.37
***
−0.4
2***
0.38
***
0.22
***
com
ply
wit
h ta
xes
Man
agem
ent t
ime
deal
ing
0.43
***
0.14
0.26
**0.
240.
20*
−0.0
60.
150.
000.
20*
wit
h re
gula
tion
sIn
dex
of d
iffi
cult
y of
0.
32**
*0.
050.
100.
130.
34**
*−0
.10
0.26
***
0.11
0.26
***
0.24
**hi
ring
a n
ew w
orke
rIn
dex
of d
iffi
cult
y of
0.
23**
0.01
0.14
0.08
0.20
**−0
.25*
*0.
27**
*0.
20**
0.32
***
0.28
***
firi
ng a
wor
ker
Non
wag
e co
sts
as p
erce
nt
−0.1
0−0
.16
−0.2
6***
−0.2
0−0
.08
0.05
−0.0
10.
18**
0.27
***
0.02
of s
alar
yS
teps
req
uire
d to
col
lect
0.
36**
*0.
090.
25**
0.30
**0.
39**
*−0
.18
0.45
***
0.27
***
0.36
***
0.46
***
on a
bou
nced
che
ckE
ffici
ency
of
bank
rupt
cy
−0.6
4***
−0.3
2**
−0.5
9***
−0.4
6***
−0.5
7***
0.35
***
−0.5
4***
−0.1
5−0
.37*
**−0
.35*
**pr
oced
ure
Info
rmal
sha
re o
f GD
Pes
tim
ated
from
11472-06_La Porta_rev2.qxd 3/6/09 1:13 PM Page 348

Log
of
pave
d ro
ads
−0.2
8***
−0.1
1−0
.24*
**−0
.22*
−0.2
0**
0.29
***
−0.1
8**
−0.0
9−0
.33*
**−0
.03
per
km2
Cor
rupt
ion
inde
x−0
.84*
**−0
.32*
**−0
.67*
**−0
.58*
**−0
.71*
**0.
48**
*−0
.57*
**−0
.23*
**−0
.43*
**−0
.26*
Rul
e of
law
inde
x−0
.85*
**−0
.29*
**−0
.68*
**−0
.58*
**−0
.72*
**0.
49**
*−0
.59*
**−0
.26*
**−0
.44*
**−0
.29*
**P
riva
te c
redi
t as
perc
ent
−0.6
7***
−0.2
8***
−0.4
9***
−0.3
8***
−0.6
0***
0.43
***
−0.4
3***
−0.1
8*−0
.31*
**−0
.25*
of G
DP
Mar
ket c
apit
aliz
atio
n as
−0
.54*
**−0
.16
−0.3
9***
−0.3
7***
−0.5
1***
0.21
*−0
.38*
**−0
.09
−0.3
6***
−0.1
9pe
rcen
t of
GD
PL
og o
f G
DP
per
cap
ita
−0.7
7***
−0.3
4***
−0.7
7***
−0.6
6***
−0.6
6***
0.52
***
−0.4
5***
−0.2
7***
−0.3
0***
−0.1
3
Step
s In
dex
of
Inde
x of
N
onw
age
requ
ired
to
Log
of
Pri
vate
M
arke
t di
fficu
lty
diffi
cult
yco
sts
as
coll
ect o
n E
ffici
ency
of
pave
d R
ule
cred
it
capi
tali
zati
on
of h
irin
g a
of fi
ring
pe
rcen
t a
boun
ced
bank
rupt
cyro
ads
Cor
rupt
ion
of la
w
as p
erce
nt
as p
erce
nt
Var
iabl
ene
w w
orke
ra
wor
ker
of s
alar
ych
eck
proc
edur
epe
r km
2in
dex
inde
xof
GD
Pof
GD
P
Inde
x of
dif
ficu
lty
of
0.36
***
firi
ng a
wor
ker
Non
wag
e co
sts
as
0.21
***
0.22
***
perc
ent o
f sa
lary
Ste
ps r
equi
red
to c
olle
ct
0.47
***
0.38
***
0.21
*on
a b
ounc
ed c
heck
Effi
cien
cy o
f ba
nkru
ptcy
−0
.37*
**−0
.15
−0.1
0−0
.56*
**pr
oced
ure
Log
of
pave
d ro
ads
−0.1
2−0
.15*
−0.1
3−0
.26*
0.29
***
per
km2
Cor
rupt
ion
inde
x−0
.23*
**−0
.21*
**0.
08−0
.37*
**0.
76**
*0.
29**
*R
ule
of la
w in
dex
−0.2
5***
−0.2
5***
0.08
−0.3
9***
0.76
***
0.31
***
0.96
***
Pri
vate
cre
dit a
s pe
rcen
t −0
.26*
**−0
.21*
**−0
.03
−0.3
9***
0.61
***
0.27
***
0.74
***
0.75
***
of G
DP
Mar
ket c
apit
aliz
atio
n as
−0
.24*
−0.1
7*−0
.08
−0.5
1***
0.52
***
0.46
***
0.62
***
0.59
***
0.71
***
perc
ent o
f G
DP
Log
of
GD
P p
er c
apit
a−0
.25*
**−0
.22*
**0.
21**
*−0
.22*
*0.
73**
*0.
27**
*0.
83**
*0.
84**
*0.
70**
*0.
52**
*
Sour
ce: A
utho
rs’
calc
ulat
ions
.a.
Ast
eris
ks in
dica
te s
tatis
tical
ly s
igni
fican
tly d
iffe
rent
fro
m z
ero
at th
e *1
0 pe
rcen
t, **
5 pe
rcen
t, an
d **
*1 p
erce
nt le
vel.
b. C
alcu
late
d as
1 m
inus
the
shar
e of
sal
es r
epor
ted
for
tax
purp
oses
.
11472-06_La Porta_rev2.qxd 3/6/09 1:13 PM Page 349
References
Almeida, Rita, and Pedro Manuel Carneiro. 2006. “Enforcement of Regulation,Informal Labour, Firm Size and Firm Performance.” Discussion Paper 5976.London: Centre for Economic Policy Research (December).
Amaral, Pedro, and Erwan Quintin. 2006. “A Competitive Model of the InformalSector.” Journal of Monetary Economics 53, no. 7: 1541–53.
Baily, Martin, Diana Farrell, and Jaana Remes. 2005. “Domestic Services: TheHidden Key to Growth.” Washington: McKinsey Global Institute.
Banerjee, Abhijit, and Esther Duflo. 2005. “Growth Theory through the Lens ofDevelopment Economics.” In Handbook of Economic Growth, vol. 1A, editedby Steve Durlauf and Philippe Aghion. Amsterdam: Elsevier Science.
———. 2007. “The Economic Lives of the Poor.” Journal of Economic Perspec-tives 21, no. 1: 141–67.
Bennett, John, and Saul Estrin. 2007. “Informality as a Stepping Stone: Entrepre-neurial Entry in a Developing Economy.” Discussion Paper 2950. Bonn: Insti-tute for the Study of Labor (July).
Bernard, Andrew, Jonathan Eaton, J. Bradford Jensen, and Samuel Kortum. 2003.“Plants and Productivity in International Trade.” American Economic Review 93,no. 4: 1268–90.
Botero, Juan, Simeon Djankov, Rafael La Porta, Florencio Lopez-de-Silanes, andAndrei Shleifer. 2004. “The Regulation of Labor.” Quarterly Journal of Eco-nomics 119, no. 4: 1339–82.
Bruhn, Miriam. 2008. “License to Sell: The Effect of Business Registration Reformon Entrepreneurial Activity in Mexico.” Policy Research Working Paper 4538.Washington: World Bank.
Dabla-Norris, Era, Mark Gradstein, and Gabriela Inchauste. 2008. “What CausesFirms to Hide Output? The Determinants of Informality.” Journal of Develop-ment Economics 85, no. 1: 1–27.
De Mel, Suresh, David J. McKenzie, and Christopher Woodruff. 2007. “MeasuringMicroenterprise Profits: Don’t Ask How the Sausage Is Made.” Policy ResearchWorking Paper 4229. Washington: World Bank.
De Paula, Áureo, and José Scheinkman. 2008. “The Informal Sector.” WorkingPaper 08-018. Philadelphia: Penn Institute for Economic Research (May).
De Soto, Hernando. 1989. The Other Path: The Invisible Revolution in the ThirdWorld. New York: Harper and Row.
———. 2000. The Mystery of Capital: Why Capitalism Triumphs in the West andFails Everywhere Else. New York: Basic Books.
Djankov, Simeon, Rafael La Porta, Florencio Lopez-de-Silanes, and AndreiShleifer. 2002. “The Regulation of Entry.” Quarterly Journal of Economics 117,no. 1: 1–37.
———. 2003. “Courts.” Quarterly Journal of Economics 118, no. 2: 453–517.
Djankov, Simeon, Oliver Hart, Caralee McLiesh, and Andrei Shleifer. 2008a.“Debt Enforcement around the World.” Journal of Political Economy 116, no. 6: 1105–49.
350 Brookings Papers on Economic Activity, Fall 2008
11472-06_La Porta_rev2.qxd 3/6/09 1:13 PM Page 350
Djankov, Simeon, Tim Ganser, Caralee McLiesh, Rita Ramalho, and AndreiShleifer. 2008b. “The Effect of Corporate Taxes on Investment and Entrepre-neurship.” Working Paper 13756. Cambridge, Mass.: National Bureau of Eco-nomic Research (January).
Ernste, Dominik, and Friedrich Schneider. 1998. “Increasing Shadow EconomiesAll Over the World—Fiction or Reality.” Discussion Paper 26. Bonn: Institutefor the Study of Labor (December).
Fajnzylber, P., W. F. Maloney, and G. V. Montes Rojas. 2006. “Does FormalityImprove Microfirm Performance? Quasi-experimental Evidence from theBrazilian SIMPLES Program.” World Bank, Washington.
Farrell, Diana. 2004. “The Hidden Dangers of the Informal Economy.” McKinseyQuarterly 2004, no. 3: 26–37.
Foster, Lucia, John Haltiwanger, and Chad Syverson. 2008. “Reallocation, FirmTurnover, and Efficiency: Selection on Productivity or Profitability?” AmericanEconomic Review 98, no. 1: 394–425.
Friedman, Eric, Simon Johnson, Daniel Kaufmann, and Pablo Zoido-Lobaton.2001. “Dodging the Grabbing Hand: The Determinants of Unofficial Activityin 69 Countries.” Journal of Public Economics 76, no. 3: 459–93.
Harris, John, and Michael Todaro. 1970. “Migration, Unemployment andDevelopment: A Two-Sector Analysis.” American Economic Review 60, no. 1: 126–42.
Hsieh, Chang-Tai, and Peter Klenow. 2007. “Misallocation and ManufacturingTFP in China and India.” Working Paper W13290. Cambridge, Mass.: NationalBureau of Economic Research.
International Labour Office. 2007. Key Indicators of the Labour Market, 5th ed.CD-ROM version. Geneva.
Johnson, Simon, Daniel Kaufmann, and Andrei Shleifer. 1997. “The UnofficialEconomy in Transition.” BPEA, no. 2: 159–221.
Katayama, Hajime, Shihua Lu, and James Tybout. 2006. “Firm-level ProductivityStudies: Illusions and a Solution.” Penn State University.
Kaufmann, Daniel, Aart Kraay, and Massimo Mastruzzi. 2005. “GovernanceMatters IV: Governance Indicators for 1996–2004.” Policy Research WorkingPaper 3630. Washington: World Bank (May).
Klette, Tor Jakob, and Zvi Griliches. 1996. “The Inconsistency of Common ScaleEstimators When Output Prices Are Unobserved and Endogenous.” Journal ofApplied Econometrics 11, no. 4: 343–61.
La Porta, Rafael, Florencio Lopez-de-Silanes, and Andrei Shleifer. 2008. “TheEconomic Consequences of Legal Origins.” Journal of Economic Literature 46,no. 2: 285–332.
Lewis, William. 2004. The Power of Productivity: Wealth, Poverty, and the Threatto Global Stability. University of Chicago Press.
Loayza, Norman. 1996. “The Economics of the Informal Sector: A Simple Modeland Some Empirical Evidence from Latin America.” Carnegie-Rochester Con-ference Series on Public Policy 45, no. 1: 129–62.
RAFAEL LA PORTA and ANDREI SHLEIFER 351
11472-06_La Porta_rev2.qxd 3/6/09 1:13 PM Page 351
Loayza, Norman, and Jamele Rigolini. 2006. “Informality Trends and Cycles.”Policy Research Working Paper 4078. Washington: World Bank (December).
Lucas, Jr., Robert E. 1978. “On the Size Distribution of Business Firms.” BellJournal of Economics 9, no. 2: 508–23.
Mondragón-Vélez, Camilo, and Ximena Peña-Parga. 2008. “Business Ownershipand Self-employment in Developing Economies: The Colombian Case.” Docu-mentos CEDE. Universidad de los Andes.
Monteiro, Joana, and Juliano Assunção. 2006. “Outgrowing the Shadows: Esti-mating the Impact of Bureaucratic Simplification and Tax Cuts on Informalityand Investment.” Department of Economics, Pontifica Universidade Católica,Rio de Janeiro.
Murphy, Kevin, Andrei Shleifer, and Robert Vishny. 1989. “Industrialization andthe Big Push.” Journal of Political Economy 97, no. 5: 1003–26.
Rauch, James. 1991. “Modeling the Informal Sector Formally.” Journal of Devel-opment Economics 35, no. 1: 33–47.
Rosenstein-Rodan, Paul. 1943. “Problems of Industrialization of Eastern andSouth-Eastern Europe.” Economic Journal 53, no. 210/211: 202–11.
Rostow, Walt. 1960. Stages of Economic Growth: A Non-Communist Manifesto.Cambridge University Press.
Russo, Francesco. 2008. “The Cost of the Legal System and the Hidden Economy.”Boston University.
Schneider, Friedrich. 2007. “Shadow Economies and Corruption All Over theWorld: New Estimates for 145 Countries.” Economics: The Open-Access, Open-Assessment E-Journal 1 (2007–09). www.economics-ejournal.org/economics/journalarticles/2007–9.
Tokman, Victor. 1992. Beyond Regulation: The Informal Economy in Latin America.Boulder, Colo.: Lynne Rienner.
United Nations. 2008. “Making the Law Work for Everyone.” Report of the Com-mission on Legal Empowerment of the Poor, vol. 1. New York.
World Bank. 2007. Doing Business 2008. Washington: World Bank.World Economic Forum. 2007. Global Competitiveness Report 2006–2007. Geneva.
352 Brookings Papers on Economic Activity, Fall 2008
11472-06_La Porta_rev2.qxd 3/6/09 1:13 PM Page 352

![Expectations of Returns and Expected Returnsscholar.harvard.edu/files/shleifer/files/expectations_of_returns... · [10:53 19/2/2014 RFS-hht082.tex] Page: 714 714–746 Expectations](https://img.pdfslide.net/doc/110x75/5b043e737f8b9a89208d4de5/expectations-of-returns-and-expected-1053-1922014-rfs-hht082tex-page-714-714746.jpg)