Embed Size (px)
Citation preview

,
I 1
I
r-
I 1 .. L .
ASSESSMENT OF THE EFFECTS OF HOUSEHOLD CHEMICALS UPON
I N D I V I D U A L SEPTIC TANK PERFORMANCES
t l . A. Gross Department of Electronics and Instrumentation
University of Arkansas a t L i t t l e Rock
P.O. Box 3017 L i t t l e Rock, AR 72203
- . Graduate Ins t i t u t e of Technology
Research Project Technical Completion Report Project G-1212-07
The research on which this report i s based was financed i n p a r t by the United States Department of the Inter ior as authorized by the Water Research and Development Act of 1978 (P.L. 95-467).
Arkansas Glater Resources Research Center
112 Ozark Hall Fayettevi 11 e , AR 72701
. University of Arkansas
Publication No. 131
June, 1987
Contents of t h i s publication do not necessarily re f lec t the views and policies of the U.S. Department o f the Inter ior , nor does mention of trade names or corrnnercial products const i tute the i r endorsement or recommendation f o r use by the U.S. Government.
The University of Arkansas, i n compliance w i t h federal and s ta te laws and regulations governing affirmative action and nondiscr imina t ion , does not discriminate in the recruitment, admission and employment o f students, faculty and s ta f f i n the operation of any of i t s educational programs and a c t i v i t i e s as defined by law. Accordingly, nothing i n th i s publication should be viewed as direct ly or indirectly expressing any l imitat ion, specification or discrimination as t o race, religion, color or national o r i g i n ; or t o handicap, age, sex, or status as a dis- abled Vietnam-era veteran, except as provided by law. Inquiries con- cerning th i s policy may be directed to the Affirmative Action Officer.

ABSTRACT
11
! ? ! I - .
ASSESSMENT OF THE EFFECTS OF HOUSEHOLD CHEMICALS UPON INDIVIDUAL SEPTIC TANK PERFORMNCES
A laboratory study and a f i e ld study were performed t o determine the amounts of specif ic household chemicals required t o destroy bacteria populations i n individual domestic sep t ic t a n k s . The particular chem- icals evaluated include l iquid chlorine bleach, High Test Hypochlorite (HTH), Lysol dis infectant and Drano c rys ta l . The laboratory study was performed to determine the approximate chemical concentrations t o de- stroy the bacteria i n the sept ic t a n k , and the f i e l d study showed the actual effect of the chemicals upon the bacteria i n terms of reduction of the number of bacteria i n the sept ic t a n k as well as the time re- quired fo r the bacterial population to recover. A l iquid bleach con- centration of 1.85 ml/l destroyed the bacteria i n the sept ic t a n k s . T h i s corresponds t o 7 l i t e r s (1.85 gallons) of l i q u i d bleach in a 3780 l i t e r (1000 gallon) sept ic tank. After addition of chlorine bleach, and w i t h i n approximately 30 hours of normal sept ic system usage-, the bacterial population had recovered t o i t s original concentration. A Lysol concentration of 5.0 ml/l destroyed the bacteria i n the domestic t a n k s . This corresponds to 19 l i t e r s (5.0 gallons) of Lysol in a 3780 (1000 gallon) sept ic t a n k . ter ia population recovered to i t s original concentration within approx- imately 60 hours (2.5 days). A Drano concentration of 3.0 mg/l destroys . the bacteria i n a sept ic t a n k . ounces) i n a 3780 l i t e r (1000 gallon) sep t ic t a n k . The bacterial popu- lation recovers t o i t s original concentration w i t h i n 48 hours following the addition of the Drano.
Following the addition of Lysol, the bac-
This corresponds t o 11.3 grams (0.4
M. A . Gross
Completion Report t o the U . S. Department of the In te r ior , Reston, VA, June 1987
Keywords -- Septic Tanks/Bacteria/Househol d Chemicals
I
L .
i

TABLE OF CONTENTS
Page
I
!
I
i A b s t r a c t . . . . . . . . . . . . . . . . . . . . . . . . . . . . List of Figures . . . . . . . . . . . . . . . . . . . . . . . . i i i
List o f Tables . . . . . . . . . . . . . . . . . . . . . . . . . i i i
In t roduc t ion . . . . . . . . . . . . . . . . . . . . . . . . . . . 1
A . Purpose and Objectives . . . . . . . . . . . . . . . . . 3
B. Related Research and Activit ies . . . . . . . . . . . . . 4
nethods and Procedures . . . . . . . . . . . . . . . . . . . . . 5
A . Laboratory Study . . . . . . . . . . . . . . . . . . . . 5
8. Field Study . . . . . . . . . . . . . . . . . . . . . . . 8
Principal Findings and Significance . . . . . . . . . . . . . . 11
A . L i q u i d Bleach Study . . . . . . . . . . . . . . . . . . . 11
B. Lysol Study . . . . . . . . . . . . . . . . . . . . . . . .15
C . Drano Study . . . . . . . . . . . . . . . . . . . . . . . 17
Conclusions . . . . . . . . . . . . . . . . . . . . . . . . . . 20
Literature Cited . . . . . . . . . . . . . . . . . . . . . . . . 22 . .
i i . '
c .

. .
i
1
I '
LIST OF FIGURES Page
Figure 1. Typical Domestic Septic Tank . . . . . . . . . . . 10
LIST OF TABLES ..
Table I . Tank Volumes . . . . . . . . . . . . . . . . . . . 8
Table 11. Experimental Study on the Effect of Liquid Bleach on STE . . . . . . . . . . . . . . . . . . 12
Table 111. Field Study on the Effect of L i q u i d Bleach on Sept ic Tank Performance . . . . . . . . . . . . 13
Tablp IV. Experimental Study on the Effect of Lysol
Table V. Field Study on the Effect of Lysol on
Table VI. Experimental Study on the Effect of Drano
o n S T E . . . . . . . . . . . . . . . . . . . . . . 16
Septic Tank Performance . . . . . . . . . . . . . 18
o n S T E . . . . . . . . . . . . . . . . . . . . . . 19
Table VII. Field Study on the Effect of Drano on Septic Tank Performance . . . . . . . . . . . . . 20
3780 L i t e r Domestic Septic Tank . . . . . . . . . 2 1
...
Table VIII. Chemical Dosage t o Destroy Bacteria in a - .
Table IX. Maximum Recommended Chemical Dosages f o r a 3780 L i t e r Domestic Septic Tank . . . . . . . . . . 21
i .
. . i i i

INTRODUCTION
Approximately one-third of the households in the United States use
r
I ' 1 .
onsite wastewater treatment and disposal as the treatment mechanism fo r
domestic sewage. I n Arkansas, approximately forty-two percent of the
homes use onsite wastewater treatment (Arkansas S ta t i s t ica l Abstract,
1986). General l y , the individual household onsi t e wastewater treatment
and disposal takes the form of a sept ic tank followed by a soil absorp-
tion system. Through the course of u s i n g a sept ic t a n k , pumping of the
solids t h a t accumulate i n t h e t a n k i s necessary, and the recommended
pumping schedule i s every three t o f i ve years (U.S. Public H e a l t h Ser-
vice, 1972).
Homeowners with sept ic t a n k s are continually confronted w i t h ad-
vertisements and so l ic i ta t ion by manufacturers of products claimed t o
be capable of enhancing sept ic t a n k functions. The claims range from
rejuvenating the bacteria t o eliminating the need for pumping solids
from the sept ic tank.
.-... ...
I
Although these claims are made, some states have
published statements forewarning homeowners of these claims. Tennessee
s t a t e s , "There a re no known chemicals, yeasts , o r other substances cap-
able of eliminating or reducing sol ids i n a sept ic t a n k so t h a t clean-
i n g i s unnecessary" (State of Tennessee Department of Pub1 i c Health) e
The Agricultural Extension Service of the University of Minnesota s ta tes
" A ' s t a r t e r ' is not needed for bacterial ac t ion t o begin i n a septic
t a n k . Many bacteria a re present i n the materials deposited into the
t a n k and will thr ive under the growth conditions present. Additives ,
should not be used, since they are of no benefit and some may do great I .
1

. .
I
[
L ,
I '
. -
harm.
to increase i n volume will resul t i n the sludge being flushed o u t i n t o
the drainf ie ld , p l u g g i n g soil pores. Other additives, particularly de-
greasers , may be carcinogens (cancer-causing) or suspected carcinogens
tha t will flow d i rec t ly into the ground water a long with t h e treated
sewage" (Machmeier , 1983).
Additives t h a t cause the accumulated sludge i n t h e t a n k bottom
The claims of the advertisements f o r septic t a n k additives are
sometimes based upon the success of u s i n g acclimated bacteria, sometimes
cal l ed "superbugs" , t o clean grease from sanitary sewers (Grease-Eaters
Clear Sewers, 1982).
t o reduce sludge volumes associated w i t h aerobic biodegradation of do-
mestic and industrial wastes (Grubbs, 1983; Chambers, 1981). Based upon
industrial and municipal a p p l ications such as these, manufacturers market
,
Specialized bacterial cultures have also been used
sept ic t a n k additives t o reduce or eliminate the need for pumping the
t a n k , increase bacterial action, reduce scum accumulations, unclog leach
f i e l d s , clean and deodorize the system and dissolve grease, proteins,
f a t and starch.
The reason given fo r the improper functioning of domestic septic
t a n k s i s the addition of household chemicals t o the septic system.
claims are made t h a t household chemicals and disinfectants destroy the
The
bacterial population i n individual household septic tanks a n d , therefore,
bacterial "s ta r te rs" , o r enzymes, or dried cultures are needed 'to resupply
the sept ic t a n k w i t h bacteria. The bacteria responsible for the anaerobic
digestion i n the sept ic t a n k are the comnon bacteria in the various spe-
c ies of Pseudomonas , Flavobacterium, Alcal igenes , Escherichia , Aerobacter
2 . .

. .
, .
,-
I' .-
I _
and possibly Methanobacterium, Methanosarcina and Methanococcus (GcKin-
ney, 1962) . These bacteria are those commonly found i n the biochemical
degradation of domestic wastewater and, i n f ac t , I r e so comon t h a t
microbiologists generally refer t o them as "soil bacteria" since they
( the bacteria) a r e found i n the s o i l .
_ . -
Although household cleansers and disinfectants may perform we1 1 i n
destroying bacteria i n home usage of the disinfectants, t he i r toxic ef-
f ec t s were n o t expected to destroy the numbers of bacteria found i n sep-
t i c tanks a t the level o f chemical introduced into the domestic sept ic
t a n k under normal usage.
ural Extension Service s t a t e s , "Normal amounts of household detergents ,
bleaches, d r a i n cleaners, t o i l e t bowl deodorizers, and other household
chemicals can be used and w o n ' t harm the bacterial action i n the sept ic
In f a c t , the University of Ninnesota Agricul t-
t a n k .
meier, 1983). The U.S. EPA recommends a h igher dosage of chlorine to
d is infec t sept ic t a n k effluent than i s used t o dis infect raw fresh waste-
water, -package biological treatment plant effluent or sand-filtered ef-
Do not use excessive amounts of any household chemicals" (Mach-
f luent (Onsite 'tlastewater Treatinent and Disposal Systems Design Manual,
1980).
to surface discharge and would be conservatively higher than the m i n i m u m
amount required t o destroy the bacteria i n a domestic sept ic t a n k .
This disinfection i s , of course, for destroying a l l bacteria prior
A. Purpose and Objectives
The purpose of this study was t o determine the amounts of household
chemicals required t o decrease or destroy the bacterial p o p u l a t i o n i n a
domestic sept ic t a n k . The specif ic chemicals studied were chlorine bleach,
3

. .
I
I
L
II i ' I
L,
I ' I .
Lysol and Drano.
disinfectants and drain-openers .- B . Related Research and Activit ies
These chemicals represent commonly-used cleznsers,
Studies have been performed to cfiaracterize typical septic t a n k
eff luent (Onsi t e Wastewater Treatment and Disposal Systems Design Man-
ual, 1980; Scherer, 1980). Normal sept ic t a n k eff luent five-day Bio-
chemical Oxygen Demand (BOD5) ranges from 7 mg/l t o 480 mg/l with a
mean of 154 mg/l reported by Scherer (1980). Suspended sol ids ' con-
centrations range from 8 mg/l t o 695 mg/l w i t h a n average of 154 mg/l
being reported by Scherer.
sept ic tanks as a d a t a base.
Scherer's study included only househol d
A comprehensive study of household sewage disposal systems was
conducted i n the early 1950's a t the Robert A . T a f t Sanitary Engineering
Center (Weibel e t a l . , 1954). This study included examination of syn-
the t ic detergent effects upon the sep t ic tank-soil absorption system as
well as effects of ground garbage and zeol i te softener s a l t s . This study
considered anionic detergents and regarded slug doses o f chemicals a s
being more harmful t o a biological process t h a n the same quantity applied
in gradual doses. The results of this study showed t h a t the synthetic
detergents caused l i t t l e change i n the biological ac t iv i ty of the sludge
layer a t the bottom of the t a n k .
upper layers of the septic tank was inhibited by the a d d i t i o n o f synthetic
detergents i n a slug load.
was the decrease of suspended solids i n the sept ic t a n k effluent, indica-
t i n g bet ter s e t t l i ng due t o decreased biological ac t iv i ty .
.
However, biological ac t iv i ty in the
A resul t of the slowed biological act ivi ty
A t average-
4

. .
I - -
i
f ’ !
use quantit ies of seven brand-name synthetic detergents, none of the
detergents interfered seriously w i t h normal digestion of wastewater i n
the sept ic tanks.
METHODS AND PROCEDURES
The study of household chemicals e f fec t on sept ic t a n k effluents
was conducted i n two stages.
study of the e f fec t of household chemicals on sept ic t a n k effluent.
The f i r s t stage was a laboratory scale
Once suff ic ient data were obtained, a f i e l d study on domestic sept ic
tanks was performed which comprised the second stage of the study.
A. Laboratory Study
The laboratory study o f the e f fec t of household chemicals on sept ic
t a n k effluent was conducted t o determine the quantit ies of chemicals re-
quired t o k i l l the bacteria i n the effluent. The chemicals t h a t were
used i n this study were l iquid chlorine bleach, Lysol and Drano.
!-
I ‘ \. . I
! . .
Since 1880, the cr i te r ion for determination of the microbiological !
quality of water used for d r i n k i n g has been i t s coliform content. The
coliforms are used as indicator organisms, i . e . , evidence of fecal pol-
lution of water. I n this study, t h i s c r i t e r i a has been taken i n t o con-
sideration. A concentration of each of the chemicals was established
t h a t was enough t o k i l l a l l the coliform bacteria i n the sample.
While performing the laboratory study, the following parameters
were analyzed:
1.
2. Suspended solids
3 . Coliform concentration
Five-Day Biochemical Oxygen Demand ( B0D5)
5

r
I '
4 . pH
The lab study consisted of spiking one l i t e r of raw septic t a n k
sewage with various concentrations of each one of the chemicals men-
tioned. The procedure'followed for each i s as follows.
About 5 gallons of sep t ic t a n k effluent (STE) were obtained from
BOD analysis was performed on one of the domestic sept ic t a n k users.
the raw sample. The BOD analysis was performed as per Standard Methods
f o r the Examination of
1 i c Health Association
5.0 ml of raw STE was
BOD dilution water. D
Water and Wastewater Method f507 (American Pub-
16th E d i t i o n , 1985). BOD dilution was prepared.
nnoculated i n t o four BOD bot t les and f i l l e d w i t h
lution water only was placed into four BOD b o t -
t l e s .
STE and on the blank.
f ive days. After f i ve days, each of the bot t les was analyzed for d i s -
solved oxygen. Once the data were obtained, the BOD5 was calculated
In i t i a l dissolved oxygen was measured i n one of the bottles wit6
The other bot t les were incubated a t 20°C for
in the following manner:
r I
. .
L .
. \
!
i .
BOD5 (mg/l) = (T) 3n0 (D1-D2)-(B1-B2)
where D1 and D2 = i n i t i a l and final D.0 i n the STE bot t les , respectively,
mg/ 1
B1 and B2 = i n i t i a l and f ina l 0.0 i n the blank bot t les , respectively,
mg/l
Suspended sol ids analysis was performed according to Standard methods,
by method #209C (American Public Health Association 1 6 t h Edition, 1985).
The suspended solids were determined by weighing three fresh 'Whatman'
num pans. About 100 ml of well mixed STE glass microf bre f i l t e r s i n alum
6

was f i l t e r e d through .each one of the f i l t e r s , a n d t h e f i l t e r s were a 1 -
. .
r- . .
e -
! i -
lowed t o dry i n a dessicator.
t e rs , a long with the aluminum p a n , were weighed.
difference i n the i n i t i a l and f inal weights gave the amount of suspend-
ed sol ids i n 100 ml of sampl e .
After the drying was completed, the f i l -
The average of the
To t e s t for the e f fec t of chemicals on STE, one l i t e r samples of
STE were subjected t o interaction w i t h various concentrations of the
chemicals.
analyzed for t o t a l coliform.
forms was as per S t a n d a r d Methods f o r the Examination of Water and
Wastewater Method #909A which i s the to ta l coliform membrane f i l t e r
technique.
They were allowed t o in te rac t f o r about one hour and then
The procedure used f o r testing for co l i -
The procedure for tes t ing the t o t a l coliforms i s as follows.
This A culture media for the coliform bacteria was f i r s t prepared.
media was prepared from the M-endo medium which i s available commer-
c ia l ly . To prepare a 200 m l of t h i s media, 9.6 gms of t h i s media was
taken and hydrated in 200 ml of d i s t i l l e d water and 4 mi of 95 percent
ethanol. I t was then heated t o boiling and cooled t o below 45OC.
In a s t e r i l e petr i dish with a f latbottomand a cover, an absorbent
pad which had been s t e r i l i zed was placed. Approximately 2 ml of the M-
endo b ro th was placed on the absorbent pad.
A gridded membrane f i l t e r with a pore diameter of 0.45 um was used
t o f i l t e r the sample. A
known amount o f sample with proper di lut ion was then passed through the
f i l t e r .
closed on the petri dish.
Care was taken n o t t o contaminate the f i l t e r .
The f i l t e r was placed f l a t on the absorbent pad and the l i d
The pe t r i dish was placed in a n incubator L .
7

I-'
I '
kept at 35OC $ 0.5OC for a period of 24 hours.
After 24 hours of incubation, the petri dish was removed from the
incubator, and the number of coliform colonies on the plate was deter-
mined.
sheen within a 24-hour incubation period on a suitable medium are con-
All organisms that produce a colony with a golden-green metallic .
sidered members of the coliform group.
Coliforms are reported as colonies/100 ml. Since the coliforms
were indicator organisms, the concentration of the individual chemicals
required to kill all the coliform bacteria was determined as discussed
in the above manner.
'rlhile the raw STE was being contacted with chemicals, the pH of
each individual experiment was closely monitored by use of a calibrated
pH meter.
The concentrations required o f -each chemical to kill the coliform
bacteria were reported as mg/l Drano, ml/l Lysol and ml/l chlorine bleach..
B . Field Study
Once the required concentrations of chemicals were established in the
laboratory, these concentrations were used as beginning points to apply
chemicals to individual household septic tanks in the field. Four septic
tanks were used during the field study. The following tanks were used:
TABLE 1 Tank Volumes
Tank Volume of Name Tank
A 1000 gal B 1000 gal C 400 gal D 375 gal
8

.-
r-
. .
Before any f i e ld studywas done each t a n k was f i t t e d w i t h r i s e r s
on the effluent access ports.
were 2 f t . square by 1 f t . h i g h . On the r i s e r s was a l i d w h i c h had
a tongue and groove closure i n order t o keep the l i d t igh t ly closed.
The contents of the tanks were then completely pumped o u t .
a lso provided easy access to obtain samples for further analysis.
Figure 1 is a sketch of a typical domestic sept ic t a n k w i t h the r i s e r
The r i s e r s were made of concrete a n d
The r i s e r s
_ . . c instal led.
After the pumping , the t a n k s were allowed about two weeks time
to return t o the i r normal mode of operation.
t o normal operation, a f i e l d s tudy on the e f fec t of household chemicals
on sep t i c t a n k performance was performed.
Once the t a n k s were back
The dosages required of each chemical werecalculated for each t a n k
The required dosage was then injec- based on the experimental resu l t s .
ted in to the septic tank through the water c losets inside the homes t o
ensure as much mixing of the chemical w i t h the sept ic t a n k contents as
possible, while s t i l l modeling normal dosing of household septic tanks
w i t h chemical slug loadings. Before injecting the chemicals, a raw
.
sample of the effluent was obtained t o analyze for coliform, pH and
BOD5.
ery few hours.
coliform. The expected reaction was t h a t a l l the coliforms would be
ki l led some time a f t e r the required dosage of chemicals was added. The
moni tor ing was continued unt i l the coliform concentration i n the sept ic
t a n k returned t o the concentration before a d d i t i o n o f the chemical. .This
After the chemicals were injected, the t a n k s were monitored ev-
Samples were obtained every 4-8 hours and analyzed f o r
1 .
9

'- '- r--- -- ; ---; . .. . . . _ . . . . . .
SCUM LAYER J
OUTLET TEE OR BAFFLE
SLUDGE
FIG. 1 TYPICAL DOMESTIC SEPTIC TANK

- .
. .
. .
r -
gives the regeneration ra te of the bacteria a f t e r they have been com-
pletely destroyed.
PRINCIPAL FINDINGS AND SIGNIFICANCE
In th i s sec t ion , the principal findings on the effect o f household
chemicals, spec i f ica l ly l i q u i d bleach, Lysol and Drano, on the septic
t a n k , both i n the laboratory and f i e ld study, are discussed.
A . L i q u i d Bleach Study
. ..
One l i t e r samples of raw STE were used in ten-fold ser ia l dilutions
of l iquid bleach i n the laboratory.
was a gradual decrease i n the bacteria concentration w i t h an increase
In i t i a l studies showed t h a t there
i n the concentration of l i q u i d bleach.
bleach were made ranging from concentrations of 1 mg/l t o 100mg/l of
active chlorine.
i n the raw STE, the color t h a t was originally dark gray turned l ight
gray.
Serial dilutions of the liquid
As the concentrations of the liquid bleach increased
The study showed t h a t when 1 l i t e r o f STE was treated with 1.85
ml o f l i q u i d bleach, a l l the coliforms i n the STE were destroyed. This
corresponded t o 100 mg/l of act ive chlorine. BOD was typically between
180 and 210 mg/l and the suspended solids varied between 60 and 99 mg/l . Table I 1 shows the e f f ec t of l i q u i d bleach on raw STE a t varying
concentrations.
higher concentrations where the media became s l igh t ly acidic. The col i -
form concentration gradually decreased until the 1 i q u i d bleach concentra-
t i o n was raised t o 100 mg/l act ive chlorine, wherein the coliforms were
completely destroyed.
I t i s observed t h a t the pH did not vary much except a t
11

.- TABLE I1 Experimental Study on the Effect of Liquid 3leach on STE
VOl. of VOl. of Concentration Coliform . PH
1 i ters m l OCL - Concentration Col iform/100 ml Of 1 Sol u t i on 61 each
. . . . 0
0.05 0 1
1.5E6 7 .O 1.08E6 7.0 1.6E5 7 .O 0.93E5 7.0
, .. 1 0.185 10 1 0.9255 50 1 1.11 60 1.2E5 7.0 1 1.48 80 0.8E5 7.0
90 0.5E5 6.9 100 0 6.9
1 1.66 1 1 .a5
. These experimental datawere used t o calculate the amount of liquid
bleach required t o destroy the coliform bacteria i n various t anks shown
Table 1. According t o the experimental d a t a , a 1000 gallon septic t a n k
i
I '
required 7 lbs of bleach, o r approximately 2-6 gallons of liquid bleach,
for a l l the bacteria t o be k i l led . T h i s corresponded t o about 600 gms
I
I-- i
rl
I ' 1 L .
of HTH powder which contained 65 percent chlorine.
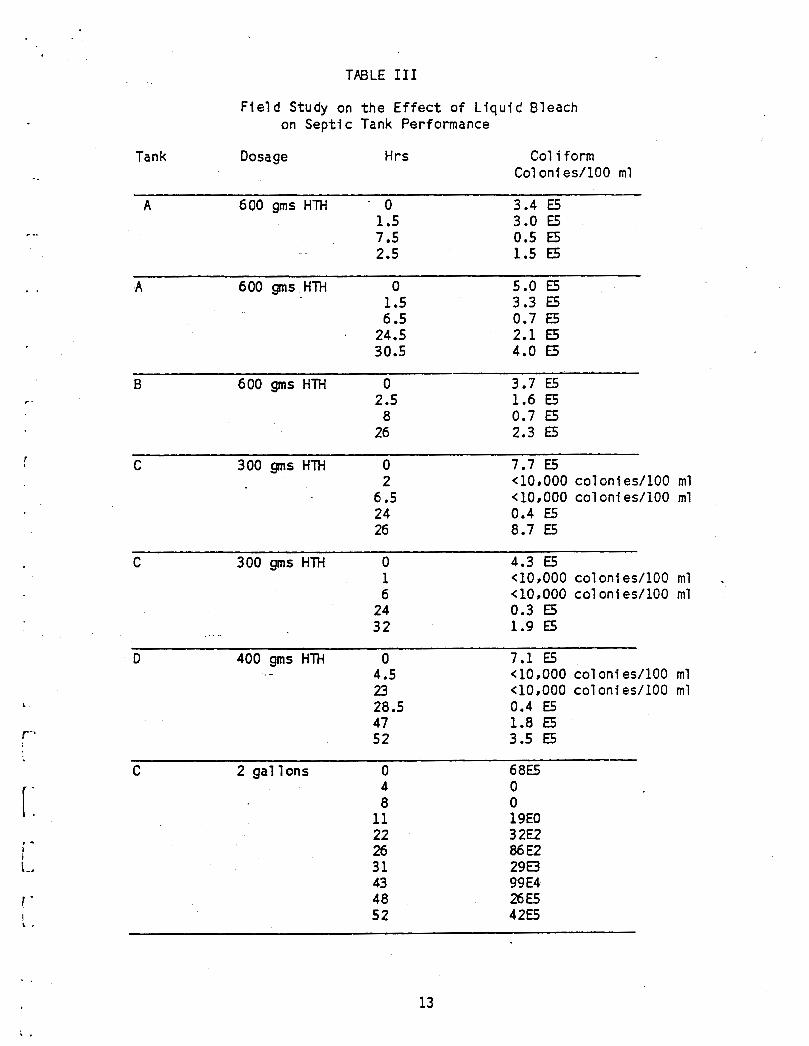
As shown i n Table 111, when a 1000 gallon tank was injected w i t h
600 gms o f HTH, a l l the bacteria were not k i l led .
HTH than predicted by the laboratory experiments was used.
gallon tank, 300 gms o f HTH was required t o k i l l the bacteria.
possibly because the laboratory work i s a batch process, whereas the
A higher amount of
For a 400
This i s
f i e l d study was performed on a semicontinuous system.
The septic tanks were also injqcted w i t h appropriate amounts of
liquid bleach as determined by experimental studies. As indicated by
the s tudies , 2 gallons of l iquid bleach were enough t o k i l l a l l the
bacteria i n a 375-400 gallon t a n k . One would expect bet ter results
u s i n g l iquid bleach compared t o using HTH, as liquid bleach i s already
12
. .
TMLE I11
-.
r -.
L .
r '
.' I i I-.
1 - I L .
Field Study on the Effect of L i q u i d Bleach on Septic Tank Performance
Tank Dosage Hrs Col i form Col oni es/100 m l
A 600 gms HTH . o 3.4 E5 1.5 3.0 E5 7.5 0.5 E5 2.5 1.5 E5
A 600 gms HTH 0 5.0 E5 1.5 3.3 E5 6.5 0.7 E5
24.5 2.1 E5 30.5 4.0 5
B 600 gms HTH 0 3.7 E5 2.5 1.6 E5 8 0.7 E5
26 2.3 E5
C 300 9 s HTH 0 7.7 E5 2 <108000 colonies/100 ml
< 108000 col oni es/100 ml 6.5 24 0.4 E5 26 8.7 E5
C 300 gms HTH 0 4.3 E5 1 <108000 colonies/100 ml . 6 <108000 col oni es/100 ml
24 0.3 E5 32 1.9 E5
D 400 gms HTH 0 7.1 E5 ... 4.5 < 10,000 col oni es/100 m l
<108000 col oni es/100 ml 23 28.5 0.4 E5 47 1.8 5 52 3.5 E5
C 2 gal lons 0 68E5 4 0 8 0
11 19EO 22 32E2 26 86 E2 31 29E3 43 99 E4 48 26E5 52 4 2 6
13

* . I
TPBLE I11 contlnued
.-
r
Tank Gosage Hrs Col i form Col oni es/100 m l
D 2 ga l lons 0 485 4 0 8 0
11 06 E l 22 43 E2 26 92E2 3 1 18E3 43 19E5 48 31 E5 52 4 2 6
C 175 g a l lons 0 59E5 5 40 EO 9 12E1
20 BE2 24 86E2 28 3 1 B 40 41 E5 44 48E5 48 5 2 E
D 175 ga l lons 0 485 5 0 9
20 24 28 40 44 48
31e1 48E2 92 E2 1 8 B 89E4 11 E5 18E
i n solut ion and therefore undergoes proper mixing a s opposed t o HTH.
A notable observation when the l iqu id bleach o r HTH was added was
t h a t the scum layer i n the tank broke u p and was thinned.
recovery f o r the bacter ia when using laboratory concentration o f 1 iqul’d
A typical
14

. -
.- .
e .
. .
! I I
I .
I
bleach in the form o f HTH on septic tanks ranged between 25 a n d 30
hours. When using higher concentrations, the recovery time was bet-
ween 30 and 55 hours.
ranged between 45-60 hours.
Using liquid bleach, the typical recovery times
This was expected, as a be t te r contact-
i n g was attained as compared t o HTH.
l iquid bleach m i g h t do t o the performance of the sept ic t a n k does not
require a long time f o r the damage t o be undone.
8. Lysol Study
This shows t h a t any damage the
One l i t e r o f raw STE sample was used to perform a laboratory scale
T h i s study t o determine the e f fec t of various concentrations of Lysol.
showed t h a t a t very low concentrations, Lysol had l i t t l e effect on the
coliform concentration. Considerable change i n the concentration of
coliforms was observed when the concentration of Lysol was raised t o
1 m l per l i t e r of STE. Then there was a gradual decrease i n the con-
centration ofcoliformswith a gradual increase i n the concentration of . Lysol.
i n 1 l i t e r of STE.
Table IV shows the effect of Lysol a t d i f fe ren t concentrations
Again u s i n g the raw STE, the BOD ranged between 180 and 210 mg/l , and the suspended sol ids varied between 60 and 80 mg/l.
I t was observed tha t about 5 ml of Lysol per l i t e r of STE was enough
t o destroy the bacteria. The solution a t concentrations of greater than
4.5 ml Lysol per l i t e r of' STE tended t o be s l igh t ly acidic w i t h a pH
of about 6.9.
15

.- TABLE IV
Experimental Study on the Effect of Lysol on STE
VOl. of VOl. of ml Lysol Col iform PH Solution Lysol ml t o t a l volume Col oni es/ml Liters ml
1 1 1 1 1 1 1 1 1 1 1 1 1
0 0.1 0.2 0.4 0.5 1.0 2.0 3.5 4.0 4.5 5.0 15 15
0 1.OE-4 2.OE-4 4.OE-4 5.OE-5 1.OE-3 2 .OE-3 3.5E-3 4.OE-3 4.52E-3 5.02E-3 0.015 0.031
1.5E6 4.8E5 4.OE5 3.6E5 2.1E5 1 .BE5 1.2E5 0.9E5 0 .BE5 0.5E5 0 0 0
7.0 7.0 7 .O 7.0 7.0 7.0 7.0 7.0 7.0 6.9 6.9 6.9 6.8
The experimentally observed concentration of 5 ml Lysol per l i t e r
of STE was taken t o study the effect of Lysol on domestic sept ic tanks.
, .
r
!' 1 .
I .
1 .
. .
A 1000 gallon t a n k required aDproximately 19 l i t e r s of Lyscl f o r a l l the *
bacteria t o be k i l led . .
Table V shows the amount of Lysol used on d i f f e ren t s j ze t a n k s a n d /
the time r a t e of change of the coliform concentration.,,Xontrary , t o what
was observed i n the case of l i qu id bleach, the experimentally determined
concentration was enough t o k i l l a l l the bac ter ia . There was some foam-
ing act ion observed a f t e r placing Lysol i n to the sep t i c t a n k s . ,
Typical recovery times f o r the bac ter ia a f t e r being poisoned by
Lysol ranged from 30 t o 65 hours. T h i s again shows tha t the damage tha t
may be done t o the sep t ic tank by excessive use of Lysol can be quickly
undone and therefore has very l i t t l e e f f e c t on the sep t ic tank.
16 I .

C . Drano Study
I '
!
P 1'1
I I ' L. .
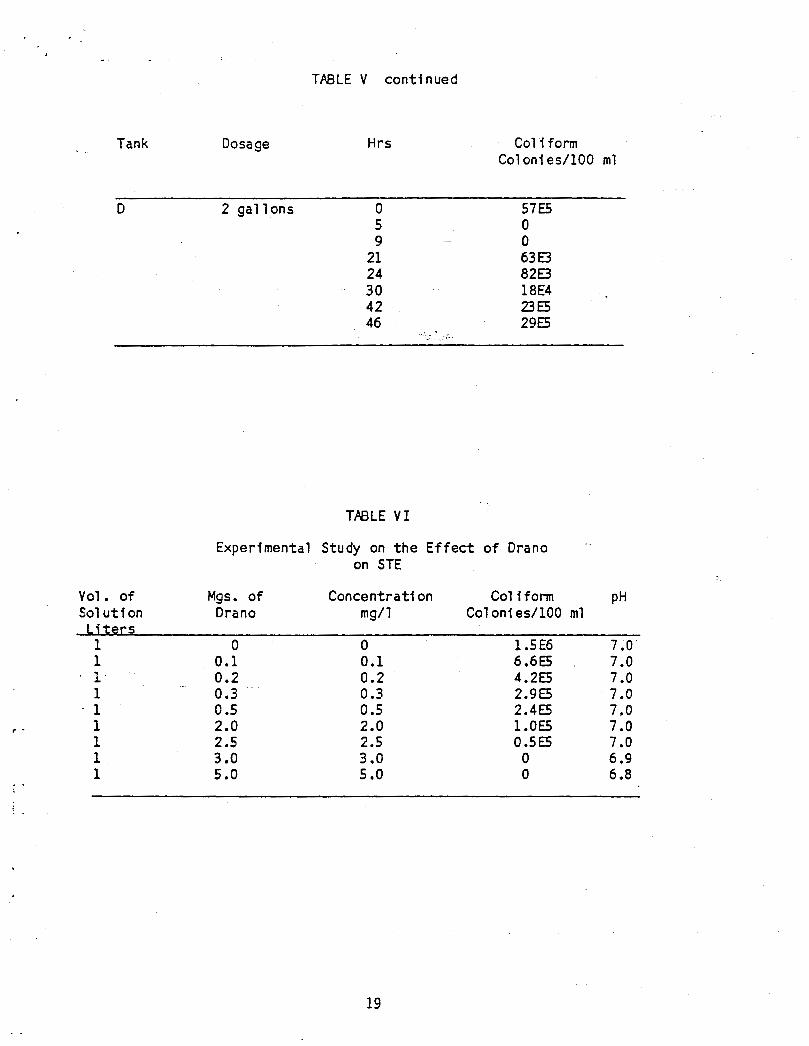
One l i t e r samples of raw STE were t reated with varying amounts
of Drano t o study the e f f e c t of Drano on STE. This showed t h a t a
marked decrease i n concentrations of col iforms was observed a t very
low Drano concentrations.
the concentration of coliforms ten-fold. Table VI shows the e f f ec t
0.1 mg of Drano per l i t e r of STE reduced
of Drano on the s e p t i c tank eff luent . I t was observed t h a t 3 mg/l
of Drano were su f f i c i en t t o k i l l the bacter ia . The BOD of the raw
STE was between 180 and 210 mg/l , and the suspended sol ids varied
between 60 and 80 mg/l . As was typical with the other chemical, there
was a s l i g h t decrease i n pH a t higher concentrations of Drano. Three
mg of Drano per l i t e r o f raw STE corresponded t o 11.34 gms o f Drano
per 1000 gallon sep t i c t a n k .
I n i t i a l s tud ies proved tha t experimental ly observed dosages of
Drano were not detrimental t o the bacter ia l ac t iv i ty . A higher con-
centration of 10 gms per 400 l i t e r s of solution was f i r s t applied, k i l -
l ing a l l the bacter ia .
creased t o determine the exact amounts of Drano required for a 400 g a l -
lon tank. E i g h t gms of Drano were the net amount required for a 400
gallon t a n k , corresponding t o 20 gms of Drano f o r a 1000 gallon t a n k .
The concentration of Drano was gradually de-
Recovery times f o r Drano were found t o be i n the range of 30-55
days. T h i s shows t h a t low concentrations of Drano k i l l a l l the bac-
t e r i a , b u t a long recovery time f o r the bacteria i s n o t required.
17

.-
TABLE V
F i e l d Study on the E f f e c t of Lysol on Sept ic Tank Performance
Tank Dosage H r s Col i form Col on1 es/100 m l
C 1.75 ga l l ons 0 5.5 E5 2 2.0 E5 7 < 10,000
12 < 10,000 25 0.7 E5 3 1 2.8 E5
C 2 gal lons 0 6.7 E5 4 0
12 1 E2 26 1 . 6 0 32 2 .9B 39 2.1E4 50 2.35 56 3.8E5
D 2 gal lons 0 3.8 E5 5 < 10,000
24 <10,000 29 0.8 E5 48 3.2 E5
D 2 gal lons 0 5.1 E3 1.5 1.4 E5 6 < 1c ,000 24 0.9 E5 30 3.1 E5
-.
0 2 gal tons 0 5.5 E5 - 2 0
5.5 0 24.5 3 E 2 28 1.8 E2 3 1 2.0 E4 60 2.6 E4 65 3.6 E5
.;. * ..
r
. . 1 .
C 2 gal lons 0 645 5 0 9 10m
21 98 E3 24 23 E4 30 79E4 42 21 E3 46 3 9 E
18
. -
TmLE V continued
Tank Dosage Hrs Col i form Col oni es/100 m l
D 2 gal lons 0 57E5 5 0 9 0 ~
21 63 B 24 820 30 18E4 42 236 46 295
TPBLE VI
Experimental Study on the Effect of Drano on STE
Concentration Col i form PH V O l . o f Mgs. of Drano mg/l Col oni es/100 m l Sol u t i on
I i t em 0 0 1.5E6 7 .O
0.1 0.1 6.6e5 7.0 0.2 0.2 4.2E 7 .O 0.3 0.3 2.96 7 .O
2 .o 2.0 1 .oE5 7 .O 2.5 2.5 0.55 7 .O 3 .O 3 .O 0 6.9 5 .O 5 .O 0 6.8
1 1
' I 1 1
r - 1 1 1 1
0.5 0.5 2.45 7,0
. .
. .
19 . .

.
TABLE V I 1
I i
I
Tank
Field S t u d y on t he Effect of Crano on Septic Tank Performance
Dosage Hrs Col i form Cot on1 es/100 m l
0 4.2 E5 1 7 E 2
10 gms C
5 0 - 12 23 26 29 47
3- ,2.1 E5 2.7 E3 2.4 E4 3.2 E5
0 5.8 E5 2 9E2
10 gms D
5 8
24 27 30
0 6 E 2 2.2 E3 1.1 E4 2.0 E5
CONCLUSIONS
P . Wnougn t n e conrirmlng r ’W, - gathered as o-f*’ihi’s date indicate t h a t the slug loads indicated in
r- Table VI11 of household chemicals will destroy the bacteria popula-
t i o n i n a 3780 l i t e r (1000 gallon) sept ic t a n k . Also, the recovery
times .required f o r the bacteria population t o return t o normal con-
centrations are shown.
20
, , . ' J
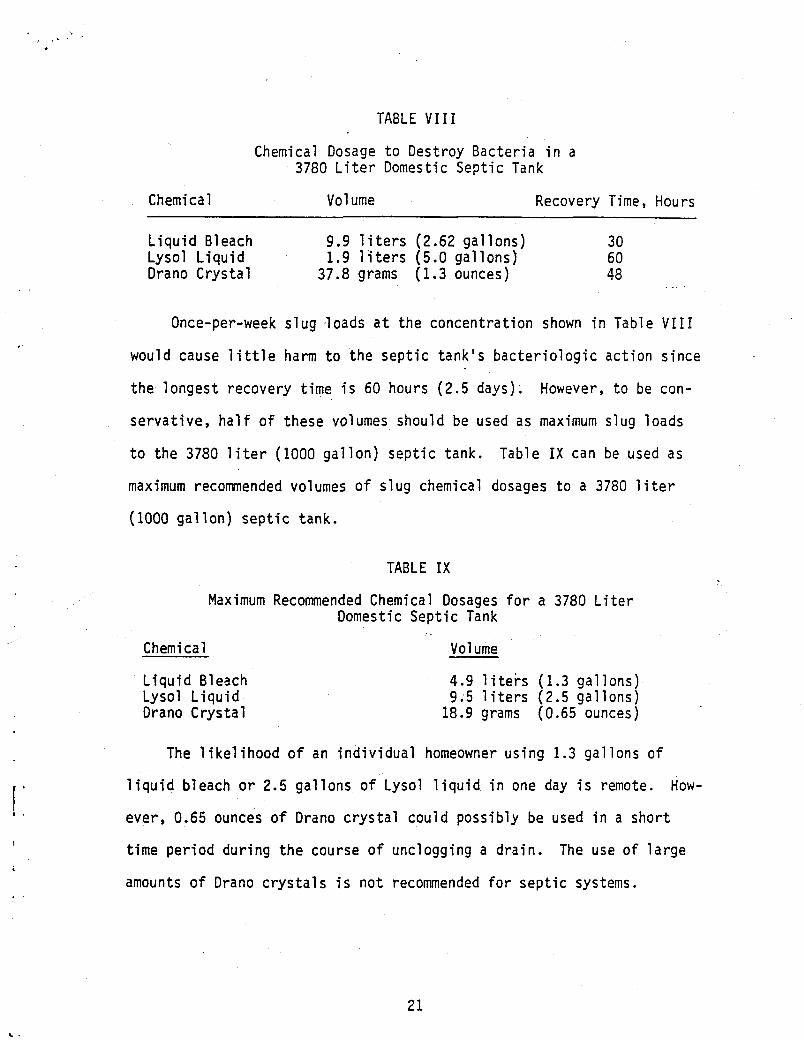
TABLE VI11
Chemical Dosage to Destroy Bacteria in a 3780 Liter Domestic Septic Tank
C hemi ca 1 Vol ume Recovery Time, Hours
Liquid Bleach 9.9 liters (2.62 gallons) 30 Lysol Liquid 1.9 liters (5.0 gallons) 60 Drano Crystal 37.8 grams (1.3 ounces) 48
Once-per-week slug -loads at the concentration shown in Table VIII
would cause little harm to the septic tank's bacteriologic action since
the longest recovery time i s 60 hours (2.5 days).
servative, half o f these volumes should be used as maximum slug loads
However, to be con-
to the 3780 liter (1000 gallon) septic tank. Table IX can be used as
maximum recommended volumes of slug chemical dosages to a 3780 liter
(1000 gallon) septic tank.
TABLE I X
Maximum Recommended Chemical Dosages for a 3780 Liter Domestic Septic Tank
Chemical Volume
Liquid Bleach Lysol Liquid Drano Crystal
4.9 liters (1.3 gallons) 9.5 liters (2.5 gallons) 18.9 grams (0.65 ounces)
The likelihood o f an individual homeowner using 1.3 gallons o f
liquid bleach or 2.5 gallons of Lysol liquid in one day is remote. How-
i
, .
ever, 0.65 ounces o f Drano crystal could possibly be used in a short
time period during the course of unclogging a drain.
amounts of Drano crystals is not recommended for septic systems.
The use o f large
21

I .
LITERATURE CITED
I
! i
r 1
American Public Health Association 16th Ed. 1985. S t a n d a r d methods Washington, D . C . f o r the examination of water and wastewater.
Caudy, Anthony F . , J r . and E . T. Caudy. 1980. Microbiology for en- vironmental s c i en t i s t s and engineers. McGraw-Hill Book Company.
Arkansas S ta t i s t i ca l Abstract. 1986. State Data Center, University of Arkansas a t L i t t l e Rock.
Chambers, J . V . 1981. Improving waste removal performance r e l i ab i l i t y of a waste treatment system th rough bioaugmentation. 36th In- dustrial Waste Conference, Purdue University, 1981.
Grease-Eaters Clear.Sewers. September 5, 1982. Engineering news. Record, McGraw-Hi 11 , Inc.
Grubbs, R . 6. 1983. Environmental applications of biotechnology: the current state-of-the-art . Genetic Control of Environmental Pollutants Conference, University of Washington.
Machmeier, R . E. 1983. Get t o know your sept ic tank. Extension Fold- e r 337. Agric. Extension Service, University of Hinnesota.
McKinney, R . E . 1962. Microbiology f o r San i t a ry Engineers. McGraw- Hill Book Company.
Onsite Wastewater Treatment and Disposal Systems Design Manual. 1980. . U.S. Environmental Protection Agency, Office of Research a n d De- velopment, tlunicipal Environmental Research Lab. Cincinnati, OH.
Sawyer & McCarthy. 1978. Chemistry fo r environmental eng., 3rd edi- t i o n . McGraw-Hill Book Company.
Scherer, B. P. 1980. Residential sept ic t a n k effluent character is t ics .
State of Tennessee Department of Public Health. Permit for construc-
U.S. Public Health Service. 1972. Manual of septic-tank practice. U.S.
M.S. Thesis. U n i v . of Arkansas, Fayetteville.
t i o n of subsurface sewage disposal systems.
Department of Health, Educat ion and Welfare. 10020.
Publ. No. (HSM) 72-
Weibel, S . R . , e t a l . tems, P a r t 111. cinnati , O H .
1954. Studies on household sewage disposal sys- Robert A . Taft Sanitary Engineering Center , Cin-
22