Embed Size (px)
Citation preview
NASA Technical Memorandum 110325
The Upper Atmosphere Research Satellite In-Flight Dynamics
Stanley E. WoodardLangley Research Center, Hampton, Virginia
April 1997
National Aeronautics andSpace AdministrationLangley Research CenterHampton, Virginia 23681-0001
Abstract
Upper Atmosphere Research Satellite flight data from the first 737 days after launch (September 1991) was
used to investigate spacecraft disturbances and responses. The investigation included two in-flight dynamics
experiments (approxiamtely three orbits each). Orbital and configuration influences on spacecraft dynamic
response were also examined. Orbital influences were due to temperature variation from crossing the
Earth’s terminator and variation of the solar incident energy as the orbit precessed. During the terminator
crossing, the rapid ambient temperature change caused the spacecraft’s two flexible appendages to experience
thermal elastic bending (thermal snap). The resulting response was dependent upon the orientation of the
solar array and the solar incident energy. Orbital influences were also caused by on-board and environmental
disturbances and spacecraft configuration changes resulting in dynamic responses which were repeated each
orbit. Configuration influences were due to solar array rotation changing spacecraft modal properties. The
investigation quantified the spacecraft dynamic response produced by the solar array and high gain antenna
harmonic drive disturbances. The solar array’s harmonic drive output resonated two solar array modes.
Friction in the solar array gear drive provided sufficient energy dissipation which prevented the solar panels
from resonating catastrophically; however, the solar array vibration amplitude was excessively large. The
resulting vibration had a latitude-specific pattern.
ii
CONTENTS
Abstract ..............................................................................................................................iContents..............................................................................................................................iiNonmenclature......................................................................................................................iii
1. Introduction......................................................................................................................1
1.1 UARS In-Flight Dynamics Study Highlights ...........................................................31.2 Publications and Presentations...............................................................................1
2. UARS Overview...............................................................................................................5
2.1 Science Measurement Characteristics ......................................................................62.2 Disturbances Known Before Launch........................................................................72.3 Attitude Determination.........................................................................................72.4 Spacecraft Physical Characteristics .........................................................................7
3. Typical UARS Orbital Dynamics........................................................................................9
3.1 UARS Subsystems.............................................................................................10
3.1.1 Modular Attitude Control System...........................................................103.1.2 Inertial Reference Unit Gyros .................................................................103.1.3 Solar Array .........................................................................................113.1.4 High Gain Antenna..............................................................................113.1.5 Solar Stellar Pointing Platform..............................................................12
3.2 Instruments .......................................................................................................13
3.2.1 Halogen Occultation Experiment ............................................................133.2.2 High Resolution Doppler Imager ............................................................133.2.3 Microwave Limb Sounder ......................................................................143.2.4 Elastically Flexible-Body Motion ...........................................................15
4. Subsystem and Instrument Contribution to Space Dynamic Response.........................................17
4.1 Solar Array Drive................................................................................................174.2 Solar Array Modal Contribution ............................................................................194.3 High Gain Antenna Drive .....................................................................................204.4 HRDI and MLS .................................................................................................21
iii
5. Orbital and Configuration Influences on Spacecraft Dynamic Response........................................23
5.1 Jitter Amplitude Variation with Tip Inertia Rotation..................................................235.2 Appendage Modal Variation with Tip Inertia Rotation................................................245.3 Disturbance Transmission Variation with Appendage Rotation ....................................265.4 Thermal Elastic Bending Analysis .........................................................................27
Concluding Remarks..............................................................................................................30Acknowledgments .................................................................................................................32Appendage 1: Modal Variation with Tip Inertia Rotation ..............................................................35Appendage 2: UARS Disturbance Experiment.............................................................................40Appendage 3: UARS Payload Interaction Experiment ...................................................................43Tables ..............................................................................................................................50Figures ..............................................................................................................................43
iv
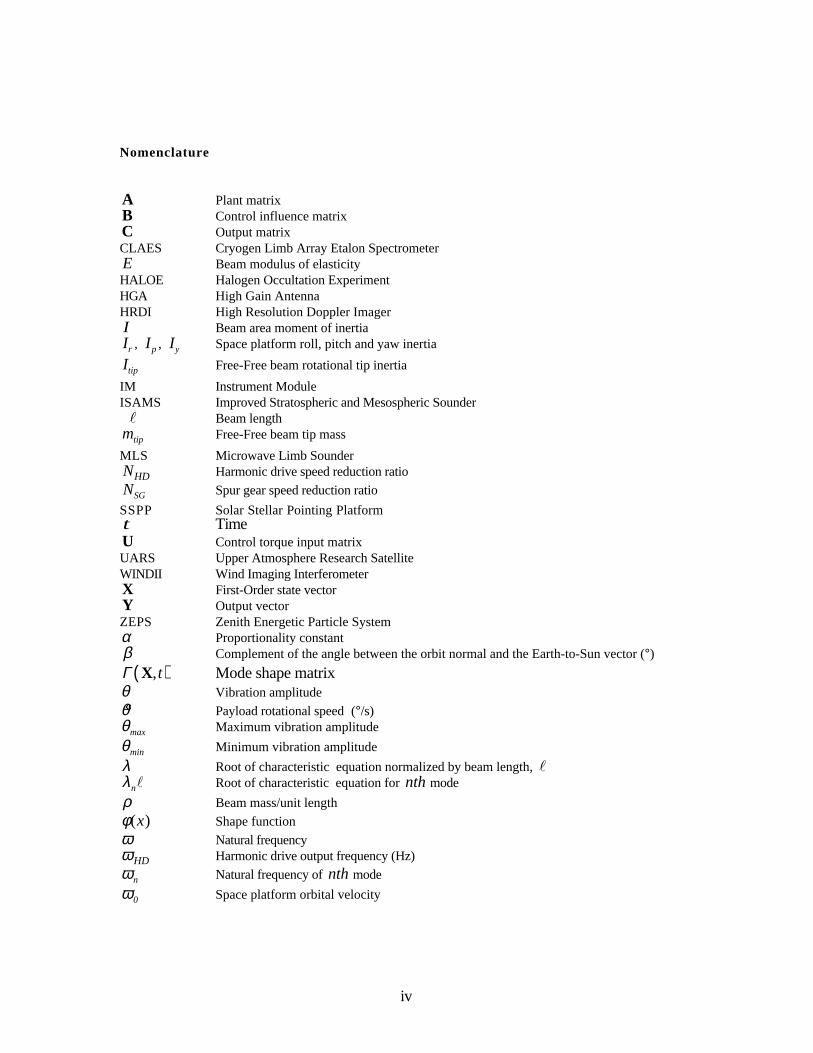
Nomenclature
A Plant matrixB Control influence matrixC Output matrixCLAES Cryogen Limb Array Etalon SpectrometerE Beam modulus of elasticityHALOE Halogen Occultation ExperimentHGA High Gain AntennaHRDI High Resolution Doppler ImagerI Beam area moment of inertiaIr , I p , I y Space platform roll, pitch and yaw inertia
Itip Free-Free beam rotational tip inertia
IM Instrument ModuleISAMS Improved Stratospheric and Mesospheric Sounder
l Beam lengthmtip Free-Free beam tip mass
MLS Microwave Limb SounderNHD Harmonic drive speed reduction ratio
NSG Spur gear speed reduction ratio
SSPP Solar Stellar Pointing Platformt TimeU Control torque input matrixUARS Upper Atmosphere Research SatelliteWINDII Wind Imaging InterferometerX First-Order state vectorY Output vectorZEPS Zenith Energetic Particle Systemα Proportionality constantβ Complement of the angle between the orbit normal and the Earth-to-Sun vector (°)
Γ X,t( ) Mode shape matrixθ Vibration amplitude
θ Payload rotational speed (°/s)θmax Maximum vibration amplitude
θmin Minimum vibration amplitude
λ Root of characteristic equation normalized by beam length, l
λnl Root of characteristic equation for nth mode
ρ Beam mass/unit length
φ( )x Shape function
ω Natural frequencyωHD Harmonic drive output frequency (Hz)
ωn Natural frequency of nth mode
ω0 Space platform orbital velocity
1
1 . Introduction
On September 12, 1991, NASA launched the Upper Atmosphere Research Satellite (UARS) 1, 2. The goal
of UARS was to carry out the first systematic, comprehensive study of the stratosphere and to furnish new
data on the mesosphere and thermosphere. UARS provided critical data on the chemical composition of the
upper atmosphere, particularly the structure of the Earth's protective ozone layer in the stratosphere. This
satellite mission was the first element of a long-term national program to study global atmospheric change.
In addition to its atmospheric sciences mission, data from the first 737 days past the launch of UARS was
used to investigate in-flight spacecraft dynamics. Figs. 1 and 2 show the spacecraft in pre-launch and
operating configurations, respectively. Although the UARS spacecraft was used in this study, identification
and measurement of spacecraft disturbances and their respective response can be used to increase the
accuracy of pre-launch predictions on many spacecraft1-10. Furthermore, as instrument pointing requirements
become more demanding, spacecraft disturbances that were previously unimportant are becoming limiting
factors in the quality of science data. The investigation included two in-flight experiments (approximately
three-orbit each) using UARS.
Objectives of the first experiment were to isolate all disturbances known before launch, create disturbance
combinations, create spacecraft dynamic responses suitable for system identification, examine spacecraft
quiescence and identify any disturbances not known before launch. A primary goal of the experiment was to
determine how each instrument and subsystem disturbance contributed to the overall spacecraft dynamic
response. The first experiment was conducted during the last four hours of May 1, 1992 (233rd day after
launch, Greenwich Mean Time), five hours after the spacecraft had rotated 180 degrees about its yaw axis.
Analysis of flight data before the experiment indicated that the solar array edgewise and flatwise modes were
constantly excited. Prelaunch analysis indicated that the Microwave Limb Sounder (Fig. 1) antenna limb
viewing scan profile was the excitation source. Thus, the experiment provided a means to identify the solar
array excitation source.
Examination of data from the first experiment lead to the conclusion that the solar array drive was the
dominant disturbance source. Prelaunch analysis had predicted that any disturbance produced by the solar
array drive was negliable. Furthermore, the data from the first experiment provided cases to examine
payload-payload interaction. The second experiment was conducted on September 17 , 1993 from 1300
through 1705 (737th day after launch, Greenwich Mean Time). Part of second experiment was conducted
during the spacecraft yaw maneuver to examine spacecraft dynamics when the solar array was stationary.
2
The objectives of the second experiment were the same as those of the first. However, the second
experiment focused more on payload-payload interaction and examining the dynamic response due to the
instruments and subsystems without the influence of the solar array drive.
Flight data from the first 737 days after the launch was also analyzed to determine the orbital effects and
spacecraft configuration effects on the spacecraft dynamic response. Orbital influences were due to
temperature variation from crossing the Earth’s terminator and variation of the solar incident energy as the
orbit precessed11, 12. Configuration influences were due to solar array rotation. The rotation changed
spacecraft modal properties and the amount of solar energy incident upon the solar array. During the
terminator crossing, the rapid ambient temperature change caused the spacecraft’s two flexible appendages
to experience thermal elastic bending (thermal snap). The resulting response was dependent upon the
orientation of the solar array and the solar incident energy. Orbital influences were also caused by on-board
and environmental disturbances and spacecraft configuration changes (due to solar array rotation) resulting in
dynamic responses which were repeated each orbit.
The UARS solar array rotated about an axis parallel to the spacecraft’s pitch axis at a rotation rate which
results in a complete revolution for each orbit. The solar array rotation was dynamically equivalent to the
solar array being stationary and the spacecraft rotating about the solar array drive shaft. The UARS yaw
inertia was significantly higher than the roll inertia. During rotations, the inertia at the drive shaft (tip
inertia) would vary from the roll inertia to the yaw inertia. The tip inertia, the modal properties of the solar
array and the response amplitude varied harmonically at twice the orbital frequency. Three effects were
observed. The first effect was that when the disturbances remained constant, the vibration amplitude varied
inversely with the tip inertia13. A second effect was that variations of the tip inertia (boundary conditions)
produced corresponding changes in the solar array frequencies of vibration and mode shapes13. A third effect
that occurred due to the rotation of a flexible appendage was the variation of disturbance transmission
resulting from the changing orientation of mode shapes13.
This paper presents analysis results from the experiments and flight data of the first 737 days after launch.
Following an overview of the spacecraft, results are presented which show solar array drive, solar array
modal, high gain antenna drive and appendage thermal-elastic bending contribution to the spacecraft
dynamic response. The paper then presents the effects of orbital and configuration variation on spacecraft
dynamic response. Spacecraft jitter (the angular excursion of an instrument's line-of-sight in a reference
time interval (such as a sampling time period)) amplitude variation with tip inertia rotation is presented.
The influence of solar array rotation direction and the solar incident energy on jitter amplitude is presented
afterwards. Next, the spacecraft modal variation with tip inertia rotation is presented. The inertia variation
results in modal bands for the solar array edgewise and flatwise modes. Three subsystem disturbances have

3
frequencies which overlap the bands. The results of examining configuration and orbital variations on
thermal bending of the solar array is presented next. The last section presents analysis of the disturbance
transmission variation with appendage rotation. The results of studying the in-flight dynamics of the
UARS have shown the significance of the effects of spacecraft inertia variations on the modal characteristics
of flexible appendages and on spacecraft jitter. Furthermore, results of these analyses can be extended to
spacecraft with similar dynamic characteristics such as the Mir and the International Space Station.
1 . 1 UARS In-Flight Dynmics Study Highlights
The following are a highlights from the UARS dynamic study:
• UARS Disturbance Experiment, May 1, 1992.
• UARS Payload-Interaction Experiment, September 17, 1993.
• Experimental investigation of in-flight disturbances
• Identification of thermal elastic bending of boom extension boom containing ZEPS instrument.
• Long term (600 day duration) analysis of solar array thermal bending
• Correlation of WINDII and HRDI wind measurements with UARS vibration
• Identification and analysis of payload-payload interaction and structure-payload interaction.
• Discovery of latitude specific vibration response produced by UARS solar array drive.
• Identification of the tracking and relay high gain antenna effects on spacecraft response.
• Analysis of solar array modal variations with rotation about drive shaft.
• Examination of reduction gear drive dynamic effects on spacecraft response.
• Development of sub-assembly methodology and architecture to model multi-payload spacecraft.
Approach includes nonlinear dynamics.
4
1 . 2 Publications and Presentations
The following are journal, nonformal and conference publications resulting from the study of UARS in-
flight dynamics:
1. S. E. Woodard, M. Garnek, J. D. Molnar and W. L. Grantham, “The Upper Atmosphere Research
Satellite Jitter Study,” Flight Experiments Technical Interchange Meeting, Monterey, CA, October 5-9,
1992.
2. Molnar, J. and Garnek, M., "UARS In-Flight Jitter Study for EOS," NASA CR 191419, Jan
1993.
3. A. J. Butterfield and S. E. Woodard, “Payload-Payload Interaction and Structure-Payload Interaction
Observed on the Upper Atmosphere Research Satellite,” AAS/AIAA Astrodynamics Specialist Conference,
Victoria, British Columbia, Canada, August 16-19, 1993.
4. C. R. Larson, S. E. Woodard, L. Tischner, E. Tong, M. Schmidt, J. Cheng, E. Fujii, and S.
Ghofranian, “Upper Atmosphere Research Satellite (UARS) Dynamic Analysis Design System (DADS)
Control-Structures Interaction Simulation Development,” AIAA 33rd Aerospace Sciences Meeting and
Exhibit, Reno, NV, January 9-12, 1995, AIAA Paper No. 95-0622.
5. S. E. Woodard and A. Nagchaudhuri, “Application of the LMS and Filtered-X LMS Algorithm to
Spacecraft Jitter Compensation,” Fifth Annual AAS/AIAA Space Flight Mechanics Conference, AAS
Paper No. 95-211, Albuquerque, NM, February 13-15, 1995.
6. A. J. Butterfield and S. E. Woodard, “Science Instrument and Structural Interactions Observed on the
Upper Atmosphere Research Satellite,” Journal of Spacecraft and Rockets, Vol. 33, No. 4, July-August
1996.
7. C. R. Larson, S. E. Woodard, L. Tischner, E. Tong, M. Schmidt, J. Cheng, E. Fujii, and S.
Ghofranian, “Multipayload Modeling for the Upper Atmosphere Research Satellite,” Journal of Spacecraft
and Rockets, Vol. 33, No. 4, July-August 1996
5
8. S. E. Woodard, D. A. Gell, R. Lay, and R. Jarnot, “Experimental Investigation of Spacecraft In-
Flight Disturbances and Dynamic Response,” Journal of Spacecraft and Rockets, Vol. 34. No. 2, March-
April 1997.
9. S. E. Woodard, R. Lay, R. Jarnot and D. Gell, “Measured Spacecraft Dynamic Effects on
Atmospheric Science Instruments,” 35th Aerospace Sciences Meeting, Reno, NV, Jan 6-9, 1997.
10. S. E. Woodard, R. Lay, R. Jarnot and D. Gell, “Measured Spacecraft Dynamic Effects on
Atmospheric Science Instruments, submitted to the IEEE Transactions on Geoscience and Remote Sensing.
11. S. E. Woodard, “Orbital and Environmental Influences on Spacecraft Dynamic Response,” submitted
to Journal of Guidance, Control and Dynamics.
12. S. E. Woodard, “The Upper Atmosphere Research Satellite In-Flight Dynamics,” NASA Technical
Memorandum 110325.
6
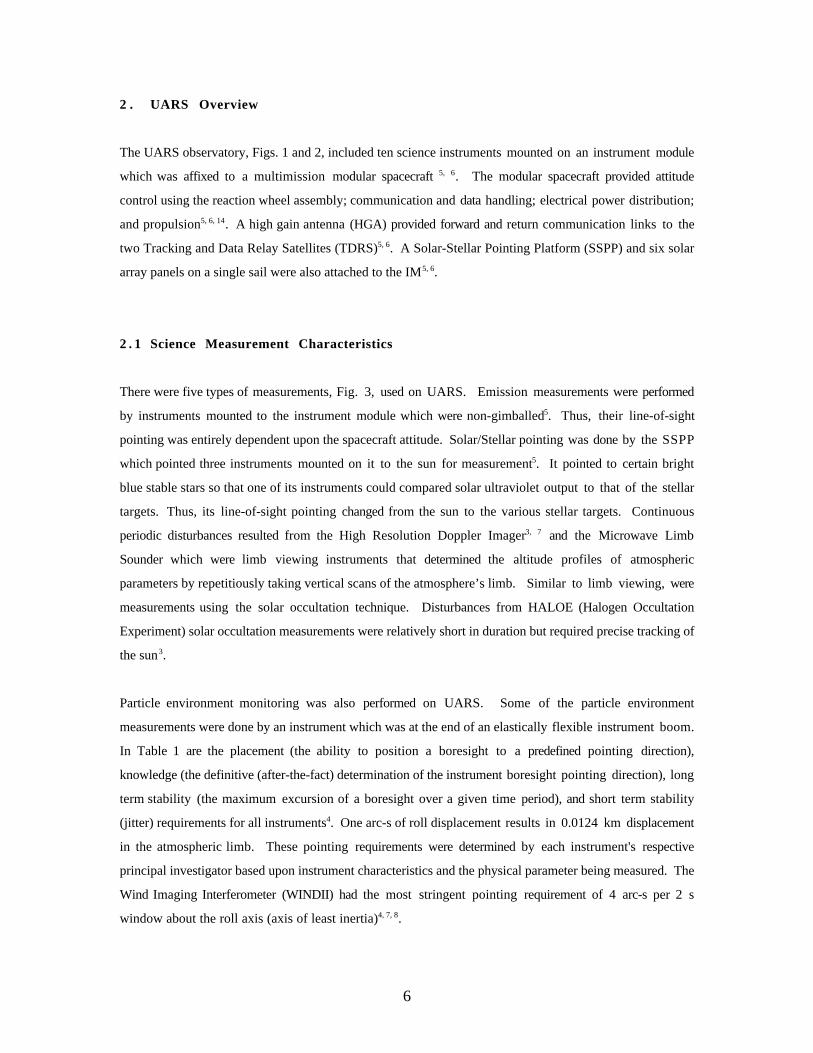
2 . UARS Overview
The UARS observatory, Figs. 1 and 2, included ten science instruments mounted on an instrument module
which was affixed to a multimission modular spacecraft 5, 6. The modular spacecraft provided attitude
control using the reaction wheel assembly; communication and data handling; electrical power distribution;
and propulsion5, 6, 14. A high gain antenna (HGA) provided forward and return communication links to the
two Tracking and Data Relay Satellites (TDRS)5, 6. A Solar-Stellar Pointing Platform (SSPP) and six solar
array panels on a single sail were also attached to the IM5, 6.
2 . 1 Science Measurement Characteristics
There were five types of measurements, Fig. 3, used on UARS. Emission measurements were performed
by instruments mounted to the instrument module which were non-gimballed5. Thus, their line-of-sight
pointing was entirely dependent upon the spacecraft attitude. Solar/Stellar pointing was done by the SSPP
which pointed three instruments mounted on it to the sun for measurement5. It pointed to certain bright
blue stable stars so that one of its instruments could compared solar ultraviolet output to that of the stellar
targets. Thus, its line-of-sight pointing changed from the sun to the various stellar targets. Continuous
periodic disturbances resulted from the High Resolution Doppler Imager3, 7 and the Microwave Limb
Sounder which were limb viewing instruments that determined the altitude profiles of atmospheric
parameters by repetitiously taking vertical scans of the atmosphere’s limb. Similar to limb viewing, were
measurements using the solar occultation technique. Disturbances from HALOE (Halogen Occultation
Experiment) solar occultation measurements were relatively short in duration but required precise tracking of
the sun3.
Particle environment monitoring was also performed on UARS. Some of the particle environment
measurements were done by an instrument which was at the end of an elastically flexible instrument boom.
In Table 1 are the placement (the ability to position a boresight to a predefined pointing direction),
knowledge (the definitive (after-the-fact) determination of the instrument boresight pointing direction), long
term stability (the maximum excursion of a boresight over a given time period), and short term stability
(jitter) requirements for all instruments4. One arc-s of roll displacement results in 0.0124 km displacement
in the atmospheric limb. These pointing requirements were determined by each instrument's respective
principal investigator based upon instrument characteristics and the physical parameter being measured. The
Wind Imaging Interferometer (WINDII) had the most stringent pointing requirement of 4 arc-s per 2 s
window about the roll axis (axis of least inertia)4, 7, 8.
7
2 . 2 Disturbances Known Before Launch
Six of the UARS instruments and subsystems were gimballed. During the course of an orbit many
disturbances were imparted to the platform which included impulses and periodic disturbances3, 7-12. The
satellite had two elastically flexible appendages (the solar array and an instrument boom) which were excited
by multiple disturbance sources on-board the spacecraft. In Table 2 are descriptions of disturbances known
before launch which have a measurable impact on spacecraft jitter. Many of these disturbances were
triggered by the spacecraft’s position in orbit such as thermal snap of the solar array as the spacecraft passed
through the Earth's terminator (Refs. 7, 11 and 12) or HALOE events during orbital sunrise and sunset
(Refs. 3 and 7). Some were due to UARS relative position to other spacecraft such as the line-of-sight of
the high gain antenna to the Tracking and Data Relay Satellites (East and West) in geostationary orbits5, 6.
Other disturbances which were assumed to be negligible are due to internal mechanisms of the UARS’s
science instruments and subsystems. After launch, it was determined through observation and correlation of
flight data that the combined dynamics of the solar array and solar array drive; and the high gain antenna
drive dynamics during tracking and rewinding are major disturbance sources of continuous spacecraft jitter.
2 . 3 Attitude Determination
UARS’ attitude determination and control subsystem had numerous sensors on-board for attitude
determination5, 6, 14. These included an earth sensor assembly module. Fixed-Head star trackers and an
inertial reference unit. However, due to limitations in either sampling rate or resolution, the only means of
measuring attitude suitable for studying jitter was with the inertial reference unit gyros at the aft end of the
spacecraft. These gyros had a resolution of 0.05 arc-sec with a sampling rate of 7.8125 Hz.
2 . 4 Spacecraft Physical Characteristics
Design and analysis concerns for multi-payload spacecraft included identifying any adverse payload-payload
interaction or structure-payload interaction. Such interactions were dominated by the gimballed instrument
and subsystem inertia, payload motion profiles, gimbal location, gimballed payload center of mass relative
to gimbal location; spacecraft mass and inertia; the modal properties of the primary structure and flexible
appendages; torque profiles inputted at the gimbal drive shafts; and, attitude control system bandwidth and
roll-off relative to appendage motion frequency. The inertia ratios for the gimballed instruments and
subsystems to the spacecraft roll, pitch, and yaw inertia are given in Table 3 (Ref. 10). This ratio was a
critical parameter to the overall contribution of each instrument to spacecraft jitter.
8
Structural frequencies, subsystem operating frequencies, and gimballed science instruments frequencies
below 4.0 Hz ( the Nyquist frequency for the rate gyros is 3.90625 Hz)3, 7, 14 are shown in Fig. 4. The
structural frequencies are listed in Table 5 for various solar array positions. In Table 4, are the stiffness
properties for the deployed appendages. The attitude control system had a bandwidth of 0.07 rad/sec with a
roll-off of 36 dB per decade6, 16. Disturbances due to rewind of the Microwave Limb Sounder antenna were
partially attenuated by the attitude control system. A band represents the structural frequencies for the first
two solar array modes. The structural frequencies of the modes varied as the solar array rotated through a
complete revolution7, 8, 13. During this rotation, the frequencies crossed. Harmonic drive output frequencies
for the SSPP, solar array drive, and the high gain antenna during their tracking were also within the
frequency band of the solar array. During separate parts of an orbit, the subsystems with harmonic drives
will resonated both the solar array flatwise and edgewise modes.
9
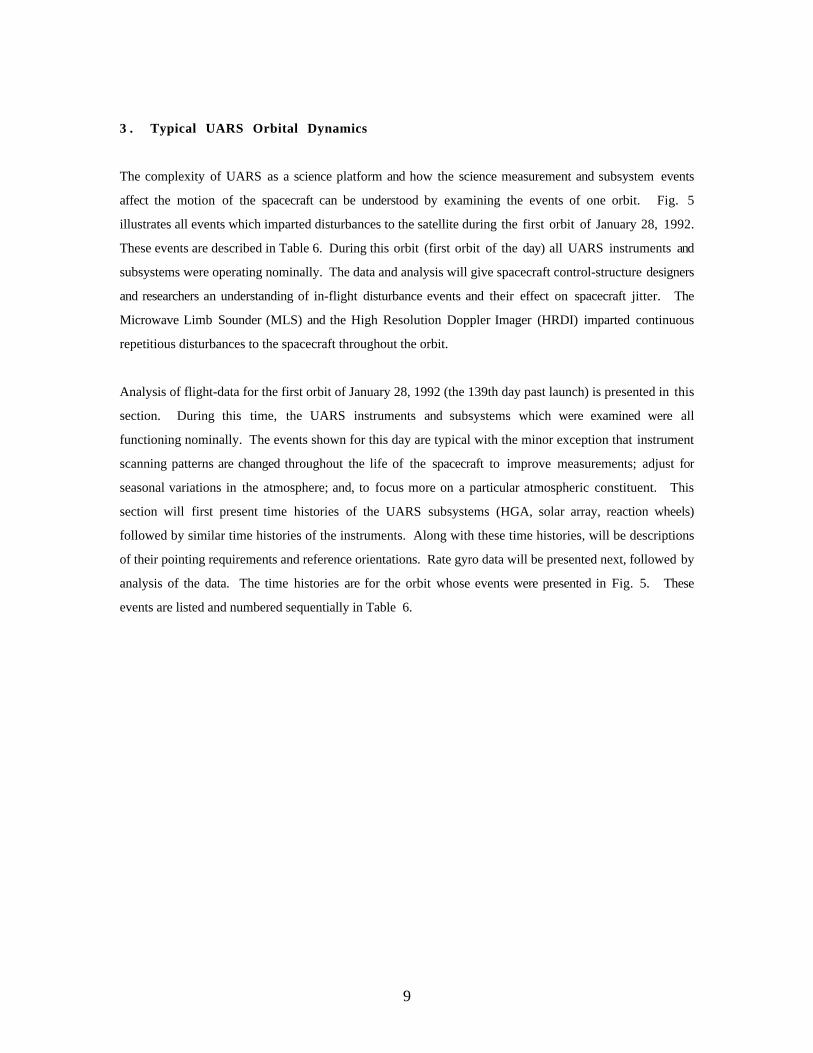
3 . Typical UARS Orbital Dynamics
The complexity of UARS as a science platform and how the science measurement and subsystem events
affect the motion of the spacecraft can be understood by examining the events of one orbit. Fig. 5
illustrates all events which imparted disturbances to the satellite during the first orbit of January 28, 1992.
These events are described in Table 6. During this orbit (first orbit of the day) all UARS instruments and
subsystems were operating nominally. The data and analysis will give spacecraft control-structure designers
and researchers an understanding of in-flight disturbance events and their effect on spacecraft jitter. The
Microwave Limb Sounder (MLS) and the High Resolution Doppler Imager (HRDI) imparted continuous
repetitious disturbances to the spacecraft throughout the orbit.
Analysis of flight-data for the first orbit of January 28, 1992 (the 139th day past launch) is presented in this
section. During this time, the UARS instruments and subsystems which were examined were all
functioning nominally. The events shown for this day are typical with the minor exception that instrument
scanning patterns are changed throughout the life of the spacecraft to improve measurements; adjust for
seasonal variations in the atmosphere; and, to focus more on a particular atmospheric constituent. This
section will first present time histories of the UARS subsystems (HGA, solar array, reaction wheels)
followed by similar time histories of the instruments. Along with these time histories, will be descriptions
of their pointing requirements and reference orientations. Rate gyro data will be presented next, followed by
analysis of the data. The time histories are for the orbit whose events were presented in Fig. 5. These
events are listed and numbered sequentially in Table 6.
10
3 . 1 UARS Subsystems
3 . 1 . 1 Modular Attitude Control System
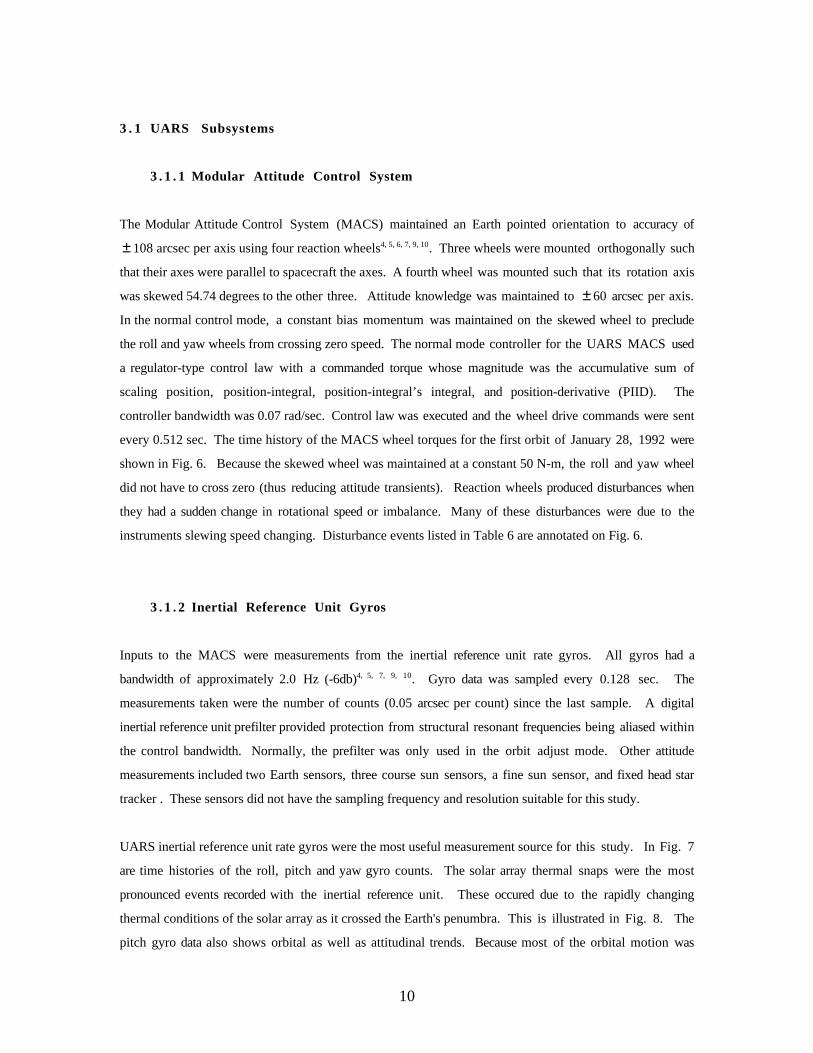
The Modular Attitude Control System (MACS) maintained an Earth pointed orientation to accuracy of
± 108 arcsec per axis using four reaction wheels4, 5, 6, 7, 9, 10. Three wheels were mounted orthogonally such
that their axes were parallel to spacecraft the axes. A fourth wheel was mounted such that its rotation axis
was skewed 54.74 degrees to the other three. Attitude knowledge was maintained to ± 60 arcsec per axis.
In the normal control mode, a constant bias momentum was maintained on the skewed wheel to preclude
the roll and yaw wheels from crossing zero speed. The normal mode controller for the UARS MACS used
a regulator-type control law with a commanded torque whose magnitude was the accumulative sum of
scaling position, position-integral, position-integral’s integral, and position-derivative (PIID). The
controller bandwidth was 0.07 rad/sec. Control law was executed and the wheel drive commands were sent
every 0.512 sec. The time history of the MACS wheel torques for the first orbit of January 28, 1992 were
shown in Fig. 6. Because the skewed wheel was maintained at a constant 50 N-m, the roll and yaw wheel
did not have to cross zero (thus reducing attitude transients). Reaction wheels produced disturbances when
they had a sudden change in rotational speed or imbalance. Many of these disturbances were due to the
instruments slewing speed changing. Disturbance events listed in Table 6 are annotated on Fig. 6.
3 . 1 . 2 Inertial Reference Unit Gyros
Inputs to the MACS were measurements from the inertial reference unit rate gyros. All gyros had a
bandwidth of approximately 2.0 Hz (-6db)4, 5, 7, 9, 10. Gyro data was sampled every 0.128 sec. The
measurements taken were the number of counts (0.05 arcsec per count) since the last sample. A digital
inertial reference unit prefilter provided protection from structural resonant frequencies being aliased within
the control bandwidth. Normally, the prefilter was only used in the orbit adjust mode. Other attitude
measurements included two Earth sensors, three course sun sensors, a fine sun sensor, and fixed head star
tracker . These sensors did not have the sampling frequency and resolution suitable for this study.
UARS inertial reference unit rate gyros were the most useful measurement source for this study. In Fig. 7
are time histories of the roll, pitch and yaw gyro counts. The solar array thermal snaps were the most
pronounced events recorded with the inertial reference unit. These occured due to the rapidly changing
thermal conditions of the solar array as it crossed the Earth's penumbra. This is illustrated in Fig. 8. The
pitch gyro data also shows orbital as well as attitudinal trends. Because most of the orbital motion was
11
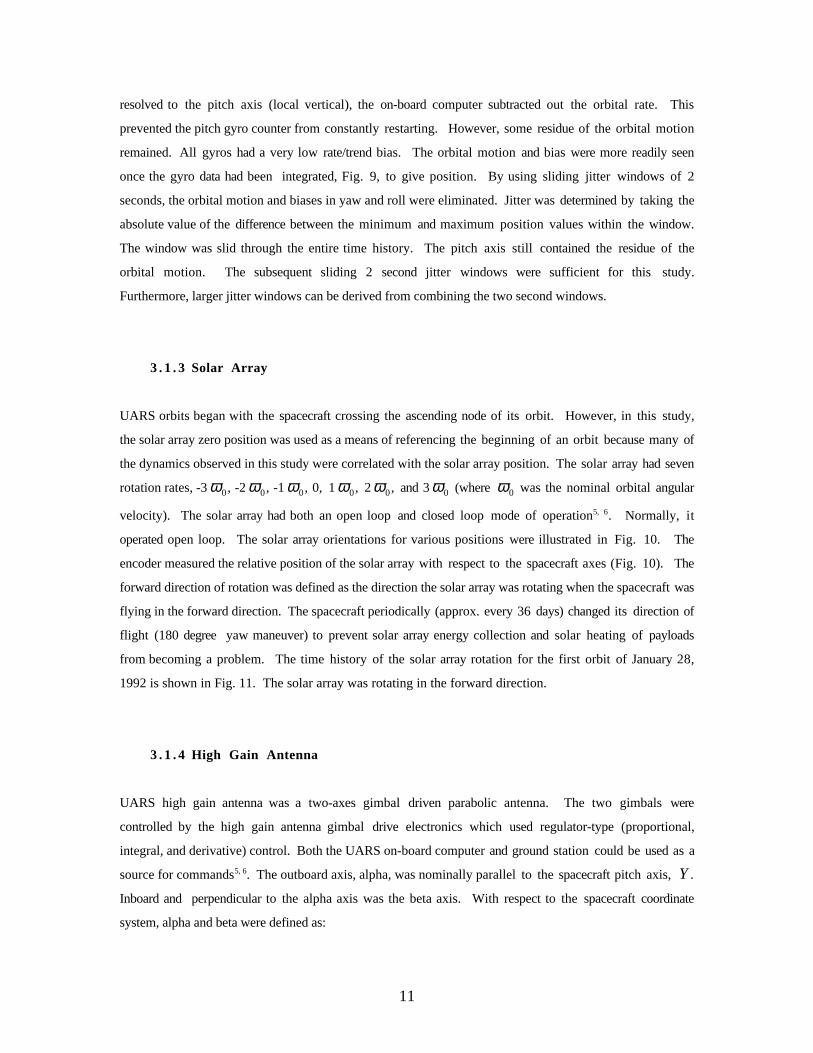
resolved to the pitch axis (local vertical), the on-board computer subtracted out the orbital rate. This
prevented the pitch gyro counter from constantly restarting. However, some residue of the orbital motion
remained. All gyros had a very low rate/trend bias. The orbital motion and bias were more readily seen
once the gyro data had been integrated, Fig. 9, to give position. By using sliding jitter windows of 2
seconds, the orbital motion and biases in yaw and roll were eliminated. Jitter was determined by taking the
absolute value of the difference between the minimum and maximum position values within the window.
The window was slid through the entire time history. The pitch axis still contained the residue of the
orbital motion. The subsequent sliding 2 second jitter windows were sufficient for this study.
Furthermore, larger jitter windows can be derived from combining the two second windows.
3 . 1 . 3 Solar Array
UARS orbits began with the spacecraft crossing the ascending node of its orbit. However, in this study,
the solar array zero position was used as a means of referencing the beginning of an orbit because many of
the dynamics observed in this study were correlated with the solar array position. The solar array had seven
rotation rates, -3 ω0, -2 ω0, -1 ω0, 0, 1 ω0, 2 ω0, and 3 ω0 (where ω0 was the nominal orbital angular
velocity). The solar array had both an open loop and closed loop mode of operation5, 6. Normally, it
operated open loop. The solar array orientations for various positions were illustrated in Fig. 10. The
encoder measured the relative position of the solar array with respect to the spacecraft axes (Fig. 10). The
forward direction of rotation was defined as the direction the solar array was rotating when the spacecraft was
flying in the forward direction. The spacecraft periodically (approx. every 36 days) changed its direction of
flight (180 degree yaw maneuver) to prevent solar array energy collection and solar heating of payloads
from becoming a problem. The time history of the solar array rotation for the first orbit of January 28,
1992 is shown in Fig. 11. The solar array was rotating in the forward direction.
3 . 1 . 4 High Gain Antenna
UARS high gain antenna was a two-axes gimbal driven parabolic antenna. The two gimbals were
controlled by the high gain antenna gimbal drive electronics which used regulator-type (proportional,
integral, and derivative) control. Both the UARS on-board computer and ground station could be used as a
source for commands5, 6. The outboard axis, alpha, was nominally parallel to the spacecraft pitch axis, Y.
Inboard and perpendicular to the alpha axis was the beta axis. With respect to the spacecraft coordinate
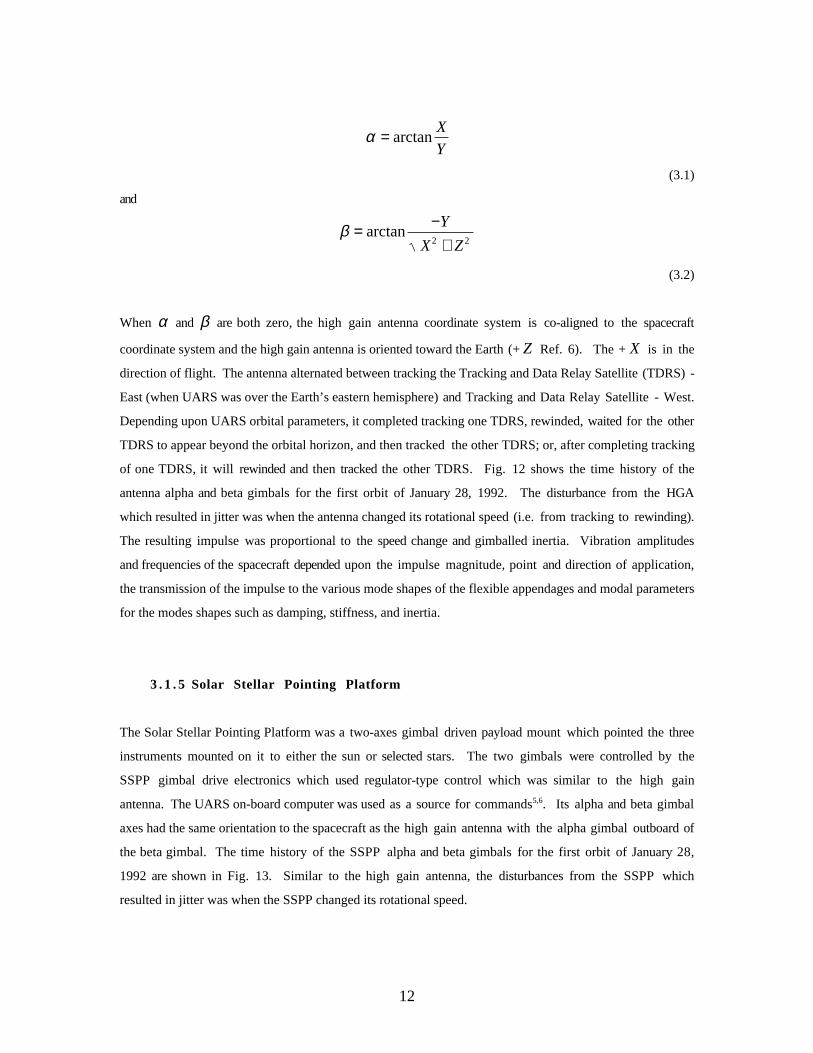
system, alpha and beta were defined as:
12
α = arctanX
Y
(3.1)
and
β = arctan−Y
X2 + Z2
(3.2)
When α and β are both zero, the high gain antenna coordinate system is co-aligned to the spacecraft
coordinate system and the high gain antenna is oriented toward the Earth (+ Z Ref. 6). The + X is in the
direction of flight. The antenna alternated between tracking the Tracking and Data Relay Satellite (TDRS) -
East (when UARS was over the Earth’s eastern hemisphere) and Tracking and Data Relay Satellite - West.
Depending upon UARS orbital parameters, it completed tracking one TDRS, rewinded, waited for the other
TDRS to appear beyond the orbital horizon, and then tracked the other TDRS; or, after completing tracking
of one TDRS, it will rewinded and then tracked the other TDRS. Fig. 12 shows the time history of the
antenna alpha and beta gimbals for the first orbit of January 28, 1992. The disturbance from the HGA
which resulted in jitter was when the antenna changed its rotational speed (i.e. from tracking to rewinding).
The resulting impulse was proportional to the speed change and gimballed inertia. Vibration amplitudes
and frequencies of the spacecraft depended upon the impulse magnitude, point and direction of application,
the transmission of the impulse to the various mode shapes of the flexible appendages and modal parameters
for the modes shapes such as damping, stiffness, and inertia.
3 . 1 . 5 Solar Stellar Pointing Platform
The Solar Stellar Pointing Platform was a two-axes gimbal driven payload mount which pointed the three
instruments mounted on it to either the sun or selected stars. The two gimbals were controlled by the
SSPP gimbal drive electronics which used regulator-type control which was similar to the high gain
antenna. The UARS on-board computer was used as a source for commands5,6. Its alpha and beta gimbal
axes had the same orientation to the spacecraft as the high gain antenna with the alpha gimbal outboard of
the beta gimbal. The time history of the SSPP alpha and beta gimbals for the first orbit of January 28,
1992 are shown in Fig. 13. Similar to the high gain antenna, the disturbances from the SSPP which
resulted in jitter was when the SSPP changed its rotational speed.
13
3 . 2 Instruments
3 . 2 . 1 Halogen Occultation Experiment
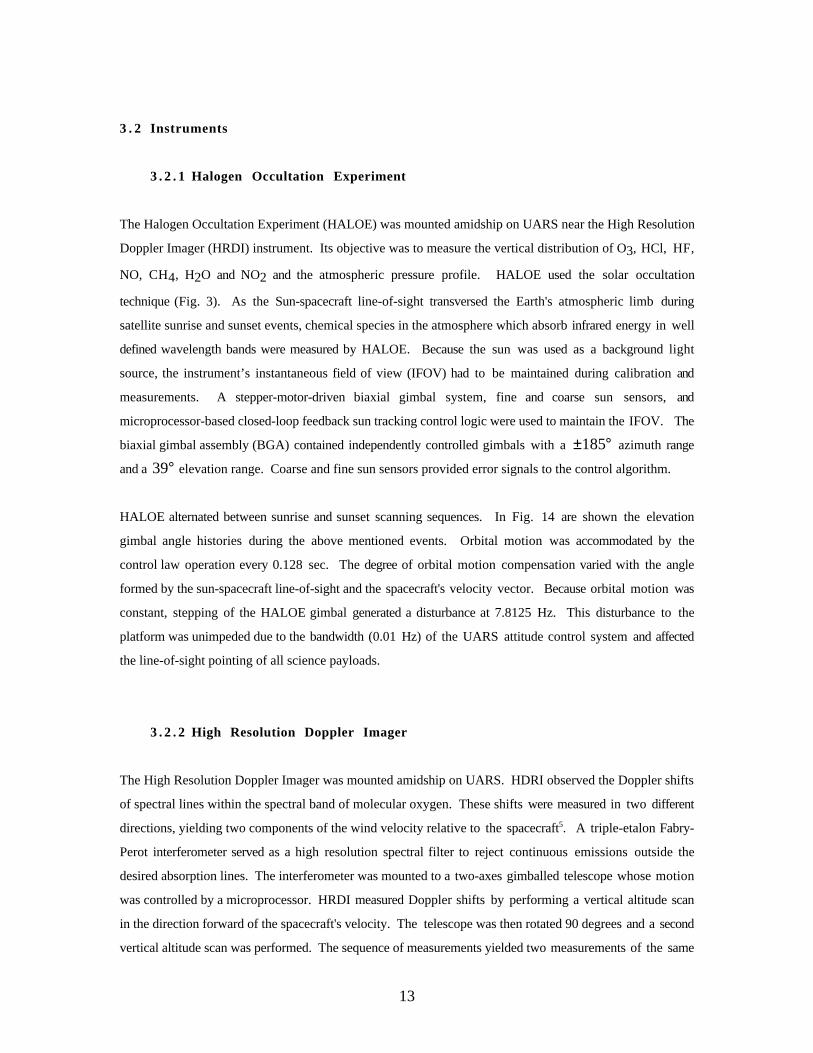
The Halogen Occultation Experiment (HALOE) was mounted amidship on UARS near the High Resolution
Doppler Imager (HRDI) instrument. Its objective was to measure the vertical distribution of O3, HCl, HF,
NO, CH4, H2O and NO2 and the atmospheric pressure profile. HALOE used the solar occultation
technique (Fig. 3). As the Sun-spacecraft line-of-sight transversed the Earth's atmospheric limb during
satellite sunrise and sunset events, chemical species in the atmosphere which absorb infrared energy in well
defined wavelength bands were measured by HALOE. Because the sun was used as a background light
source, the instrument’s instantaneous field of view (IFOV) had to be maintained during calibration and
measurements. A stepper-motor-driven biaxial gimbal system, fine and coarse sun sensors, and
microprocessor-based closed-loop feedback sun tracking control logic were used to maintain the IFOV. The
biaxial gimbal assembly (BGA) contained independently controlled gimbals with a ±185° azimuth range
and a 39° elevation range. Coarse and fine sun sensors provided error signals to the control algorithm.
HALOE alternated between sunrise and sunset scanning sequences. In Fig. 14 are shown the elevation
gimbal angle histories during the above mentioned events. Orbital motion was accommodated by the
control law operation every 0.128 sec. The degree of orbital motion compensation varied with the angle
formed by the sun-spacecraft line-of-sight and the spacecraft's velocity vector. Because orbital motion was
constant, stepping of the HALOE gimbal generated a disturbance at 7.8125 Hz. This disturbance to the
platform was unimpeded due to the bandwidth (0.01 Hz) of the UARS attitude control system and affected
the line-of-sight pointing of all science payloads.
3 . 2 . 2 High Resolution Doppler Imager
The High Resolution Doppler Imager was mounted amidship on UARS. HDRI observed the Doppler shifts
of spectral lines within the spectral band of molecular oxygen. These shifts were measured in two different
directions, yielding two components of the wind velocity relative to the spacecraft5. A triple-etalon Fabry-
Perot interferometer served as a high resolution spectral filter to reject continuous emissions outside the
desired absorption lines. The interferometer was mounted to a two-axes gimballed telescope whose motion
was controlled by a microprocessor. HRDI measured Doppler shifts by performing a vertical altitude scan
in the direction forward of the spacecraft's velocity. The telescope was then rotated 90 degrees and a second
vertical altitude scan was performed. The sequence of measurements yielded two measurements of the same
14
region of the atmosphere in a time interval which was relatively short compared to the characteristic time
scales for changes in the wind field. HRDI had an open-loop scan profile for the day and a different open-
loop scan profile for the night part of the orbit which are shown in Fig. 15
In Figs. 16 and 17 are shown the effect of the attitude control system on accommodating the HRDI scans.
When HRDI started its night scan, the attitude control system had no influence on how its motion effected
the spacecraft. During the HRDI day scan, the frequency was low enough that the attitude control system
had some effect on the subsequent motion of the spacecraft. The HRDI telescope had a smaller inertia ratio
than the other instruments but its scanning frequency during the night portion of an orbit had significant
effect on the spacecraft motion. The inertia ratio between the gimballed instruments and subsystems to the
spacecraft inertia is given in Table 3. The inertia ratio had a significant effect on how much subsequent
motion the spacecraft had due to the motion of the instruments. This was due to the same torque being
applied to the payload and to the spacecraft but in an opposite sense. The subsequent motion of the payload
and the spacecraft was proportional to their respective inertia resolved to the gimbal drive shaft. Observed,
Fig. 16, on UARS was a switching of scanning profiles of the High Resolution Doppler Imager and the
corresponding yaw angular position of UARS. UARS attitude control system had a control bandwidth of
0.01 Hz. Before 3420, the scanning pattern had a frequency of 0.083 Hz and amplitude of 74 deg. After
3420 seconds, HRDI had a scanning frequency of 0.0067 Hz and amplitude of 51 deg. The HRDI azimuth
gimbal history and the resulting yaw motion are shown in Fig. 17. It is readily apparent that the effect of
the attitude control system on jitter was to attenuate rigid-body motion if it was within the controller
bandwidth or roll-off.
3 . 2 . 3 Microwave Limb Sounder
The Microwave Limb Sounder (MLS) had two gimballed parts. The antenna stepping history and the
switching mirror position history for a complete orbit are shown in Fig. 18 (Ref. 5). An microwave
antenna scanned the vertical profile of the atmosphere. The scan cycle of 65.5 seconds consisted of a
forward limb viewing trace followed by a rewind. At the beginning and end of an orbit, the antenna steps
were adjusted to account for the Earth's oblateness. A switching mirror was synched with the antenna and
moved through three positions: an internal calibration target; a zero-reference space view; and the
atmospheric signal from the antenna system (limb). The inertia ratio for MLS was far higher than that of
HRDI but the attitude control system had more influence on the subsequent MLS motion as compared with
what it had with on HRDI night scan. The motion profile of the MLS and the motion of the spacecraft
about its roll axis are shown in Fig. 19. The MLS antenna scanning frequency was 0.015 Hz. Similar to
15
the HRDI day scan, the attitude control system attenuated the subsequent rigid-body motion due to the
antenna motion.
3 . 3 Elastically Flexible-Body Motion
The flexible appendages of UARS which had structural resonance frequencies within the Nyquist frequency
of the rate gyros were the extension boom for the Zenith Energetic Particle System instrument and the solar
array. Before launch, the primary known excitations of these appendages were impulses due to instrument
change in motion. All pre-launch analysis was performed using a structural finite element model of the
UARS spacecraft. The flexible appendages of the spacecraft could each be considered as a free-free beam
with a tip mass and tip inertia due to the spacecraft. Ref. 16 has shown that such a consideration will allow
one to predict variations of modal properties as one changes boundary conditions. In the case of the UARS
appendages, the changes were due to solar array edgewise and flatwise modes transverse vibration. During
solar array rotation, the tip inertia of the array (the spacecraft) varies. Thus, in one configuration the
transverse vibration for one mode had the spacecraft yaw inertia as its tip inertia. As the solar array rotated
through 90°, the same mode had the roll inertia as its tip boundary condition. Because the yaw inertia was
triple that of the roll inertia, the finite element analysis of the solar array modes resulted in 18.7 %
variation in the solar array 1st bending mode and a 19.4 % variation in the solar array 1st bending edgewise
mode. The variation of these two modes with the solar array position is depicted in Fig. 20. The small
difference in frequency between 90° and 180° is because the solar array center of gravity is offset from its
rotational axis. The fixed appendages such as the Zenith Energetic Particle System boom had its modal
properties vary because as the solar array rotates, it changed the overall system inertia.
Tables 7 through 9 are the result of performing power spectral density analysis at various solar array
positions using the in-flight roll, pitch and yaw gyro data. At each position, the dominant frequencies from
the PSDs are listed in descending order. Since the gyros are collocated, one could not determine the mode
shape associated with each frequency. Thus it was very difficult to conclusively identify the modes of
vibration. Examination of the two solar array modes near .25 Hz does indicated that their values did varied
with solar array position. However, identifying which mode was the flatwise and which was the edgewise
cannot be achieved using only gyro measurements. Vibration about the roll gyro was dominated by the .94
Hz mode during most of the orbit. Similarly, the 2.93 Hz mode dominated the vibration about the yaw
axis. The vibration about the pitch axis was dominated by the .94 Hz mode also and one or both of the
0.25 Hz solar array modes. In Tables 8 and 9, are shown the frequencies of 0.085 Hz for solar array
positions of 90°, through 180° which were due to the night scan of HRDI instrument. Although most
of the tabulated frequencies were in proximity to the values derived from finite element analysis, some could
16
not be attributed to any known pre launch prediction such as the .40 and .57 Hz modes about the yaw axis;
the .33 Hz modes about roll at 45° and 135° ; and, the 0.0363 Hz found about roll and yaw at 0°.
The jitter response was the result of all rigid-body motion and vibratory motion of the flexible elastic
appendages imparted to the main platform. In Fig. 21, the jitter response for roll, pitch, and yaw are
shown. Disturbance events are annotated, Table 6, on the jitter time histories. During the entire orbit, the
Microwave Limb Sounder (MLS) instrument was constantly scanning. The High Resolution Doppler
(HRDI) instrument was also constantly scanning but used two scan profiles for orbital day and night (events
2 and 15 were the transitions.) Sunset and sunrise thermal snaps resulted in the most prominent jitter
responses. Impulses due to the instruments and subsystems were proportional to the inertia of the payloads
and how much the slew rate and direction had changed. The flexible modes excitation will depended upon
the orientation of the appendage and the axis about which the instrument moved. All events produced a
noticeable change in the jitter response of one or more gyros. The rewind of the MLS antenna appeared as
65 s lobes on the roll jitter response.
The pitch gyro accommodated the changes in pitch attitude as well as the orbital motion in an inertial frame
of reference. As a means of keeping the gyro from constantly having to restart its counter, the orbital rate
was subtracted from the pitch gyro measurements using UARS on-board computer. The harmonic variation
in the pitch response was the residue orbital motion which was not subtracted out. The jitter response was
due to all the numbered events and the continuous disturbances due to HRDI and MLS.
The spectral histories for the roll axis are depicted in Figs. 22 and 23. Disturbances are also annotated for
the spectral densities. All spectral analyses were normalized to the peak value for each analysis. The Figs.
illustrate that during the entire orbit, the energy level that the modes have was varying. The 0.25 Hz modes
were constantly excited for the entire orbit. Modes near 1.0 Hz were excited during most of the orbit.
However, neither the 0.25 Hz nor the 1.0 Hz modes were constantly dominant mode (Table 7). There were
periods during the orbit where modes were excited but there was no known disturbances such as between
events 15 and 16 (Table 6).
17
4 . 0 Subsystem and Instrument Contribution to Space Dynamic Response
4 . 1 Solar Array Drive
One of the first results from the May 1 experiment was the unexpected vibration level of the edgewise and
flatwise modes and the five-minute beats dominating roll and yaw responses. The Wind Imaging
Interferometer science instrument on UARS had a roll and yaw jitter requirement of 4 arc-s/ 2 s (i.e., 4 arc-s
during a 2 s window) which was the minimum spacecraft jitter requirement. All jitter time histories in this
paper used a 2 s window duration. Figs. 24 and 25 (from the May 1, 1992 experiment) show the roll and
yaw jitter response during the ascending part of two orbits in the experiment. During the approximately
34-minute period (78973-81000 s past start of day) when all major disturbances known before launch were
quiescent, roll jitter exceeded 15.0 arc-s/ 2 s and yaw jitter exceeded 6.0 arc-s/2 s (Figs. 4b and 5b). Figs.
24 and 25 also show repeated 5-minute (approximately) beats for roll and yaw. Furthermore, power spectral
density frequency analysis indicated strong excitation of the solar array fundamental flatwise and edgewise
modes.
The figures also show the response with respect to spacecraft latitude and solar array position. Because the
solar array rotated once per orbit, any anomalies it experienced which were specific to a particular solar array
position would also be specific to a particular latitude in orbit. Many of the jitter peaks occurred during
approximately the same latitudes in orbit. The response for two orbits is shown to demonstrate that the
jitter anomalies occur every orbit. The roll jitter response (Fig. 24) had two distinct beats at approximately
20o S and 20o N. In both orbits, the jitter exceeded 15 arc-s. The smaller 5-minute beats that came before
and after the two major beats were also repeated. The yaw jitter response (Fig. 25) had three distinctive
beats at approximately 20o S, 2o S and 20o N. During most of the yaw jitter beats, the 4 arc-s/ 2 s jitter
requirement was exceeded. None of the anomalies were due to thermal snap of the solar array which
occurred during the descending part of the orbit.
Fig. 26 shows mapping of points on UARS’ ground track that exceeded certain jitter level thresholds.
These mappings used 15 hours of flight data from the 133rd day past launch (January 22, 1992). Data from
this day was not part of the experiment. On January 22, 1992, the solar array was rotating in the forward
direction. During the May 1, 1992 experiment, the solar array was rotating in the reverse direction.
Thresholds are 4 arc-s/2 s (minimum jitter requirement), Fig. 26a, and 10 arc-s/2 s, Fig. 26b. From Fig.
26, it can be seen that the jitter exceeded the thresholds only at certain latitudes. The 10 arc-s/2 s roll jitter
threshold, Fig. 26b, was exceeded at latitudes of 57o S (sunrise thermal snap), 46oN (sunset thermal snap),
10o S, and 38oS.
18
Analysis of Figs. 24 through 26 showed that the jitter response was latitude specific with different response
characteristics for forward and backward rotation of the solar array. The dominant trends in the jitter patterns
were independent of any subsystem or instrument dynamics but varied with solar array position. The
correlation of jitter to solar array position was constant. However, the correlation of jitter to groundtrack
latitude was valid for short term (approximately one day) due to the precession of the orbit. The link
between the spacecraft jitter and spacecraft latitude is warranted because many of the science measurements
were referenced to latitude. If the measured jitter levels exceeded instrument pointing requirements
consistently for certain latitudes, then the impact of the excessive jitter could result in science measurement
anomalies being incorrectly attributed to atmospheric phenomena. The latitude of the false measurement
anomalies also precessed with orbit. Ref. 15 has presented case studies which demonstrated the impact of
excessive jitter on science measurements. The aforementioned findings refocused the efforts of the
investigation to identify and analyze the excitation source.
On June 2, 1992 (day 265 past launch), after the spacecraft yaw maneuver immediately following the May
1, 1992 experiment, the solar array stopped rotating unexpectedly. It also started rotating approximately 50
minutes afterward without any commands being given. Figs. 27 and 28 (from June 2, 1992 flight data)
show the solar array position and the spacecraft roll displacement as the solar array stopped and as it started
again, respectively. Before stopping at approximately 72950 s, the roll gyro measured attitude
displacements which exceeded 1.0 arc-s during the 0.128s sampling intervals. The significant reduction in
jitter when the solar array stopped rotating validated the conclusion that the solar array drive was the source
of jitter. When the solar array started rotating again, the impulse resulted in roll attitude displacements in
excess of 1.2 arc-s during the 0.128s sampling intervals. Furthermore, the roll displacement exceeded
levels of 0.5 arc-s 50 s after the impulse. The prime contractor for the UARS, General Electric,
investigated the cause of the anomaly. They found that the solar array drive stepper motor output, which
had 23 pulses/s, transmitted through the harmonic drive, which had a 100:1 reduction ratio, produced a
harmonic drive output of 0.23 pulses/s. The harmonic drive output frequency resonated the solar array
edgewise and flatwise modes. Stopping the solar array eliminated the excitation source. The reduction in
vibration also reduced the solar array flexing being transmitted back to the gear drive.
Ref. 8 had measured the free-decay damping of the spacecraft response to the solar array stopping to be 2.8%
and had attributed this damping to the solar array edgewise mode of vibration. However, the friction in the
gear drive was the probable cause of the high damping ratio. Because the edgewise mode of vibration was
constrained by the gear drive, all of these damping effects would have significantly attenuated structural
vibration of the solar array edgewise mode. Furthermore, when the gear drive clutch was locked and other
disturbances were active, there was no high value of damping observed for the solar array flatwise and
19
edgewise modes. The damping effect of the gear drive countered the resonating effect of the solar array
harmonic drive output. Friction in the gear drive attenuated energy placed into the solar array at the
resonant frequency by the harmonic drive. The result was that the solar array had large but bounded levels
of vibration. Therefore, any catastrophic damage to the solar array drive was prevented. However, the
excessive flexing of the solar array transmitted through the gear drive could reduce the life of the drive.
4 . 2 Solar Array Modal Contribution
The two fundamental solar array modes of vibration dominated the spacecraft motion response. An
objective of this investigation was to determine which mode had a larger contribution to the response.
Because the only sensors suitable for this study (in terms of frequency and resolution) were the spacecraft
gyros, vibration modes could not be identified from measurements alone. To determine which solar array
mode dominated the response, the following reasoning was used. Although the solar array harmonic drive
output frequency (0.23 Hz) was near the resonant frequencies of the solar array flatwise and edgewise modes
(0.2 to 0.3 Hz), the solar array harmonic drive torque output was almost orthogonal to the flatwise mode
but not with the edgewise mode. Since the modes are nearly mutually orthogonal, one can examine the
response for the roll and yaw axis at the solar array positions which are 90° apart.
When the solar array was at the 180° or 360° position, the flatwise mode vibrated about the yaw axis and
the edgewise mode vibrated about the roll axis (Figs. 24 and 25). At the 270° position, the flatwise mode
vibrated about the roll axis and the edgewise mode vibrated about the yaw axis. If the flatwise mode
dominated the response, one should expect to see a roll amplitude higher at the 270° position than at the
180° and 360° positions. Similarly, if the edgewise mode dominated the response, one should expect to see
a yaw amplitude higher at the 270° position than at the 180° and 360° positions. At approximately 240°
and 300°, both modes contributed to the roll and yaw jitter response which resulted in the higher
amplitudes. The roll jitter amplitude was higher at the 180° and 360° positions than it was at the 270°
position. Yaw jitter amplitude was higher at the 270° position than it was at the 180° and 360° positions.
Therefore, one can infer that the edgewise mode was the dominant mode of vibration.
20
4 . 3 High Gain Antenna Drive
Flight data revealed that the high gain antenna experienced stiction (static friction) as shown in Fig. 29. At
approximately 4720 s, the discontinuity in the periodic wave form was caused by the antenna overcoming
static friction. Overcoming the stiction produced an impulse and subsequent roll jitter response of 0.8 arc-s.
In addition to the stiction, the high gain antenna harmonic drive was also a disturbance source. Because of
the June 2, 1992 solar array anomaly, the solar array was placed in an active control mode and then its
rotation was stopped such that it would maximize solar incidence while stationary. It remained in this
position for 42 days. However, during this time, isolated high gain antenna disturbances were then
observed and analyzed.
The harmonic drive output frequency, ωHD (Hz), for a payload having a rotational speed of θ (°/s) was:
ω θHD
HD SGN N= 2
360
˙
(4.1)
where NHD and NSG were the speed reduction ratios for the harmonic drive and the spur gear, respectively.
The above expression represented the case where the harmonic drive speed reduction preceded that of the spur
gear. The solar array reduction ratios, NHD and NSG, were 100 and 6.81, respectively. The high gain
antenna and the Solar/Stellar Pointing Platform reduction ratios, NHD and NSG, were 200 and 3.24,
respectively. The Solar/Stellar Pointing Platform was a gimballed instrument containing three UARS
science instruments. The solar array, the high gain antenna and Solar/Stellar Pointing Platform
targeting/tracking rotational speeds of approximately 0.06 °/s produced harmonic drive output frequencies
of 0.23 Hz, 0.22 Hz and 0.22 Hz, respectively. The output frequencies resonated the solar array flatwise and
edgewise modes (Fig. 4). The high gain antenna positioning (rewind) rotational speed of 0.31 °/s produced
a harmonic drive output frequency of 1.12 Hz which resonated modes 6 and 7 (Fig. 4).
The effect that the high gain antenna harmonic drive had on jitter is shown in Figs. 29 and 30 using data
from the 266th day past launch (June 3, 1992). The high gain antenna was targeting one of the tracking
data and relay satellite spacecraft from 4600 s (past start of day) to approximately 5350 s. Afterwards, it
positioned itself for the other tracking data and relay satellite. From 4600 to 4800 s, the high gain antenna
targeting maneuver was an isolated disturbance. Fig. 29 shows the time history of the time history of the
high gain antenna alpha gimbal with the rotation removed (4600-4800 s) and roll jitter (4600-4800 s) while
the high gain antenna was targeting a tracking data and relay satellite.
21
Frequency analysis is shown in Fig. 30 for the high gain antenna targeting and positioning maneuvers
using roll and pitch gyro data. Figs. 30a and 30c show the power spectral density of the roll and pitch gyro
data, respectively, during the targeting maneuver. The figures indicate that the harmonic drive on the high
gain antenna was also an excitation source of the solar array edgewise and flatwise modes. Fig. 29b shows
that the jitter was up to 1.0 arc-s/2 s during targeting. From 5600 to 5800 s, the only disturbance present
was the high gain antenna during its positioning (rewind) maneuver. Figs. 30b and 30d show the power
spectral of the roll and pitch gyro data, respectively, during the positioning maneuver. The modes excited
by the positioning maneuver are annotated. During the positioning maneuver, the modes near
approximately 0.7, 0.95 and 1.1 Hz were excited. Although 1 arc-s is small with respect to the UARS
pointing requirement of 4 arc-s, the identification of the disturbance is important for future spacecraft
because the response amplitude will be higher if the disturbance has a higher transmission to the solar array
modes or if the spacecraft size is smaller.
4 . 4 HRDI and MLS
The contribution that the High Resolution Doppler Imager (HRDI) had on UARS dynamic response is
shown in Fig. 31. Fig. 31a shows the time history of the HRDI azimuth gimbal during the transition
from the HRDI day scan to the night scan. The HRDI telescope views the atmospheric limb on one side of
the spacecraft then turns to view the limb on the other side. The frequency that it repeats this cycle is
0.083 Hz which is outside of the 0.01 Hz attitude control system bandwidth. The HRDI telescope/UARS
yaw inertia ratio is 1.20e-5. The HRDI azimuth scans are about an axis axis parallel to the yaw axis. The
motion of HRDI results in a “tail wagging the dog” effect which is shown in Fig. 31b.
Pre-launch analysis had predicted that the Microwave Limb Sounder (MLS) would produce the largest
spacecraft jitter response (2.6 arc-s/(2 s) about the roll axis). The MLS/UARS roll inertia is 3.90e-4. The
instrument had a scan profile that included 27 forward steps and 2 rewind steps. The total MLS antenna
angular excursion is 1.32°. Fig. 32 shows the MLS antenna steps and the spacecraft roll jitter response for
days 301 and 737. The spikes observed in Figs. 32a and 32d are due the MLS rewind. The peak roll jitter
observed for both day 301 (Fig. 32b) and day 737 (Fig. 32d) was 2.6 arc-s/ (2 s). Roll jitter for the two
days was examined to determine if there was any pronouced change in the dynamic response due to the
complete outgassing of the cryogen from one of the science instruments. The cryogen completely
outgassed on day 603. Although the spacecraft mass was reduced by 7%, there was no significant change in
the roll jitter response.
22
5 . Orbital and Configuration Influences on Spacecraft Dynamic Response
5 . 1 Jitter Amplitude Variation with Tip Inertia Rotation
UARS solar array positions are shown in Fig. 10. The orientation of the solar panels changed 360o each
orbit. When the solar array vibrated, its vibration was imparted to the spacecraft and resulted in spacecraft
vibration. Because of conservation of momentum, the vibration was scaled such that its maximum occurred
when the tip (boundary) inertia was minimum and its minimum occurred when the tip inertia was
maximum. The relation between the roll, Ir , and yaw inertia, I y , (assuming I Iy r> ) is given16 by
I Iy r= α
with α as a proportionality constant. If the solar array was rotating at the orbital angular velocity, ω0 ,
then the tip inertia varied as:
I tI I I I
ttipy r y r( ) =
+
+−
( )
2 22 0sin ω
(5.1)
and the corresponding vibration amplitude, θ t( ) , varied as
θ θ θ θ θ ωt tmax min max min( ) = +
+ −
( )
2 22 0cos
(5.2)
When the disturbance source was the same, the vibration amplitude , θ t( ) , was dependent upon the tip
inertia. By the time integral of conservation of momentum:
I Iy min r maxθ θ=
(5.3)
The variation of spacecraft median roll and yaw jitter (from day 233 past spacecraft launch) with solar array
rotation is shown in Fig. 33. Results from Ref. 7 demonstrated that the solar array edgewise mode was the
dominant mode of vibration. When the solar array was in the 90o/270o position, the edgewise mode vibrated
about an axis parallel to the spacecraft yaw axis and the flatwise mode vibrated about the roll axis. When
the solar array is in the 0o/180o position, the edgewise mode vibrates about an axis parallel to the spacecraft
roll axis and the flatwise mode vibrates about the yaw axis. Therefore, the peaks for yaw and roll median
jitter occurred at the at the 90o/270o and 0o/180o positions, respectively. Thus, analysis of Fig. 33
corroborates Eq. (5.1-5.3).
23
Fig. 34 shows the maximum and average roll jitter for days 128 through 737 past the launch of UARS.
The effect of the solar array rotation direction is apparent. The average and maxima shown in Fig. 34
excluded jitter during the thermal bending of the solar array. Due to the precession of the orbit plane, the
Beta angle swept out an angle of ±80.45° (Ref. 6). At large values of the Beta angle, solar array energy
collection and sun impingement on the payloads became a problem. To alleviate the problem, the
spacecraft was rotated 180° about its yaw axis approximately every 30-36 days. After each yaw maneuver,
the direction of solar array rotation was changed. When the solar array was rotating in reversed direction,
the jitter was higher than when the solar array was rotating in the forward direction as shown in Fig. 34.
The UARS jitter requirement was 4 arc-s/2-s. The significance of this finding, Fig. 34, is that the
requirement was violated more during days when the solar array was rotating in the reverse direction.
Hence, the accuracy of science measurements which had to adhere to the 4 arc-s/2-s requirement varied
approximately every other month.
Because the orbit plane precessed between yaw maneuvers, the tracking instruments varied their tracking
trajectories correspondingly. The change in tracking trajectories produced a corresponding change in the
spacecraft response. Fig. 35 shows the variation in spacecraft roll jitter with Beta angle for the same days
used in Fig. 34. Jitter measurements during thermal bending of the solar array were also excluded from the
results shown in Fig. 35. The dominant trend observed was that as the magnitude of the Beta angle
increased, the roll jitter increased. However, the values in the reversed direction were higher than those in
the forward direction of solar array rotation. It can be inferred from Fig. 35 that between yaw maneuvers,
the jitter levels grew monotonically.
5 . 2 Appendage Modal Variation with Tip Inertia Rotation
One effect of variable spacecraft mass and inertia on appendage transverse vibration was the changing modal
frequencies and mode shapes. Appendix 1 and Ref. 16 present a development and examination of the Euler
beam equation with the appropriate boundary conditions which show short-term (orbital) periodic changes in
modal characteristics when flexible appendages rotated and long-term effects due to mass expenditure (fuel
and/or cryogen expenditures). The following characteristic equation for the Euler beam of length, l , with
tip mass, mtip , and tip inertia, Itip , resulting from Appendix 1 is
24
λ λ λ λω
λ λ λ λ
λω
λ λ λ λ ω λ λ
4
32 2 2
1
1 0
−[ ] +
−[ ]
+
+[ ] +
+[ ] =
cos( )cosh( ) sin( )cosh( ) cos( )sinh( )
cos( )sinh( ) sin( )cosh( cos( )cosh( )
l l l l l l
l l l l l l
m
EI
I
EII m
EI
tip2
tiptip tip
(5.4)
The beam was assumed to have mass/unit length, ρ , modulus of elasticity, E , cross sectional area, A,
and area moment of inertia, I . The root of the characteristic equation normalized by beam length, l , is λand the natural frequency is ω .
Every combination of boundary conditions resulted in different frequencies and mode shapes. However, the
frequencies and mode shapes varied from those of a free-free beam to those of a clamped-free beam as the
mass and inertia both approached infinity. The characteristic equation, Eq. (5.4), results in that of the free-
free beam with no tip mass and no tip inertia; fixed-free for infinite tip mass and infinite tip inertia; sliding-
free for infinite inertia and no tip mass; and pinned-free for infinite mass and no tip inertia. The natural
frequency of the nth mode is given as
ω λ
ρn n
EI= ( )ll
2
4 .
(5.5)
The results demonstrate that using free-free mode shapes for flexible appendages is only valid for spacecraft
with small values of mass and inertia. The cantilever mode shapes are valid only for both large values of
inertia and mass. All values of mass and inertia between zero and infinity have modal properties that are
dependent on Eq. (5.4). Eq. (5.4) demonstrates that orbital variation in the tip inertia (as the solar array
rotates) caused variations in modal frequencies and mode shapes. The variations were harmonic with a
frequency of twice the orbital rate.
As shown in Fig. 36, a consequence of this analysis was that when the modal frequencies varied with orbit,
so did the potential for resonance due to instrument disturbances. The two resonance peaks shown in Fig.
36 were those for the end frequencies of a modal band. A modal band is defined as the resulting range of
frequencies that a mode of vibration can have due to a harmonic change in boundary condition (e.g., rotation
of tip inertia). The resonance peak varied harmonically throughout an orbit (2 cycles per orbit). As mass is
expended (e.g., fuel for orbit adjust, cryogen sublimation), spacecraft mass and inertia will be reduced and
the modal band will be shifted to increasing frequency. Fig. 37 shows the range of the UARS solar array
flatwise and edgewise frequencies measured from day 128 through day 737 for the 90°, 180°, 270° and 360°
25
positions. At each position, there was a spread of the frequencies. However, the lower and upper
extremities of the spread were harmonic with respect to the 360° of rotation. This harmonic variation of
the extremities was indicative of modal bands. The modal band was defined by the highest frequency
observed (0.29 Hz at 180°) and the lowest frequency observed ( 0.21 Hz at 90°). Fig. 37 also shows the
output frequencies for the harmonic drives for the solar array (0.23 Hz), the high gain antenna (HGA, 0.22
Hz) and the gimballed instrument mount (Solar-Stellar Pointing Platform (SSPP), 0.22 Hz). The harmonic
drive output frequencies overlapped the modal band. The implication was that during the orbit, each of the
three harmonic drives was in transitory resonance with the solar array flatwise and edgewise modes of
vibration.
Another implication of this result was that when one considers structural models in control design, one
must consider modal bands instead of discrete frequencies. Controller design must be robust enough to
accommodate entire bands. Furthermore, controllers designed via optimization strategies are usually
designed about some nominal configuration. Thus, variations in modal properties will result in suboptimal
control performance for all other configurations.
5 . 3 Disturbance Transmission Variation with Appendage Rotation
Many disturbances on-board the spacecraft had fixed points of application and direction. Their transmission
through the spacecraft was constant. However, the resulting disturbance response due to rotating flexible
appendages varied with the appendage orientation to the disturbance source. This was true for all
disturbances except for the solar array drive mechanism. The mode shapes changed (due to varying tip
inertia and rotation) their orientation with respect to the disturbances. The overall dynamical system can be
generalized as:
X AX BU
Y CX
= +=
(5.6)
with U fixed, and
B 0 XT t= ( )[ ] Γ , .
(5.7)
The mode shapes, Γ X,t( ) , varied harmonically with a frequency of twice the solar array rotation
frequency (orbital frequency). With fixed disturbances imparted to the rotating solar arrays, the resulting
26
jitter response had amplitude variations that were also harmonic and in synch with twice the solar array
rotation rate. Because the spacecraft’s latitude varied with solar array rotation, the resulting jitter response
was latitude specific7. This result was significant because atmosphere observing satellites may attribute
measurements that appeared as latitude specific to be due to an atmospheric phenomena when it was actually
due to the latitude specific vibration pattern of the platform from which measurements were taken.
Furthermore, since this was due to variation of mode shape orientation with respect to fixed disturbances,
this effect was independent of the tip inertia variation due to rotation of the solar array.
5 . 4 Thermal Elastic Bending Analysis
This section presents analysis of environmental disturbance effects which resulted from the temperature
gradient created when a spacecraft entered or exited the Earth’s terminator. As a spacecraft’s solar array
entered sunlight, the side facing the sun heated at a faster rate than the side not facing the sun11, 12. The
thermal gradient caused the array to bend away from the sun. As the spacecraft entered the Earth’s shadow,
the side facing the sun cools more rapidly than the other side. The solar array temperature gradient was
inversely dependent upon the angle, β . The angle β is defined as the complement of the angle between
the orbit normal and the Earth-to-Sun vector11. Fig. 38 shows the UARS solar array being deployed.
Thermal bending is illustrated in Fig. 8. The bending resulted in an attitude perturbation. Perturbations
were more pronounced about the spacecraft roll axis (axis of least inertia). This was caused by the solar
energy incident on the large surface area of the array panel and the panels large mass moment of inertia
about the spacecraft roll axis. The spacecraft attitude control system responded to the change in attitude
with a correcting torque which restored the spacecraft’s nominal attitude.
The thermal bending of the solar array was the most pronounced disturbance event recorded with the attitude
control system rate gyros. Fig. 39 shows the roll attitude during two orbital sunrises for two orbits with
different β angles. These angles are indicated on Figs. 39a and 39b. The peaks in Fig. 39, caused by solar
array thermal bending, were approximately 125 arc-s and 75 arc-s for β angles of 25° and 38°, respectively.
In addition to thermal bending, the solar array shadow temporarily shielded the instrument boom containing
the Zenith Energetic Particle System instrument from the sun. This resulted in the thermal elastic bending
of that boom being delayed by 300-400 s. The delay varied inversely with the Beta angle. The instrument
boom bending effects were less pronounced because of the smaller solar incident surface area and smaller
mass inertia. Furthermore, the bending stiffness for the instrument boom was an order of magnitude higher
than that of the solar array. Much attention has been focused on the solar array thermal bending and its
effect on the science measurements. However, the instrument boom produced a roll attitude displacement of
12 arc-s. This displacement may also have had some marginal effect on science measurements.
27
Data from orbits was examined at approximately 15 day intervals from day 128 through 737 past launch.
The trough-to-peak roll attitude displacement and displacement duration was measured for each orbital sunset
and sunrise thermal bending event. The displacements were then correlated with the β angle and solar array
orientation during the displacement. Figs. 40 and 41 show the trough-to-peak roll attitude displacement
resulting from thermal bending of the solar array during orbital sunrise and sunset, respectively. The
displacements are annotated (rounded to nearest arc-s) for the respective β angle and solar array position.
The magnitude of roll attitude perturbation was dependent upon the β angle and solar array orientation with
respect to the drive shaft.
During orbital sunrise, Fig. 40, the displacement was larger for Beta angles near 17° and solar array
orientations of 160°. The sunrise attitude displacements was as high as 271 arc-s. During orbital sunset,
Fig. 41, the displacement was larger for Beta angles near 0° and solar array orientations near 90°. The
sunset attitude displacement was as high as 425 arc-s. The perturbation events were usually 180 s in
duration. Duration was dependent upon the β angle and the solar array orientation with respect to its drive
shaft. The solar array completed approximately 1/3 revolution between sunset and sunrise. When the solar
array was oriented at 90° (or 270° position) for maximum electrical power production, it also experienced
the maximum attitude perturbation for sunset (sunrise).
The effect of spacecraft mass loss on thermal bending was also examined. UARS cryogen was completely
outgassed on May 5, 1993 (day 603). UARS launch weight was 14820 lbs. Approximately 7% of UARS
mass was outgassed. The mass loss should have resulted in the perturbation amplitude changing
approximately 7%. Perturbations varied 180% due to variations in β angles. Perturbations varied 323%
due to variations in solar array orientation angles. Figs. 42a and 42b show the roll attitude displacements
from days 128 through 737 for sunset and sunrise thermal snaps, respectively. The displacements were
referenced to the solar array position (ordinate) and day past launch (abscissa). The displacements were
annotated similar to Figs. 40 and 41. The β angles for the displacements given in Figs. 42a and 42b are
given in Fig. 42c. The effect of changing solar array position or Beta angle dominated the influence of
thermal bending. Measurement of mass loss effects on thermal bending was not discernible due to the
those effects.
UARS must meet a long-term stability requirement of bounding roll attitude displacement to 108 arc-s
during any 60 s interval. Many of the perturbations examined violated this requirement. The stability
requirements were necessary for interpretation of science data. Analysis has shown that the thermal bending
of the solar array results in trough-to-peak roll attitude displacements of 425 arc-s during a 47 s interval.

28
The perturbations have also been observed on LANDSAT 4 and 5. Symmetric dual solar array satellites
experienced such perturbation but they are more pronounced for asymmetric single arrays. When
unobstructed viewing from the spacecraft side is required, such as on UARS or the Earth Observing System
A.M. satellite, it is necessary to use single array spacecraft. Because the perturbations violated the long-
term stability requirements and can be expected for single array spacecraft, it is critical that spacecraft
designers have valid models to predict the response to thermal bending.
29
Concluding Remarks
Analysis using the Upper Atmosphere Research Satellite (UARS) flight data from the first 737 days past
launch has provided better understanding of UARS in-flight dynamics. The investigation included two in-
flight experiments on May 1, 1992 and September 17, 1993 which measured responses caused by
disturbances on the satellite and the interaction between instruments. The solar array and the high gain
antenna harmonic drives were identified as the excitation sources. High gain antenna stiction was also
identified.
The solar array drive’s harmonic drive output frequency resonated the solar array edgewise and flatwise
modes with higher transmissivity to the edgewise mode. The solar array edgewise mode was the dominant
mode of vibration. The response was latitude-specific with different jitter characteristics for forward and
reverse rotation of the solar array. Because the edgewise mode of vibration was constrained (less slippage
and flexing) by the gear drive, the drive damping countered the resonating effect of the solar array drive
harmonic drive output. The solar array had bounded levels of vibration which exceeded the spacecraft
pointing requirements. Because of the drive damping, catastrophic damage to the solar array was prevented.
However, the flexing of the solar array panel transmitted through the gear drive may have reduced gear drive
life.
Analysis of the high gain antenna showed that the drive excited the solar array edgewise and flatwise modes
during targeting and two other structural modes during positioning. The high gain antenna also experienced
stiction (static friction) which also produced a measurable disturbance. Although the jitter (up to 0.8 arc-s)
was far less than that caused by the solar array, the amount was large enough to consider in the overall jitter
budget of smaller spacecraft that must maintain pointing requirements similar to UARS.
Although UARS had many disturbance sources, orbital and configuration changes greatly influenced the
dynamic response. Flight data has shown that modal frequencies and jitter amplitudes varied with a
frequency of twice the solar array rotation rate. The variation of the solar array modal frequencies (near .25
Hz) produced a modal band. Within the band, the resonance frequency varied harmonically. Three UARS
disturbances had frequencies which overlapped the modal band and thus produced a transitory resonance.
Another consequence of modal variations due to configuration change was that disturbance transmission was
also dependent upon the modal properties of a system. Hence, as the modal properties changed the
disturbance transmission path changed.
30
Flight data indicated that both elastically flexible appendages experienced thermal elastic bending as the
spacecraft crossed the Earth’s terminator. Furthermore, the solar array provided a temporary shield between
the boom containing the Zenith Energetic Particle System and the sun. This shield resulted in the thermal
elastic bending of that boom being delayed by 300-400 s. The displacement was inversely dependent upon
the Beta angle, β .
Analysis of the thermal elastic bending of the solar array has shown the effect of Beta angle and the solar
array orientation on the spacecraft dynamic response. Trough-to-peak amplitude variation were as high as
425 arc-s. During sunset, the bending was higher for Beta angles near 0° and solar array orientation of near
90°. The roll attitude perturbations resulting from the solar array bending varied 180% due to Beta angle
variations and 323% due to solar array orientation variations. The effect of the 7% mass loss on the
thermal bending perturbations was not discernible due to the effects of array orientation variations and Beta
angle variations.
The precession of the orbit caused the β angle to increase. Solar and stellar tracking instruments adjusted
their tracking trajectories to accommodate the precession. The increased tracking activity produced higher
disturbance levels which resulted in higher jitter amplitudes as the β angle increased. Between yaw
maneuvers, the jitter increased monotonically. The direction of solar array rotation also had a pronounced
effect on the subsequent jitter levels. The reversed solar array rotation resulted in higher jitter amplitudes
than forward rotation.

31
Acknowledgments
The author extends his appreciation to the following people for their assistance and support: William L.
Grantham, Jerry Newsom, John G. Wells Jr., Sudha M. Natarajan, and Janet L. Barnes of NASA Langley
Research Center; Ansel Butterfield of Bionetics; Richard R. Lay and Robert F. Jarnot of the Jet Propulsion
Laboratory; David A. Gell of University of Michigan; Richard Quinn, John Molnar, Anthony Camello,
Eric Tate, Mike Garnek, Bob Hughes, John Stetson, Lara Phillip and George Futchko of Lockheed Martin;
Farell Scott of Florida A and M University; and Richard Beck, Bob Neff, and, Sandy Austin of NASA
Goddard Space Flight Center and Joseph Laufer.
32
References
1Grantham, W. L., "NASA Future Mission Needs and Benefits of Controls-Structures Interaction
Technology," NASA TM 104034, Jan 1991.
2Trevathan, C. E. and Burr, P. T. "Mission Requirements Document for the Upper Atmosphere Research
Satellite," NASA Goddard Space Flight Center Document 430-1601-001, Sept. 1984.
3Butterfield, A. J. and Woodard, S. E., “Measured Spacecraft Instrument and Structural Interactions,”
Journal of Spacecraft and Rockets, Vol. 33, No. 4, July-August, 1996, pp. 556-562.
4Neste, S. L., “UARS Pointing Error Budgets,” General Electric Astro-Space Division, PIR U-1K21-
UARS-517, March 20, 1987.
5General Electric Company Astro-Space Division, “Upper Atmosphere Research Satellite Project Data
Book ,” NASA Goddard Space Flight Center, April 1987.
6General Electric Company Astro-Space Division, “Upper Atmosphere Research Satellite Command and
Telemetry Handbook,” SDS-4219, January 1991.
7Woodard, S. E., Lay, R., Jarnot, R., Gell, D., “Experimental Investigation of Spacecraft In-Flight
Disturbances and Dynamic Response,” Journal of Spacecraft and Rockets, Vol. 34. No. 2, March-April
1997.
8Molnar, J. and Garnek, M., "UARS In-Flight Jitter Study for EOS," NASA CR 191419, Jan 1993.
9Sheldon, K. M., “Disturbance Torque Summary for UARS,” PIR U-1K21-UARS-232, September 1985.
10Mills, R. and Garnek, M., “UARS Dynamic Disturbance Torque Analysis,” PIR U-1K21 UARS 279,
PIR U-1R44-UARS-1351, November 1985.

33
11Zimbelman, D. F., “Thermal Elastic Shock and its Effect on Topex Spacecraft Attitude Control,” 14th
Annual American Astronautical Society Guidance and Control Conference, February 2-6, 1991, Keystone,
Colorado.
12Lambertson, M., Underwood, S., Woodruff, C. and Garber, A., “Upper Atmosphere Research Satellite
Attitude Disturbances During Shadow Entry and Exit,” American Astronautical Society Paper No. AAS 93-
-319, 1993.
13Woodard , S. E., “Concurrent Fuzzy Logic Control of a Gimballed Payload and Space Platform System,”
Ph.D. Dissertation, Duke University, Dept. of Mechanical Engineering and Materials Science, November
1995.
14Freesland, D., “Upper Atmosphere Research Satellite Attitude Determination and Control,” 15th Annual
American Astronautical Society Guidance and Control Conference, Keystone, Colorado, February 8-12,
1992.
15Woodard, S. E., Gell, D. A. and Lay, R. R., “Measured Spacecraft Dynamic Effects on Atmospheric
Science Instruments,” 35th Aerospace Sciences Meeting and Exhibit, AIAA Paper 97-0419, Reno, NV,
1997.
16Woodard ,S. E., “Concurrent Fuzzy Logic Control of a Gimballed Payload and Space Platform System,”
Ph.D. Dissertation, Duke University, Dept. of Mechanical Engineering and Materials Science, November
1995.
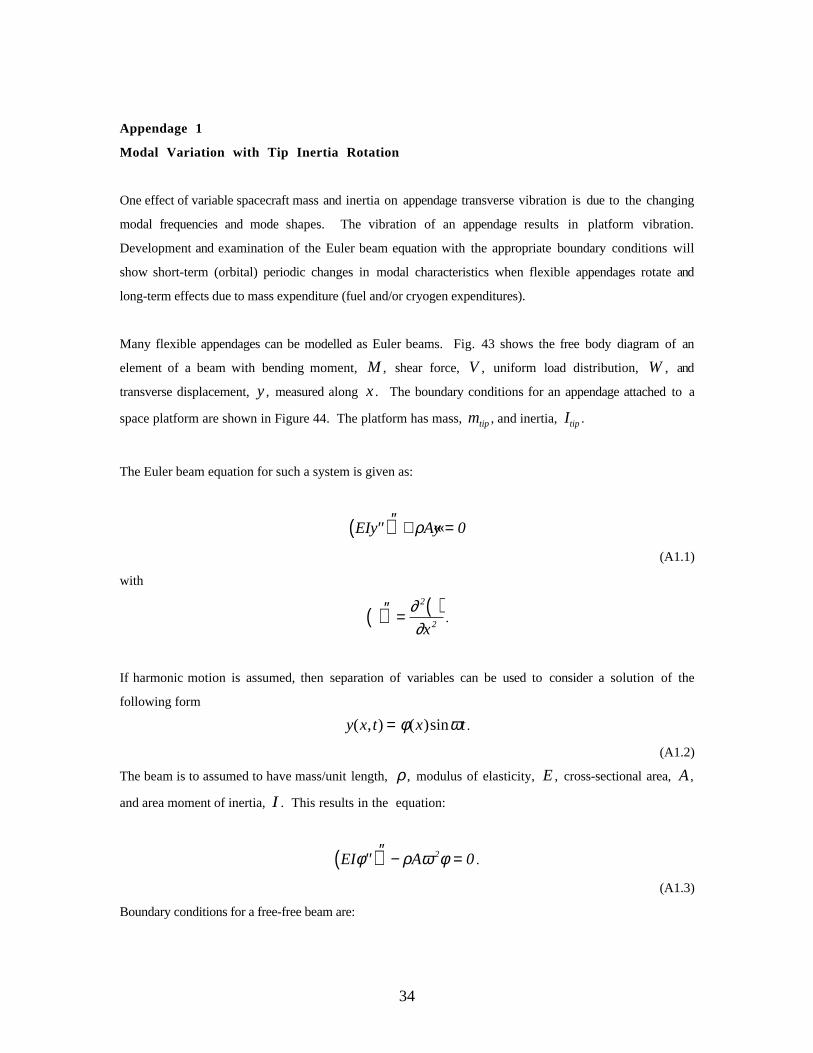
34
Appendage 1
Modal Variation with Tip Inertia Rotation
One effect of variable spacecraft mass and inertia on appendage transverse vibration is due to the changing
modal frequencies and mode shapes. The vibration of an appendage results in platform vibration.
Development and examination of the Euler beam equation with the appropriate boundary conditions will
show short-term (orbital) periodic changes in modal characteristics when flexible appendages rotate and
long-term effects due to mass expenditure (fuel and/or cryogen expenditures).
Many flexible appendages can be modelled as Euler beams. Fig. 43 shows the free body diagram of an
element of a beam with bending moment, M , shear force, V , uniform load distribution, W , and
transverse displacement, y, measured along x. The boundary conditions for an appendage attached to a
space platform are shown in Figure 44. The platform has mass, mtip , and inertia, Itip .
The Euler beam equation for such a system is given as:
EI ′′y( )″ + ρA««y = 0
(A1.1)
with
( )″ = ( )∂∂
2
2x.
If harmonic motion is assumed, then separation of variables can be used to consider a solution of the
following form
y x t x t( , ) ( )sin= φ ω .
(A1.2)
The beam is to assumed to have mass/unit length, ρ , modulus of elasticity, E , cross-sectional area, A,
and area moment of inertia, I . This results in the equation:
EI ′′φ( )″ − ρAω 2φ = 0 .
(A1.3)
Boundary conditions for a free-free beam are:
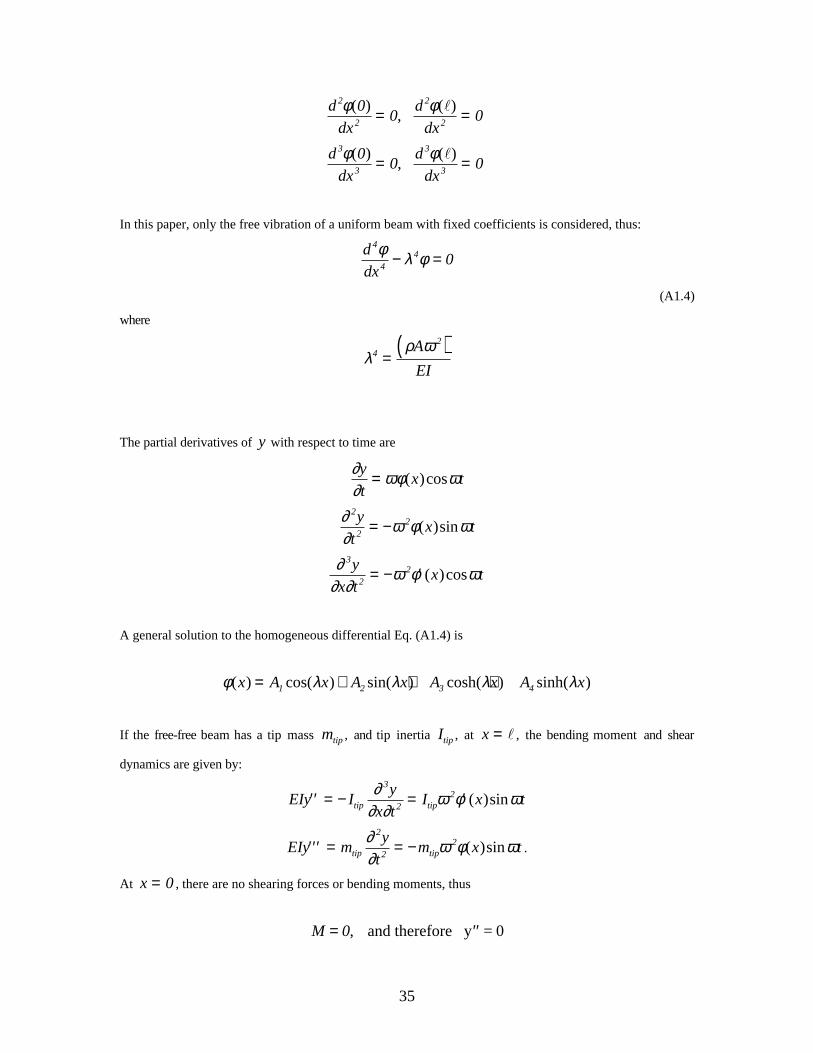
35
d
dx
d
dx
2
2
2
2
00 0
φ φ( ) ( )= =, l
d
dx
d
dx
3
3
3
3
00 0
φ φ( ) ( )= =, l
In this paper, only the free vibration of a uniform beam with fixed coefficients is considered, thus:
d4φdx4 − λ4φ = 0
(A1.4)
where
λρ ω
42
=( )A
EI
The partial derivatives of y with respect to time are
∂∂
ωφ ωy
tx t= ( )cos
∂∂
ω φ ω2
22y
tx t= − ( )sin
∂∂ ∂
ω φ ω3
22y
x tx t= − ′ ( )cos
A general solution to the homogeneous differential Eq. (A1.4) is
φ λ λ λ λ( ) cos( ) sin( ) cosh( ) sinh( )x A x A x A x A x= + + +1 2 3 4
If the free-free beam has a tip mass mtip , and tip inertia Itip , at x = l , the bending moment and shear
dynamics are given by:
EIy Iy
x tI x ttip tip′′ = − = ′∂
∂ ∂ω φ ω
3
22 ( )sin
EIy my
tm x ttip tip′′′ = = −∂
∂ω φ ω
2
22 ( )sin .
At x = 0 , there are no shearing forces or bending moments, thus
M = ′′0, and therefore y = 0
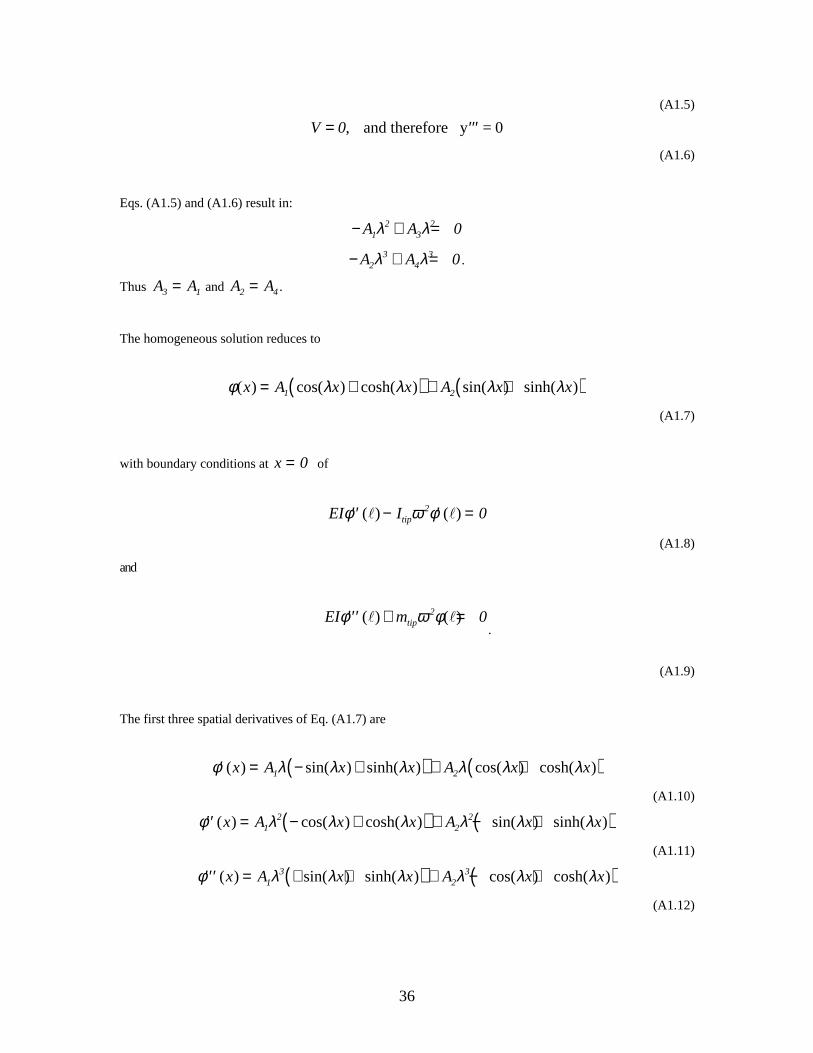
36
(A1.5)
V = ′′′0, and therefore y = 0
(A1.6)
Eqs. (A1.5) and (A1.6) result in:
− + =A A12
32 0λ λ
− + =A A23
43 0λ λ .
Thus A A3 1= and A A2 4= .
The homogeneous solution reduces to
φ λ λ λ λ( ) cos( ) cosh( ) sin( ) sinh( )x A x x A x x= +( ) + +( )1 2
(A1.7)
with boundary conditions at x = 0 of
EI Itip′′ − ′ =φ ω φ( ) ( )l l2 0
(A1.8)
and
EI mtip′′′ + =φ ω φ( ) ( )l l2 0.
(A1.9)
The first three spatial derivatives of Eq. (A1.7) are
′ = − +( ) + +( )φ λ λ λ λ λ λ( ) sin( ) sinh( ) cos( ) cosh( )x A x x A x x1 2
(A1.10)
′′ = − +( ) + − +( )φ λ λ λ λ λ λ( ) cos( ) cosh( ) sin( ) sinh( )x A x x A x x12
22
(A1.11)
′′′ = + +( ) + − +( )φ λ λ λ λ λ λ( ) sin( ) sinh( ) cos( ) cosh( )x A x x A x x13
23
(A1.12)
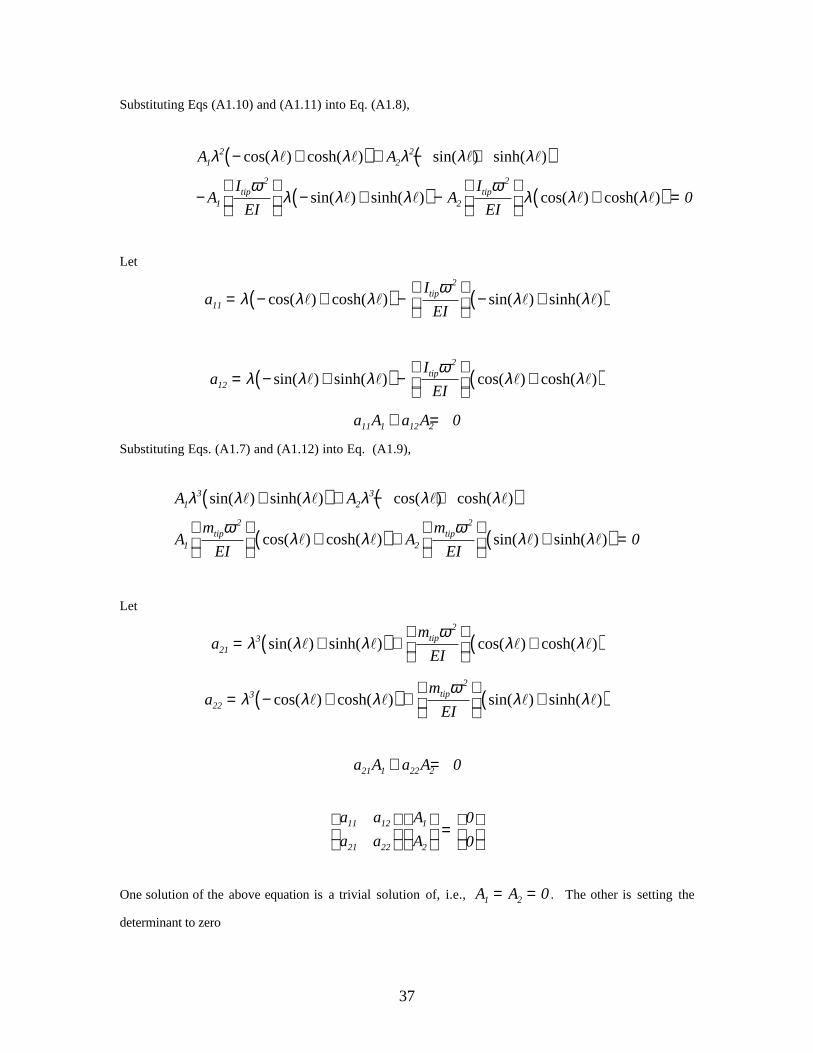
37
Substituting Eqs (A1.10) and (A1.11) into Eq. (A1.8),
A A
AI
EIA
I
EItip tip
12
22
1
2
2
2
0
λ λ λ λ λ λ
ωλ λ λ
ωλ λ λ
− +( ) + − +( )
−
− +( ) −
+( ) =
cos( ) cosh( ) sin( ) sinh( )
sin( ) sinh( ) cos( ) cosh( )
l l l l
l l l l
Let
a
I
EItip
11
2
= − +( ) −
− +( )λ λ λω
λ λcos( ) cosh( ) sin( ) sinh( )l l l l
a
I
EItip
12
2
= − +( ) −
+( )λ λ λω
λ λsin( ) sinh( ) cos( ) cosh( )l l l l
a A a A11 1 12 2 0+ =
Substituting Eqs. (A1.7) and (A1.12) into Eq. (A1.9),
A A
Am
EIA
m
EItip
2tip
2
13
23
1 2 0
λ λ λ λ λ λ
ωλ λ
ωλ λ
sin( ) sinh( ) cos( ) cosh( )
cos( ) cosh( ) sin( ) sinh( )
l l l l
l l l l
+( ) + − +( )
+( ) +
+( ) =
Let
a
m
EItip
2
213= +( ) +
+( )λ λ λω
λ λsin( ) sinh( ) cos( ) cosh( )l l l l
a
m
EItip
2
223= − +( ) +
+( )λ λ λω
λ λcos( ) cosh( ) sin( ) sinh( )l l l l
a A a A21 1 22 2 0+ =
a a
a a
A
A11 12
21 22
1
2
0
0
=
One solution of the above equation is a trivial solution of, i.e., A A1 2 0= = . The other is setting the
determinant to zero
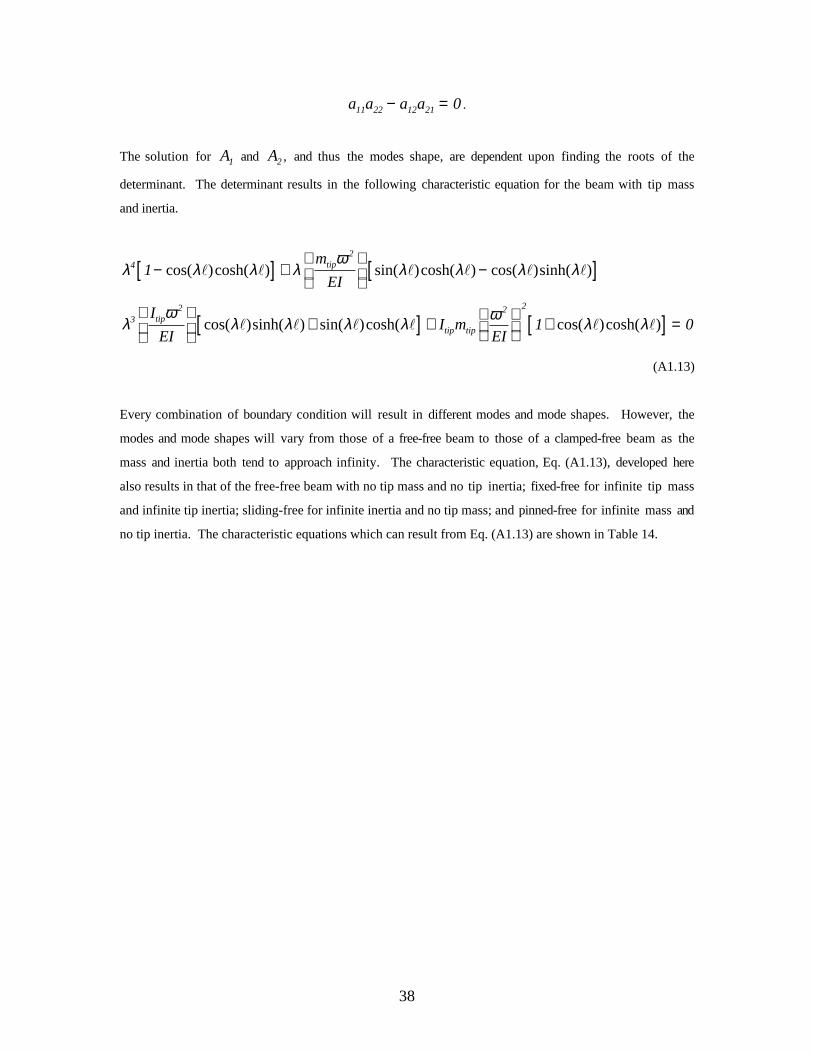
38
a a a a11 22 12 21 0− = .
The solution for A1 and A2 , and thus the modes shape, are dependent upon finding the roots of the
determinant. The determinant results in the following characteristic equation for the beam with tip mass
and inertia.
λ λ λ λω
λ λ λ λ
λω
λ λ λ λ ω λ λ
4
32 2 2
1
1 0
−[ ] +
−[ ]
+[ ] +
+[ ] =
cos( )cosh( ) sin( )cosh( ) cos( )sinh( )
cos( )sinh( ) sin( )cosh( cos( )cosh( )
l l l l l l
l l l l l l
m
EI
I
EII m
EI
tip2
tiptip tip
(A1.13)
Every combination of boundary condition will result in different modes and mode shapes. However, the
modes and mode shapes will vary from those of a free-free beam to those of a clamped-free beam as the
mass and inertia both tend to approach infinity. The characteristic equation, Eq. (A1.13), developed here
also results in that of the free-free beam with no tip mass and no tip inertia; fixed-free for infinite tip mass
and infinite tip inertia; sliding-free for infinite inertia and no tip mass; and pinned-free for infinite mass and
no tip inertia. The characteristic equations which can result from Eq. (A1.13) are shown in Table 14.
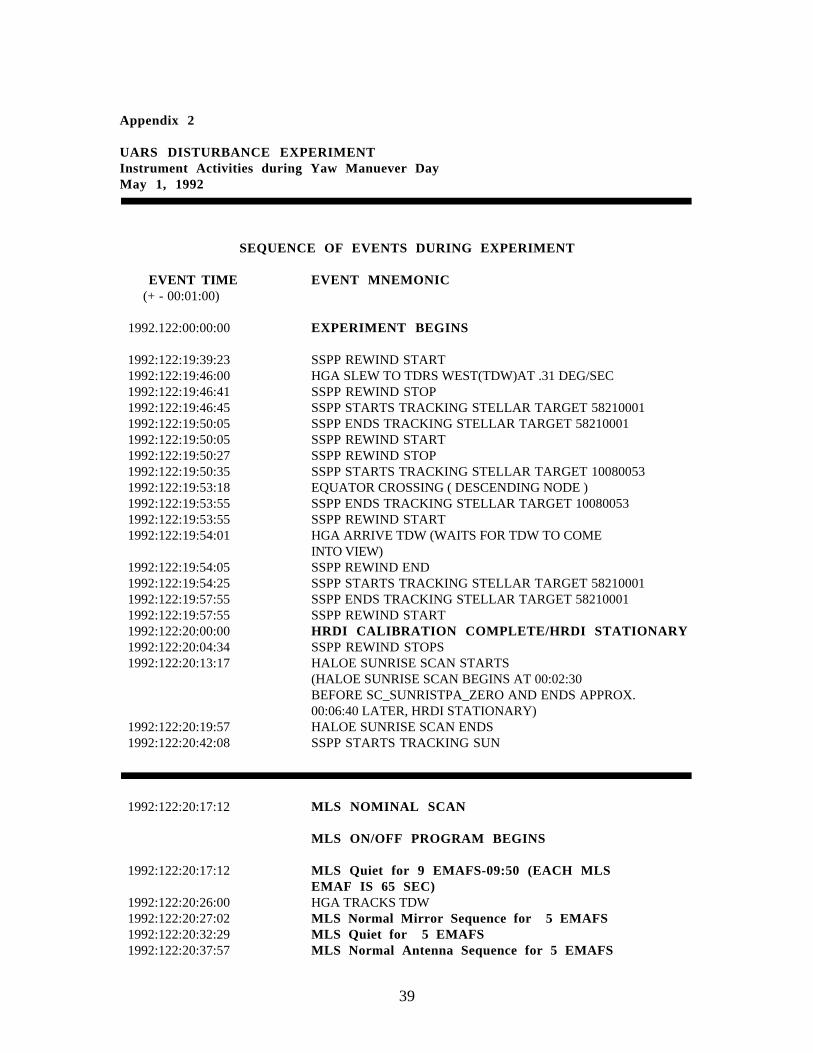
39
Appendix 2
UARS DISTURBANCE EXPERIMENTInstrument Activities during Yaw Manuever DayMay 1, 1992
SEQUENCE OF EVENTS DURING EXPERIMENT
EVENT TIME EVENT MNEMONIC (+ - 00:01:00)
1992.122:00:00:00 EXPERIMENT BEGINS
1992:122:19:39:23 SSPP REWIND START 1992:122:19:46:00 HGA SLEW TO TDRS WEST(TDW)AT .31 DEG/SEC 1992:122:19:46:41 SSPP REWIND STOP 1992:122:19:46:45 SSPP STARTS TRACKING STELLAR TARGET 58210001 1992:122:19:50:05 SSPP ENDS TRACKING STELLAR TARGET 58210001 1992:122:19:50:05 SSPP REWIND START 1992:122:19:50:27 SSPP REWIND STOP 1992:122:19:50:35 SSPP STARTS TRACKING STELLAR TARGET 10080053 1992:122:19:53:18 EQUATOR CROSSING ( DESCENDING NODE ) 1992:122:19:53:55 SSPP ENDS TRACKING STELLAR TARGET 10080053 1992:122:19:53:55 SSPP REWIND START 1992:122:19:54:01 HGA ARRIVE TDW (WAITS FOR TDW TO COME INTO VIEW) 1992:122:19:54:05 SSPP REWIND END 1992:122:19:54:25 SSPP STARTS TRACKING STELLAR TARGET 58210001 1992:122:19:57:55 SSPP ENDS TRACKING STELLAR TARGET 58210001 1992:122:19:57:55 SSPP REWIND START 1992:122:20:00:00 HRDI CALIBRATION COMPLETE/HRDI STATIONARY 1992:122:20:04:34 SSPP REWIND STOPS 1992:122:20:13:17 HALOE SUNRISE SCAN STARTS (HALOE SUNRISE SCAN BEGINS AT 00:02:30 BEFORE SC_SUNRISTPA_ZERO AND ENDS APPROX. 00:06:40 LATER, HRDI STATIONARY) 1992:122:20:19:57 HALOE SUNRISE SCAN ENDS 1992:122:20:42:08 SSPP STARTS TRACKING SUN
1992:122:20:17:12 MLS NOMINAL SCAN
MLS ON/OFF PROGRAM BEGINS
1992:122:20:17:12 MLS Quiet for 9 EMAFS-09:50 (EACH MLS EMAF IS 65 SEC) 1992:122:20:26:00 HGA TRACKS TDW 1992:122:20:27:02 MLS Normal Mirror Sequence for 5 EMAFS 1992:122:20:32:29 MLS Quiet for 5 EMAFS 1992:122:20:37:57 MLS Normal Antenna Sequence for 5 EMAFS
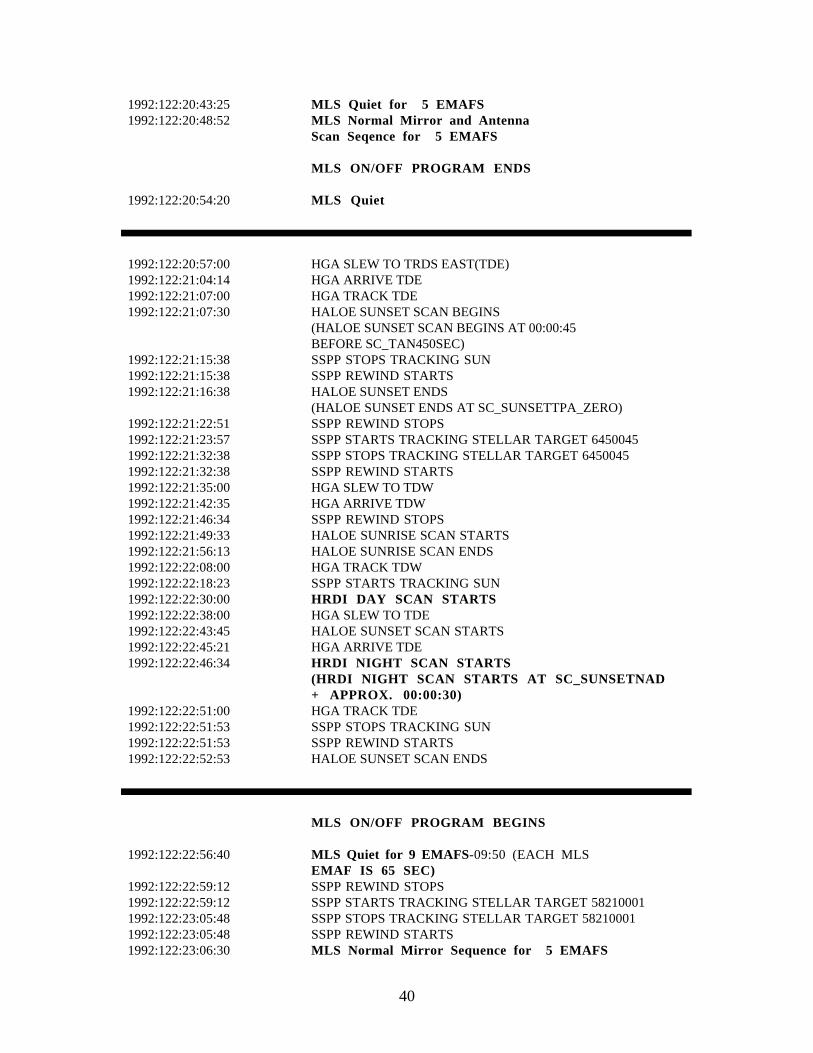
40
1992:122:20:43:25 MLS Quiet for 5 EMAFS 1992:122:20:48:52 MLS Normal Mirror and Antenna Scan Seqence for 5 EMAFS
MLS ON/OFF PROGRAM ENDS
1992:122:20:54:20 MLS Quiet
1992:122:20:57:00 HGA SLEW TO TRDS EAST(TDE) 1992:122:21:04:14 HGA ARRIVE TDE 1992:122:21:07:00 HGA TRACK TDE 1992:122:21:07:30 HALOE SUNSET SCAN BEGINS (HALOE SUNSET SCAN BEGINS AT 00:00:45 BEFORE SC_TAN450SEC) 1992:122:21:15:38 SSPP STOPS TRACKING SUN 1992:122:21:15:38 SSPP REWIND STARTS 1992:122:21:16:38 HALOE SUNSET ENDS (HALOE SUNSET ENDS AT SC_SUNSETTPA_ZERO) 1992:122:21:22:51 SSPP REWIND STOPS 1992:122:21:23:57 SSPP STARTS TRACKING STELLAR TARGET 6450045 1992:122:21:32:38 SSPP STOPS TRACKING STELLAR TARGET 6450045 1992:122:21:32:38 SSPP REWIND STARTS 1992:122:21:35:00 HGA SLEW TO TDW 1992:122:21:42:35 HGA ARRIVE TDW 1992:122:21:46:34 SSPP REWIND STOPS 1992:122:21:49:33 HALOE SUNRISE SCAN STARTS 1992:122:21:56:13 HALOE SUNRISE SCAN ENDS 1992:122:22:08:00 HGA TRACK TDW 1992:122:22:18:23 SSPP STARTS TRACKING SUN 1992:122:22:30:00 HRDI DAY SCAN STARTS 1992:122:22:38:00 HGA SLEW TO TDE 1992:122:22:43:45 HALOE SUNSET SCAN STARTS 1992:122:22:45:21 HGA ARRIVE TDE 1992:122:22:46:34 HRDI NIGHT SCAN STARTS (HRDI NIGHT SCAN STARTS AT SC_SUNSETNAD + APPROX. 00:00:30) 1992:122:22:51:00 HGA TRACK TDE 1992:122:22:51:53 SSPP STOPS TRACKING SUN 1992:122:22:51:53 SSPP REWIND STARTS 1992:122:22:52:53 HALOE SUNSET SCAN ENDS
MLS ON/OFF PROGRAM BEGINS
1992:122:22:56:40 MLS Quiet for 9 EMAFS-09:50 (EACH MLS EMAF IS 65 SEC) 1992:122:22:59:12 SSPP REWIND STOPS 1992:122:22:59:12 SSPP STARTS TRACKING STELLAR TARGET 58210001 1992:122:23:05:48 SSPP STOPS TRACKING STELLAR TARGET 58210001 1992:122:23:05:48 SSPP REWIND STARTS 1992:122:23:06:30 MLS Normal Mirror Sequence for 5 EMAFS
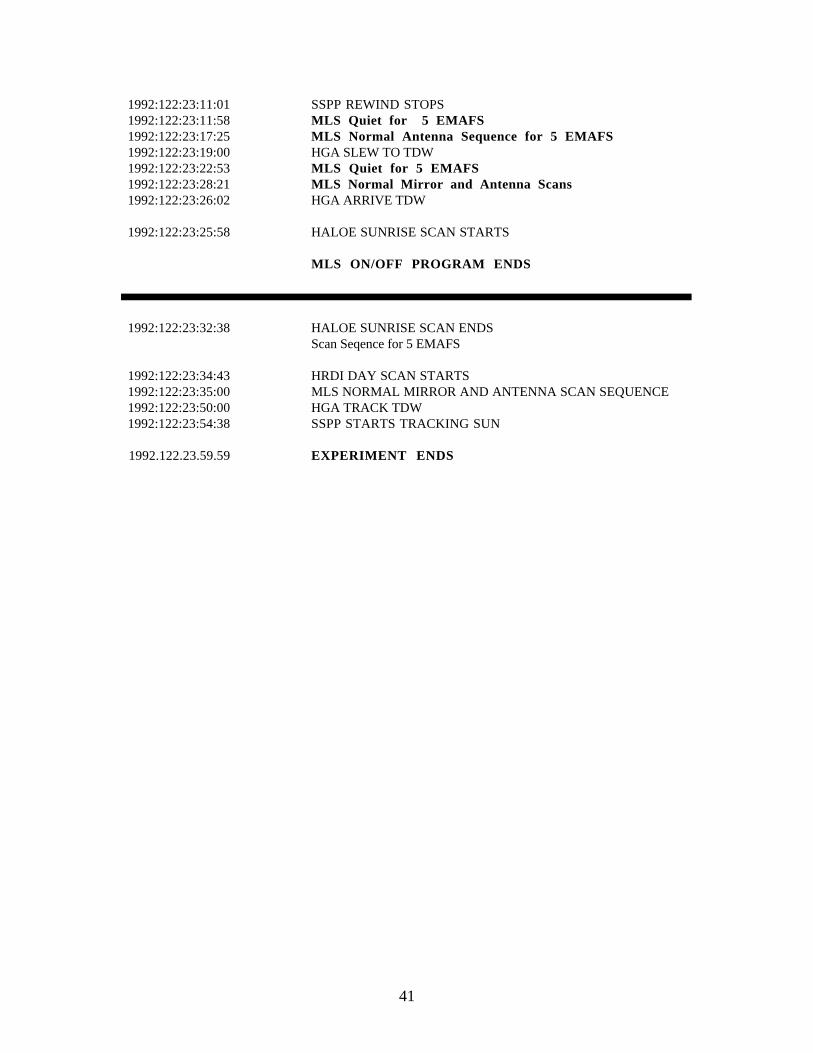
41
1992:122:23:11:01 SSPP REWIND STOPS 1992:122:23:11:58 MLS Quiet for 5 EMAFS 1992:122:23:17:25 MLS Normal Antenna Sequence for 5 EMAFS 1992:122:23:19:00 HGA SLEW TO TDW 1992:122:23:22:53 MLS Quiet for 5 EMAFS 1992:122:23:28:21 MLS Normal Mirror and Antenna Scans 1992:122:23:26:02 HGA ARRIVE TDW
1992:122:23:25:58 HALOE SUNRISE SCAN STARTS
MLS ON/OFF PROGRAM ENDS
1992:122:23:32:38 HALOE SUNRISE SCAN ENDS Scan Seqence for 5 EMAFS
1992:122:23:34:43 HRDI DAY SCAN STARTS 1992:122:23:35:00 MLS NORMAL MIRROR AND ANTENNA SCAN SEQUENCE 1992:122:23:50:00 HGA TRACK TDW 1992:122:23:54:38 SSPP STARTS TRACKING SUN
1992.122.23.59.59 EXPERIMENT ENDS
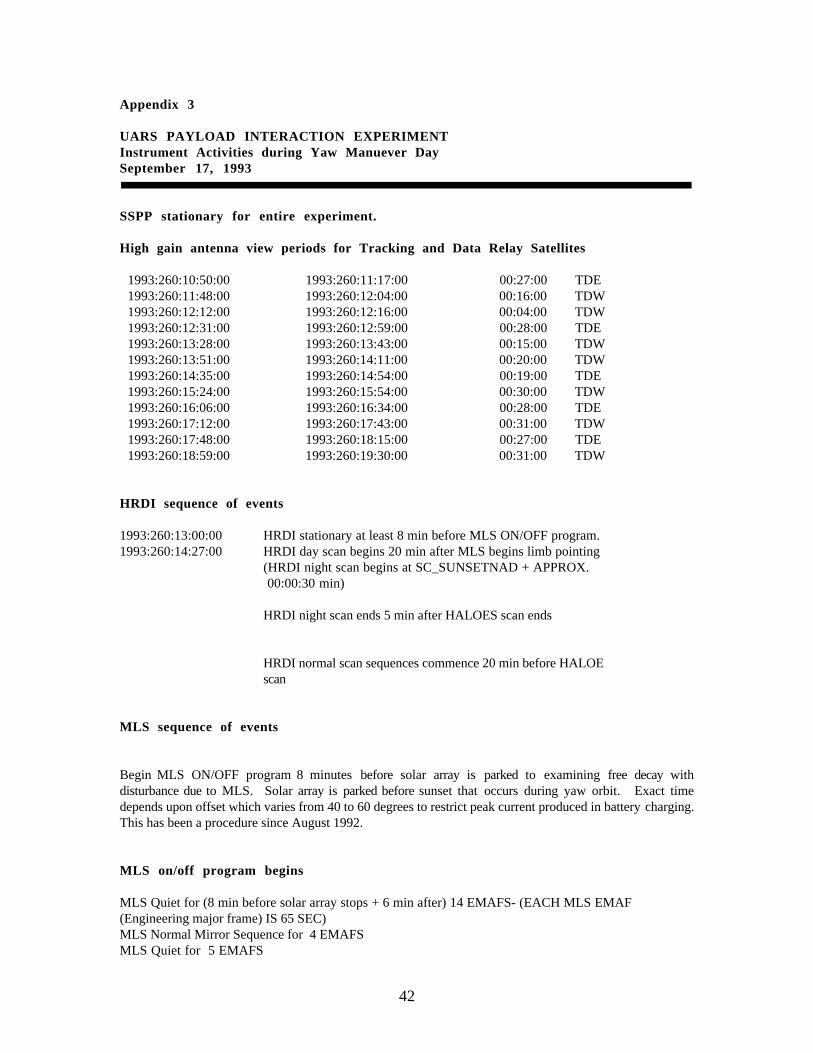
42
Appendix 3
UARS PAYLOAD INTERACTION EXPERIMENTInstrument Activities during Yaw Manuever DaySeptember 17, 1993
SSPP stationary for entire experiment.
High gain antenna view periods for Tracking and Data Relay Satellites
1993:260:10:50:00 1993:260:11:17:00 00:27:00 TDE 1993:260:11:48:00 1993:260:12:04:00 00:16:00 TDW 1993:260:12:12:00 1993:260:12:16:00 00:04:00 TDW 1993:260:12:31:00 1993:260:12:59:00 00:28:00 TDE 1993:260:13:28:00 1993:260:13:43:00 00:15:00 TDW 1993:260:13:51:00 1993:260:14:11:00 00:20:00 TDW 1993:260:14:35:00 1993:260:14:54:00 00:19:00 TDE 1993:260:15:24:00 1993:260:15:54:00 00:30:00 TDW 1993:260:16:06:00 1993:260:16:34:00 00:28:00 TDE 1993:260:17:12:00 1993:260:17:43:00 00:31:00 TDW 1993:260:17:48:00 1993:260:18:15:00 00:27:00 TDE 1993:260:18:59:00 1993:260:19:30:00 00:31:00 TDW
HRDI sequence of events
1993:260:13:00:00 HRDI stationary at least 8 min before MLS ON/OFF program.1993:260:14:27:00 HRDI day scan begins 20 min after MLS begins limb pointing
(HRDI night scan begins at SC_SUNSETNAD + APPROX. 00:00:30 min)
HRDI night scan ends 5 min after HALOES scan ends
HRDI normal scan sequences commence 20 min before HALOEscan
MLS sequence of events
Begin MLS ON/OFF program 8 minutes before solar array is parked to examining free decay withdisturbance due to MLS. Solar array is parked before sunset that occurs during yaw orbit. Exact timedepends upon offset which varies from 40 to 60 degrees to restrict peak current produced in battery charging.This has been a procedure since August 1992.
MLS on/off program begins
MLS Quiet for (8 min before solar array stops + 6 min after) 14 EMAFS- (EACH MLS EMAF(Engineering major frame) IS 65 SEC)MLS Normal Mirror Sequence for 4 EMAFSMLS Quiet for 5 EMAFS
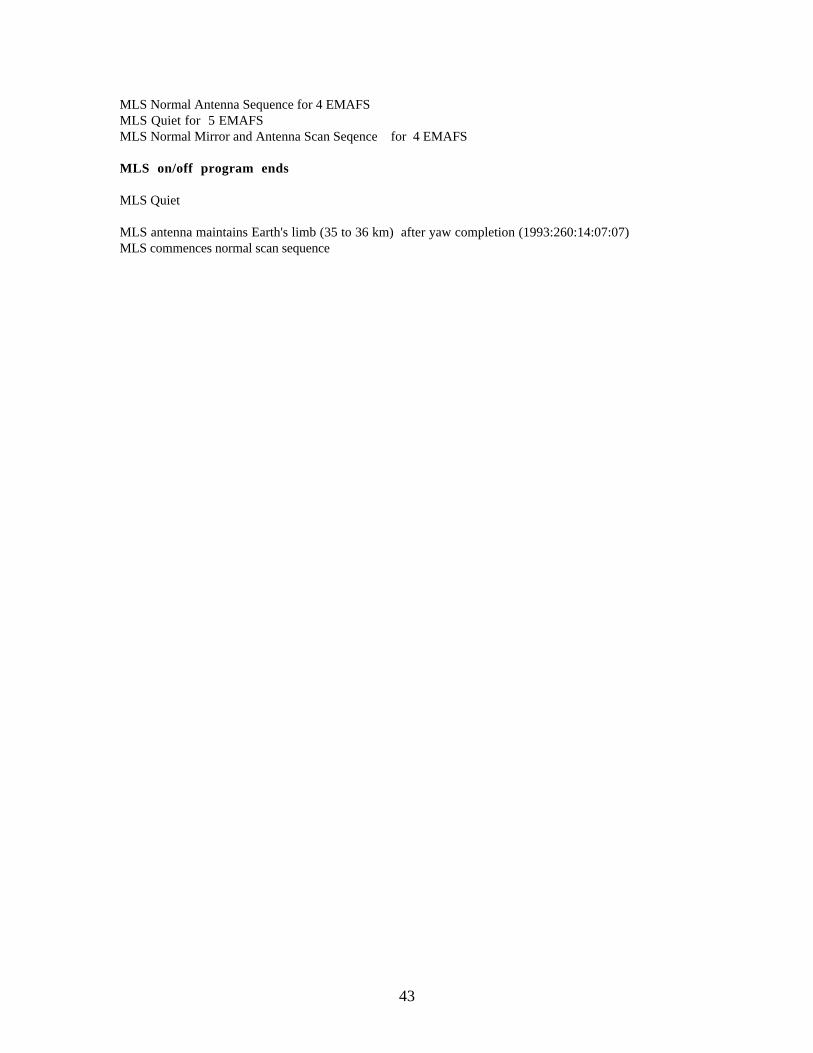
43
MLS Normal Antenna Sequence for 4 EMAFSMLS Quiet for 5 EMAFSMLS Normal Mirror and Antenna Scan Seqence for 4 EMAFS
MLS on/off program ends
MLS Quiet
MLS antenna maintains Earth's limb (35 to 36 km) after yaw completion (1993:260:14:07:07)MLS commences normal scan sequence
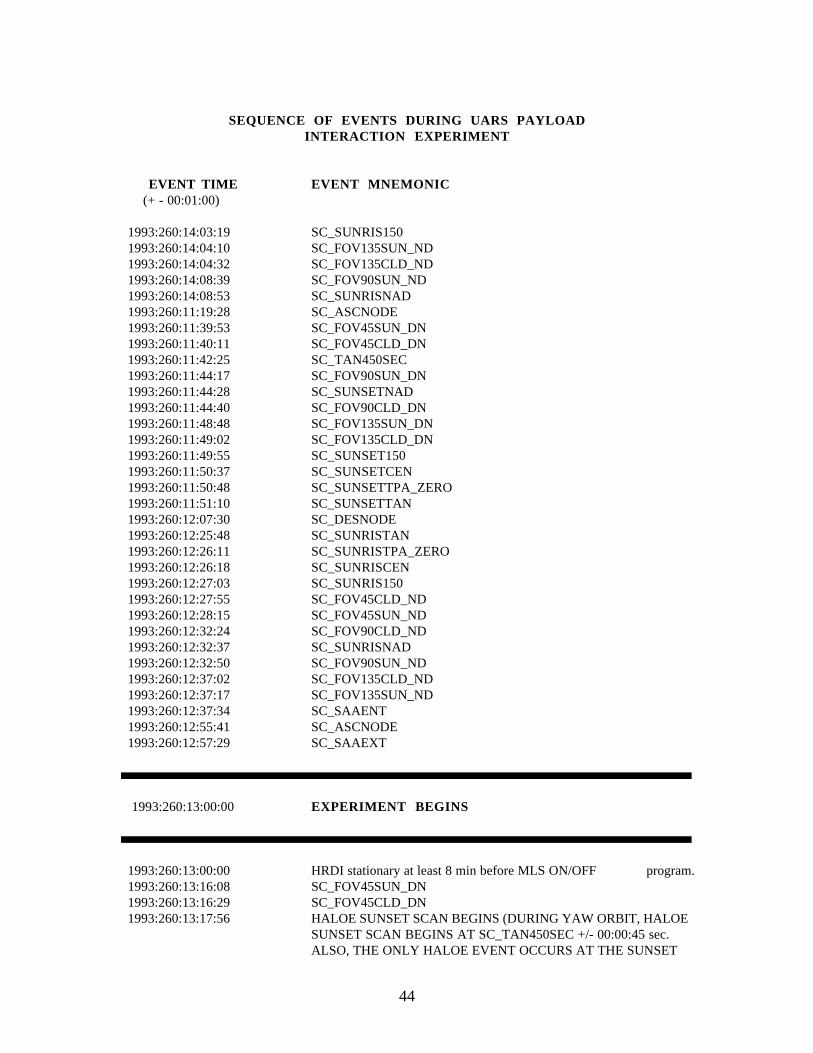
44
SEQUENCE OF EVENTS DURING UARS PAYLOADINTERACTION EXPERIMENT
EVENT TIME EVENT MNEMONIC (+ - 00:01:00)
1993:260:14:03:19 SC_SUNRIS150 1993:260:14:04:10 SC_FOV135SUN_ND 1993:260:14:04:32 SC_FOV135CLD_ND 1993:260:14:08:39 SC_FOV90SUN_ND 1993:260:14:08:53 SC_SUNRISNAD 1993:260:11:19:28 SC_ASCNODE 1993:260:11:39:53 SC_FOV45SUN_DN 1993:260:11:40:11 SC_FOV45CLD_DN 1993:260:11:42:25 SC_TAN450SEC 1993:260:11:44:17 SC_FOV90SUN_DN 1993:260:11:44:28 SC_SUNSETNAD 1993:260:11:44:40 SC_FOV90CLD_DN 1993:260:11:48:48 SC_FOV135SUN_DN 1993:260:11:49:02 SC_FOV135CLD_DN 1993:260:11:49:55 SC_SUNSET150 1993:260:11:50:37 SC_SUNSETCEN 1993:260:11:50:48 SC_SUNSETTPA_ZERO 1993:260:11:51:10 SC_SUNSETTAN 1993:260:12:07:30 SC_DESNODE 1993:260:12:25:48 SC_SUNRISTAN 1993:260:12:26:11 SC_SUNRISTPA_ZERO 1993:260:12:26:18 SC_SUNRISCEN 1993:260:12:27:03 SC_SUNRIS150 1993:260:12:27:55 SC_FOV45CLD_ND 1993:260:12:28:15 SC_FOV45SUN_ND 1993:260:12:32:24 SC_FOV90CLD_ND 1993:260:12:32:37 SC_SUNRISNAD 1993:260:12:32:50 SC_FOV90SUN_ND 1993:260:12:37:02 SC_FOV135CLD_ND 1993:260:12:37:17 SC_FOV135SUN_ND 1993:260:12:37:34 SC_SAAENT 1993:260:12:55:41 SC_ASCNODE 1993:260:12:57:29 SC_SAAEXT
1993:260:13:00:00 EXPERIMENT BEGINS
1993:260:13:00:00 HRDI stationary at least 8 min before MLS ON/OFF program. 1993:260:13:16:08 SC_FOV45SUN_DN 1993:260:13:16:29 SC_FOV45CLD_DN 1993:260:13:17:56 HALOE SUNSET SCAN BEGINS (DURING YAW ORBIT, HALOE
SUNSET SCAN BEGINS AT SC_TAN450SEC +/- 00:00:45 sec. ALSO, THE ONLY HALOE EVENT OCCURS AT THE SUNSET
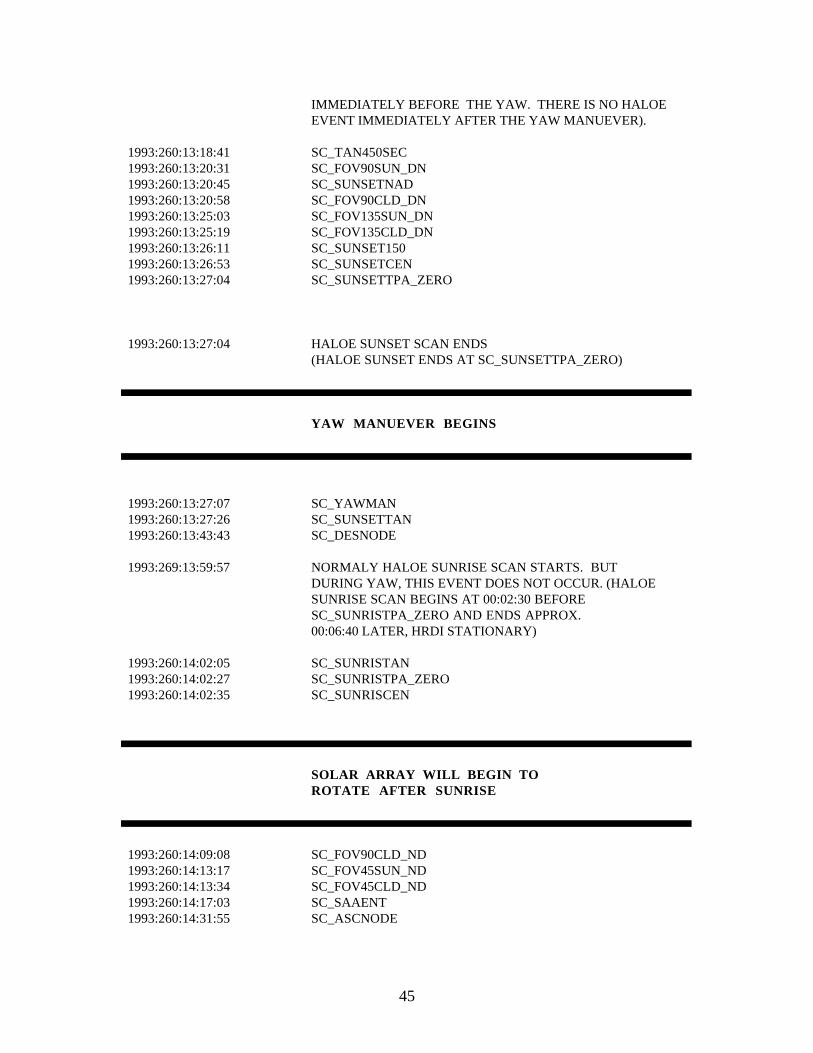
45
IMMEDIATELY BEFORE THE YAW. THERE IS NO HALOE EVENT IMMEDIATELY AFTER THE YAW MANUEVER).
1993:260:13:18:41 SC_TAN450SEC 1993:260:13:20:31 SC_FOV90SUN_DN 1993:260:13:20:45 SC_SUNSETNAD 1993:260:13:20:58 SC_FOV90CLD_DN 1993:260:13:25:03 SC_FOV135SUN_DN 1993:260:13:25:19 SC_FOV135CLD_DN 1993:260:13:26:11 SC_SUNSET150 1993:260:13:26:53 SC_SUNSETCEN 1993:260:13:27:04 SC_SUNSETTPA_ZERO
1993:260:13:27:04 HALOE SUNSET SCAN ENDS (HALOE SUNSET ENDS AT SC_SUNSETTPA_ZERO)
YAW MANUEVER BEGINS
1993:260:13:27:07 SC_YAWMAN 1993:260:13:27:26 SC_SUNSETTAN 1993:260:13:43:43 SC_DESNODE
1993:269:13:59:57 NORMALY HALOE SUNRISE SCAN STARTS. BUT DURING YAW, THIS EVENT DOES NOT OCCUR. (HALOE SUNRISE SCAN BEGINS AT 00:02:30 BEFORE SC_SUNRISTPA_ZERO AND ENDS APPROX.
00:06:40 LATER, HRDI STATIONARY)
1993:260:14:02:05 SC_SUNRISTAN 1993:260:14:02:27 SC_SUNRISTPA_ZERO 1993:260:14:02:35 SC_SUNRISCEN
SOLAR ARRAY WILL BEGIN TOROTATE AFTER SUNRISE
1993:260:14:09:08 SC_FOV90CLD_ND 1993:260:14:13:17 SC_FOV45SUN_ND 1993:260:14:13:34 SC_FOV45CLD_ND 1993:260:14:17:03 SC_SAAENT 1993:260:14:31:55 SC_ASCNODE
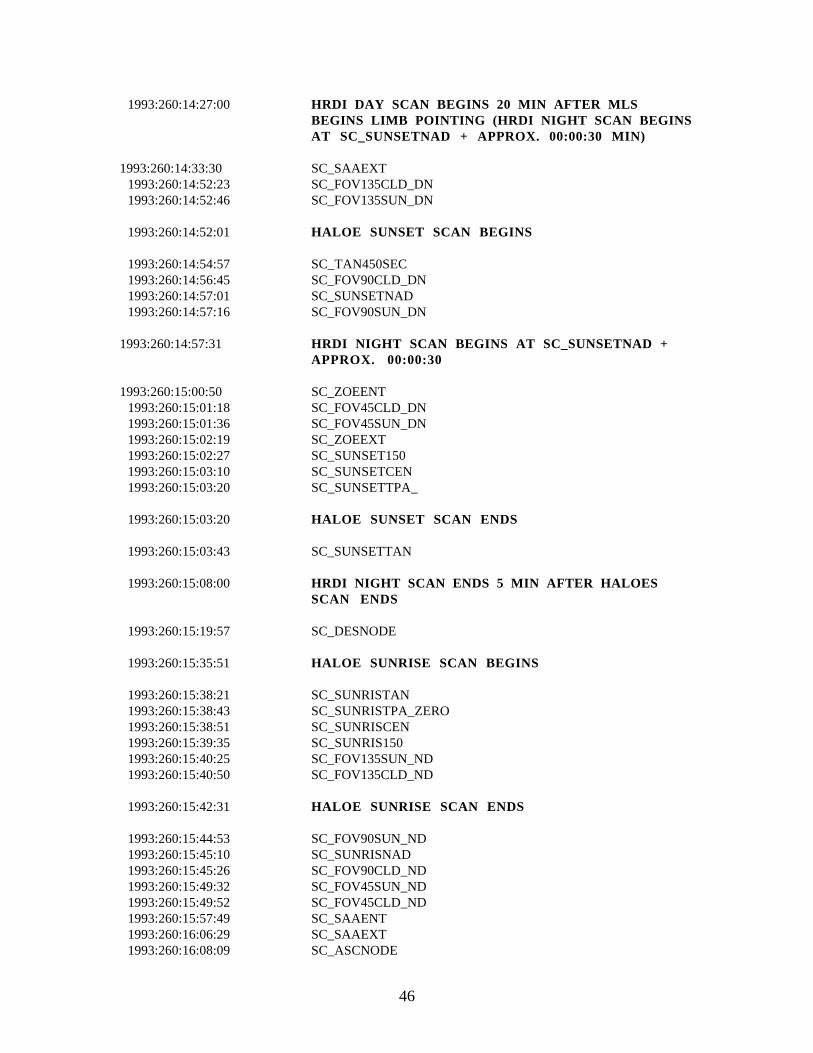
46
1993:260:14:27:00 HRDI DAY SCAN BEGINS 20 MIN AFTER MLS BEGINS LIMB POINTING (HRDI NIGHT SCAN BEGINSAT SC_SUNSETNAD + APPROX. 00:00:30 MIN)
1993:260:14:33:30 SC_SAAEXT 1993:260:14:52:23 SC_FOV135CLD_DN 1993:260:14:52:46 SC_FOV135SUN_DN
1993:260:14:52:01 HALOE SUNSET SCAN BEGINS
1993:260:14:54:57 SC_TAN450SEC 1993:260:14:56:45 SC_FOV90CLD_DN 1993:260:14:57:01 SC_SUNSETNAD 1993:260:14:57:16 SC_FOV90SUN_DN
1993:260:14:57:31 HRDI NIGHT SCAN BEGINS AT SC_SUNSETNAD + APPROX. 00:00:30
1993:260:15:00:50 SC_ZOEENT 1993:260:15:01:18 SC_FOV45CLD_DN 1993:260:15:01:36 SC_FOV45SUN_DN 1993:260:15:02:19 SC_ZOEEXT 1993:260:15:02:27 SC_SUNSET150 1993:260:15:03:10 SC_SUNSETCEN 1993:260:15:03:20 SC_SUNSETTPA_
1993:260:15:03:20 HALOE SUNSET SCAN ENDS
1993:260:15:03:43 SC_SUNSETTAN
1993:260:15:08:00 HRDI NIGHT SCAN ENDS 5 MIN AFTER HALOES SCAN ENDS
1993:260:15:19:57 SC_DESNODE
1993:260:15:35:51 HALOE SUNRISE SCAN BEGINS
1993:260:15:38:21 SC_SUNRISTAN 1993:260:15:38:43 SC_SUNRISTPA_ZERO 1993:260:15:38:51 SC_SUNRISCEN 1993:260:15:39:35 SC_SUNRIS150 1993:260:15:40:25 SC_FOV135SUN_ND 1993:260:15:40:50 SC_FOV135CLD_ND
1993:260:15:42:31 HALOE SUNRISE SCAN ENDS
1993:260:15:44:53 SC_FOV90SUN_ND 1993:260:15:45:10 SC_SUNRISNAD 1993:260:15:45:26 SC_FOV90CLD_ND 1993:260:15:49:32 SC_FOV45SUN_ND 1993:260:15:49:52 SC_FOV45CLD_ND 1993:260:15:57:49 SC_SAAENT 1993:260:16:06:29 SC_SAAEXT 1993:260:16:08:09 SC_ASCNODE
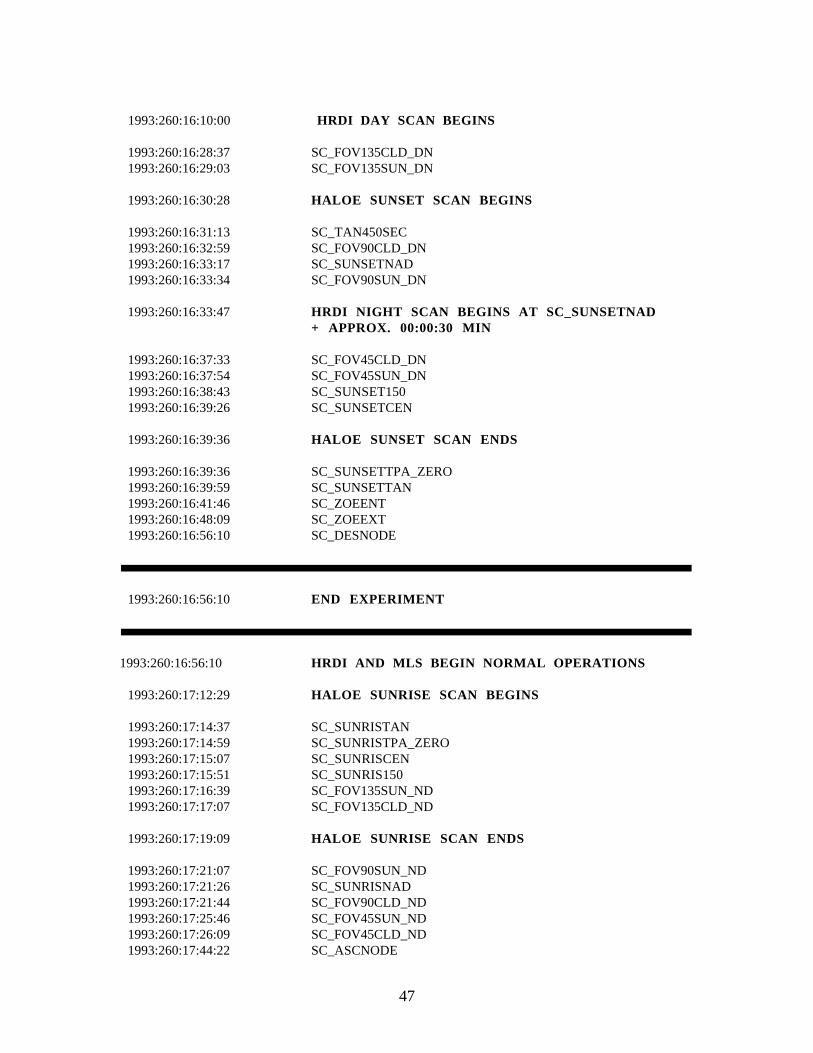
47
1993:260:16:10:00 HRDI DAY SCAN BEGINS
1993:260:16:28:37 SC_FOV135CLD_DN 1993:260:16:29:03 SC_FOV135SUN_DN
1993:260:16:30:28 HALOE SUNSET SCAN BEGINS
1993:260:16:31:13 SC_TAN450SEC 1993:260:16:32:59 SC_FOV90CLD_DN 1993:260:16:33:17 SC_SUNSETNAD 1993:260:16:33:34 SC_FOV90SUN_DN
1993:260:16:33:47 HRDI NIGHT SCAN BEGINS AT SC_SUNSETNAD+ APPROX. 00:00:30 MIN
1993:260:16:37:33 SC_FOV45CLD_DN 1993:260:16:37:54 SC_FOV45SUN_DN 1993:260:16:38:43 SC_SUNSET150 1993:260:16:39:26 SC_SUNSETCEN
1993:260:16:39:36 HALOE SUNSET SCAN ENDS
1993:260:16:39:36 SC_SUNSETTPA_ZERO 1993:260:16:39:59 SC_SUNSETTAN 1993:260:16:41:46 SC_ZOEENT 1993:260:16:48:09 SC_ZOEEXT 1993:260:16:56:10 SC_DESNODE
1993:260:16:56:10 END EXPERIMENT
1993:260:16:56:10 HRDI AND MLS BEGIN NORMAL OPERATIONS
1993:260:17:12:29 HALOE SUNRISE SCAN BEGINS
1993:260:17:14:37 SC_SUNRISTAN 1993:260:17:14:59 SC_SUNRISTPA_ZERO 1993:260:17:15:07 SC_SUNRISCEN 1993:260:17:15:51 SC_SUNRIS150 1993:260:17:16:39 SC_FOV135SUN_ND 1993:260:17:17:07 SC_FOV135CLD_ND
1993:260:17:19:09 HALOE SUNRISE SCAN ENDS
1993:260:17:21:07 SC_FOV90SUN_ND 1993:260:17:21:26 SC_SUNRISNAD 1993:260:17:21:44 SC_FOV90CLD_ND 1993:260:17:25:46 SC_FOV45SUN_ND 1993:260:17:26:09 SC_FOV45CLD_ND 1993:260:17:44:22 SC_ASCNODE
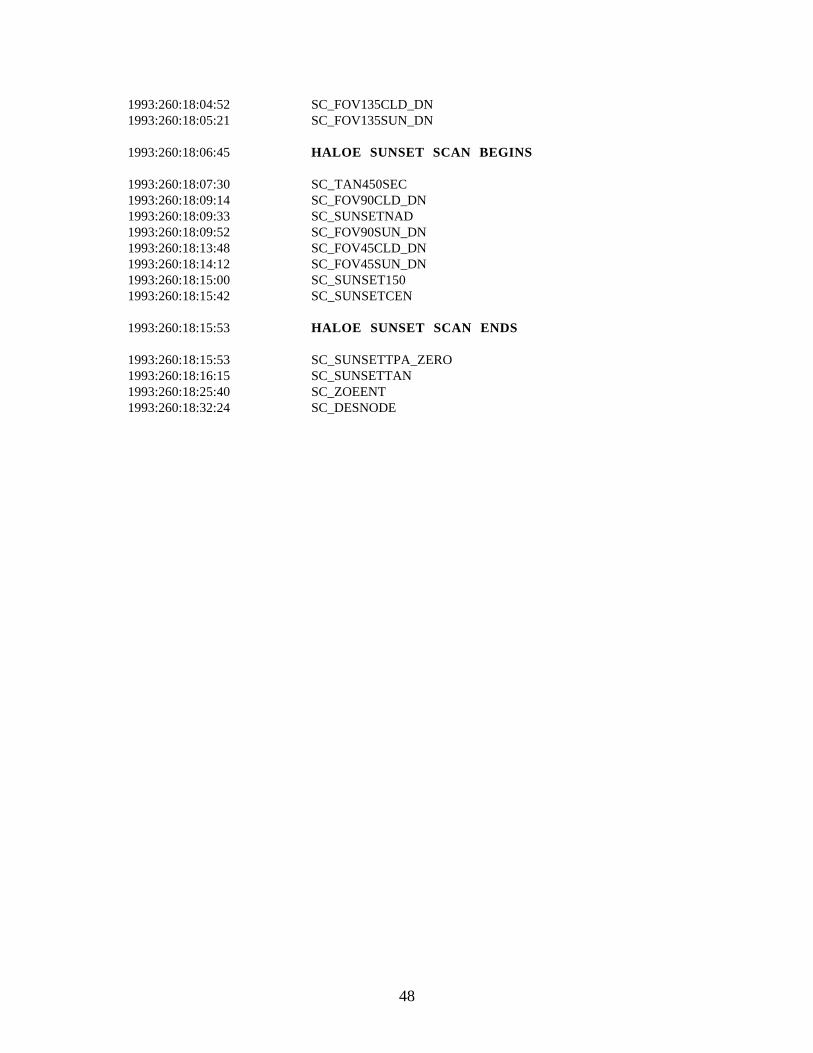
48
1993:260:18:04:52 SC_FOV135CLD_DN 1993:260:18:05:21 SC_FOV135SUN_DN
1993:260:18:06:45 HALOE SUNSET SCAN BEGINS
1993:260:18:07:30 SC_TAN450SEC 1993:260:18:09:14 SC_FOV90CLD_DN 1993:260:18:09:33 SC_SUNSETNAD 1993:260:18:09:52 SC_FOV90SUN_DN 1993:260:18:13:48 SC_FOV45CLD_DN 1993:260:18:14:12 SC_FOV45SUN_DN 1993:260:18:15:00 SC_SUNSET150 1993:260:18:15:42 SC_SUNSETCEN
1993:260:18:15:53 HALOE SUNSET SCAN ENDS
1993:260:18:15:53 SC_SUNSETTPA_ZERO 1993:260:18:16:15 SC_SUNSETTAN 1993:260:18:25:40 SC_ZOEENT 1993:260:18:32:24 SC_DESNODE
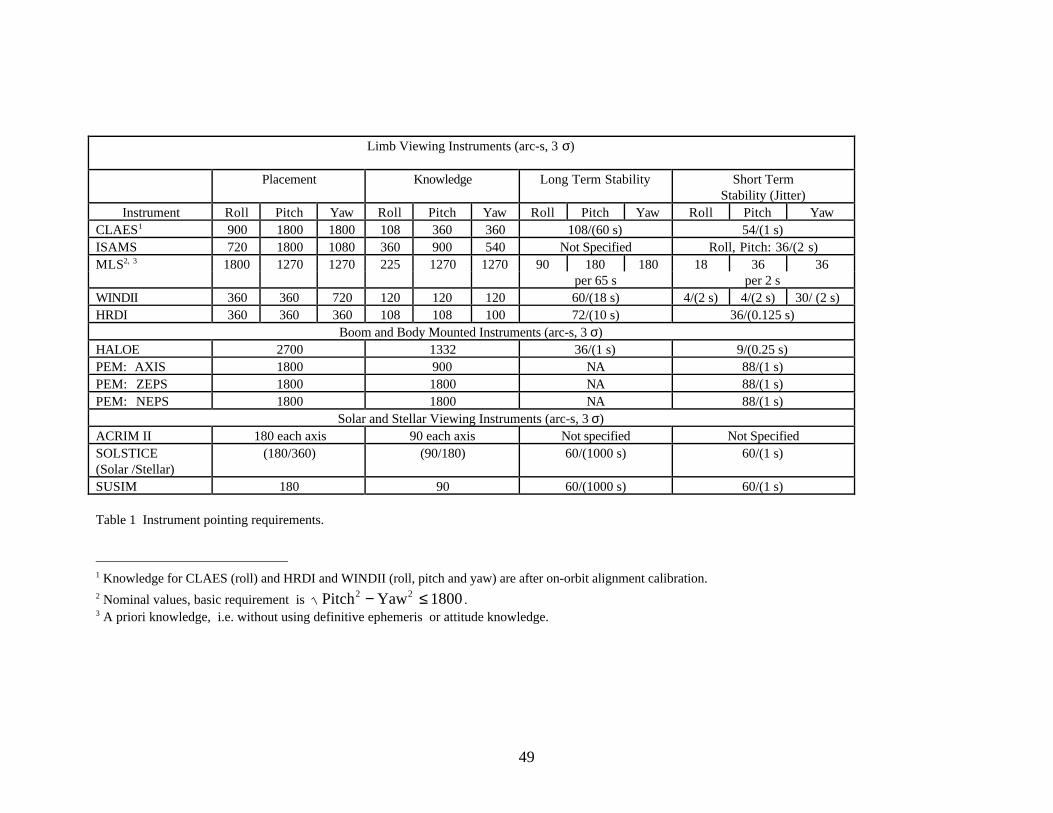
49
Limb Viewing Instruments (arc-s, 3 σ)
Placement Knowledge Long Term Stability Short TermStability (Jitter)
Instrument Roll Pitch Yaw Roll Pitch Yaw Roll Pitch Yaw Roll Pitch YawCLAES1 900 1800 1800 108 360 360 108/(60 s) 54/(1 s)ISAMS 720 1800 1080 360 900 540 Not Specified Roll, Pitch: 36/(2 s)MLS2, 3 1800 1270 1270 225 1270 1270 90 180 180 18 36 36
per 65 s per 2 sWINDII 360 360 720 120 120 120 60/(18 s) 4/(2 s) 4/(2 s) 30/ (2 s)HRDI 360 360 360 108 108 100 72/(10 s) 36/(0.125 s)
Boom and Body Mounted Instruments (arc-s, 3 σ)HALOE 2700 1332 36/(1 s) 9/(0.25 s)PEM: AXIS 1800 900 NA 88/(1 s)PEM: ZEPS 1800 1800 NA 88/(1 s)PEM: NEPS 1800 1800 NA 88/(1 s)
Solar and Stellar Viewing Instruments (arc-s, 3 σ)ACRIM II 180 each axis 90 each axis Not specified Not SpecifiedSOLSTICE(Solar /Stellar)
(180/360) (90/180) 60/(1000 s) 60/(1 s)
SUSIM 180 90 60/(1000 s) 60/(1 s)
Table 1 Instrument pointing requirements.
1 Knowledge for CLAES (roll) and HRDI and WINDII (roll, pitch and yaw) are after on-orbit alignment calibration.2 Nominal values, basic requirement is Pitch Yaw 18002 2− ≤ .3 A priori knowledge, i.e. without using definitive ephemeris or attitude knowledge.
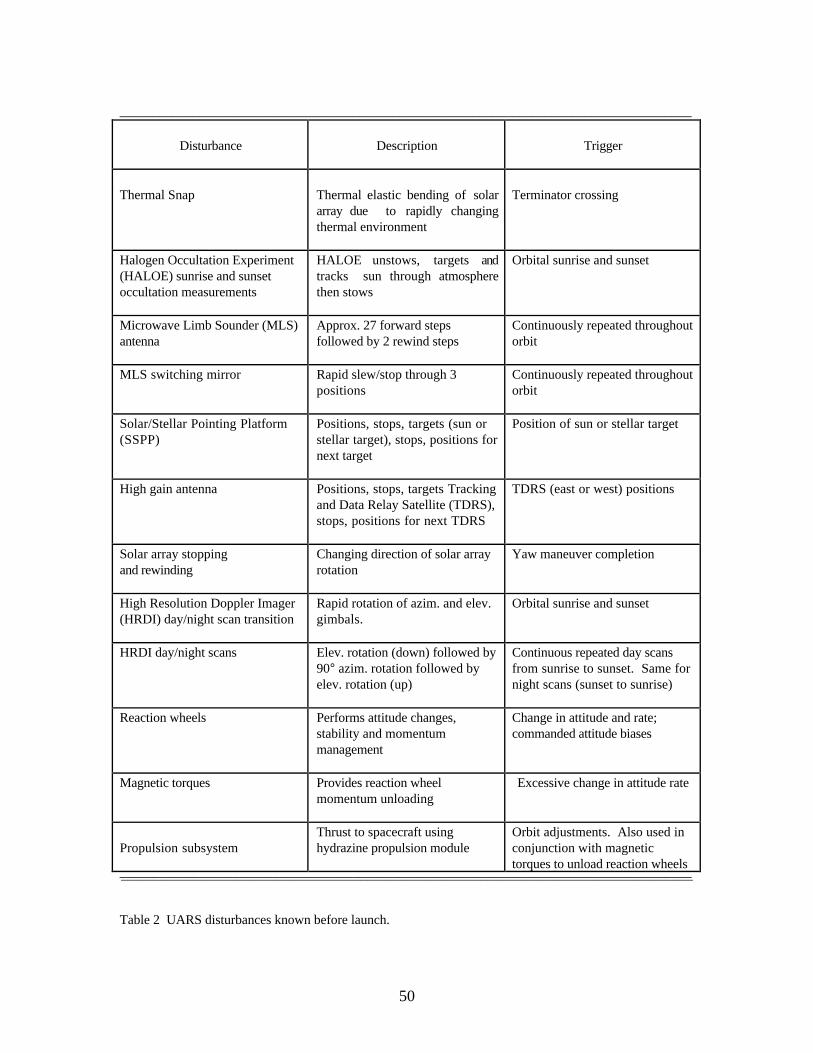
50
______________________________________________________________________________________
Disturbance Description Trigger
Thermal Snap Thermal elastic bending of solararray due to rapidly changingthermal environment
Terminator crossing
Halogen Occultation Experiment(HALOE) sunrise and sunsetoccultation measurements
HALOE unstows, targets andtracks sun through atmospherethen stows
Orbital sunrise and sunset
Microwave Limb Sounder (MLS)antenna
Approx. 27 forward stepsfollowed by 2 rewind steps
Continuously repeated throughoutorbit
MLS switching mirror Rapid slew/stop through 3positions
Continuously repeated throughoutorbit
Solar/Stellar Pointing Platform(SSPP)
Positions, stops, targets (sun orstellar target), stops, positions fornext target
Position of sun or stellar target
High gain antenna Positions, stops, targets Trackingand Data Relay Satellite (TDRS),stops, positions for next TDRS
TDRS (east or west) positions
Solar array stoppingand rewinding
Changing direction of solar arrayrotation
Yaw maneuver completion
High Resolution Doppler Imager(HRDI) day/night scan transition
Rapid rotation of azim. and elev.gimbals.
Orbital sunrise and sunset
HRDI day/night scans Elev. rotation (down) followed by90° azim. rotation followed byelev. rotation (up)
Continuous repeated day scansfrom sunrise to sunset. Same fornight scans (sunset to sunrise)
Reaction wheels Performs attitude changes,stability and momentummanagement
Change in attitude and rate;commanded attitude biases
Magnetic torques Provides reaction wheelmomentum unloading
Excessive change in attitude rate
Propulsion subsystemThrust to spacecraft usinghydrazine propulsion module
Orbit adjustments. Also used inconjunction with magnetictorques to unload reaction wheels
____________________________________________________________________________________________________________________________________________________________________________
Table 2 UARS disturbances known before launch.
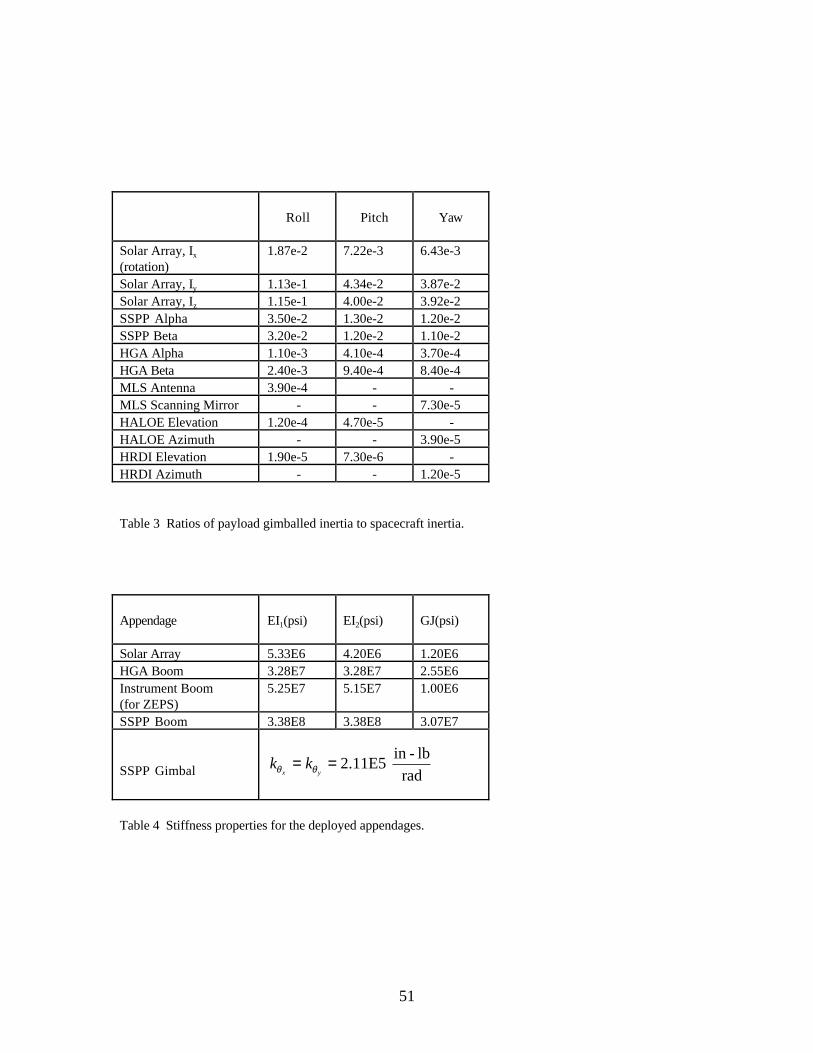
51
Roll Pitch Yaw
Solar Array, Ix
(rotation)1.87e-2 7.22e-3 6.43e-3
Solar Array, Iy 1.13e-1 4.34e-2 3.87e-2Solar Array, Iz 1.15e-1 4.00e-2 3.92e-2SSPP Alpha 3.50e-2 1.30e-2 1.20e-2SSPP Beta 3.20e-2 1.20e-2 1.10e-2HGA Alpha 1.10e-3 4.10e-4 3.70e-4HGA Beta 2.40e-3 9.40e-4 8.40e-4MLS Antenna 3.90e-4 - -MLS Scanning Mirror - - 7.30e-5HALOE Elevation 1.20e-4 4.70e-5 -HALOE Azimuth - - 3.90e-5HRDI Elevation 1.90e-5 7.30e-6 -HRDI Azimuth - - 1.20e-5
Table 3 Ratios of payload gimballed inertia to spacecraft inertia.
Appendage EI1(psi) EI2(psi) GJ(psi)
Solar Array 5.33E6 4.20E6 1.20E6HGA Boom 3.28E7 3.28E7 2.55E6Instrument Boom(for ZEPS)
5.25E7 5.15E7 1.00E6
SSPP Boom 3.38E8 3.38E8 3.07E7
SSPP Gimbal k kx yθ θ= = 2.11E5
in - lbrad
Table 4 Stiffness properties for the deployed appendages.
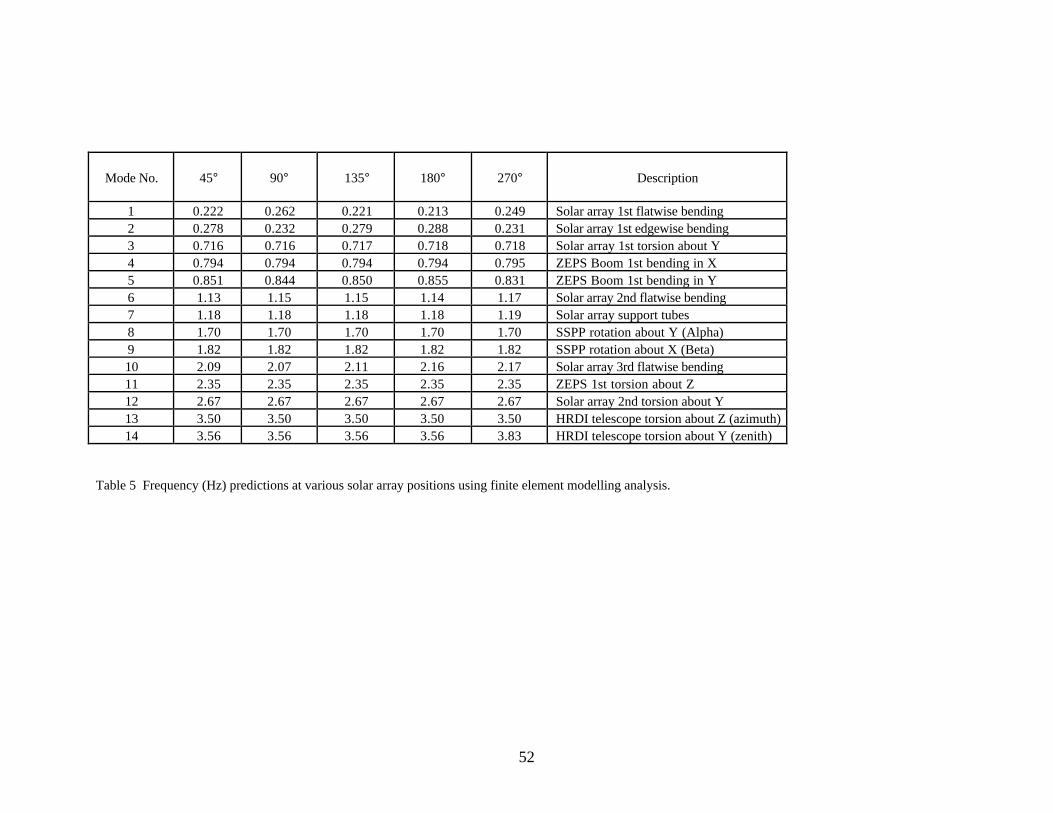
52
Mode No. 45° 90° 135° 180° 270° Description
1 0.222 0.262 0.221 0.213 0.249 Solar array 1st flatwise bending2 0.278 0.232 0.279 0.288 0.231 Solar array 1st edgewise bending3 0.716 0.716 0.717 0.718 0.718 Solar array 1st torsion about Y4 0.794 0.794 0.794 0.794 0.795 ZEPS Boom 1st bending in X5 0.851 0.844 0.850 0.855 0.831 ZEPS Boom 1st bending in Y6 1.13 1.15 1.15 1.14 1.17 Solar array 2nd flatwise bending7 1.18 1.18 1.18 1.18 1.19 Solar array support tubes8 1.70 1.70 1.70 1.70 1.70 SSPP rotation about Y (Alpha)9 1.82 1.82 1.82 1.82 1.82 SSPP rotation about X (Beta)10 2.09 2.07 2.11 2.16 2.17 Solar array 3rd flatwise bending11 2.35 2.35 2.35 2.35 2.35 ZEPS 1st torsion about Z12 2.67 2.67 2.67 2.67 2.67 Solar array 2nd torsion about Y13 3.50 3.50 3.50 3.50 3.50 HRDI telescope torsion about Z (azimuth)14 3.56 3.56 3.56 3.56 3.83 HRDI telescope torsion about Y (zenith)
Table 5 Frequency (Hz) predictions at various solar array positions using finite element modelling analysis.
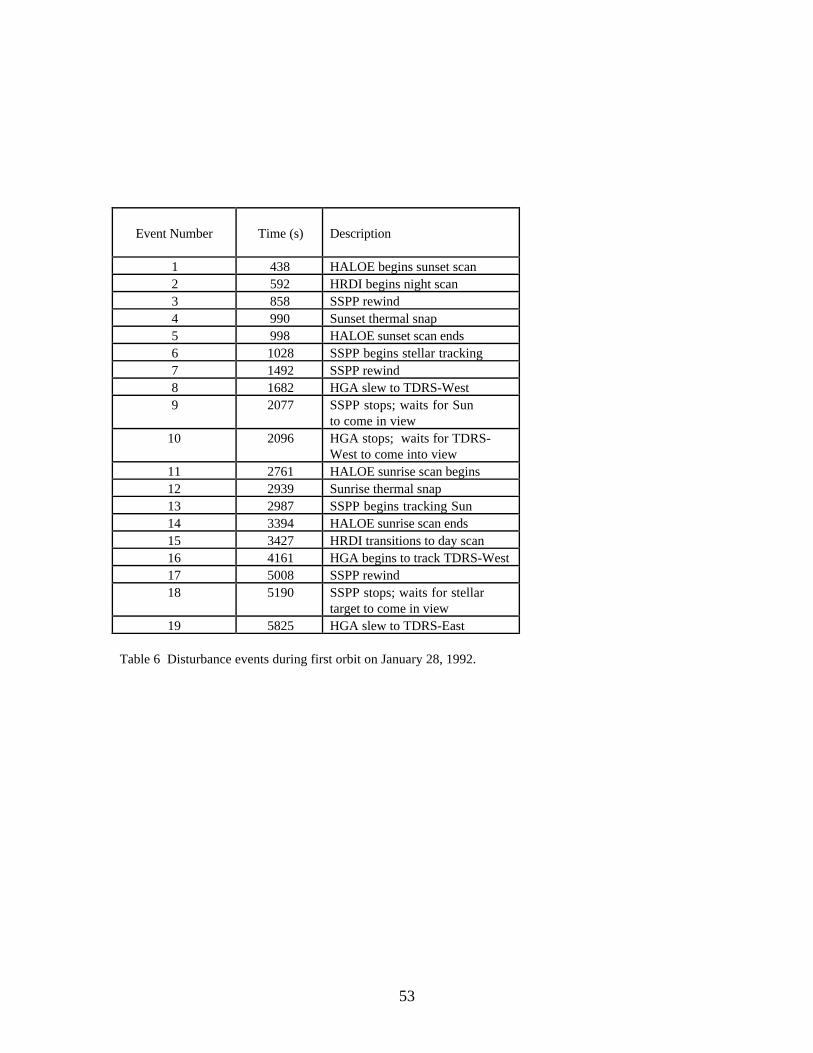
53
Event Number Time (s) Description
1 438 HALOE begins sunset scan2 592 HRDI begins night scan3 858 SSPP rewind4 990 Sunset thermal snap5 998 HALOE sunset scan ends6 1028 SSPP begins stellar tracking7 1492 SSPP rewind8 1682 HGA slew to TDRS-West9 2077 SSPP stops; waits for Sun
to come in view10 2096 HGA stops; waits for TDRS-
West to come into view11 2761 HALOE sunrise scan begins12 2939 Sunrise thermal snap13 2987 SSPP begins tracking Sun14 3394 HALOE sunrise scan ends15 3427 HRDI transitions to day scan16 4161 HGA begins to track TDRS-West17 5008 SSPP rewind18 5190 SSPP stops; waits for stellar
target to come in view19 5825 HGA slew to TDRS-East
Table 6 Disturbance events during first orbit on January 28, 1992.
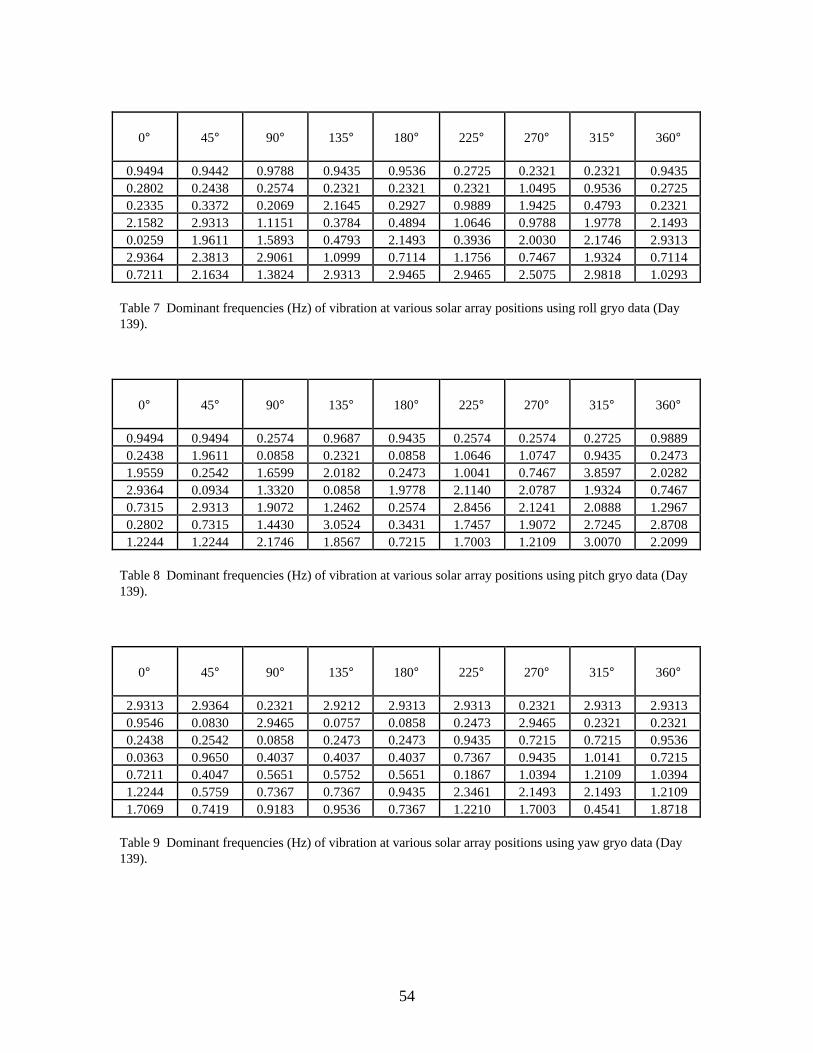
54
0° 45° 90° 135° 180° 225° 270° 315° 360°
0.9494 0.9442 0.9788 0.9435 0.9536 0.2725 0.2321 0.2321 0.94350.2802 0.2438 0.2574 0.2321 0.2321 0.2321 1.0495 0.9536 0.27250.2335 0.3372 0.2069 2.1645 0.2927 0.9889 1.9425 0.4793 0.23212.1582 2.9313 1.1151 0.3784 0.4894 1.0646 0.9788 1.9778 2.14930.0259 1.9611 1.5893 0.4793 2.1493 0.3936 2.0030 2.1746 2.93132.9364 2.3813 2.9061 1.0999 0.7114 1.1756 0.7467 1.9324 0.71140.7211 2.1634 1.3824 2.9313 2.9465 2.9465 2.5075 2.9818 1.0293
Table 7 Dominant frequencies (Hz) of vibration at various solar array positions using roll gryo data (Day139).
0° 45° 90° 135° 180° 225° 270° 315° 360°
0.9494 0.9494 0.2574 0.9687 0.9435 0.2574 0.2574 0.2725 0.98890.2438 1.9611 0.0858 0.2321 0.0858 1.0646 1.0747 0.9435 0.24731.9559 0.2542 1.6599 2.0182 0.2473 1.0041 0.7467 3.8597 2.02822.9364 0.0934 1.3320 0.0858 1.9778 2.1140 2.0787 1.9324 0.74670.7315 2.9313 1.9072 1.2462 0.2574 2.8456 2.1241 2.0888 1.29670.2802 0.7315 1.4430 3.0524 0.3431 1.7457 1.9072 2.7245 2.87081.2244 1.2244 2.1746 1.8567 0.7215 1.7003 1.2109 3.0070 2.2099
Table 8 Dominant frequencies (Hz) of vibration at various solar array positions using pitch gryo data (Day139).
0° 45° 90° 135° 180° 225° 270° 315° 360°
2.9313 2.9364 0.2321 2.9212 2.9313 2.9313 0.2321 2.9313 2.93130.9546 0.0830 2.9465 0.0757 0.0858 0.2473 2.9465 0.2321 0.23210.2438 0.2542 0.0858 0.2473 0.2473 0.9435 0.7215 0.7215 0.95360.0363 0.9650 0.4037 0.4037 0.4037 0.7367 0.9435 1.0141 0.72150.7211 0.4047 0.5651 0.5752 0.5651 0.1867 1.0394 1.2109 1.03941.2244 0.5759 0.7367 0.7367 0.9435 2.3461 2.1493 2.1493 1.21091.7069 0.7419 0.9183 0.9536 0.7367 1.2210 1.7003 0.4541 1.8718
Table 9 Dominant frequencies (Hz) of vibration at various solar array positions using yaw gryo data (Day139).
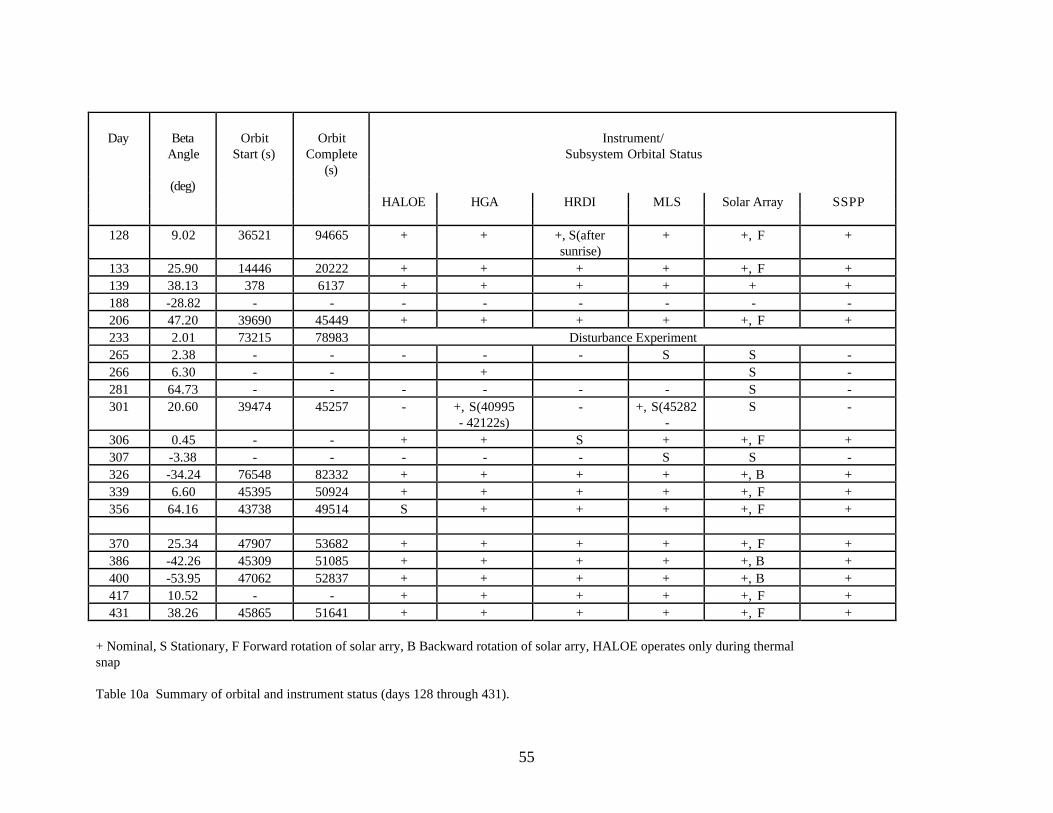
55
Day BetaAngle
OrbitStart (s)
OrbitComplete
(s)
Instrument/Subsystem Orbital Status
(deg)HALOE HGA HRDI MLS Solar Array SSPP
128 9.02 36521 94665 + + +, S(aftersunrise)
+ +, F +
133 25.90 14446 20222 + + + + +, F +139 38.13 378 6137 + + + + + +188 -28.82 - - - - - - - -206 47.20 39690 45449 + + + + +, F +233 2.01 73215 78983 Disturbance Experiment265 2.38 - - - - - S S -266 6.30 - - + S -281 64.73 - - - - - - S -301 20.60 39474 45257 - +, S(40995
- 42122s)- +, S(45282
-S -
306 0.45 - - + + S + +, F +307 -3.38 - - - - - S S -326 -34.24 76548 82332 + + + + +, B +339 6.60 45395 50924 + + + + +, F +356 64.16 43738 49514 S + + + +, F +
370 25.34 47907 53682 + + + + +, F +386 -42.26 45309 51085 + + + + +, B +400 -53.95 47062 52837 + + + + +, B +417 10.52 - - + + + + +, F +431 38.26 45865 51641 + + + + +, F +
+ Nominal, S Stationary, F Forward rotation of solar arry, B Backward rotation of solar arry, HALOE operates only during thermalsnap
Table 10a Summary of orbital and instrument status (days 128 through 431).
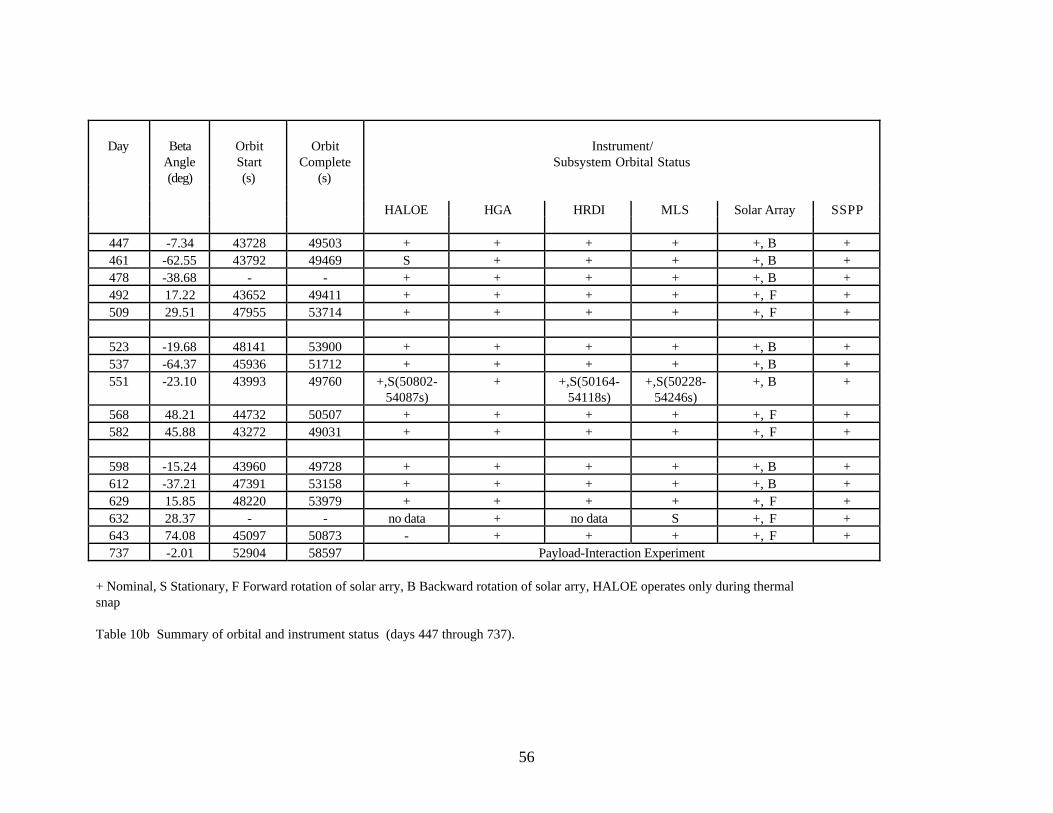
56
Day BetaAngle(deg)
OrbitStart(s)
OrbitComplete
(s)
Instrument/Subsystem Orbital Status
HALOE HGA HRDI MLS Solar Array SSPP
447 -7.34 43728 49503 + + + + +, B +461 -62.55 43792 49469 S + + + +, B +478 -38.68 - - + + + + +, B +492 17.22 43652 49411 + + + + +, F +509 29.51 47955 53714 + + + + +, F +
523 -19.68 48141 53900 + + + + +, B +537 -64.37 45936 51712 + + + + +, B +551 -23.10 43993 49760 +,S(50802-
54087s)+ +,S(50164-
54118s)+,S(50228-
54246s)+, B +
568 48.21 44732 50507 + + + + +, F +582 45.88 43272 49031 + + + + +, F +
598 -15.24 43960 49728 + + + + +, B +612 -37.21 47391 53158 + + + + +, B +629 15.85 48220 53979 + + + + +, F +632 28.37 - - no data + no data S +, F +643 74.08 45097 50873 - + + + +, F +737 -2.01 52904 58597 Payload-Interaction Experiment
+ Nominal, S Stationary, F Forward rotation of solar arry, B Backward rotation of solar arry, HALOE operates only during thermalsnap
Table 10b Summary of orbital and instrument status (days 447 through 737).
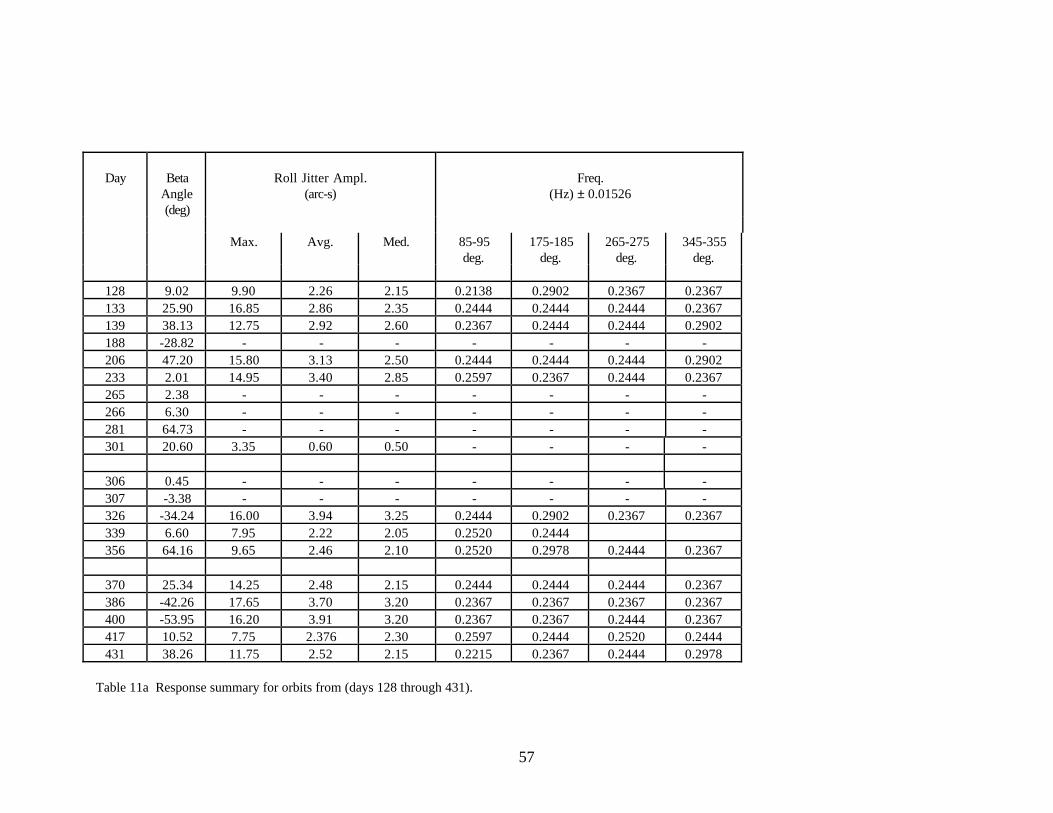
57
Day BetaAngle(deg)
Roll Jitter Ampl.(arc-s)
Freq.(Hz) ± 0.01526
Max. Avg. Med. 85-95deg.
175-185deg.
265-275deg.
345-355deg.
128 9.02 9.90 2.26 2.15 0.2138 0.2902 0.2367 0.2367133 25.90 16.85 2.86 2.35 0.2444 0.2444 0.2444 0.2367139 38.13 12.75 2.92 2.60 0.2367 0.2444 0.2444 0.2902188 -28.82 - - - - - - -206 47.20 15.80 3.13 2.50 0.2444 0.2444 0.2444 0.2902233 2.01 14.95 3.40 2.85 0.2597 0.2367 0.2444 0.2367265 2.38 - - - - - - -266 6.30 - - - - - - -281 64.73 - - - - - - -301 20.60 3.35 0.60 0.50 - - - -
306 0.45 - - - - - - -307 -3.38 - - - - - - -326 -34.24 16.00 3.94 3.25 0.2444 0.2902 0.2367 0.2367339 6.60 7.95 2.22 2.05 0.2520 0.2444356 64.16 9.65 2.46 2.10 0.2520 0.2978 0.2444 0.2367
370 25.34 14.25 2.48 2.15 0.2444 0.2444 0.2444 0.2367386 -42.26 17.65 3.70 3.20 0.2367 0.2367 0.2367 0.2367400 -53.95 16.20 3.91 3.20 0.2367 0.2367 0.2444 0.2367417 10.52 7.75 2.376 2.30 0.2597 0.2444 0.2520 0.2444431 38.26 11.75 2.52 2.15 0.2215 0.2367 0.2444 0.2978
Table 11a Response summary for orbits from (days 128 through 431).
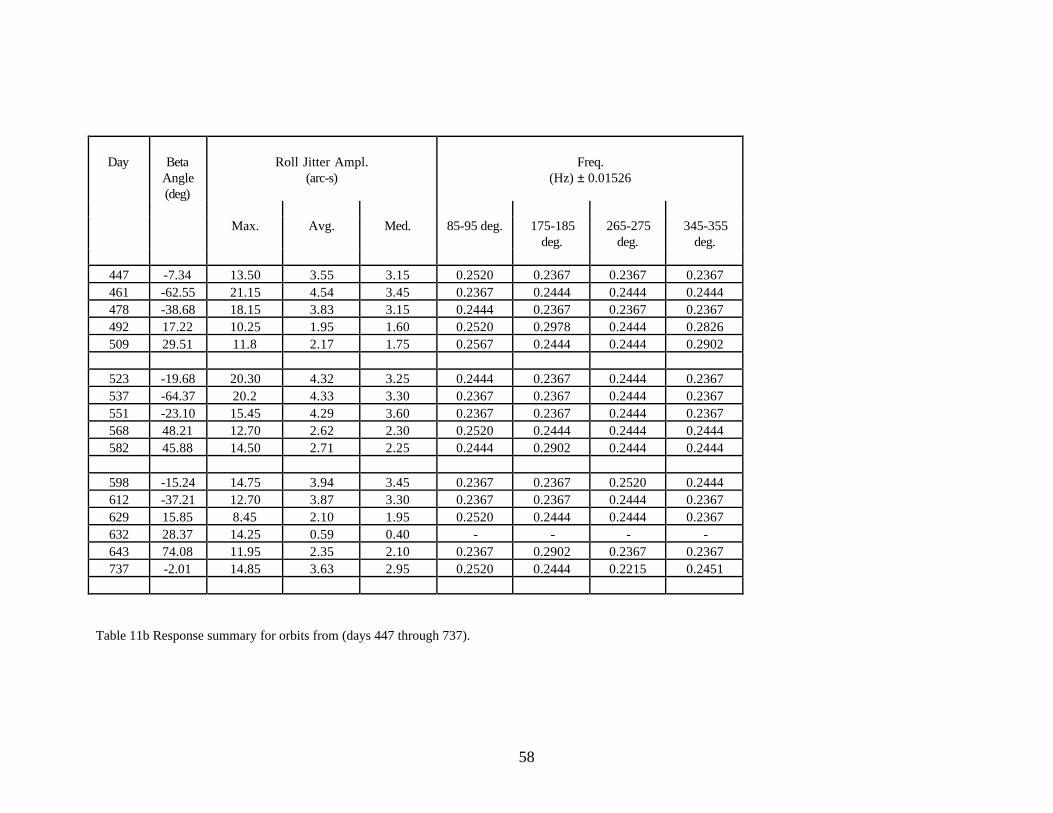
58
Day BetaAngle(deg)
Roll Jitter Ampl.(arc-s)
Freq.(Hz) ± 0.01526
Max. Avg. Med. 85-95 deg. 175-185deg.
265-275deg.
345-355deg.
447 -7.34 13.50 3.55 3.15 0.2520 0.2367 0.2367 0.2367461 -62.55 21.15 4.54 3.45 0.2367 0.2444 0.2444 0.2444478 -38.68 18.15 3.83 3.15 0.2444 0.2367 0.2367 0.2367492 17.22 10.25 1.95 1.60 0.2520 0.2978 0.2444 0.2826509 29.51 11.8 2.17 1.75 0.2567 0.2444 0.2444 0.2902
523 -19.68 20.30 4.32 3.25 0.2444 0.2367 0.2444 0.2367537 -64.37 20.2 4.33 3.30 0.2367 0.2367 0.2444 0.2367551 -23.10 15.45 4.29 3.60 0.2367 0.2367 0.2444 0.2367568 48.21 12.70 2.62 2.30 0.2520 0.2444 0.2444 0.2444582 45.88 14.50 2.71 2.25 0.2444 0.2902 0.2444 0.2444
598 -15.24 14.75 3.94 3.45 0.2367 0.2367 0.2520 0.2444612 -37.21 12.70 3.87 3.30 0.2367 0.2367 0.2444 0.2367629 15.85 8.45 2.10 1.95 0.2520 0.2444 0.2444 0.2367632 28.37 14.25 0.59 0.40 - - - -643 74.08 11.95 2.35 2.10 0.2367 0.2902 0.2367 0.2367737 -2.01 14.85 3.63 2.95 0.2520 0.2444 0.2215 0.2451
Table 11b Response summary for orbits from (days 447 through 737).
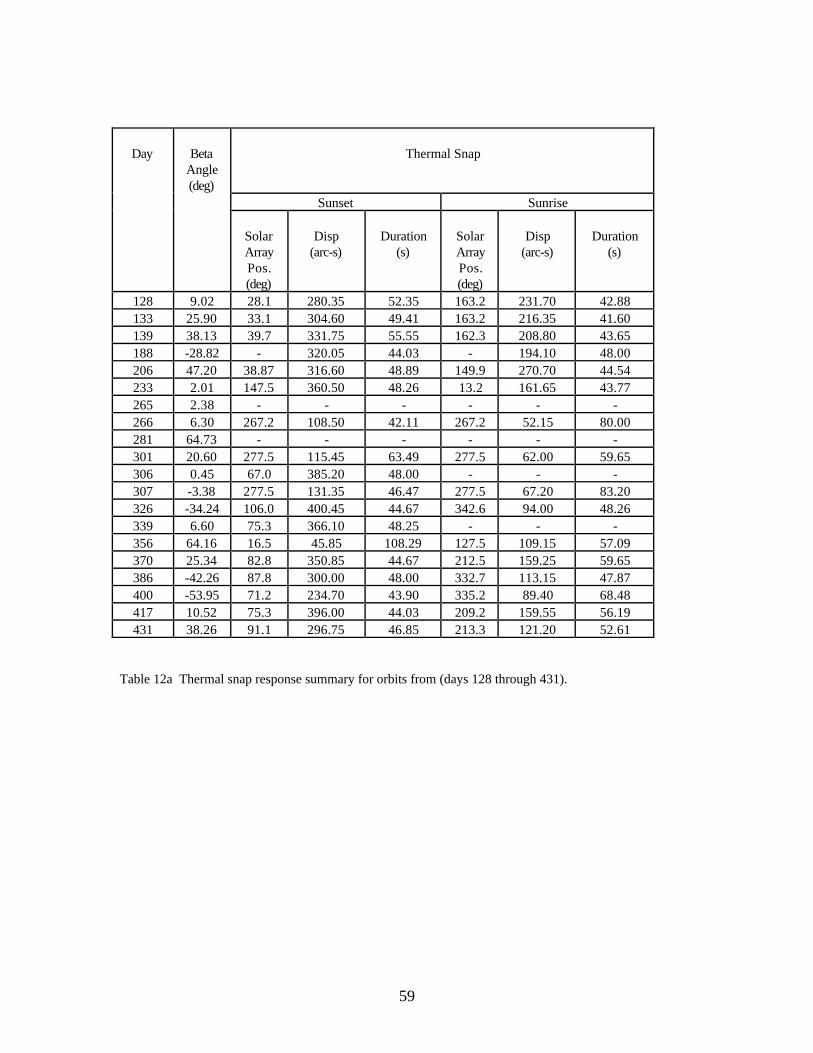
59
Day BetaAngle(deg)
Thermal Snap
Sunset Sunrise
SolarArrayPos.
Disp(arc-s)
Duration(s)
SolarArrayPos.
Disp(arc-s)
Duration(s)
(deg) (deg)128 9.02 28.1 280.35 52.35 163.2 231.70 42.88133 25.90 33.1 304.60 49.41 163.2 216.35 41.60139 38.13 39.7 331.75 55.55 162.3 208.80 43.65188 -28.82 - 320.05 44.03 - 194.10 48.00206 47.20 38.87 316.60 48.89 149.9 270.70 44.54233 2.01 147.5 360.50 48.26 13.2 161.65 43.77265 2.38 - - - - - -266 6.30 267.2 108.50 42.11 267.2 52.15 80.00281 64.73 - - - - - -301 20.60 277.5 115.45 63.49 277.5 62.00 59.65306 0.45 67.0 385.20 48.00 - - -307 -3.38 277.5 131.35 46.47 277.5 67.20 83.20326 -34.24 106.0 400.45 44.67 342.6 94.00 48.26339 6.60 75.3 366.10 48.25 - - -356 64.16 16.5 45.85 108.29 127.5 109.15 57.09370 25.34 82.8 350.85 44.67 212.5 159.25 59.65386 -42.26 87.8 300.00 48.00 332.7 113.15 47.87400 -53.95 71.2 234.70 43.90 335.2 89.40 68.48417 10.52 75.3 396.00 44.03 209.2 159.55 56.19431 38.26 91.1 296.75 46.85 213.3 121.20 52.61
Table 12a Thermal snap response summary for orbits from (days 128 through 431).
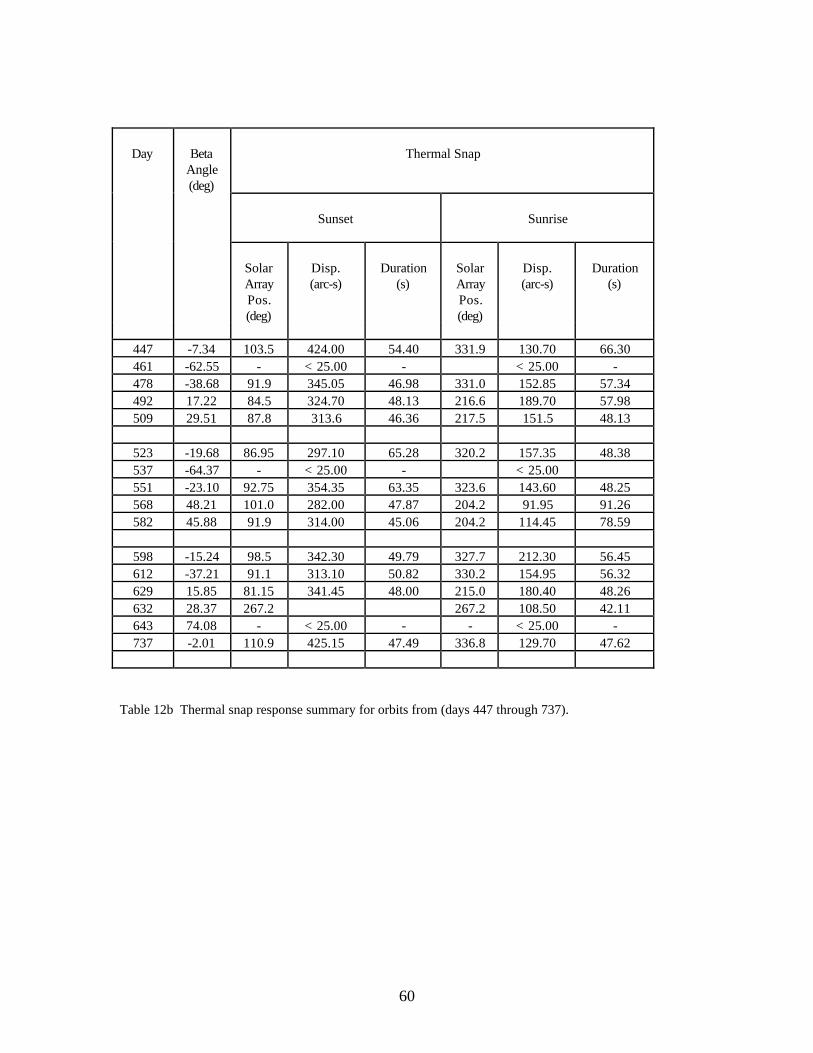
60
Day BetaAngle(deg)
Thermal Snap
Sunset Sunrise
SolarArrayPos.(deg)
Disp.(arc-s)
Duration(s)
SolarArrayPos.(deg)
Disp.(arc-s)
Duration(s)
447 -7.34 103.5 424.00 54.40 331.9 130.70 66.30461 -62.55 - < 25.00 - < 25.00 -478 -38.68 91.9 345.05 46.98 331.0 152.85 57.34492 17.22 84.5 324.70 48.13 216.6 189.70 57.98509 29.51 87.8 313.6 46.36 217.5 151.5 48.13
523 -19.68 86.95 297.10 65.28 320.2 157.35 48.38537 -64.37 - < 25.00 - < 25.00551 -23.10 92.75 354.35 63.35 323.6 143.60 48.25568 48.21 101.0 282.00 47.87 204.2 91.95 91.26582 45.88 91.9 314.00 45.06 204.2 114.45 78.59
598 -15.24 98.5 342.30 49.79 327.7 212.30 56.45612 -37.21 91.1 313.10 50.82 330.2 154.95 56.32629 15.85 81.15 341.45 48.00 215.0 180.40 48.26632 28.37 267.2 267.2 108.50 42.11643 74.08 - < 25.00 - - < 25.00 -737 -2.01 110.9 425.15 47.49 336.8 129.70 47.62
Table 12b Thermal snap response summary for orbits from (days 447 through 737).
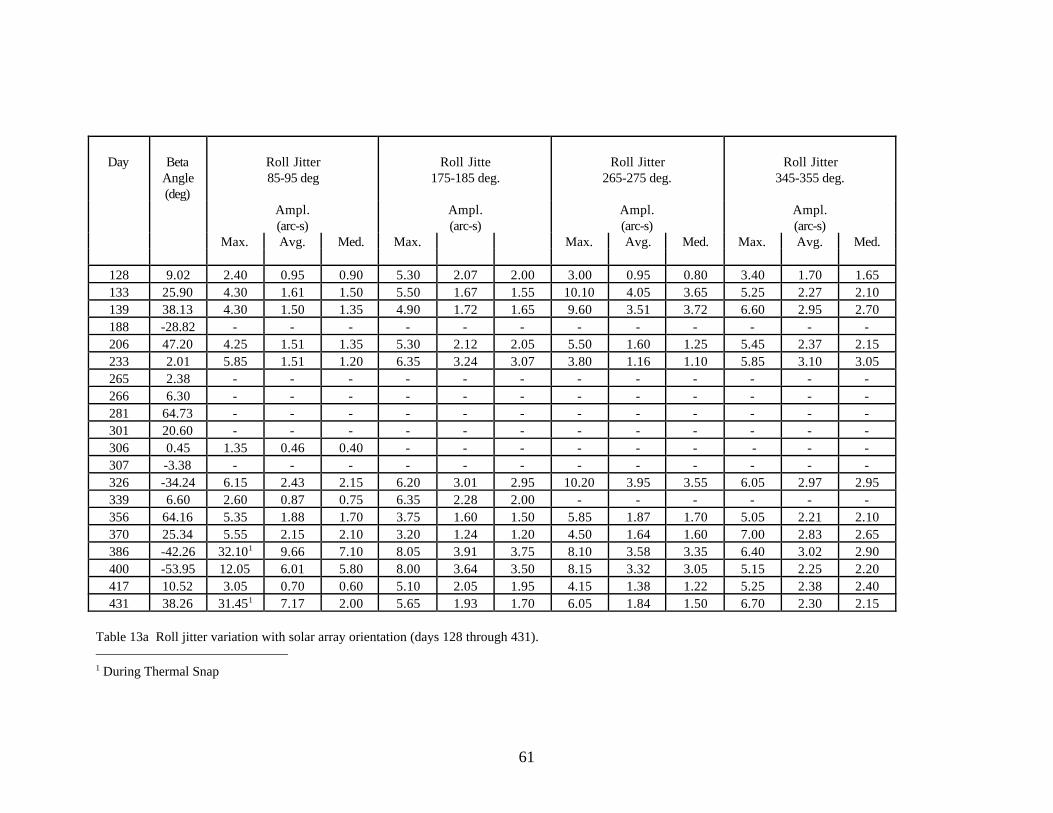
61
Day BetaAngle(deg)
Roll Jitter85-95 deg
Roll Jitte175-185 deg.
Roll Jitter265-275 deg.
Roll Jitter345-355 deg.
Ampl.(arc-s)
Ampl.(arc-s)
Ampl.(arc-s)
Ampl.(arc-s)
Max. Avg. Med. Max. Max. Avg. Med. Max. Avg. Med.
128 9.02 2.40 0.95 0.90 5.30 2.07 2.00 3.00 0.95 0.80 3.40 1.70 1.65133 25.90 4.30 1.61 1.50 5.50 1.67 1.55 10.10 4.05 3.65 5.25 2.27 2.10139 38.13 4.30 1.50 1.35 4.90 1.72 1.65 9.60 3.51 3.72 6.60 2.95 2.70188 -28.82 - - - - - - - - - - - -206 47.20 4.25 1.51 1.35 5.30 2.12 2.05 5.50 1.60 1.25 5.45 2.37 2.15233 2.01 5.85 1.51 1.20 6.35 3.24 3.07 3.80 1.16 1.10 5.85 3.10 3.05265 2.38 - - - - - - - - - - - -266 6.30 - - - - - - - - - - - -281 64.73 - - - - - - - - - - - -301 20.60 - - - - - - - - - - - -306 0.45 1.35 0.46 0.40 - - - - - - - - -307 -3.38 - - - - - - - - - - - -326 -34.24 6.15 2.43 2.15 6.20 3.01 2.95 10.20 3.95 3.55 6.05 2.97 2.95339 6.60 2.60 0.87 0.75 6.35 2.28 2.00 - - - - - -356 64.16 5.35 1.88 1.70 3.75 1.60 1.50 5.85 1.87 1.70 5.05 2.21 2.10370 25.34 5.55 2.15 2.10 3.20 1.24 1.20 4.50 1.64 1.60 7.00 2.83 2.65386 -42.26 32.101 9.66 7.10 8.05 3.91 3.75 8.10 3.58 3.35 6.40 3.02 2.90400 -53.95 12.05 6.01 5.80 8.00 3.64 3.50 8.15 3.32 3.05 5.15 2.25 2.20417 10.52 3.05 0.70 0.60 5.10 2.05 1.95 4.15 1.38 1.22 5.25 2.38 2.40431 38.26 31.451 7.17 2.00 5.65 1.93 1.70 6.05 1.84 1.50 6.70 2.30 2.15
Table 13a Roll jitter variation with solar array orientation (days 128 through 431). 1 During Thermal Snap
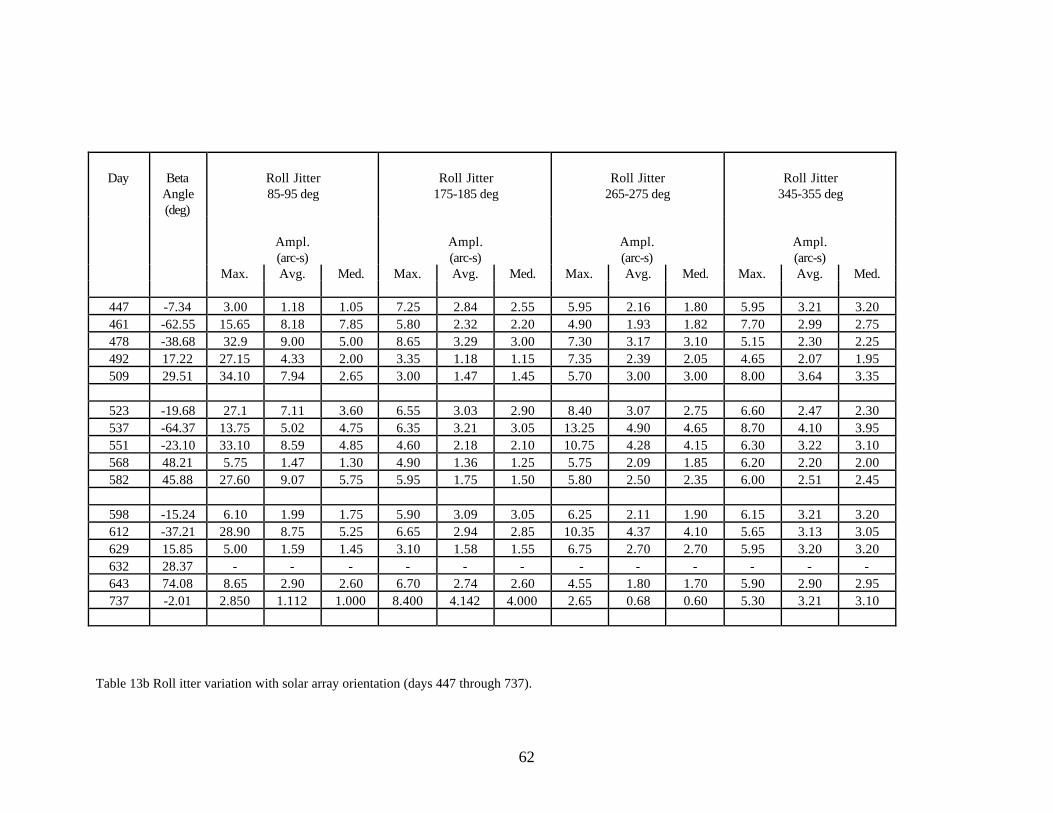
62
Day BetaAngle(deg)
Roll Jitter85-95 deg
Roll Jitter175-185 deg
Roll Jitter265-275 deg
Roll Jitter345-355 deg
Ampl.(arc-s)
Ampl.(arc-s)
Ampl.(arc-s)
Ampl.(arc-s)
Max. Avg. Med. Max. Avg. Med. Max. Avg. Med. Max. Avg. Med.
447 -7.34 3.00 1.18 1.05 7.25 2.84 2.55 5.95 2.16 1.80 5.95 3.21 3.20461 -62.55 15.65 8.18 7.85 5.80 2.32 2.20 4.90 1.93 1.82 7.70 2.99 2.75478 -38.68 32.9 9.00 5.00 8.65 3.29 3.00 7.30 3.17 3.10 5.15 2.30 2.25492 17.22 27.15 4.33 2.00 3.35 1.18 1.15 7.35 2.39 2.05 4.65 2.07 1.95509 29.51 34.10 7.94 2.65 3.00 1.47 1.45 5.70 3.00 3.00 8.00 3.64 3.35
523 -19.68 27.1 7.11 3.60 6.55 3.03 2.90 8.40 3.07 2.75 6.60 2.47 2.30537 -64.37 13.75 5.02 4.75 6.35 3.21 3.05 13.25 4.90 4.65 8.70 4.10 3.95551 -23.10 33.10 8.59 4.85 4.60 2.18 2.10 10.75 4.28 4.15 6.30 3.22 3.10568 48.21 5.75 1.47 1.30 4.90 1.36 1.25 5.75 2.09 1.85 6.20 2.20 2.00582 45.88 27.60 9.07 5.75 5.95 1.75 1.50 5.80 2.50 2.35 6.00 2.51 2.45
598 -15.24 6.10 1.99 1.75 5.90 3.09 3.05 6.25 2.11 1.90 6.15 3.21 3.20612 -37.21 28.90 8.75 5.25 6.65 2.94 2.85 10.35 4.37 4.10 5.65 3.13 3.05629 15.85 5.00 1.59 1.45 3.10 1.58 1.55 6.75 2.70 2.70 5.95 3.20 3.20632 28.37 - - - - - - - - - - - -643 74.08 8.65 2.90 2.60 6.70 2.74 2.60 4.55 1.80 1.70 5.90 2.90 2.95737 -2.01 2.850 1.112 1.000 8.400 4.142 4.000 2.65 0.68 0.60 5.30 3.21 3.10
Table 13b Roll itter variation with solar array orientation (days 447 through 737).
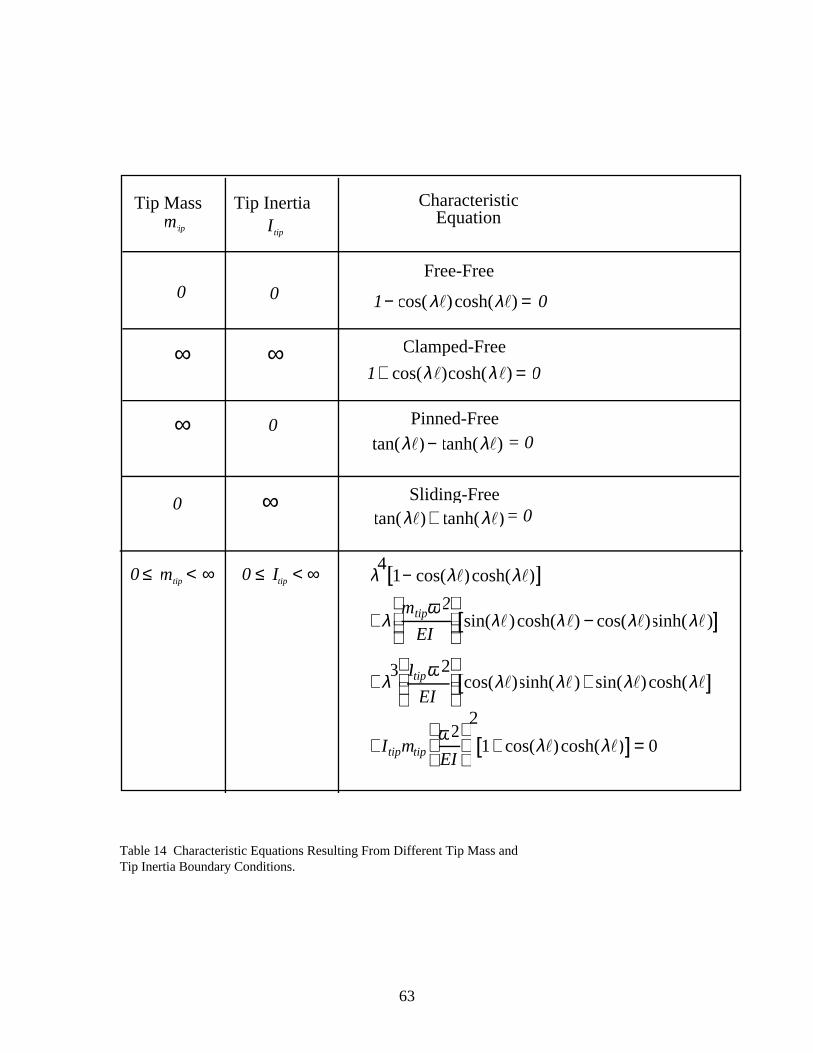
63
0 ≤ mtip < ∞ 0 ≤ Itip < ∞
Tip Massmtip
Tip Inertia CharacteristicEquation
0 1− cos(λl)cosh(λl) = 0
Free-Free0
1+ cos(λl)cosh(λl) = 0
Clamped-Free∞ ∞
∞ Pinned-Free
tan(λl)− tanh(λl) = 00
Sliding-Free
tan(λl)+ tanh(λl)= 0∞0
λ41− cos(λl)cosh(λl)[ ]
+λmtipω2
EI
sin(λl)cosh(λl) − cos(λl)sinh(λl)[ ]
+λ3 Itipω2
EI
cos(λl)sinh(λl)+ sin(λl)cosh(λl[ ]
+ Itipmtipω2
EI
2
1+ cos(λl)cosh(λl)[ ]= 0
Itip
Table 14 Characteristic Equations Resulting From Different Tip Mass andTip Inertia Boundary Conditions.
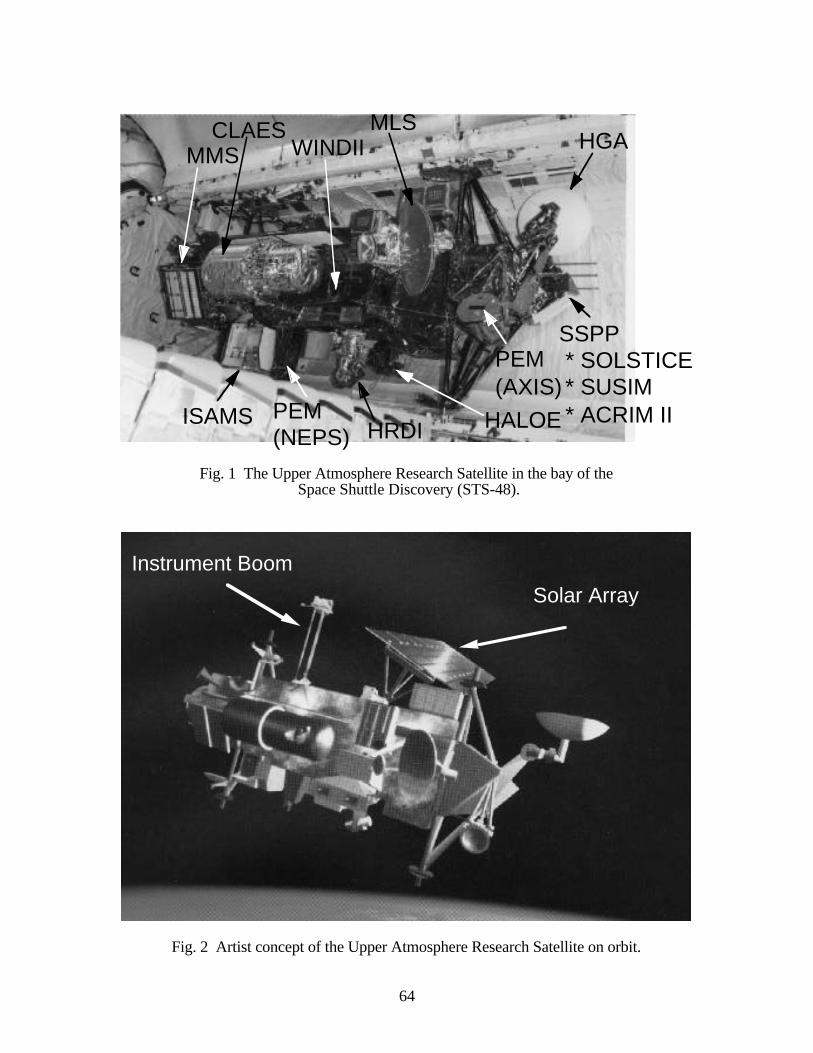
64
PEM(NEPS)
CLAESWINDII
MLSHGA
SSPP * SOLSTICE * SUSIM * ACRIM II
PEM(AXIS)
HALOEHRDIISAMS
MMS
Fig. 1 The Upper Atmosphere Research Satellite in the bay of the Space Shuttle Discovery (STS-48).
Instrument Boom
Solar Array
Fig. 2 Artist concept of the Upper Atmosphere Research Satellite on orbit.
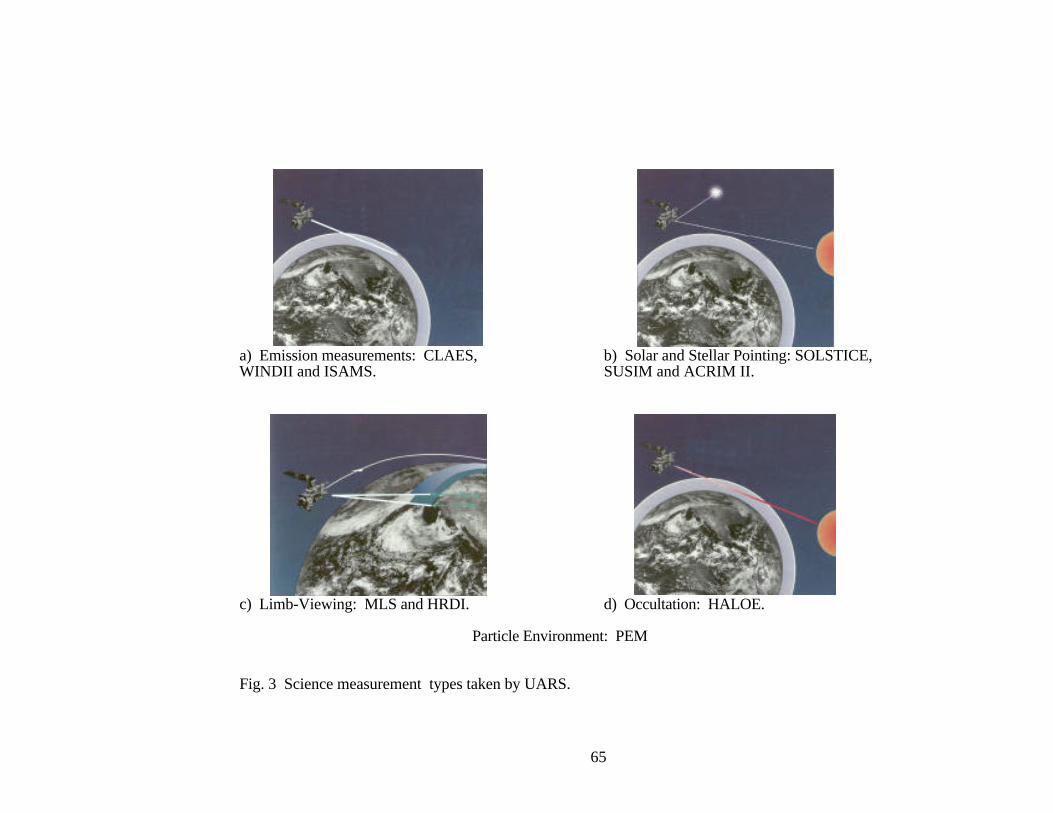
65
a) Emission measurements: CLAES,WINDII and ISAMS.
b) Solar and Stellar Pointing: SOLSTICE,SUSIM and ACRIM II.
c) Limb-Viewing: MLS and HRDI. d) Occultation: HALOE.
Particle Environment: PEM
Fig. 3 Science measurement types taken by UARS.
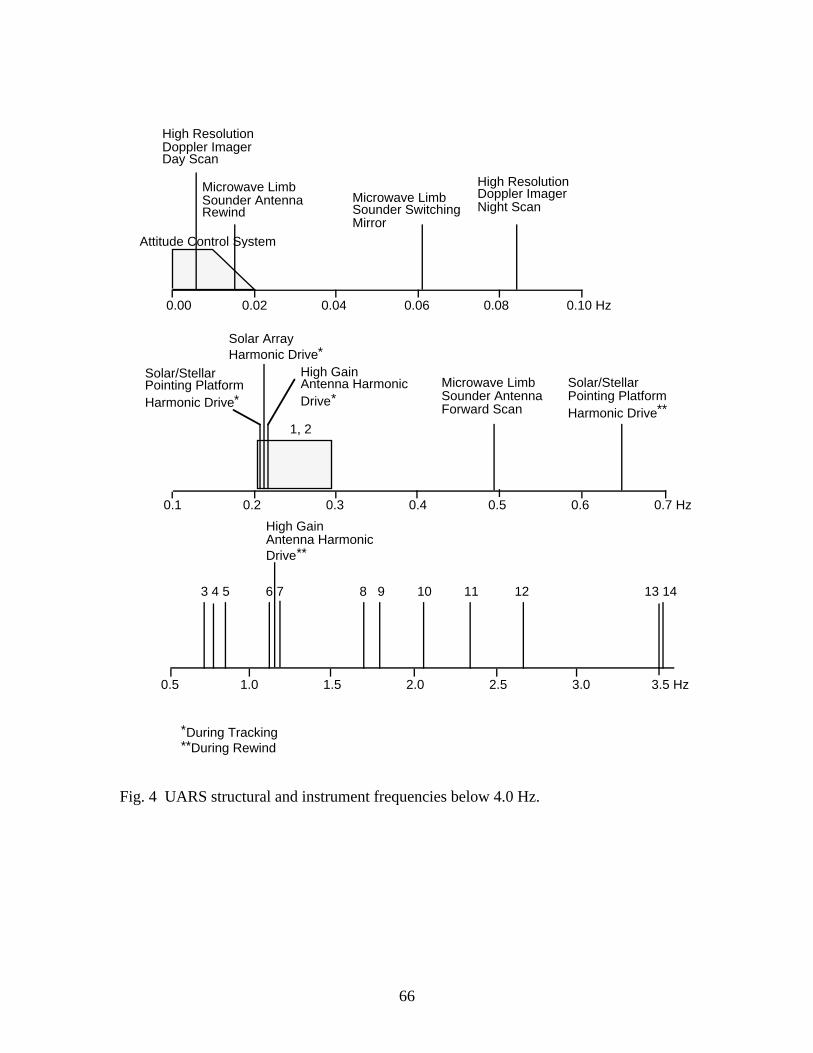
66
High Resolution Doppler Imager Day Scan
High Resolution Doppler Imager Night Scan
0.00 0.02 0.04 0.06 0.08 0.10 Hz
Microwave Limb Sounder Switching Mirror
Microwave Limb Sounder Antenna Rewind
Attitude Control System
Solar Array Harmonic Drive*
High Gain Antenna HarmonicDrive*
0.1 0.2 0.3 0.4 0.5 0.6 0.7 Hz
Solar/Stellar Pointing PlatformHarmonic Drive*
Microwave Limb Sounder Antenna Forward Scan
Solar/Stellar Pointing PlatformHarmonic Drive**
0.5 1.0 1.5 2.0 2.5 3.0 3.5 Hz
3 4 5 6 7 8 9 10 11 12 13 14
High Gain Antenna HarmonicDrive**
1, 2
*During Tracking**During Rewind
Fig. 4 UARS structural and instrument frequencies below 4.0 Hz.
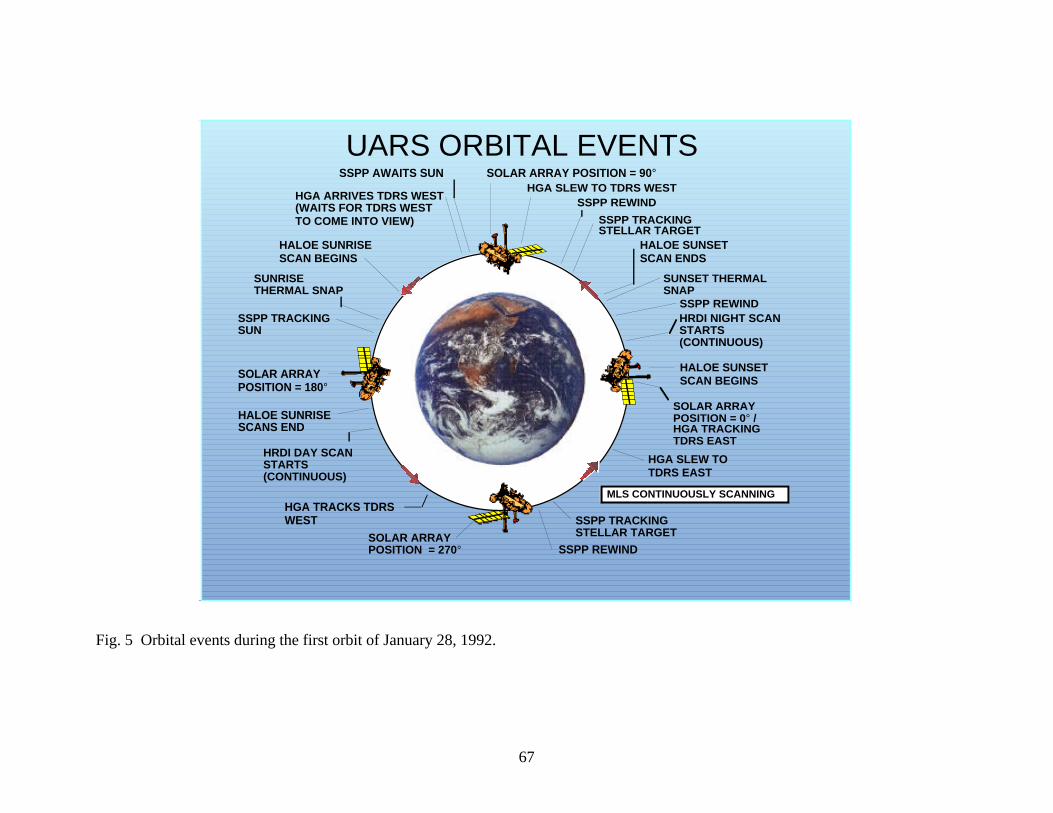
67
SOLAR ARRAY POSITION = 90°HGA SLEW TO TDRS WEST
SSPP TRACKINGSTELLAR TARGET
HALOE SUNSETSCAN ENDS
SUNSET THERMALSNAP
SSPP REWINDHRDI NIGHT SCANSTARTS(CONTINUOUS)
HALOE SUNSETSCAN BEGINS
SOLAR ARRAYPOSITION = 0° /HGA TRACKINGTDRS EAST
HGA SLEW TOTDRS EAST
SSPP TRACKINGSTELLAR TARGET
SSPP REWIND
SSPP AWAITS SUN
HGA ARRIVES TDRS WEST(WAITS FOR TDRS WESTTO COME INTO VIEW)
HALOE SUNRISESCAN BEGINS
SUNRISETHERMAL SNAP
SSPP TRACKINGSUN
SOLAR ARRAYPOSITION = 180°
HALOE SUNRISESCANS END
HRDI DAY SCANSTARTS(CONTINUOUS)
HGA TRACKS TDRSWEST
SOLAR ARRAYPOSITION = 270°
SSPP REWIND
MLS CONTINUOUSLY SCANNING
UARS ORBITAL EVENTS
Fig. 5 Orbital events during the first orbit of January 28, 1992.
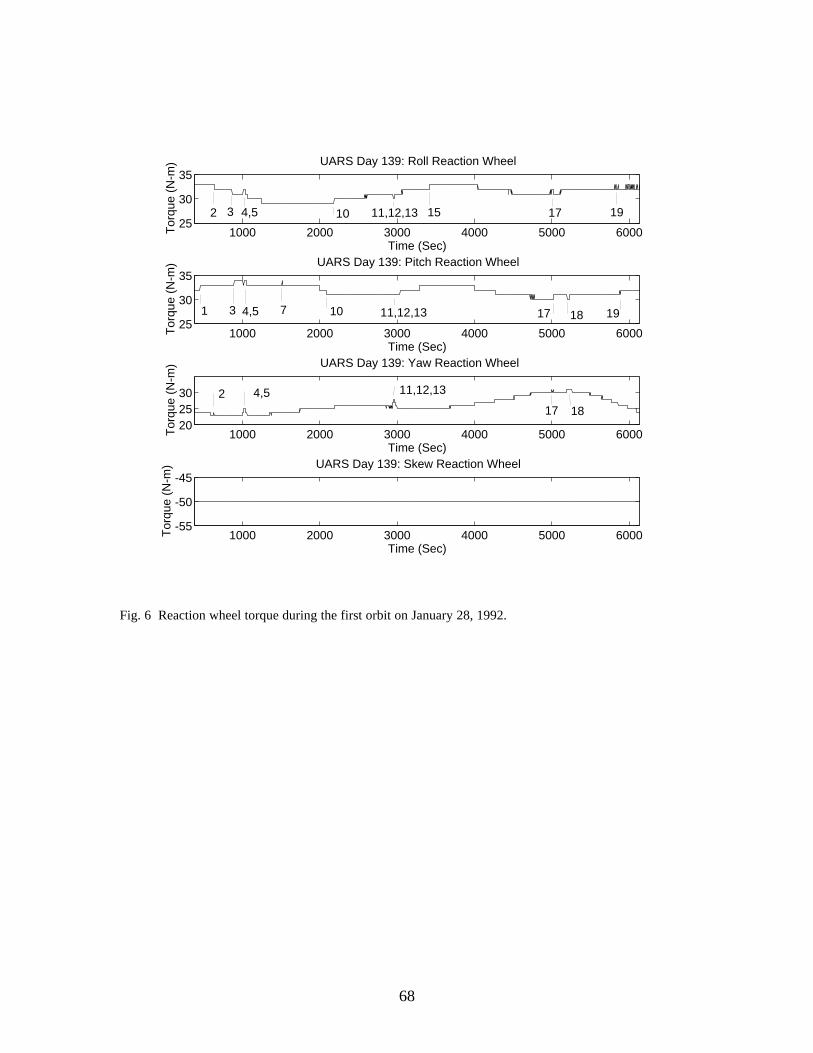
68
1000 2000 3000 4000 5000 600025
30
35
Time (Sec)
Tor
que
(N-m
) UARS Day 139: Roll Reaction Wheel
1000 2000 3000 4000 5000 600025
30
35
Time (Sec)
Tor
que
(N-m
) UARS Day 139: Pitch Reaction Wheel
1000 2000 3000 4000 5000 6000202530
Time (Sec)
Tor
que
(N-m
) UARS Day 139: Yaw Reaction Wheel
1000 2000 3000 4000 5000 6000-55
-50
-45
Time (Sec)
Tor
que
(N-m
) UARS Day 139: Skew Reaction Wheel
2 3 4,5 10 11,12,13 15 17 19
1 4,53 7 10 11,12,13 17 18 19
1817
11,12,134,52
Fig. 6 Reaction wheel torque during the first orbit on January 28, 1992.
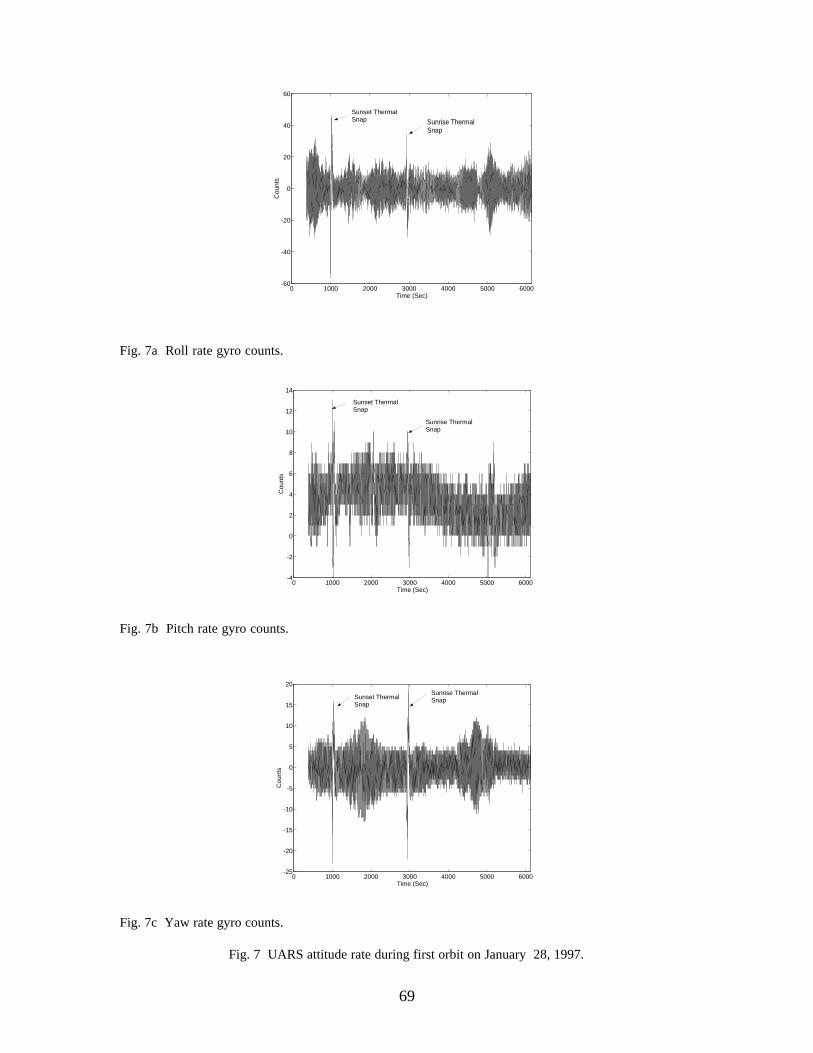
69
0 1000 2000 3000 4000 5000 6000-60
-40
-20
0
20
40
60
Time (Sec)
Cou
nts
Sunset ThermalSnap Sunrise Thermal
Snap
Fig. 7a Roll rate gyro counts.
0 1000 2000 3000 4000 5000 6000-4
-2
0
2
4
6
8
10
12
14
Time (Sec)
Cou
nts
Sunset ThermalSnap
Sunrise ThermalSnap
Fig. 7b Pitch rate gyro counts.
0 1000 2000 3000 4000 5000 6000-25
-20
-15
-10
-5
0
5
10
15
20
Time (Sec)
Cou
nts
Sunset ThermalSnap
Sunrise ThermalSnap
Fig. 7c Yaw rate gyro counts.
Fig. 7 UARS attitude rate during first orbit on January 28, 1997.
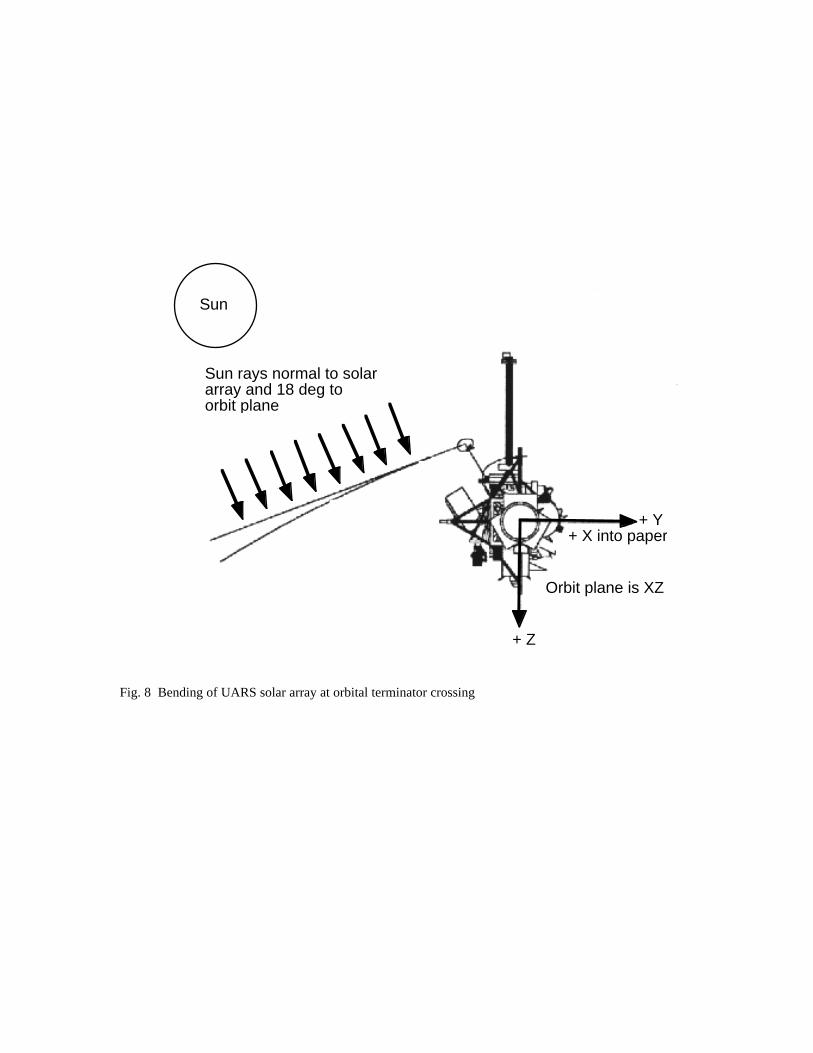
Sun
+ Y+ X into paper
+ Z
Orbit plane is XZ
Sun rays normal to solararray and 18 deg to orbit plane
Fig. 8 Bending of UARS solar array at orbital terminator crossing

71
0 1000 2000 3000 4000 5000 6000-350
-300
-250
-200
-150
-100
-50
0
50
100
Time (Sec)
Dis
plac
emen
t (A
rcse
c)
Sunset ThermalSnap
Sunrise ThermalSnap
Fig. 9a Roll attitude.
0 1000 2000 3000 4000 5000 60000
1000
2000
3000
4000
5000
6000
7000
8000
Time (Sec)
Dis
plac
emen
t (A
rcse
c)
Fig. 9b Pitch attitude.
1000 2000 3000 4000 5000 6000
-700
-600
-500
-400
-300
-200
-100
0
100
Time (Sec)
Dis
plac
emen
t (A
rcse
c)
Sunset ThermalSnap
Sunrise ThermalSnap
Fig. 9c Yaw attitude.
Fig. 9 UARS attitude during first orbit on January 28, 1997.
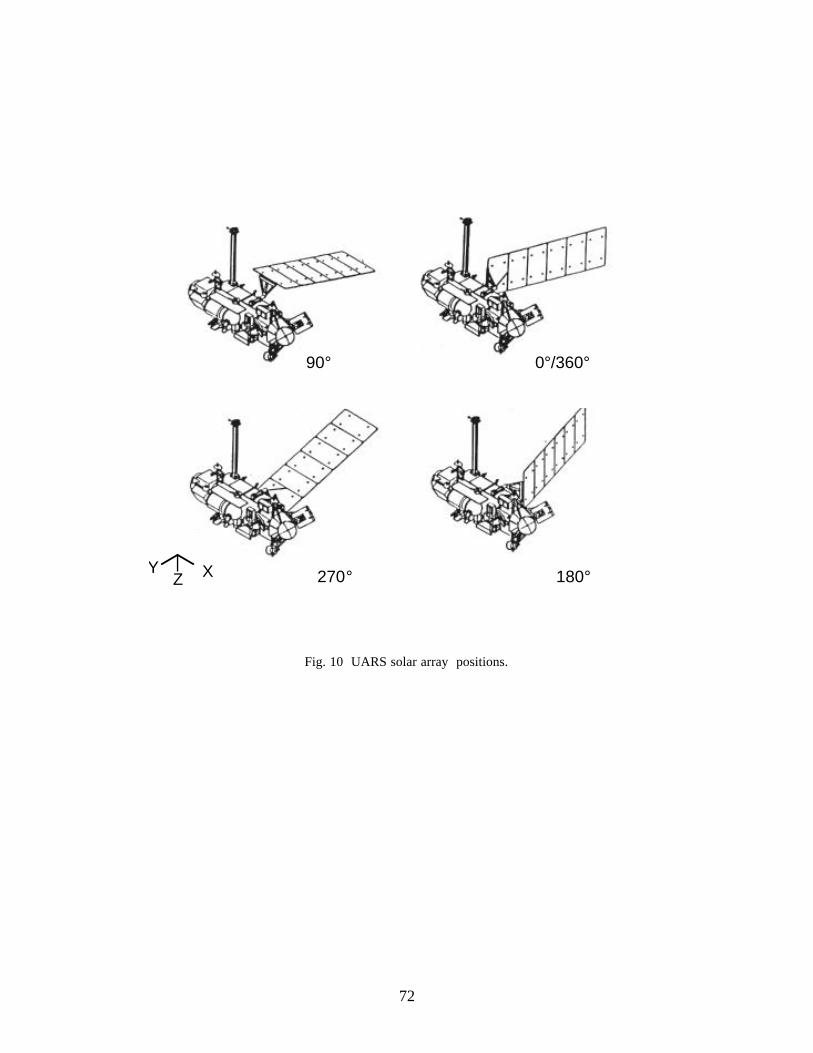
72
YZ X
90° 0°/360°
270° 180°
Fig. 10 UARS solar array positions.
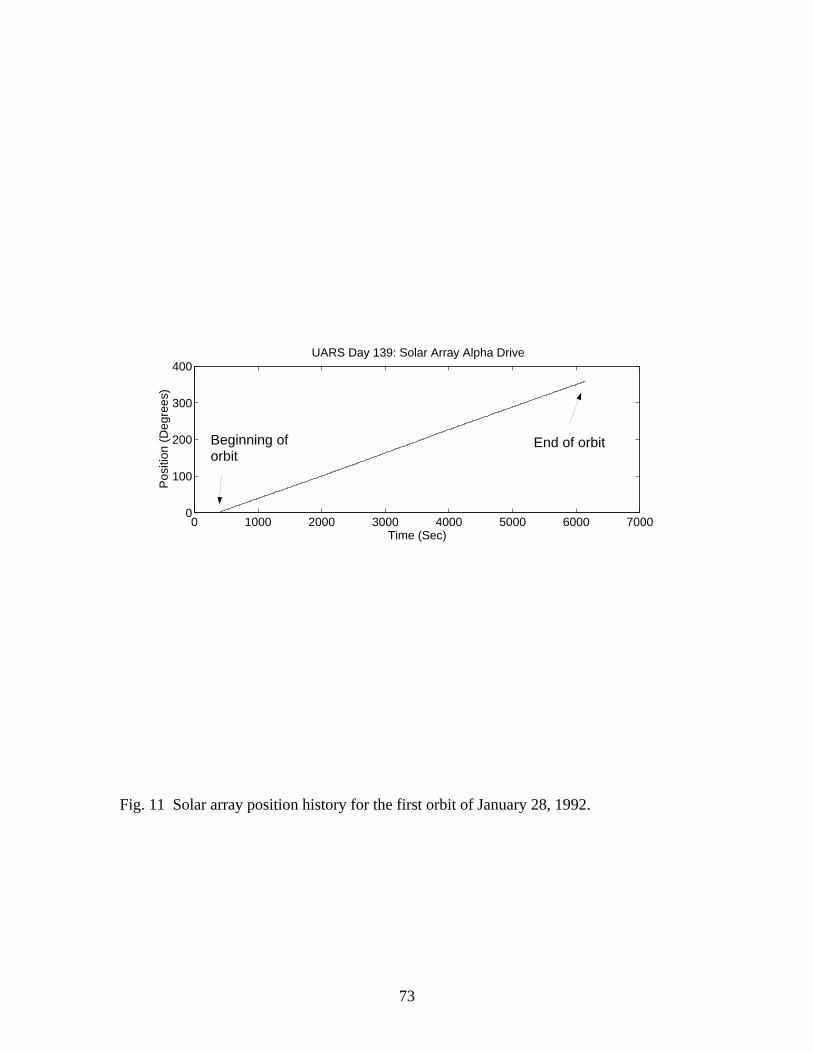
73
0 1000 2000 3000 4000 5000 6000 70000
100
200
300
400
Time (Sec)
Pos
ition
(D
egre
es)
UARS Day 139: Solar Array Alpha Drive
Beginning oforbit
End of orbit
Fig. 11 Solar array position history for the first orbit of January 28, 1992.
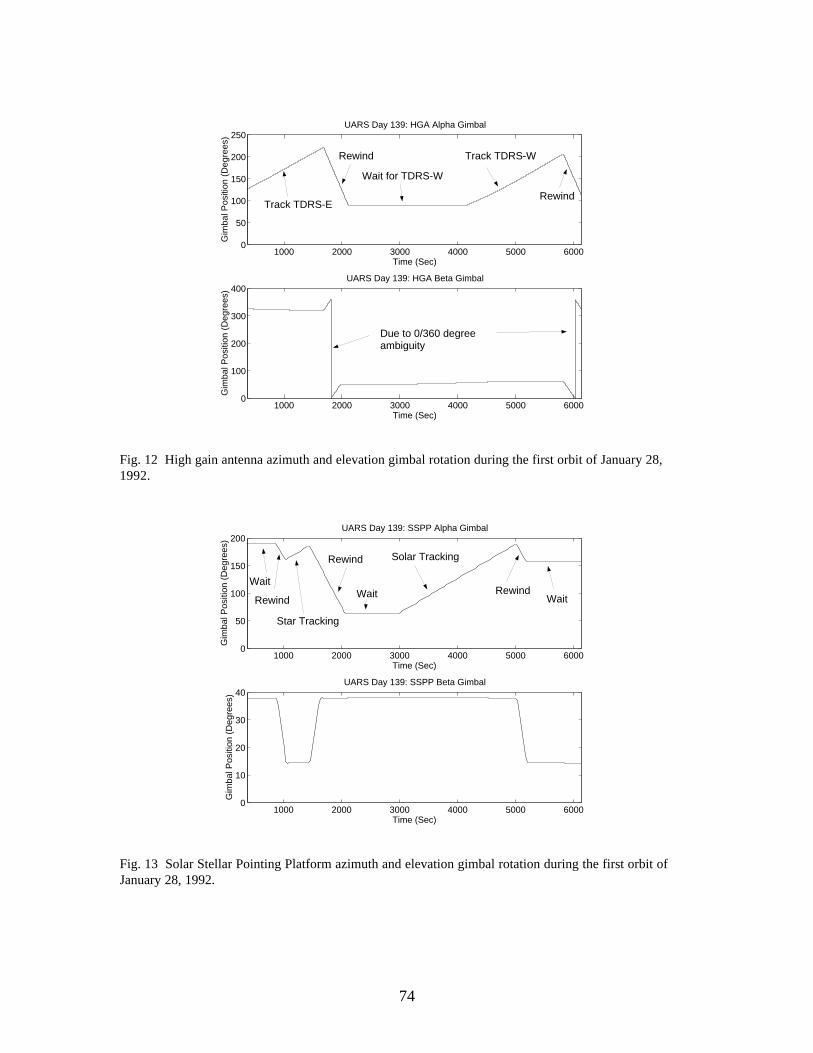
74
1000 2000 3000 4000 5000 60000
50
100
150
200
250
Time (Sec)
Gim
bal P
ositi
on (
Deg
rees
)
UARS Day 139: HGA Alpha Gimbal
1000 2000 3000 4000 5000 60000
100
200
300
400
Time (Sec)
Gim
bal P
ositi
on (
Deg
rees
)
UARS Day 139: HGA Beta Gimbal
Track TDRS-E
Wait for TDRS-W
Rewind Track TDRS-W
Rewind
Due to 0/360 degree ambiguity
Fig. 12 High gain antenna azimuth and elevation gimbal rotation during the first orbit of January 28,1992.
1000 2000 3000 4000 5000 60000
50
100
150
200
Time (Sec)
Gim
bal P
ositi
on (
Deg
rees
)
UARS Day 139: SSPP Alpha Gimbal
1000 2000 3000 4000 5000 60000
10
20
30
40
Time (Sec)
Gim
bal P
ositi
on (
Deg
rees
)
UARS Day 139: SSPP Beta Gimbal
Wait
Rewind
Star Tracking
Rewind
Wait
Solar Tracking
RewindWait
Fig. 13 Solar Stellar Pointing Platform azimuth and elevation gimbal rotation during the first orbit ofJanuary 28, 1992.
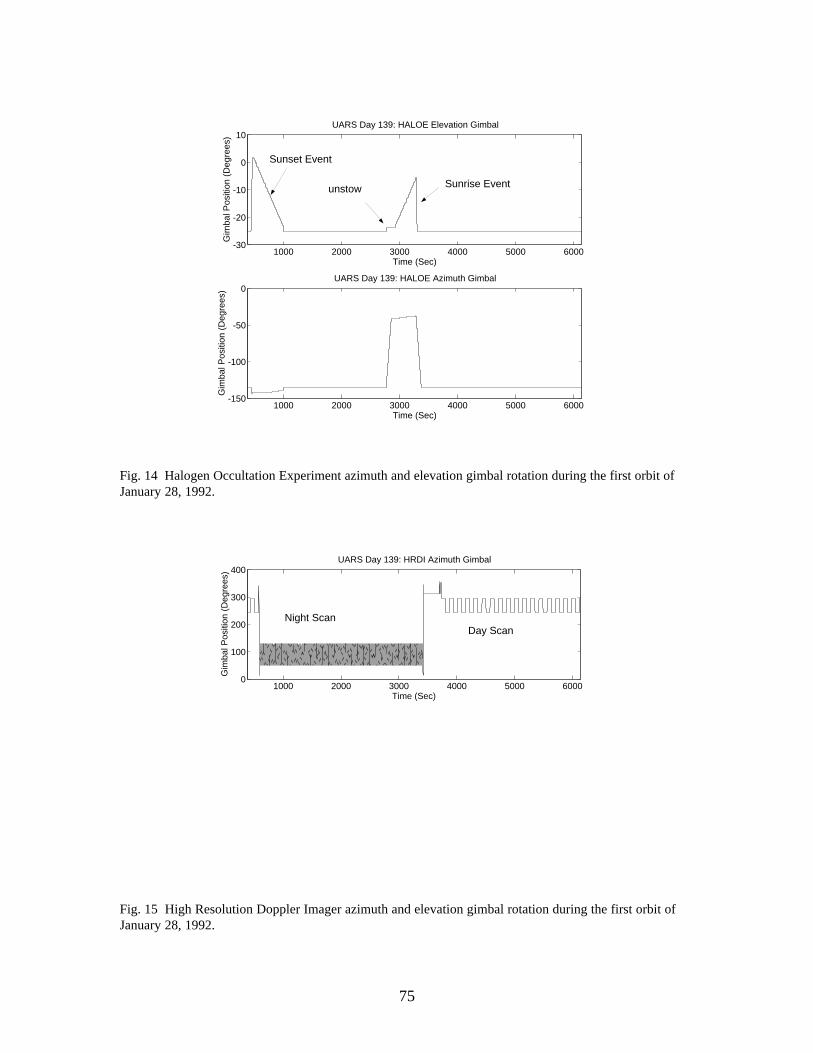
75
1000 2000 3000 4000 5000 6000-30
-20
-10
0
10
Time (Sec)
Gim
bal P
ositi
on (
Deg
rees
)
UARS Day 139: HALOE Elevation Gimbal
1000 2000 3000 4000 5000 6000-150
-100
-50
0
Time (Sec)
Gim
bal P
ositi
on (
Deg
rees
)
UARS Day 139: HALOE Azimuth Gimbal
Sunset Event
Sunrise Eventunstow
Fig. 14 Halogen Occultation Experiment azimuth and elevation gimbal rotation during the first orbit ofJanuary 28, 1992.
1000 2000 3000 4000 5000 60000
100
200
300
400
Time (Sec)
Gim
bal P
ositi
on (
Deg
rees
)
UARS Day 139: HRDI Azimuth Gimbal
Night ScanDay Scan
Fig. 15 High Resolution Doppler Imager azimuth and elevation gimbal rotation during the first orbit ofJanuary 28, 1992.
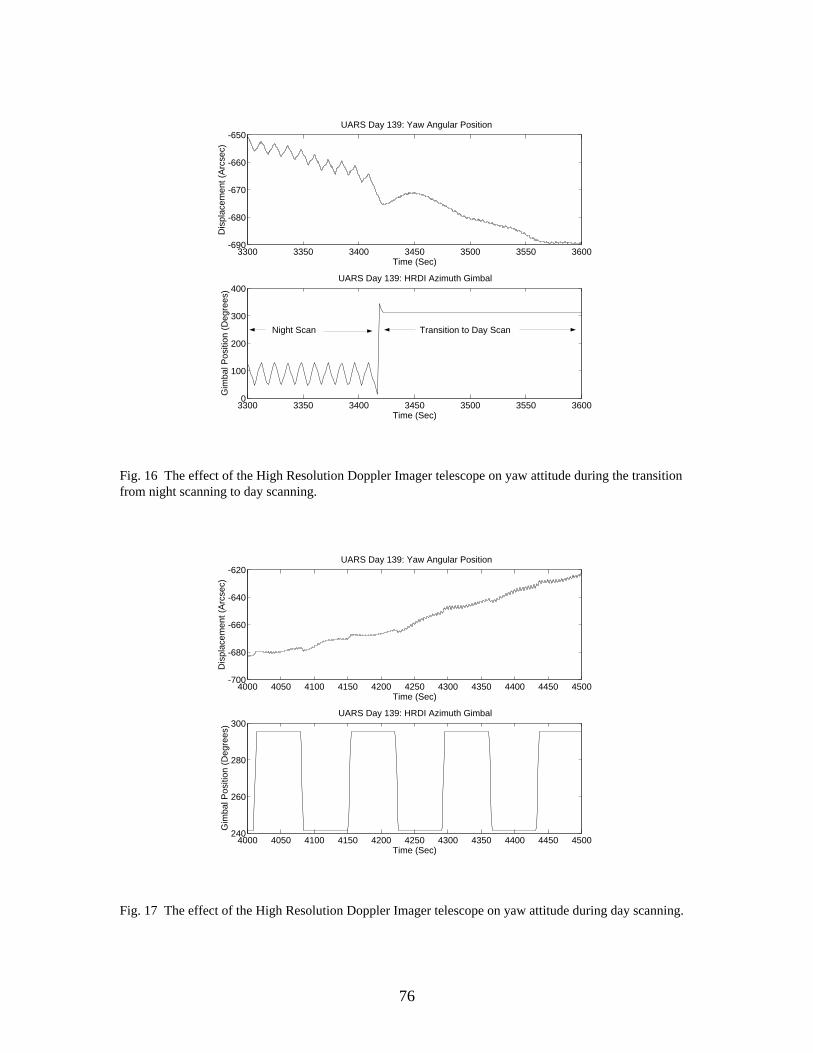
76
3300 3350 3400 3450 3500 3550 36000
100
200
300
400
Time (Sec)
Gim
bal P
ositi
on (
Deg
rees
)
UARS Day 139: HRDI Azimuth Gimbal
3300 3350 3400 3450 3500 3550 3600-690
-680
-670
-660
-650
Time (Sec)
Dis
plac
emen
t (A
rcse
c)
UARS Day 139: Yaw Angular Position
Night Scan Transition to Day Scan
Fig. 16 The effect of the High Resolution Doppler Imager telescope on yaw attitude during the transitionfrom night scanning to day scanning.
4000 4050 4100 4150 4200 4250 4300 4350 4400 4450 4500-700
-680
-660
-640
-620
Time (Sec)
Dis
plac
emen
t (A
rcse
c)
UARS Day 139: Yaw Angular Position
4000 4050 4100 4150 4200 4250 4300 4350 4400 4450 4500240
260
280
300
Time (Sec)
Gim
bal P
ositi
on (
Deg
rees
)
UARS Day 139: HRDI Azimuth Gimbal
Fig. 17 The effect of the High Resolution Doppler Imager telescope on yaw attitude during day scanning.
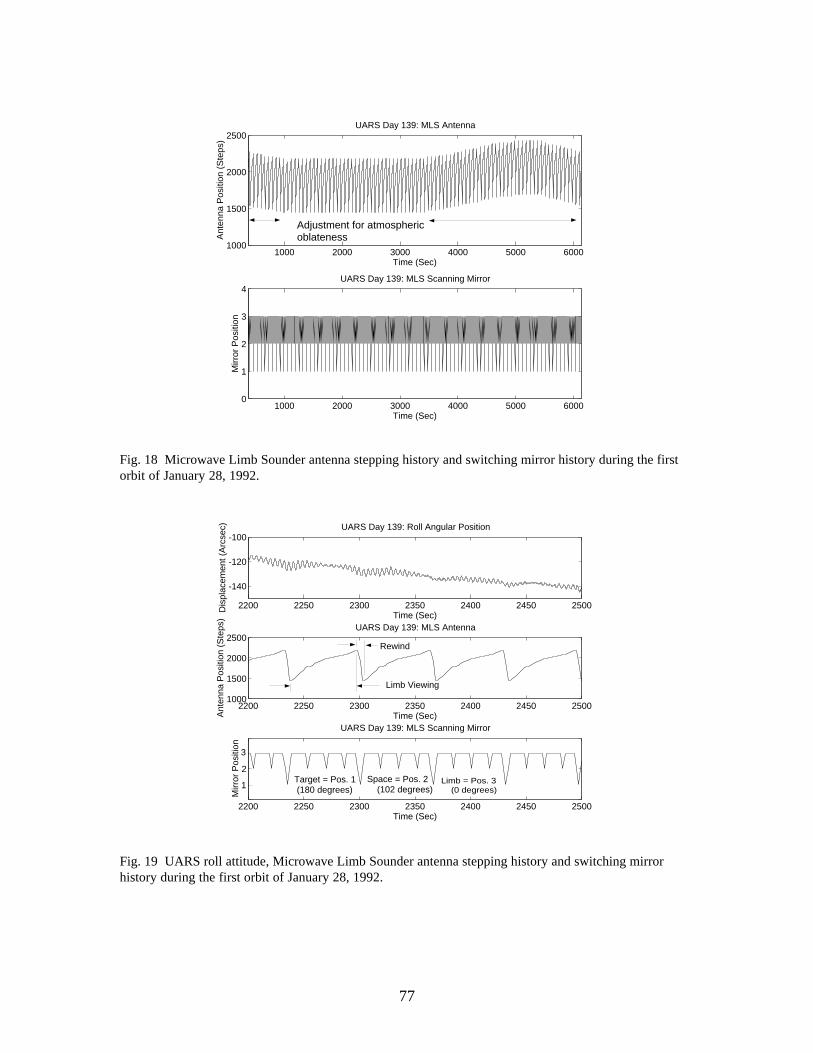
77
1000 2000 3000 4000 5000 60001000
1500
2000
2500
Time (Sec)
Ant
enna
Pos
ition
(S
teps
)
UARS Day 139: MLS Antenna
1000 2000 3000 4000 5000 60000
1
2
3
4
Time (Sec)
Mirr
or P
ositi
on
UARS Day 139: MLS Scanning Mirror
Adjustment for atmosphericoblateness
Fig. 18 Microwave Limb Sounder antenna stepping history and switching mirror history during the firstorbit of January 28, 1992.
2200 2250 2300 2350 2400 2450 25001000
1500
2000
2500
Time (Sec)Ant
enna
Pos
ition
(S
teps
)
UARS Day 139: MLS Antenna
2200 2250 2300 2350 2400 2450 2500
2
Time (Sec)
Mirr
or P
ositi
on
UARS Day 139: MLS Scanning Mirror
2200 2250 2300 2350 2400 2450 2500
-140
-120
-100
Time (Sec)
Dis
plac
emen
t (A
rcse
c) UARS Day 139: Roll Angular Position
Rewind
Limb Viewing
Limb = Pos. 3 (0 degrees)
Space = Pos. 2 (102 degrees)
Target = Pos. 1 (180 degrees)
3
1
Fig. 19 UARS roll attitude, Microwave Limb Sounder antenna stepping history and switching mirrorhistory during the first orbit of January 28, 1992.
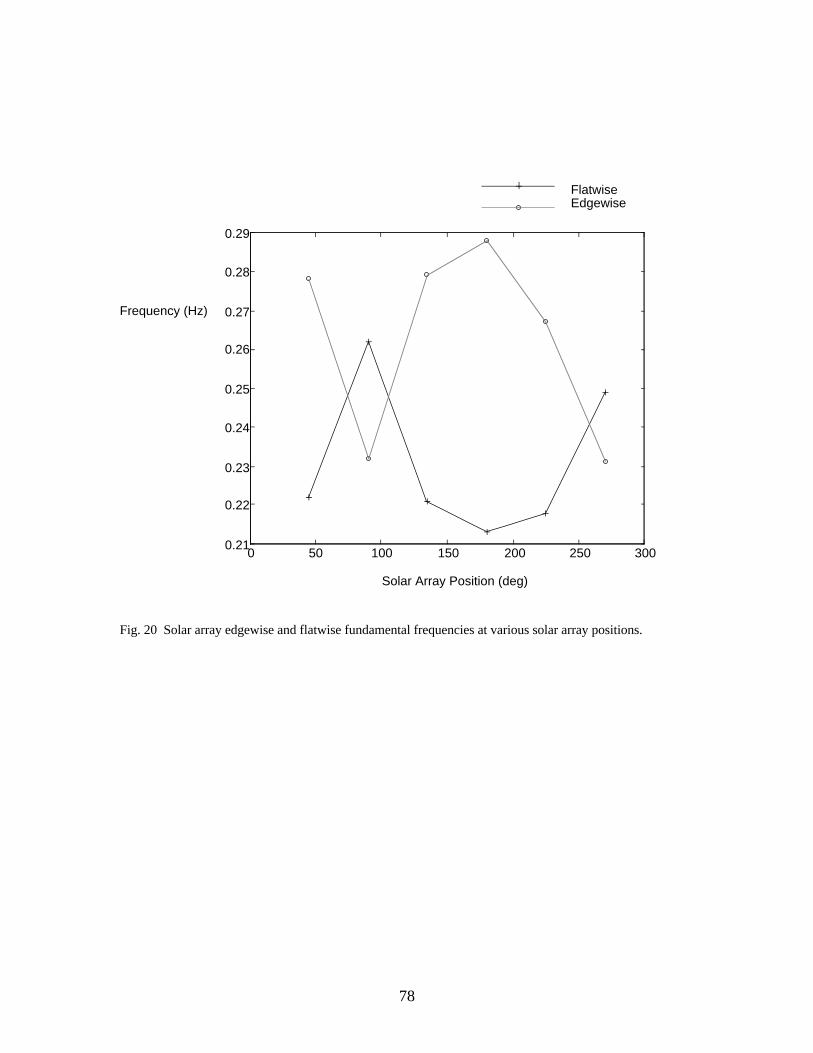
78
0 50 100 150 200 250 3000.21
0.22
0.23
0.24
0.25
0.26
0.27
0.28
0.29
Frequency (Hz)
Solar Array Position (deg)
FlatwiseEdgewise
Fig. 20 Solar array edgewise and flatwise fundamental frequencies at various solar array positions.
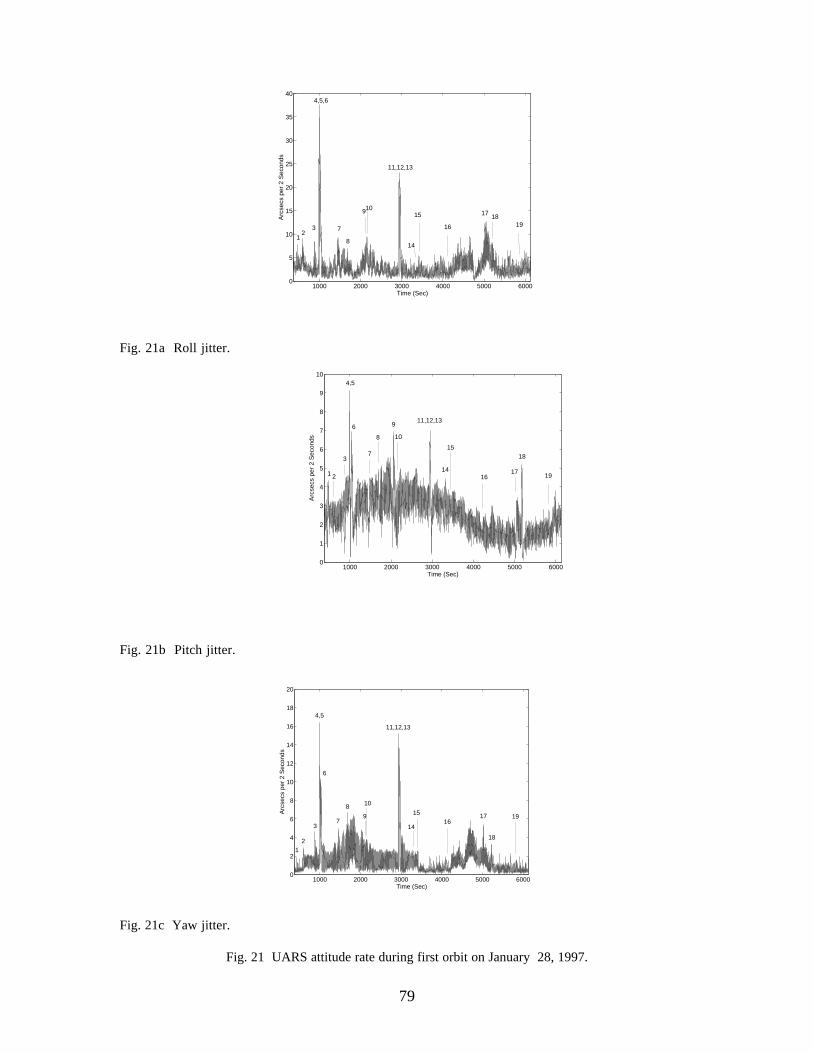
79
1000 2000 3000 4000 5000 60000
5
10
15
20
25
30
35
40
Time (Sec)
Arc
secs
per
2 S
econ
ds
12
3 7
4,5,6
8
910
11,12,13
14
15
16
17 1819
Fig. 21a Roll jitter.
1000 2000 3000 4000 5000 60000
1
2
3
4
5
6
7
8
9
10
Time (Sec)
Arc
secs
per
2 S
econ
ds
1 2
3
6
7
8
9
10
11,12,13
14
15
1617
18
19
4,5
Fig. 21b Pitch jitter.
1000 2000 3000 4000 5000 60000
2
4
6
8
10
12
14
16
18
20
Time (Sec)
Arc
secs
per
2 S
econ
ds
12
3
4,5
6
7
8
9
10
11,12,13
14
1516
17
18
19
Fig. 21c Yaw jitter.
Fig. 21 UARS attitude rate during first orbit on January 28, 1997.
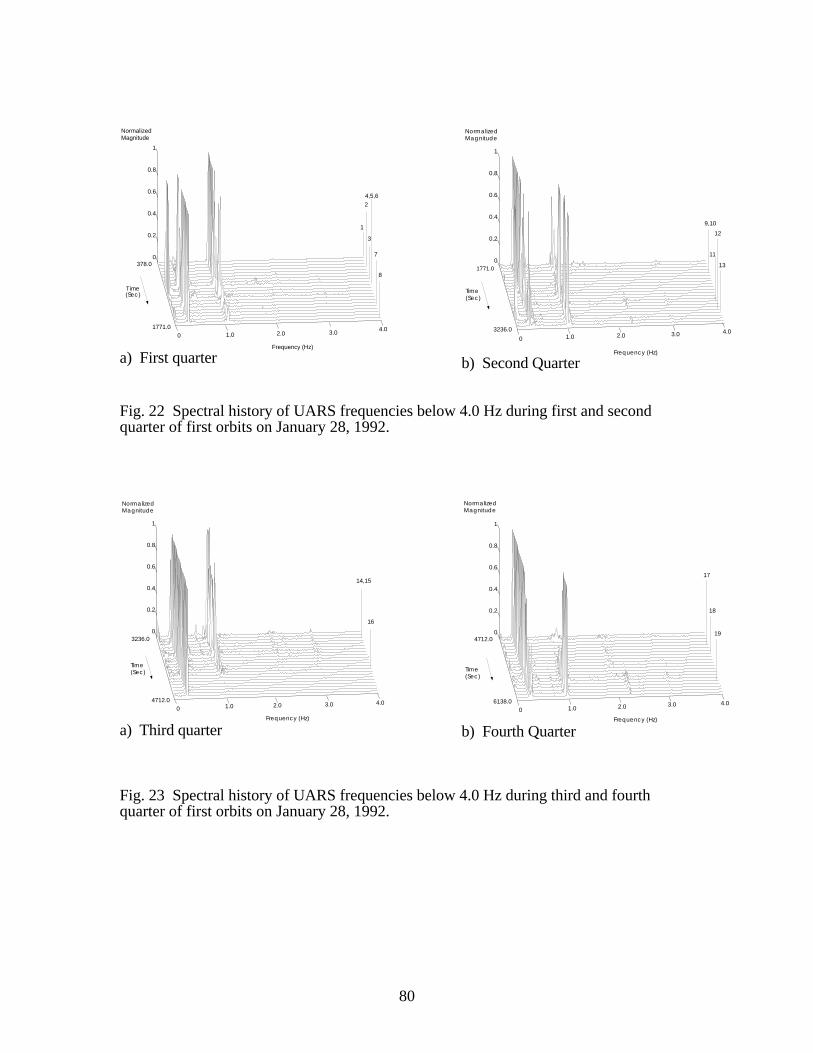
80
0
0
0.2
0.4
0.6
0.8
1
1.0 2.0 3.0
Frequency (Hz)
4.0
NormalizedMagnitude
Time
378.0
(Sec)
1771.0
1
2
3
4,5,6
7
8
a) First quarter0
0
0.2
0.4
0.6
0.8
1
3236.0
1771.0
4.01.0 2.0 3.0
Frequency (Hz)
Time(Sec)
NormalizedMagnitude
9,10
11
12
13
b) Second Quarter
Fig. 22 Spectral history of UARS frequencies below 4.0 Hz during first and secondquarter of first orbits on January 28, 1992.
0
0
0.2
0.4
0.6
0.8
1
1.0 2.0 3.0 4.0
Frequency (Hz)
NormalizedMagnitude
3236.0
4712.0
Time(Sec)
14,15
16
a) Third quarter
0
0
0.2
0.4
0.6
0.8
1
1.0 2.0 3.0 4.0
Frequency (Hz)
4712.0
6138.0
Time(Sec)
17
18
19
NormalizedMagnitude
b) Fourth Quarter
Fig. 23 Spectral history of UARS frequencies below 4.0 Hz during third and fourthquarter of first orbits on January 28, 1992.
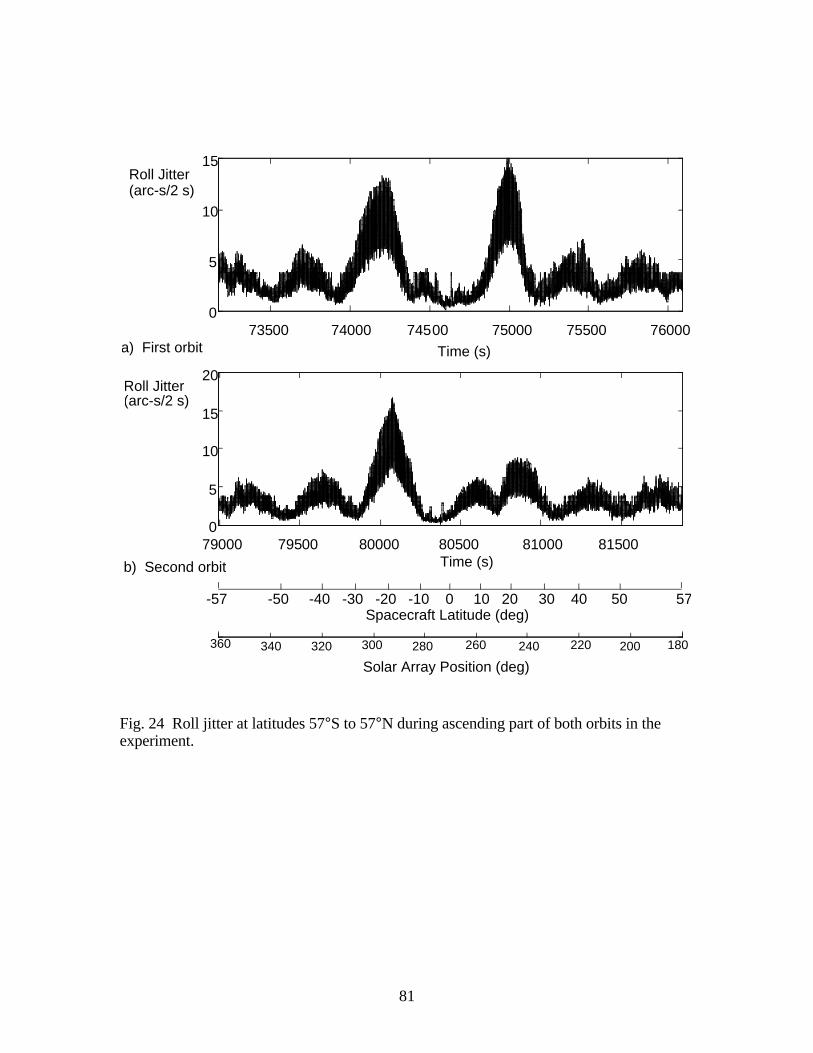
81
79000 79500 80000 80500 81000 815000
5
10
15
20
73500 74000 74500 75000 75500 760000
5
10
15
Time (s)
Time (s)
Roll Jitter(arc-s/2 s)
Roll Jitter(arc-s/2 s)
a)
b)
Spacecraft Latitude (deg)
180200220240260280300320340360
Solar Array Position (deg)
-57 -50 -40 -30 -20 -10 0 10 20 30 40 50 57
b) Second orbit
a) First orbit
Fig. 24 Roll jitter at latitudes 57°S to 57°N during ascending part of both orbits in theexperiment.
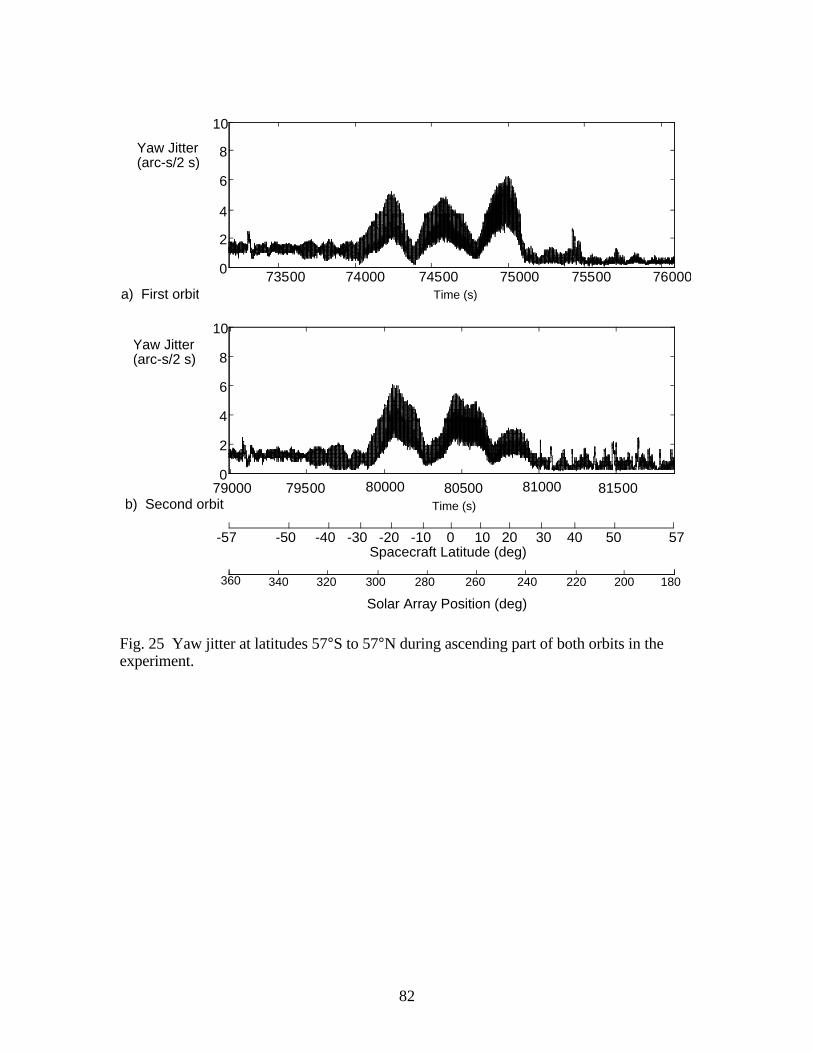
82
79000 79500 80000 80500 81000 815000
2
4
6
8
10
73500 74000 74500 75000 75500 760000
2
4
6
8
10
Spacecraft Latitude (deg)
180200220240260280300320340360
Solar Array Position (deg)
-57 -50 -40 -30 -20 -10 0 10 20 30 40 50 57
Time (s)
Time (s)
Yaw Jitter(arc-s/2 s)
Yaw Jitter(arc-s/2 s)
a)
b)
a) First orbit
b) Second orbit
Fig. 25 Yaw jitter at latitudes 57°S to 57°N during ascending part of both orbits in theexperiment.
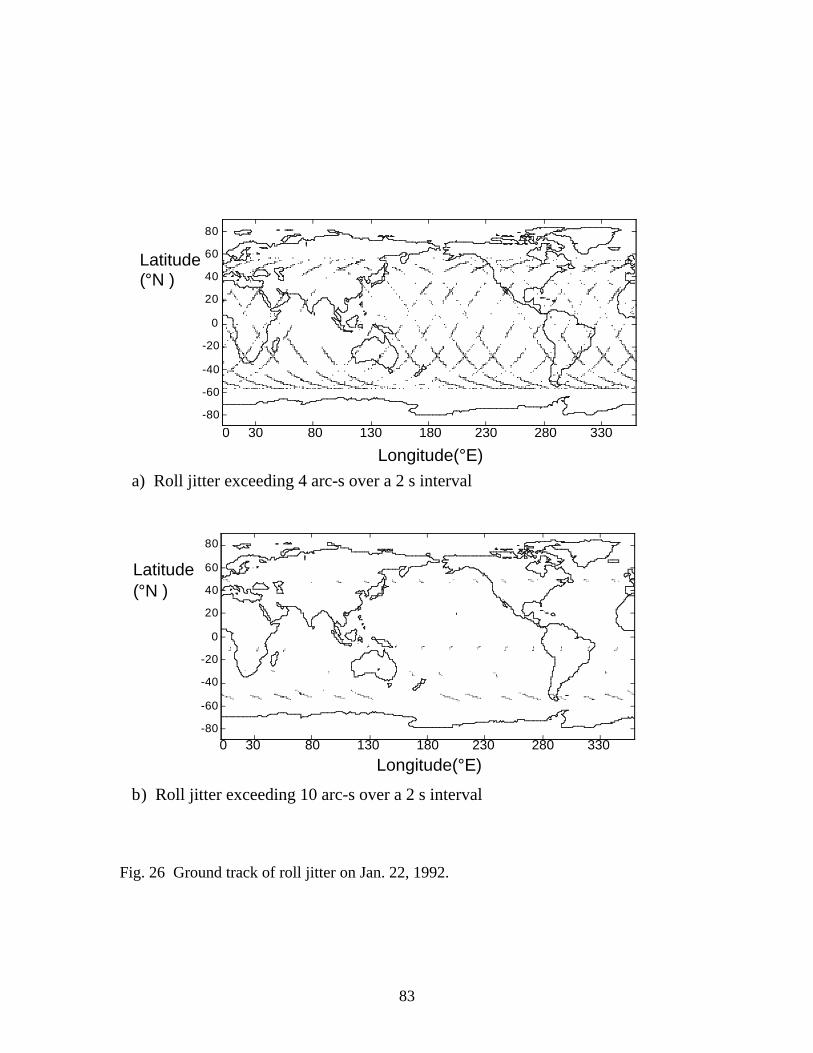
83
-150 -100 -50 0 50 100 150
-80
-60
-40
-20
0
20
40
60
80
-150 -100 -50 0 50 100 150
-80
-60
-40
-20
0
20
40
60
80
Longitude (deg)
Longitude (deg)
a) Roll jitter exceeding 4 arc-s over a 2 s interval
b) Roll jitter exceeding 10 arc-s over a 2 s interval
Latitude(deg)
Latitude(deg)Latitude (°N )
Longitude(°E)
Longitude(°E)
Latitude (°N )
0 30 80 130 180 230 280 330
0 30 80 130 180 230 280 330
0 30 80 130 180 230 280 330
Fig. 26 Ground track of roll jitter on Jan. 22, 1992.
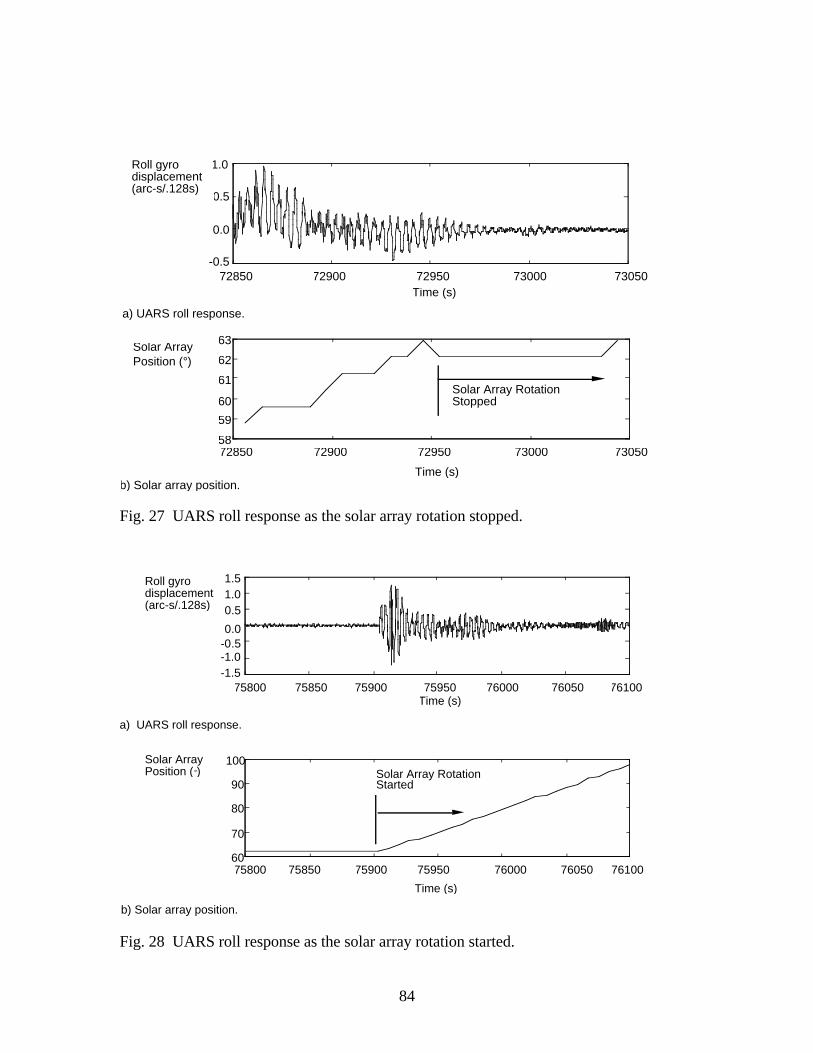
84
72850 72900 72950 73000 73050-0.5
0.0
0.5
1.0
Time (s)
72850 72900 72950 73000 7305058
59
60
61
62
63
Time (s)
Solar ArrayPosition (°)
Solar Array RotationStopped
a) UARS roll response.
b) Solar array position.
Roll gyro displacement (arc-s/.128s)
Fig. 27 UARS roll response as the solar array rotation stopped.
75800 75850 75900 75950 76000 76050 76100
0.51.01.5
Time (s)
Roll gyro displacement (arc-s/.128s)
Solar ArrayPosition (°)
75800 75850 75900 75950 76000 76050 7610060
70
80
90
100
Time (s)
Solar Array RotationStarted
a) UARS roll response.
b) Solar array position.
0.0-0.5-1.0-1.5
Fig. 28 UARS roll response as the solar array rotation started.
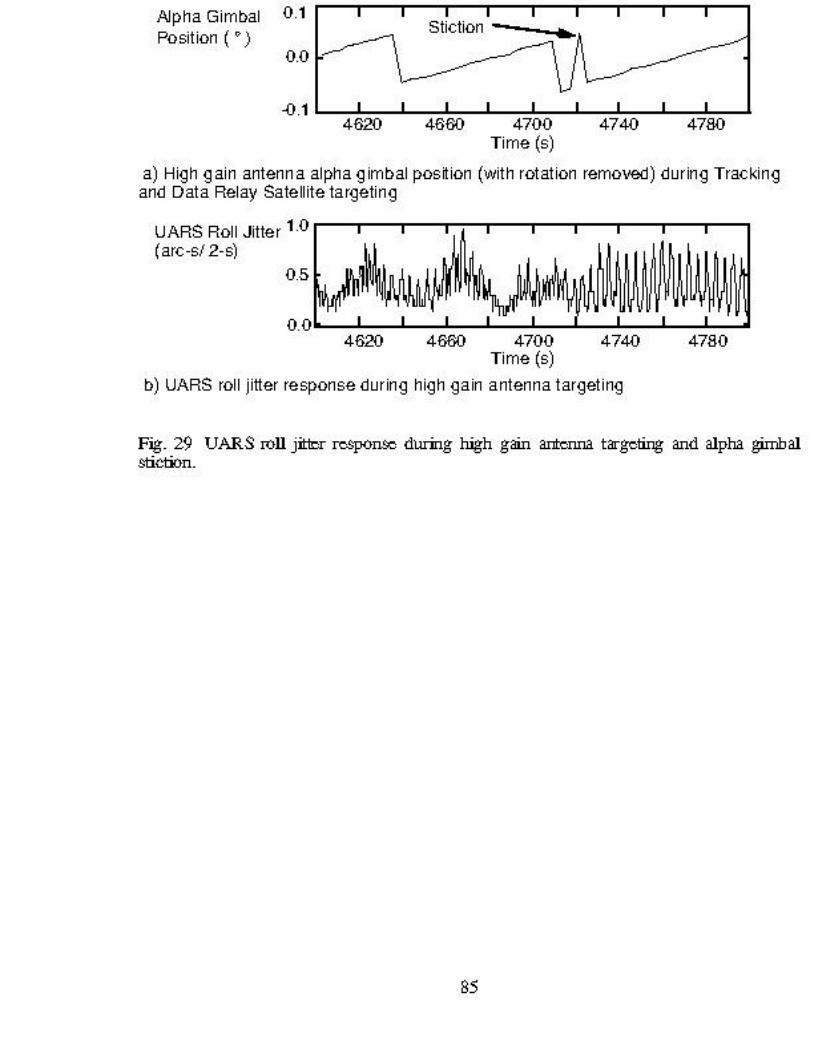
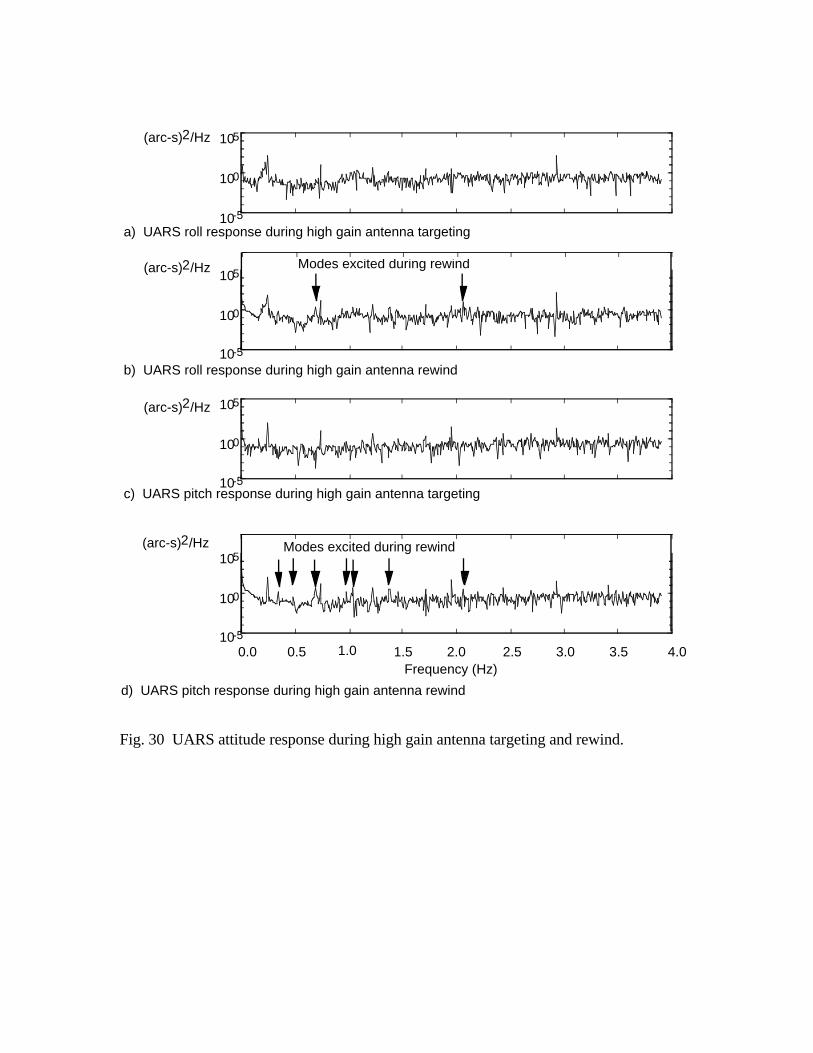
10-5
100
105
10-5
100
105
(arc-s)2/Hz
c) UARS pitch response during high gain antenna targeting
0.0 0.5 1.0 1.5 2.0 2.5 3.0 3.5 4.0Frequency (Hz)
10-5
100
105Modes excited during rewind
10-5
100
105Modes excited during rewind
b) UARS roll response during high gain antenna rewind
(arc-s)2/Hz
a) UARS roll response during high gain antenna targeting
(arc-s)2/Hz
(arc-s)2/Hz
d) UARS pitch response during high gain antenna rewind
Fig. 30 UARS attitude response during high gain antenna targeting and rewind.
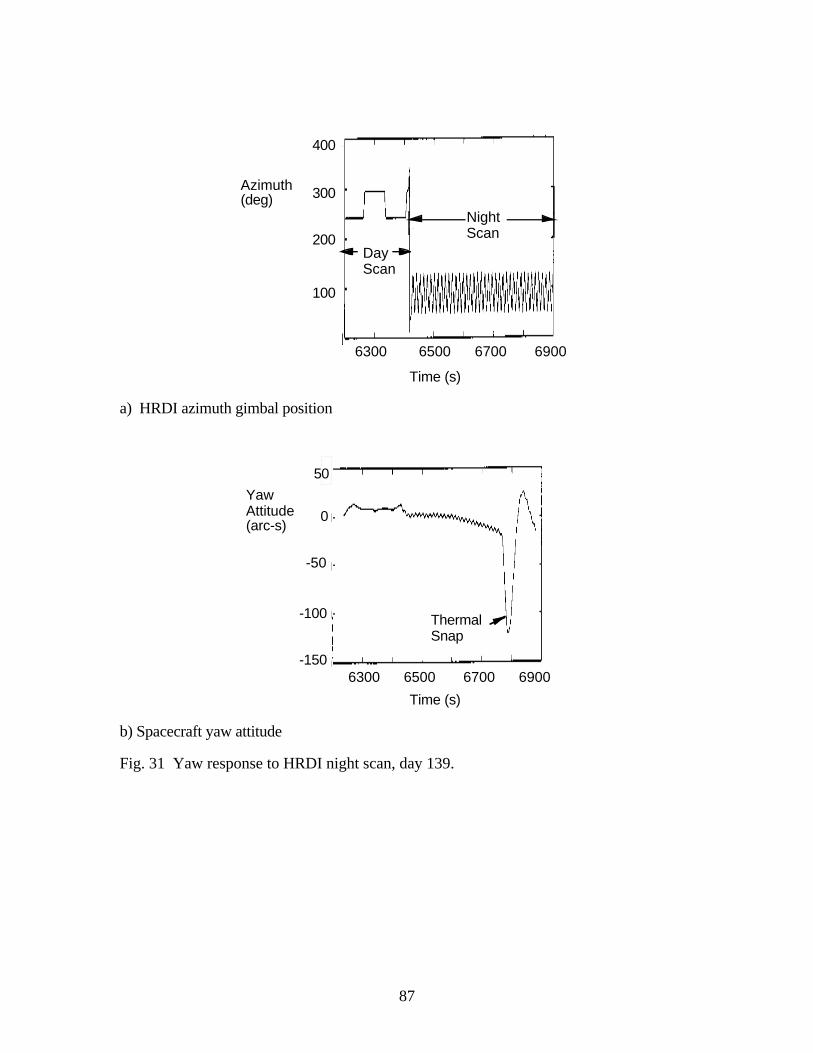
87
Time (s)
DayScan
NightScan
6300 6500 6700 6900
Azimuth(deg)
400
300
200
100
a) HRDI azimuth gimbal position
ThermalSnap
YawAttitude(arc-s)
6300 6500 6700 6900
Time (s)
50
0
-50
-100
-150
b) Spacecraft yaw attitude
Fig. 31 Yaw response to HRDI night scan, day 139.
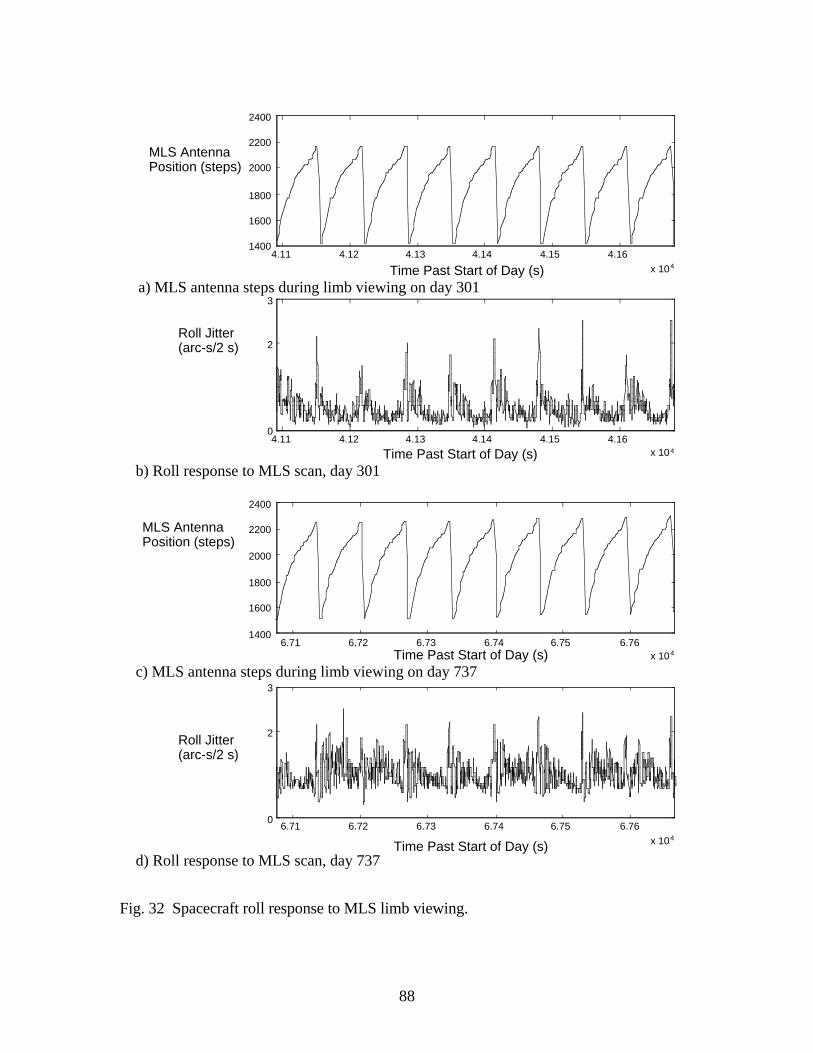
88
4.11 4.12 4.13 4.14 4.15 4.16
x 104
1400
1600
1800
2000
2200
2400
4.11 4.12 4.13 4.14 4.15 4.16x 10⁴
0
2
3
6.71 6.72 6.73 6.74 6.75 6.76x 10⁴
1400
1600
1800
2000
2200
2400
6.71 6.72 6.73 6.74 6.75 6.76
x 104
0
2
3
MLS Antenna Position (steps)
Roll Jitter(arc-s/2 s)
Roll Jitter(arc-s/2 s)
MLS Antenna Position (steps)
Time Past Start of Day (s)
Time Past Start of Day (s)
Time Past Start of Day (s)
Time Past Start of Day (s)
a) MLS antenna steps during limb viewing on day 301
c) MLS antenna steps during limb viewing on day 737
b) Roll response to MLS scan, day 301
d) Roll response to MLS scan, day 737
Fig. 32 Spacecraft roll response to MLS limb viewing.
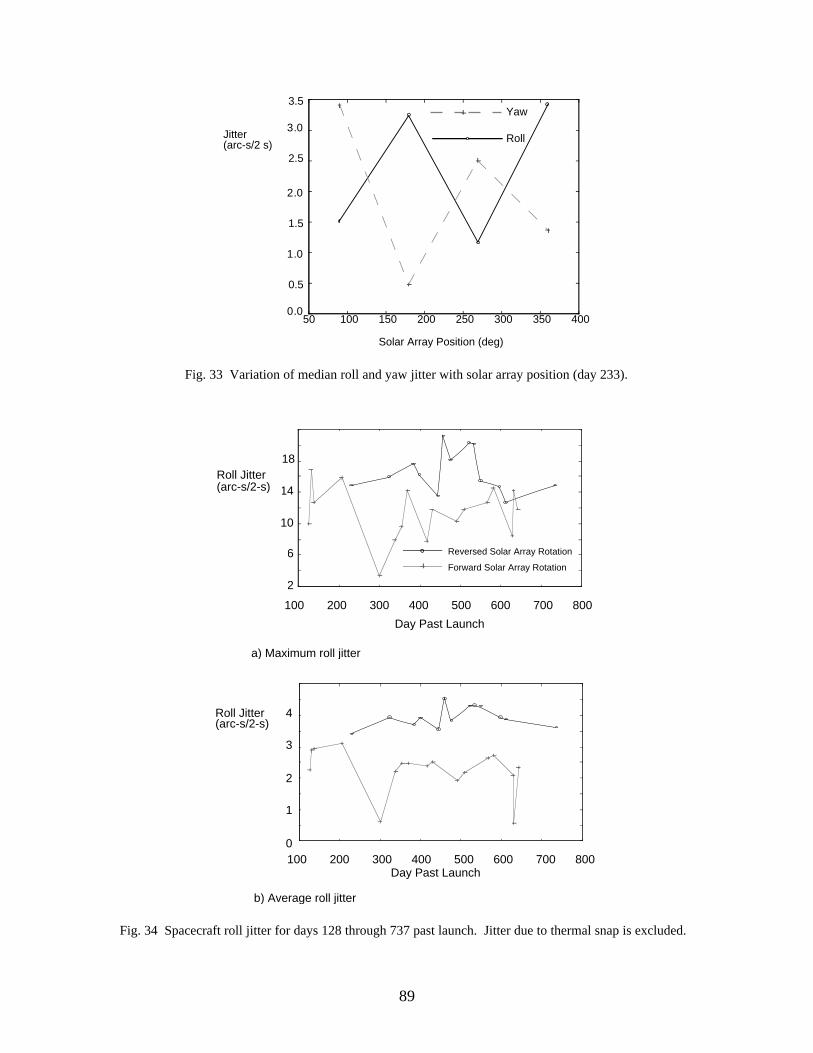
89
Jitter(arc-s/2 s)
Solar Array Position (deg)
Yaw
Roll
50 100 150 200 250 300 350 4000.0
0.5
1.0
1.5
2.0
2.5
3.0
3.5
Fig. 33 Variation of median roll and yaw jitter with solar array position (day 233).
a) Maximum roll jitter
100 200 300 400 500 600 700 800
Day Past Launch
b) Average roll jitter
100 200 300 400 500 600 700 800Day Past Launch
4
3
2
1
0
Roll Jitter(arc-s/2-s)
18
14
10
6
2
Roll Jitter(arc-s/2-s)
Reversed Solar Array Rotation
Forward Solar Array Rotation
Fig. 34 Spacecraft roll jitter for days 128 through 737 past launch. Jitter due to thermal snap is excluded.
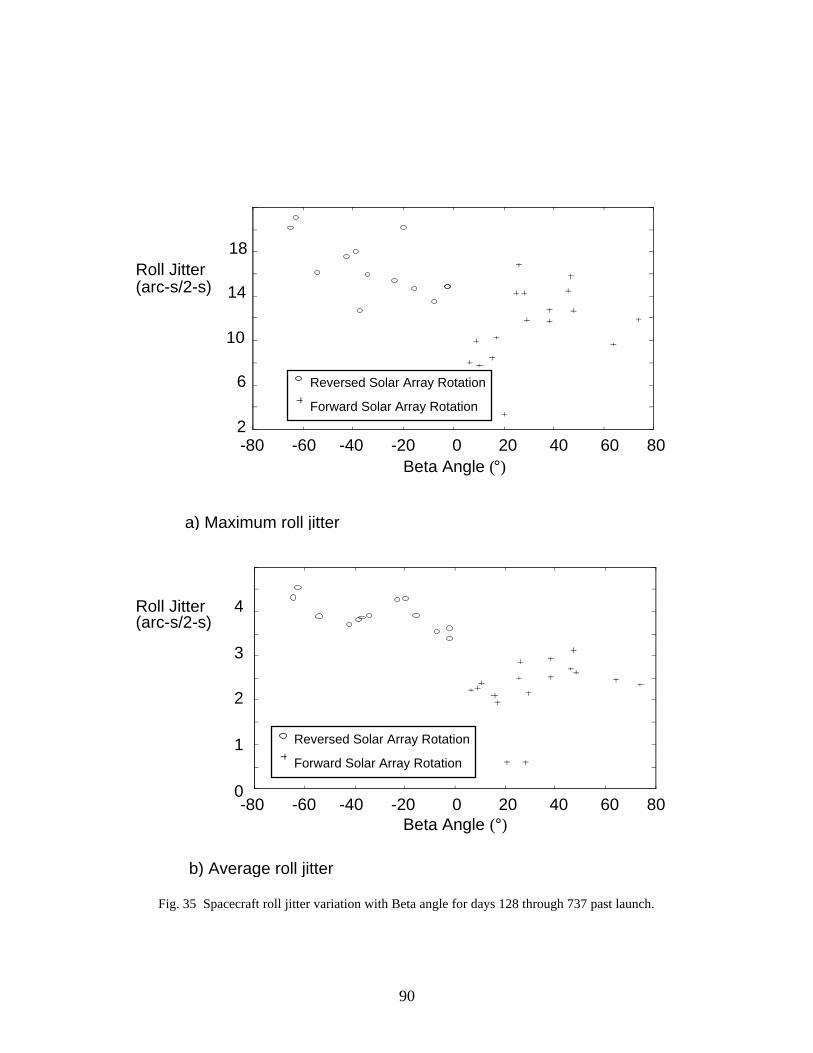
90
a) Maximum roll jitter
b) Average roll jitter
4 3 2 1 0
Roll Jitter (arc-s/2-s)
18
14
10
6
2
Roll Jitter (arc-s/2-s)
Reversed Solar Array Rotation
Forward Solar Array Rotation
-80 -60 -40 -20 0 20 40 60 80 Beta Angle (°)
Reversed Solar Array Rotation
Forward Solar Array Rotation
-80 -60 -40 -20 0 20 40 60 80 Beta Angle (°)
Fig. 35 Spacecraft roll jitter variation with Beta angle for days 128 through 737 past launch.
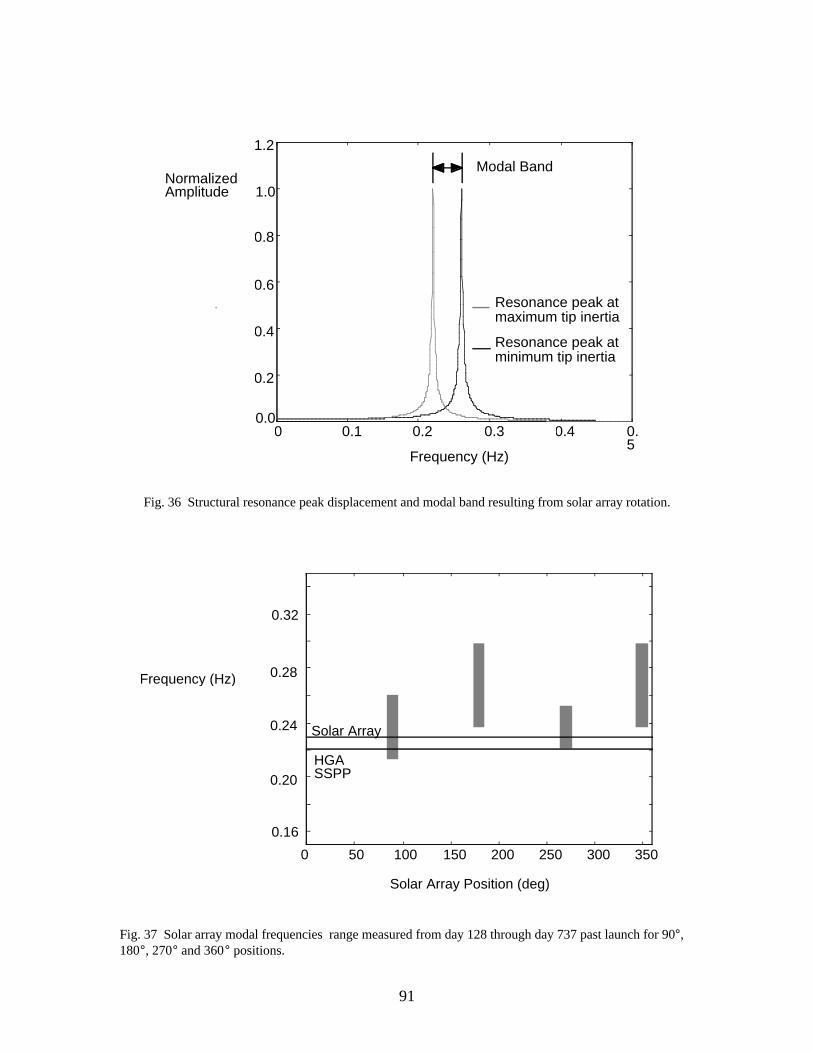
91
NormalizedAmplitude
Frequency (Hz)
Resonance peak atminimum tip inertia
Resonance peak atmaximum tip inertia
0 0.1 0.2 0.3 0.4 0.5
0.0
0.2
0.4
0.6
0.8
1.0
1.2
Modal Band
Fig. 36 Structural resonance peak displacement and modal band resulting from solar array rotation.
Frequency (Hz)
0
0.16
0.20
0.24
0.28
0.32
Solar Array Position (deg)
50 100 150 200 250 300 350
HGA SSPP
Solar Array
Fig. 37 Solar array modal frequencies range measured from day 128 through day 737 past launch for 90°,180°, 270° and 360° positions.
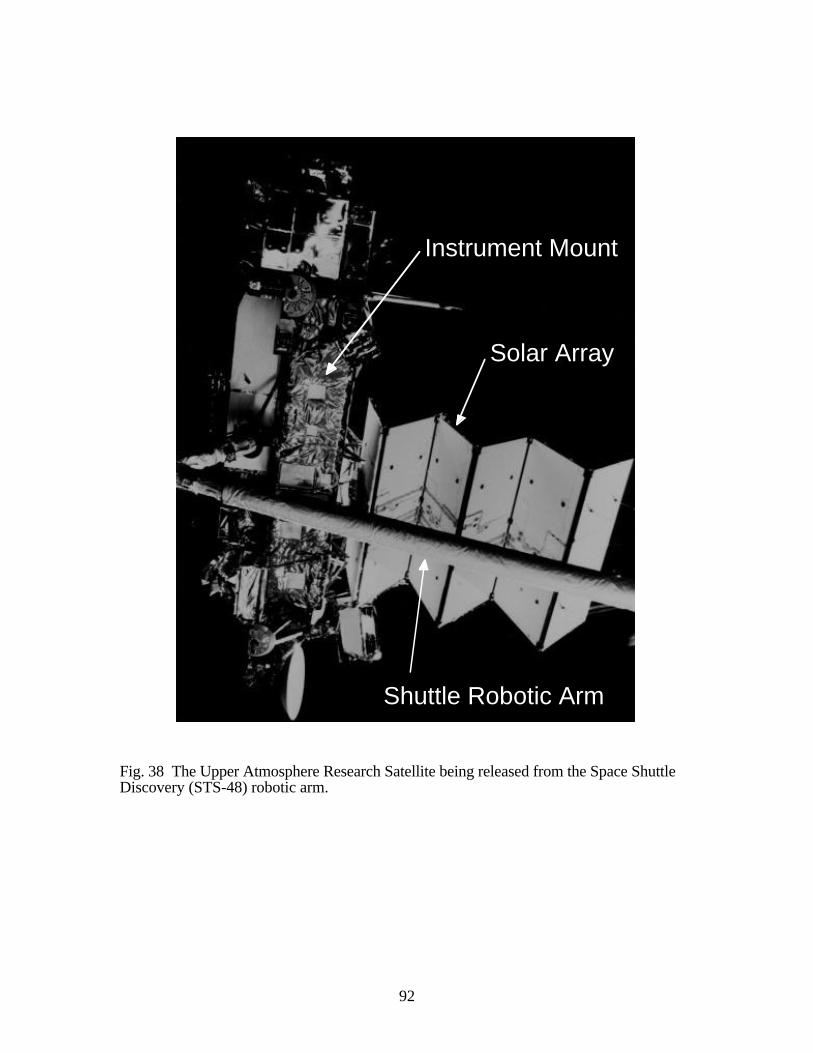
92
Solar Array
Shuttle Robotic Arm
Instrument Mount
Fig. 38 The Upper Atmosphere Research Satellite being released from the Space ShuttleDiscovery (STS-48) robotic arm.
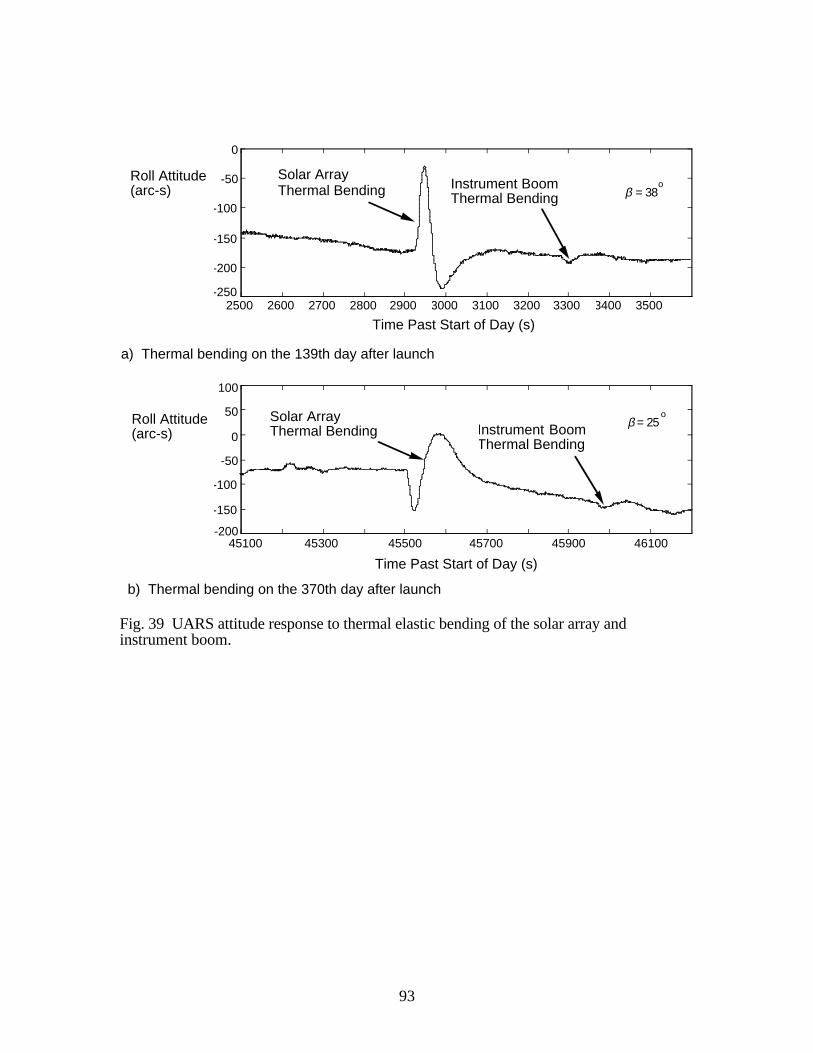
93
a) Thermal bending on the 139th day after launch
2500 2600 2700 2800 2900 3000 3100 3200 3300 3400 3500-250
-200
-150
-100
-50
0
β = 25ο
Solar ArrayThermal Bending Instrument Boom
Thermal Bending
Time Past Start of Day (s)
Roll Attitude(arc-s)
45100 45300 45500 45700 45900 46100-200
-150
-100
-50
0
50
100
β = 38ο
Solar ArrayThermal Bending
Time Past Start of Day (s)
Roll Attitude(arc-s)
b) Thermal bending on the 370th day after launch
Instrument Boom Thermal Bending
Fig. 39 UARS attitude response to thermal elastic bending of the solar array andinstrument boom.
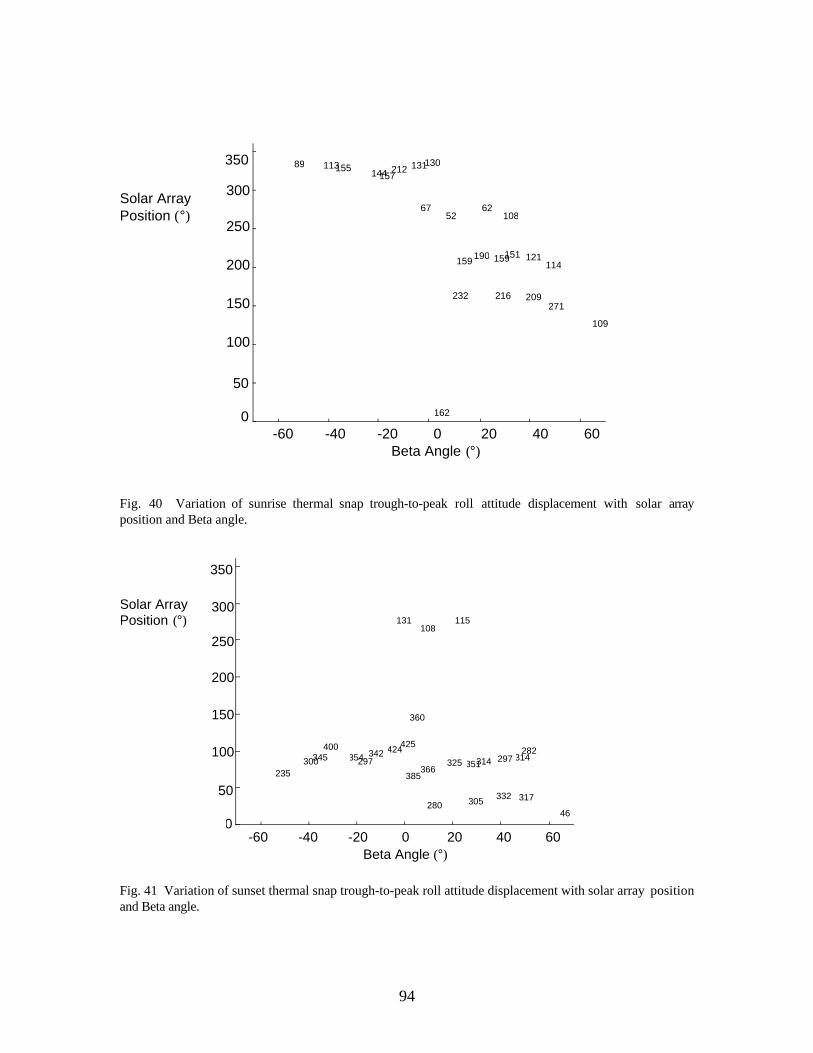
94
114
232 216 209 271
162
52 62 67
109
159
113 89
159 121
131
190 151
157 144 212 155
108
130
-60 -40 -20 0 20 40 60 Beta Angle (°)
Solar Array Position (°)
0
50
100
150
200
250
300
350
Fig. 40 Variation of sunrise thermal snap trough-to-peak roll attitude displacement with solar arrayposition and Beta angle.
0
50
100
150
200
250
300
350
280 305 332 317
360
108 115
385
131
366
46
351 300 235
297 424
345 325 314 297 354
282 314 342
425 400
Solar Array Position (°)
-60 -40 -20 0 20 40 60 Beta Angle (°)
Fig. 41 Variation of sunset thermal snap trough-to-peak roll attitude displacement with solar array positionand Beta angle.
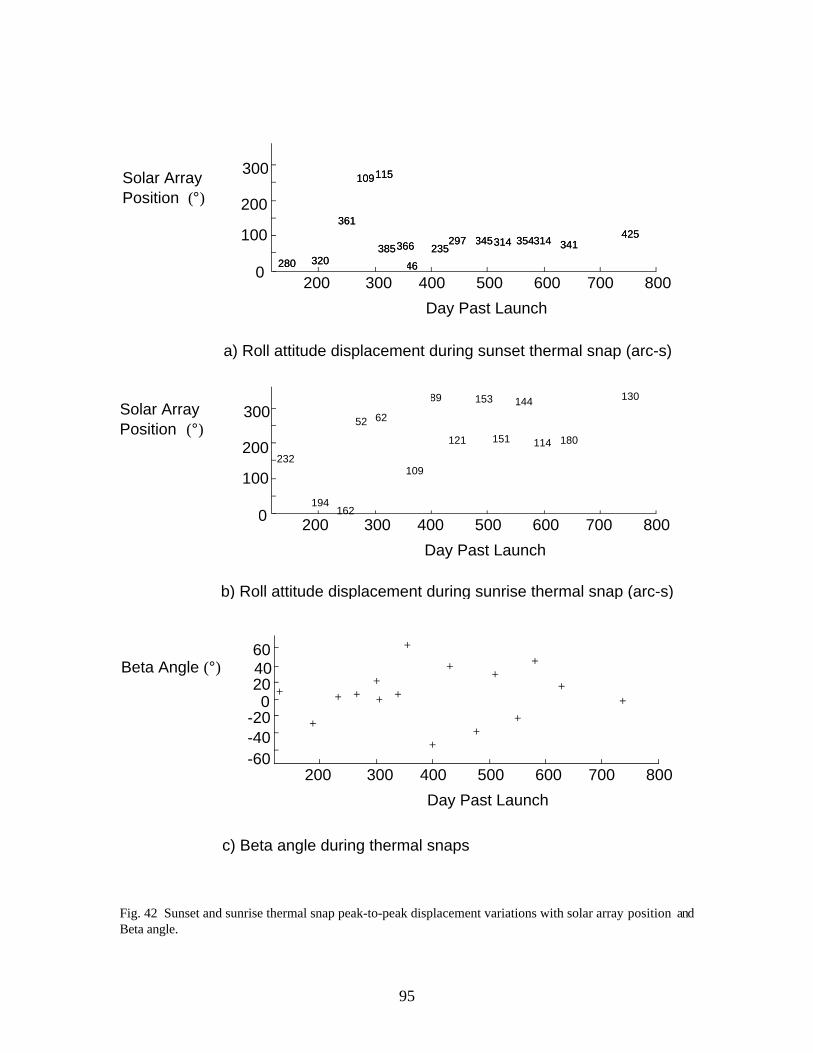
95
0
100
200
300
280 320
361
109 115
385 366
46
235 297 345 314 354 314 341
425
280 320
361
109 115
385 366
46
235 297 345 314 354 314 341
425
232
194 162
52 62
109
89
121
153
151
144
114 180
130
-60 -40 -20
0 20 40 60
0
100
200
300
200 300 400 500 600 700 800
Day Past Launch
200 300 400 500 600 700 800
Day Past Launch
200 300 400 500 600 700 800
Day Past Launch
a) Roll attitude displacement during sunset thermal snap (arc-s)
b) Roll attitude displacement during sunrise thermal snap (arc-s)
c) Beta angle during thermal snaps
Solar Array Position (°)
Solar Array Position (°)
Beta Angle (°)
Fig. 42 Sunset and sunrise thermal snap peak-to-peak displacement variations with solar array position andBeta angle.
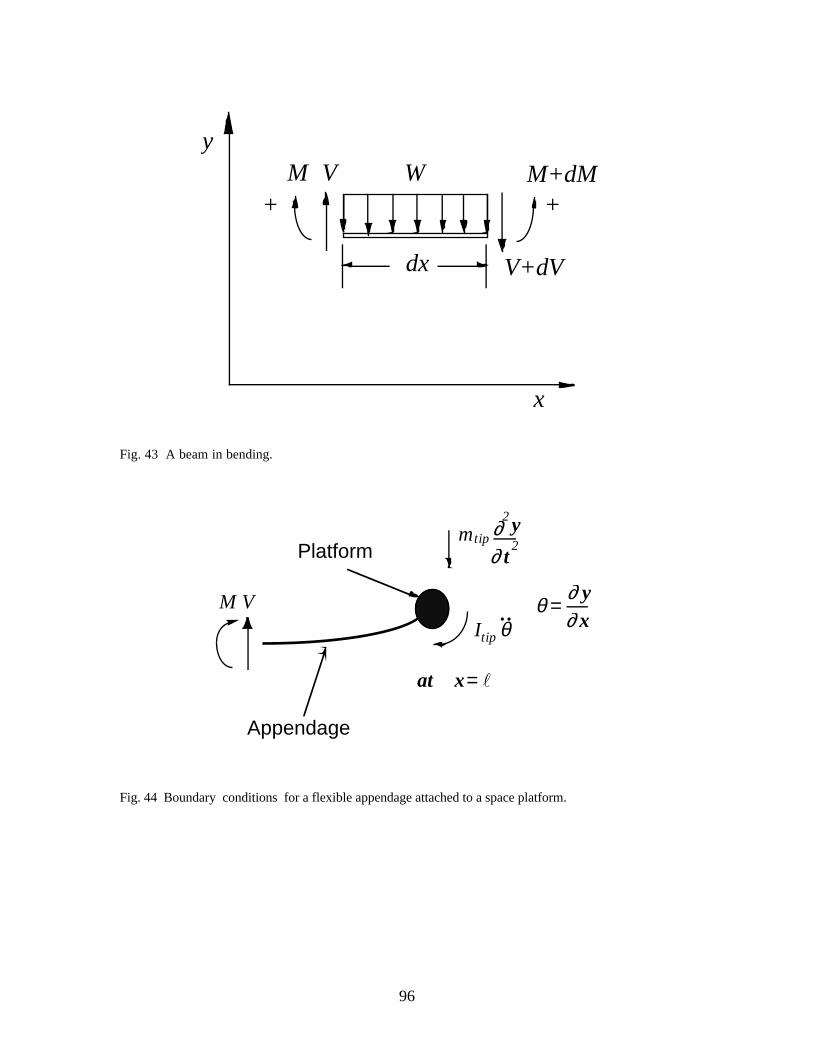
96
V+dV
+
y
x
dx
M V M+dMW+
Fig. 43 A beam in bending.
θ =∂ y∂ x
at x= l
Platform
Appendage
M V
mtip ∂ y2
∂ t2
Itip θ..
Fig. 44 Boundary conditions for a flexible appendage attached to a space platform.