Embed Size (px)
Citation preview
THE USE OF EURODOLLAR FUTURES AND OPTIONS IN SHORT TERM
ASSET/LIABILITY MANAGEMENT
by
M〇K MAN-FAI, MANSFIELD
RESEARCH REPORT
Presented to
The Graduate School
In Partial Fulfilment
of the Requirements for the Degree of
MASTER OF BUSINESS ADMINSTRATION
TWO-YEAR MBA PROGRAMME
THE CHINESE UNIVERSITY OF HONG KONG
May 1990
mr. KXJYWV
Advisor

,•... .
i
•
^
V-
一:
-• ?,
-
, V
-
•
iv I
/
- 1
/•
n.1..
ID/ /
9 ;
M 7
:、,:%
3 :h,r
一?:
-m !即一I
丄2 j
缝
.,“

i
ABSTRACT
The fluctuation in short term interest rates has prompted the financial
institutions to consider managing their asset/liability exposure with a view to
reduce their interest rate risks. Therefore a research on the asset/liability
management in Hong Kong is invaluable to the present practitioners and for
future development of this activity.
This report explores the techniques employed by financial institutions in
hedging their asset and liability exposures. Emphasis has been put on the use
of Eurodollar futures and options as tools for asset/liability-management
because i) most of the financial institutions in Hong Kong accept Eurodollar
deposits and ii) until recently Hong Kong dollar interest rate futures were not
available.
This report also discusses the similarities and differences of Eurodollar
futures and options. In addition, the merits and demerits of using Eurodollar
futures and options in hedging and the reasons for hedging are also examined
in this report.
As regards the gap management activity in Hong Kong, an exploratory
research has been done by interviewing six practitioners in different financial
institutions. Problems for Hong Kong users in hedging the gap by Eurodollar
futures and options are also discussed.
ii
*
ACKNOWLEDGEMENT
I would like to take this opportunity to express my gratitude to Mr. K. Y.
YIK,my research supervisor, for his help and guidance. His valuable
suggestions and comments have contributed much to the completion of this
research.
Furthermore, I am greatly indebted to numerous bankers for their
generosities of giving up their times for interviews.
Mansfield Mok Man-fai
May, 1990.
Hong Kong.
iii
TABLE OF CONTENTS
ABSTRACT i
ACKNOWLEDGEMENT jj
TABLE OF CONTENTS ijj
Chapter I. INTRODUCTION 1
II. EURODOLLAR FUTURES AND OPTIONS 3
Eurodollar Futures 3 Hedging With Eurodollar Futures 4 Options On Eurodollar Futures 5
Contract Type 5 Contract Style 6 Contract Lifespan 6 Co� tract Value 6
Hedging With Eurodollar Options 7 Naked Positions 7
III. ASSET/LIABILITY MANAGEMENT . 9
Gap Concept 10 Gap Analysis 1 1 Types of Gaps 12
Positive And Negative Gaps 13 Voluntary And Involuntary Gaps 13
IV. HEDGING THE GAP 14
Macro Hedge 14 Micro Hedge 17 Macro Hedge vs Micro Hedge 17
iv
V. HEDGING METHODOLOGY 19
Cross Hedge Basis Risk 20 Hedge Ratio 20
Time Basis Risk . 21 Basic Hedge With No Time Basis Risk 23
Example 1: Single 90-Day Gap 24 Example 2: Single 30-Day Gap 24 Example 3: Single 180-Day Gap 25 Example 4: Series of 90-day gaps 25 Example 5: Series of 30-Day Gaps 26
Basic Hedge With Time Basis Risk 27 Hedging Of A Series Of Liability Issues 32
Strip hedge 32 Stack hedge 33
VI. OPTIONS AND FUTURES 35
Similarities and Differences 35 Merits And Demerits 37
VII. REASONS FOR HEDGING 39
Merits 39
Demerits . 40
VIII. THE SITUATION IN HONG KONG 42
IX. CONCLUSION 45
APPENDIX 47
BIBLIOGRAPHY 49
1
CHAPTER I
INTRODUCTION
Managers of short term fixed securities structure their portfolios in order
to benefit from their implicit or explicit forecasts on the direction of interest rates
and changes in the shape of the yield curve. Such portfolio structuring is a
dynamic process, as changing economic conditions frequently affect investors�
forecasts and thus foster recurring, if not continual, reevaluations of optimal
portfolio design. This also leads to the topic of asset and liability management
which is the purpose of this report.
When a portfolio adjustment becomes appropriate, the portfolio manager
has two choices: either to liquidate portions of the portfolio and reallocate the
capital to other issues, or to synthetically restructure the portfolio through the
use of interest rates futures and/or options. This research report focuses on
the second alternative by using Eurodollar Futures and options as illustration.
This report discusses methods for hedging the short term asset/liability
position of a financial institution by using the Eurodollar futures and options.
Eurodollar futures and options have been chosen because Eurodollar futures
is a popular money market tool for hedging amongst financial institutions in
Hong Kong, especially those who accept Eurodollar deposits.
Chapter II provides the general specifications of the Eurodollar futures
and Options and discusses some of the hedging strategies for them. Chapter
2
III discusses the gap concept which is the central theme of asset/liability
management and follows by Chapter IV which describes the two main
principals in hedging the gap. Chapter V discusses the hedging methodology
by using Eurodollar futures as an illustration. After a discussion on the risks
involved in hedging, techniques for minimizing the risks and managing the risks
are discussed in the final part of Chapter V.
Chapter Vl compares the use of futures with that of options in the
hedging process. The reasons for using Eurodollar futures and options to
hedge the asset/liability position are explored in Chapter VII. Finally, the
present situation in Hong Kong is discussed in Chapter VIII. Chapter IX
provides the conclusion of this report.
3
«
CHAPTER II
EURODOLLAR FUTURES AND OPTIONS
This chapter begins with the description of the Eurodollar futures and its
hedging strategies. It is then followed by a review on the options trading
strategies.
Eurodollar Futures
The Three-Month Eurodollar Time Deposit is the underlying instrument
for the Eurodollar Futures. These Eurodollar denominated time deposits are
located in banks outside the United States, primarily in London and other
European financial centers. They are the basic short term security in the
international money market. The rate in the Eurodollar market is called the
London Interbank Offer Rate (LIBOR). This is the rate at which top-tier banks
in London are willing to lend deposits among themselves. This LIBOR rate is
very similar to the prime rate in the United States in the sense that actual
lending rates involve a premium over LIBOR based on particular circumstances
of the loans and the credit quality of the borrower.
The delivery value of a Eurodollar futures contract is $1 million.
Contracts call for delivery in March, June, September, and December of each
year. The features of the Eurodollar futures contract traded at the Singapore
4
International Monetary Exchange (SIMEX), International Monetary Market
(IMM)�and London International Financial Futures Exchange (LIFFE) are very
similar. Prices are quoted in terms of an index basis as 100 minus the
annualised Eurodollar futures rate.
The final settlement is made in cash directly through the clearinghouse
in the respected exchange based on the LIBOR rate on the last trading day.
The last trading date is the second London business day before the third
Wednesday of the month. The LIBOR rate on which settlement for the contract
is based is the average three-month time deposit rate quotes on a random
selection of 12 banks from the top 20 banks in London Eurodollar market. The
smallest trading unit is one basis point or $25, with a limit move set at 100
basis points or $2,500.
Hedging With Eurodollar Futures
Eurodollar futures can be used for hedging the cost of loans financed by
Eurodollar deposit issues. Lenders can buy Eurodollar futures to protect their
loan income from an unexpected drop in rates. Thus the drop in rates of the
loan is offset by the gain in the Eurodollar futures contract (a drop in rate is
equivalent to a rise in Futures price).
Banks that expect to be net issuers of Eurodollars in the future may wish
to sell the futures to guard against higher interest costs associated with a rise
in rates. Thus the rise in interest cost is then offset by the gain in the futures
contract.
Furthermore, many multinational corporations are large holders of
Eurodollar deposits. These firms may use this market to reduce fluctuations in
5
their short-term capital income over a planning period. They may wish to buy
Eurodollar futures in anticipation of expected cash flows which they intend to
convert into Eurodollar deposits at some future date. They then liquidate the
futures position when they decide to convert their cash to Eurodollar deposit.
With such arrangement, they can earn at their desired deposit rate.
Options On Eurodollar Futures
An option gives the option buyer the right to choose the best course of
action that is made available to him through the option contract. The seller of
the option, according to the contract, is obliged to comply to the decision of
the buyer. The buyer pays a "premium" to acquire the right stipulated in the
contractual terms from the seller. As the Eurodollar option buyer is acquiring
the right but not the obligation to the Eurodollar futures, he still can choose to
commit or not to commit into the agreed terms in the contract. Generally,an
option contract consists of the following terms: contract type, contract style,
contract lifespan,and contract value.
Contract Type
Option contract consists of two types, call option and put option.
A call Eurodollar option is a contract that gives the buyer the right to buy the
Eurodollar futures and the seller of the call Eurodollar option is obliged to
deliver the Eurodollar futures if the buyer so decides to exercise his right.
A put Eurodollar option is a contract that gives the buyer the right to sell
the Eurodollar futures and the seller of the put Eurodollar option is obliged to
take delivery if the buyer so decides to exercise the option contract.
6
Obviously, the maximum loss to the buyer is limited to the premium paid
�or the option and at the same time, the buyer enjoys an unlimited profit
potential. On the other hand, the seller's profit is limited to the premium
received and at the same time bearing an unlimited loss potential.
Contract Style
An option contract can be either an America� style option or a European
style option. The Eurodollar option, however, is American style.
A European style option can only be exercised on the expiration datei
of the contract. An America� style option can be exercised any time before
the expiration date.
Contract Lifespan
For the Eurodollar option contract, the lifespan is three months. That is
the IMM cycle (March, June, September, and December) is used in the
exchanges as well as on over-the-counter trading.
Co�tract Value
The cost of an option is reflected by the premium paid by the buyer. In
addition, there is also a stipulated price level- the strike price^ for the delivery
or taking delivery.
i f he expiration date is the final date on which exercise is allowed. For the Eurodollar options contract the expiration date is two business day before the IMM date, which is the third Wednesday of each contract month. Thus the expiration date for 1990 June contract is 18th June 1990.
^Strike price is the price at which the option can be exercised.
7
Hedging With Eurodollar Options
As this report only focuses on the hedging methodologies with
Eurodollar futures and options, we will not discuss the pricing of options in the
following context。. In this section we will discuss only the simplest of
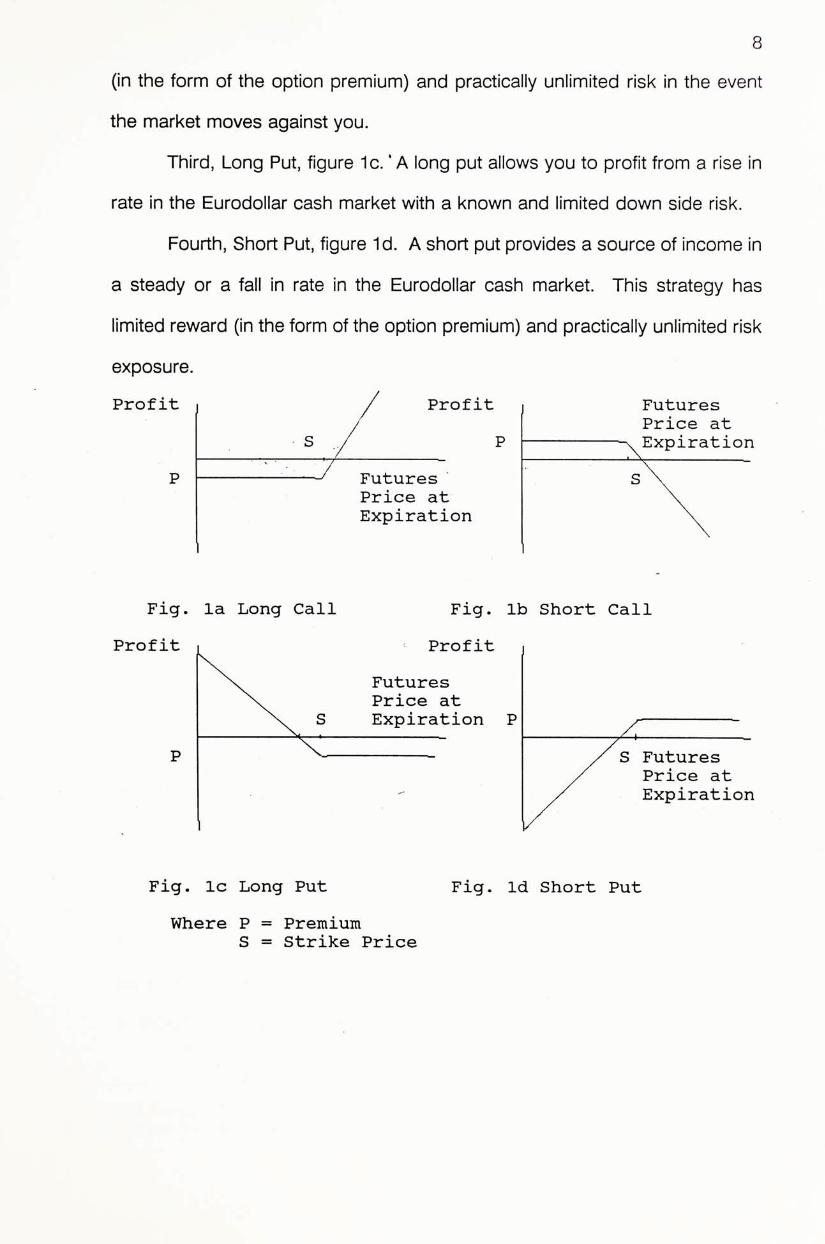
strategies, the naked positions. The profit diagram for each strategy, showing
the profit from holding an option position to expiration as a function of the
Eurodollar futures price at expiration, will also be presented to ease
understanding. Here we will ignore commissions and other trading costs so as
to concentrate on the profit outcome of the strategies.
Naked Positions
Naked positions are strategies involving only buy or sale of an option
without an offsetting position and is exposed to the full price volatility
associated with the option. These strategies are sometimes referred to as
uncovered positions. Examples are listed as follows:
First, Long Call, figure 1a. This strategy is appropriate if a decrease in
interest rate is anticipated in the Eurodollar cash market. It provides the
opportunity to earn a profit with a known and limited risk.
Second, Short Call, figure 1b. Short call provides a source of income in
a steady or increase in rate in Eurodollar cash market. It offers a limited reward
For details on Interest rate options pricing formula, please refer to Hull, John. Options. Futures. And Other Derivative Securities. Englewood Cliffs, New Jersey: Prentice Hall, Inc., 1989. and Kaufman, Perry � Handbook Of Futures Market. New York: John Wiley & Sons Inc., 1984, Chapter 13.
8
(in the form of the option premium) and practically unlimited risk in the event
the market moves against you.
Third, Long Put, figure 1 c / A long put allows you to profit from a rise in
rate in the Eurodollar cash market with a known and limited down side risk.
Fourth, Short Put, figure 1d. A short put provides a source of income in
a steady or a fall in rate in the Eurodollar cash market. This strategy has
limited reward (in the form of the option premium) and practically unlimited risk
exposure.
Profit / Profit Futures / Price at
• S y P —-^Expiration P — ^ Futures" ‘ s'X
Price at \ Expiration \
Fig. la Long Call Fig. lb Short Call
Profit Profit
X Futures Price at
S Expiration P y ‘
JT ^ / S Futures Z Price at
“ Z Expiration
Fig. Ic Long Put Fig. Id Short Put
Where P = Premium S = Strike Price
9
«
CHAPTER 111
ASSET/LIABILITY MANAGEMENT
Banks act primarily as intermediates between those who wish to lend
capital and those who wish to borrow funds. In order to provide loan and
investment capital, banks must first acquire funds. These funds are liabilities to
the bsnk. In general, bank's principle sources of funds are demand, savings,
time deposits, equity capital, and subordinated long term debt. Each liability
- h a s a unique cost. Demand, savings, and time deposits are generally obtained
at a lower cost than long term debt and equity.
Banks' primary sources of earning assets are loans which provide the
revenue necessary to cover the cost of bank liabilities. In the environment of
highly fluctuating interest rate, banks�profitability is then highly depended on
the net exposure of its asset or liability to the interest rate. Banks thus
constantly want to maintain a positive net interest margin/
An asset or liability is generally regarded as interest sensitive if its cash
flows are affected in the short run by changes in interest rates. These include
the savings deposits, short term loan, and so forth. With this definition, for a
bank with greater interest-sensitive liabilities than interest sensitive assets, a rise
in short-term rates can reduce bank profits.
4�merest margin is the differential between interest earned on assets and interest paid on liabilities as a percentage of earning assets.
10
To reduce interest rate exposure, banks attempt to match interest
sensitive assets with interest sensitive liabilities and fixed rate assets with fixed
rate liabilities. Variability in loan demand and deposits often prevents a bank
from achieving a close match between the interest rate sensitivity of assets and
liabilities. As a result, a bank may fund fixed rate assets with interest sensitive
liabilities and vice versa. When the interest rate sensitivity of assets and
liabilities does not match, banks may employ financial futures to hedge the net
interest rate exposure.
Gap Concept
Each asset or liability has its own risk associated with it. This risk
includes the credit risk,liquidity risk,and so on. When all the assets and
liabilities are assembled onto the balance sheet, the combination creates a
somewhat different picture. The various risks combine either to offset one
another or to create further risk by the imbalances among them. The net effect
of these imbalances is the cumulative risk to which the institution is exposed
and is known as its gap.
Managing this cumulative risk is known as Asset/Liability Management.
The technique, "gap analysis", is used to measure this overall risk. This
technique involves a detailed study of the institution's balance sheet.
Under quiet market conditions the mismatch of assets and liabilities
could be tolerable for a time without jeopardizing the profitability or survival of
the institution. However, in today's world of extreme rate volatility, this is not
the case. Shifts in the yield curve has pushed banks to consider their gap
management.
11
Gap Analysis
Isolating and quantifying the maturity imbalance of assets and liabilities
is also known as Interest Rate Sensitivity Analysis. A gap or maturity risk exists
whenever the maturity of an asset differs from the maturity of a corresponding
liability. For example, a bank might have a one-year fixed-rate loan funded by
six-month money market certificates (MMC). Since after six months it will have
to pay whatever the prevailing rate for 6-month MMCs will be in order to retain
the money market certificates used to fund the loan, it has a gap. It is exposed
to interest rate risk.
One key term in asset and liability management is "reset." This means
that an asset's or liability's yield is repriced to the current market yield. This
rate change is the vulnerability which is the core issue of interest rate sensitivity
and gap management.
We will only be interested in assets and liabilities that are subject to a
rate change within a specific period of time (the period of reset). These are
called Rate Sensitive Assets (RSA) and Rate Sensitive Liabilities (RSL),
respectively. The gap concept could then be rephrased as a formula:
GAP 二 RSA - RSL
The gap analysis is a two-step process. First, identify the specific nature
of the portfolio by dividing the rate sensitive assets and liabilities into categories
of time frames when resets will occur. This will result in a matrix of various
dollar amounts or assets and liabilities versus gap periods.
Second, calculate the gap for each time frame category by subtracting
the dollar amounts of rate sensitive liabilities from rate sensitive assets. The
result is the gap.
12
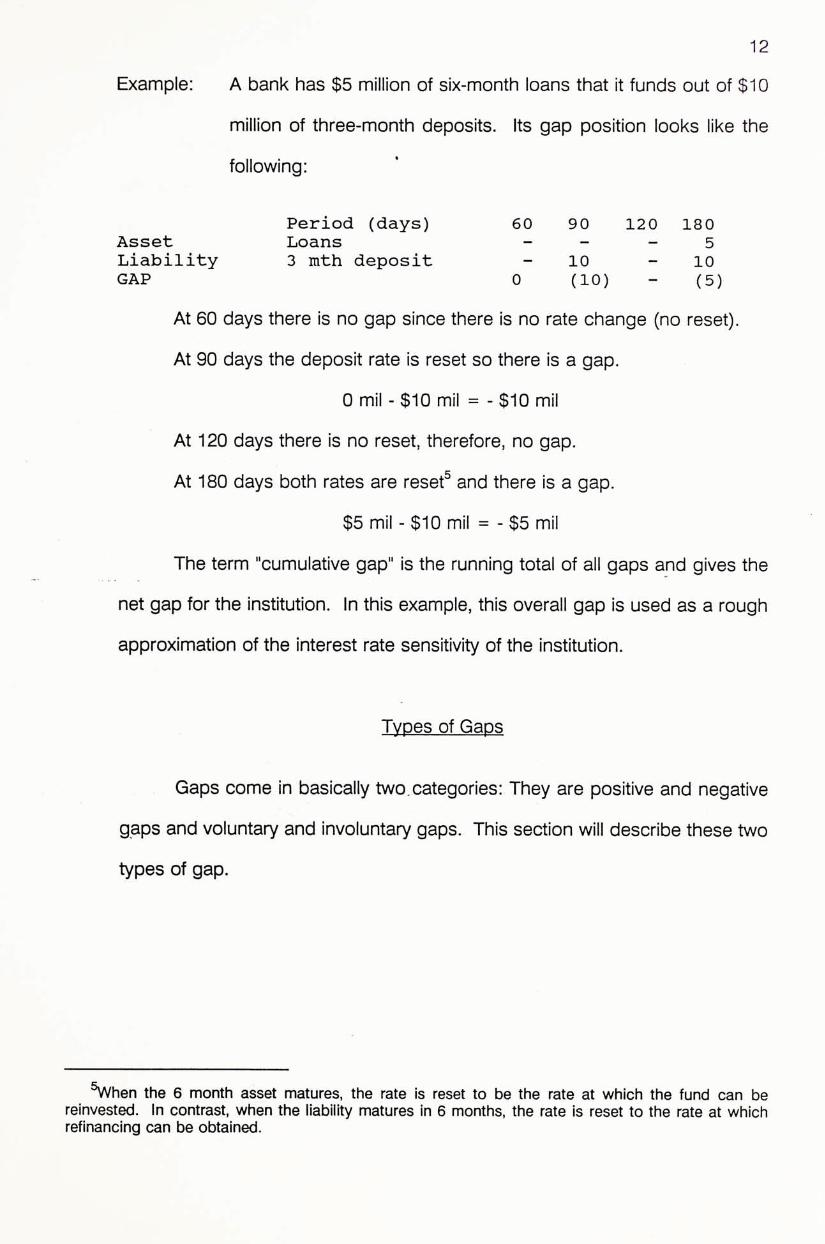
Example: A bank has $5 million of six-month loans that it funds out of $10
million of three-month deposits. Its gap position looks like the
following: '
Period (days) 60 90 120 180 Asset Loans — - - 5 Liability 3 mth deposit 10 - 10 GAP 0 (10) 一 (5)
At 60 days there is no gap since there is no rate change (no reset).
At 90 days the deposit rate is reset so there is a gap.
0 mil -$10 mil = -$10 mil
At 120 days there is no reset,therefore, no gap.
At 180 days both rates are reset^ and there is a gap.
$5 mil - $10 mil = - $5 mil
The term "cumulative gap" is the running total of all gaps and gives the
net gap for the institution. In this example, this overall gap is used as a rough
approximation of the interest rate sensitivity of the institution.
Types of Gaps
Gaps come in basically two,categories: They are positive and negative
gaps and voluntary and involuntary gaps. This section will describe these two
types of gap.
〜hen the 6 month asset matures, the rate is reset to be the rate at which the fund can be reinvested. In contrast, when the liability matures in 6 months, the rate is reset to the rate at which refinancing can be obtained.
13
Positive And Negative Gaps
As mentioned earlier, when rate sensitive liabilities are subtracted from
rate sensitive assets, the resulting gap can be positive, negative, or zero. A
positive number denotes a positive gap; the institution is vulnerable to falling
interest rates as assets reprice faster than liabilities. A negative gap indicates
that the institution is exposed to rising rates as liabilities reprice faster than
assets. A zero gap, which is the goal of many institutions, takes out the rate
risk component.
Voluntary And Involuntary Gaps
Not all gaps are undesirable. Institutions have purposely produced gaps
in order to profit from interest rate moves they have foreseen. These
"voluntary" gaps are designed to benefit the institution based on resets which
will provide lower cost or a greater spread for the transaction should rates
move as forecast. They are deliberated maturity disparities between assets and
liabilities resulting from specific lending and funding commitments. However,
involuntary gaps, mismatches which occur unintentionally from a combination
of actions of the institution and its customers, can affect earnings negatively.
14
«
CHAPTER IV
HEDGING THE GAP
Once an interest rate sensitivity analysis of an institution has been done
and its gaps identified,a hedging program can then be pursued.
The first decision t〇 be made concerning the hedging program is
whether to hedge the overall gap (Macro Hedge) or to hedge certain
component assets or liabilities which constitute the largest exposure to interest
rate risk (Micro Hedge). In this chapter, concepts for Macro and Micro hedges
are presented. The hedging methodology for both cases will be discussed in
next chapter.
Macro Hedge
A positive gap is a bet that interest rates will rise; a negative gap is a bet
that interest rates will fail. Whether the institution's management consciously
makes such a prediction or bet is irrelevant. If you have a positive gap and
rate rise, you win; if rates fall,you lose. The purpose of gap management is to
be able to see, in advance, how interest rate changes will affect the institution's
performance. If the management is convinced that rates will rise and feels that
the size of positive gap that exists does not represent an excessive risk should
15
rates fall, then there is no reason to eliminate the gap, so no hedge should be
put on.
In the event that the institi/tion wants to narrow or close the gap, there
are two methods to do so. First, it can adjust its position in the cash market for
changing the institution's gap(s) merely means to change the amount of the
rate sensitive assets or liabilities.
To narrow a negative gap the institution needs more rate sensitive
assets and/or fewer rate sensitive liabilities. This can be achieved by lending
more loans with maturity matched with the existing gap. While to narrow a
positive gap it needs fewer rate sensitive assets a�d/〇r more rate sensitive
liabilities. This can be done by borrowing short term loans.
Depending on the size of the financial institution, however, an institution
— may find itself unable to reduce the interest rate risk exposure by adjusting its
cash position. Then it may consider the second method. That is to consider
the gap hedging strategy.
Suppose the institution still wants to continue running a positive gap but
would like to hedge the stance in case of a decline in interest rates. This
obviously calls for a long position in the futures market. If rates go up the
institution wins on its long gap position in the cash market but loses on its long
position in the futures market. If rates decline the institution loses on its long
position in the cash market and wins on its long futures position. In either
case, the institution breaks even if the two markets are offsetting. Thus, gap
hedging closes or eliminates gap.
There are two types of Macro gap hedge. They are component gap
hedge and the cumulative gap hedge. Cumulative gap hedge is concerned
with hedging the cumulative gap which is the running total of all gaps.
16
Component gap hedge deals with each defined component. Owing to the fact
that there is no good hedging strategy for the cumulative gap hedge®, the
following context only focuses o � ' t h e component gap hedge.
To design the component gap hedge, the institution identifies its
component gaps. The following example is given as an illustration. In this
example, we assume that the component gap size for this institution is 90 days.
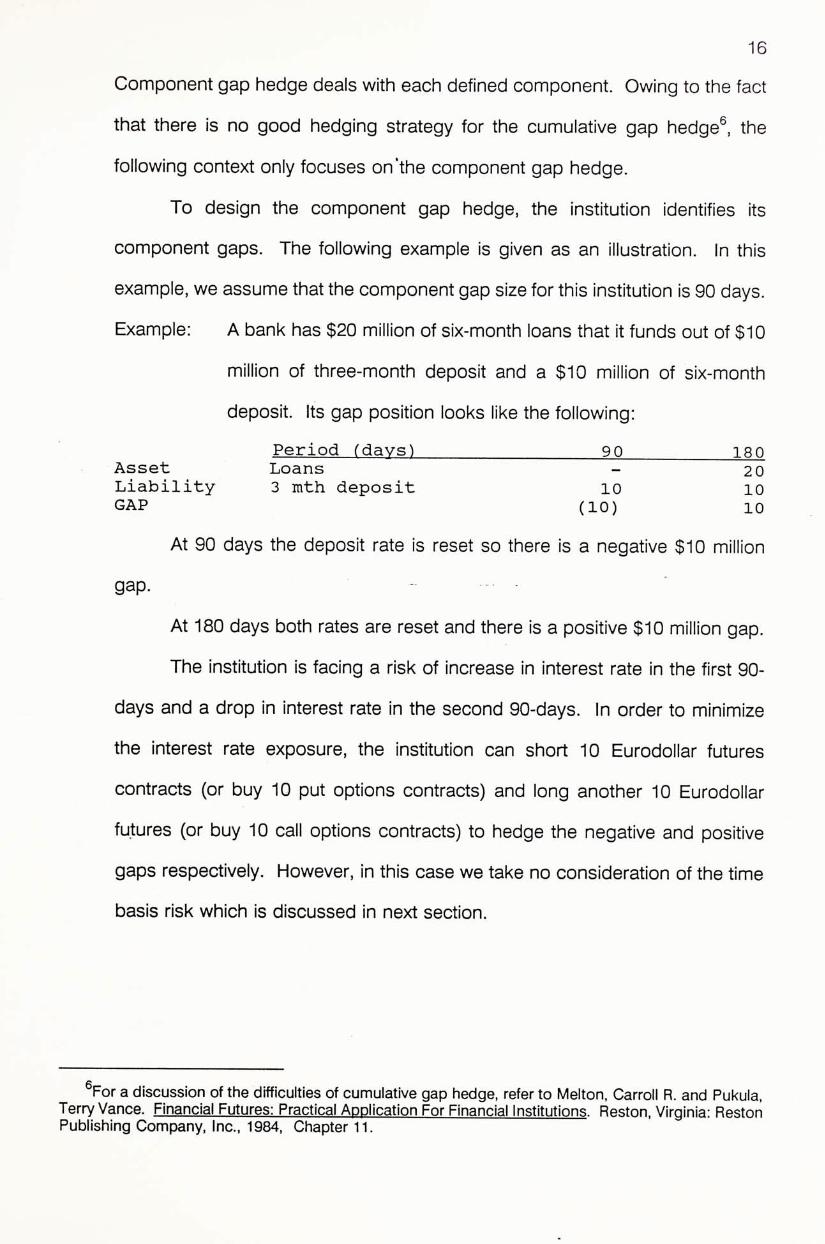
Example: A bank has $20 million of six-month loans that it funds out of $10
million of three-month deposit and a $10 million of six-month
deposit. Its gap position looks like the following:
Period (days) ^ iso Asset Loans - 2 0 Liability 3 mth deposit 10 10 GAP (10) 10
At 90 days the deposit rate is reset so there is a negative $10 million
gap. -
At 180 days both rates are reset and there is a positive $10 million gap.
The institution is facing a risk of increase in interest rate in the first 90-
days and a drop in interest rate in the second 9 0 - d a y s . � � order to minimize
the interest rate exposure, the institution can short 10 Eurodollar futures
contracts (or buy 10 put options contracts) and long another 10 Eurodollar
futures (or buy 10 call options contracts) to hedge the negative and positive
gaps respectively. However, in this case we take no consideration of the time
basis risk which is discussed in next section.
g For a discussion of the difficulties of cumulative gap hedge, refer to Melton, Carroll R. and Pukula,
Terry Vance. Financial Futures: Practical ADDlication For Financial Institutions. Reston, Virginia: Reston Publishing Company, Inc.,1984, Chapter 11.
17
Micro Hedge
In micro hedging, it means to hedge specific asset or liability positions.
Thus, the underlying characteristics of the assets and liabilities being hedged
are considered by the hedger. Furthermore, the hedger also takes into the
account the differing behaviour of various financial instruments with similar
maturities.
Referring to the above example, the micro hedger will take three
positions in hedging the above gaps. That is he hedge the $20 million 6-month
loan, the $10 million 6-month deposit, and the $10 million 3-month deposit
separately.
For the $20 million 6-month loan, the hedger longs 40 futures contracts^
(or buys 40 calls). For the $10 million 6-month deposit, the hedger should
short 20 futures contracts (or buy 20 puts). Lastly, for the $10 million 3-month
deposit, the hedger then shorts 10 futures contracts (or buys 10 puts). During
the hedging period, these three different positions are considered separately
because in micro hedging all assets/liabilities are considered as separate items.
Macro Hedge vs Micro Hedge
In micro hedge, the user hedges the specific asset and/or liability. Thus
he can define more clearly his risk concerning each asset and/or liability and
offset his risk with better strategies to obtain higher performance, thereby
reducing the overall risk. In contrast, the macro hedger considers the overall
risk exposure.
^The hedge ratio is 2 for the 6-month loan since the Eurodollar futures's maturity is 3 month. The hedge ratio will be discussed in Chapter V.

18
In summary, the decision of using micro hedge or macro hedge
depends primarily on the size of the institution. Larger banks have greater
access to secondary cash markets and have a greater number of alternatives
with which to hedge. Since the futures contract size is of magnitude of $1
million, it makes hedging of small individual sectors difficult if not impossible for
a small institution. As a result, macro hedgers tend to be small institutions
while micro hedgers tend to be larger ones.
- • . - - -
>
19
%
CHAPTER V
HEDGING METHODOLOGY
The objective of a perfect hedge with Eurodollar futures contracts is to
maintain a futures position that will experience a change in dollar value equal in
magnitude and opposite in sign to a change in dollar value of the Eurodollar
cash position being hedged, which results from a change in the yield on the
Eurodollar deposit.
There are three choices in constructing a futures hedge:
1) which futures contract to use;
2) how many futures contracts to transact (called hedge ratio);
3) which contract month(s) of the futures contracts to use.
Since Eurodollar futures is used as an illustration in this report, we are
not going to discuss the first choice in this context. Before discussing the
second choice and the third choice, two concepts, namely,cross hedge basis
risk and the time basis risk, have to be introduced first.
There are two aspects to specifying the relationship between the yield of
the Eurodollar deposit being hedged and that of the Eurodollar futures contract
at the end of the hedge. They are :
First, the yield characteristic of the Eurodollar deposit being hedged and
that of the 3 month Eurodollar deposit.
20
Second, the time at which the hedge is terminated relative to the delivery
period on the futures contract used.
The risk that results from changes in the first yield relationship is called
cross hedge basis risk. While the risk that results from the changes in the
second yield relationship is called time basis risk. These are the two type of
risks in a hedge that will be discussed in this chapter.
Cross Hedge Basis Risk
The number of futures contracts to be transacted (hedge ratio) must be
determined because of the following reasons. First, Eurodollar deposits with
different maturities experience different price changes in response to equal yield
changes. Second, the yields are usually not perfectly correlated. Finally, there
may be systematic differences in the way their yields change.
Hedge Ratio
Assume that the yield changes in Eurodollar deposit and Eurodollar
futures are the same. Then hedge ratio can be reduced to consider only the
change in the price of the Eurodollar deposit relative to the change in the
futures price.
In this regard, the hedge ratio (h) which is the ratio of the change in the
cash price to the change in futures price, satisfies the following equation.
h = DPC/DPF
where DPC = the changes in the cash price.
DPF = the changes in the futures price upon equal yield changes.
21
The hedge ratio indicates the number of futures contracts sold (or
bought) against the Eurodollar deposit having the same dollar value as the
futures contract. ‘
The major determinant of the hedge ratio is the maturity of the Eurodollar
deposits being hedged. Deposits of different maturities incur different price
changes when their interest rates change by equal amounts. For example, a
one-basis point change in the discount rate of $1 million of 90-day Eurodollar
deposits causes a $25 change in the price, but $1 million of 180-day Eurodollar
deposit changes in price by $50 in response to the same interest rate change.
Thus to hedge a $1 million 180-day Eurodollar deposit with 90-day Eurodollar
futures contract,assuming equal rate changes,requires 2, not 1,Eurodollar
futures contracts. The hedge ratio on this basis would be 2.
Time Basis Risk
The degree of time basis risk depends on the time at which the hedge
is terminated relative to the futures delivery day. Consider first a hedge
terminated on a futures delivery day. In this case, the value of the Eurodollar
deposit and the futures price will equal at the termination of the hedge because
of convergence, and there is no time basis risk. In a hedge of this type, since
the value of the Eurodollar deposit and the Eurodollar futures position are the
same and their yields are equal on the futures delivery day, the yield on the
Eurodollar deposit and that on Eurodollar futures contract will be equal at the
termination of the hedge. Thus, at the beginning of a hedge that will be
terminated on a futures delivery day, the yield relationship between the
22
Eurodollar deposit and the Eurodollar futures at the end of the hedge is known-
they will be equal. «
But if the hedge is terminated on other than a futures contract delivery
day, the yield on Eurodollar futures price will not be equal to that on the
Eurodollar deposit; the yield on futures may be either greater or less than the
yield of the Eurodollar deposit, depending on the slope of the yield curve at
that time, as discussed in the next section. If a short futures position is used
in the hedge, obviously (since the futures contract will be brought back to
liquidate it), the lower the futures price relative to the yield of the Eurodollar
deposit at the termination of the hedge, the more beneficial for the hedger, and
vice versa. The risk associated with the termination of a hedge before the
futures delivery day and the resulting risk due to variations in the difference
between the yield on the futures contract and that on Eurodollar deposit, that
is, time basis risk, can be eliminated or minimized by the proper selection of the
CO�tract months.
Time basis risk is resulted from uncertainty about the relationship
between yield on Eurodollar deposit and that on Eurodollar futures at the
termination of the hedge. The element of a hedge that affects the degree of
the time basis risk is the choice of the contract month (or months) of the
futures contract selected, which is an issue not discussed in the above section.
If the hedge (or series of hedges) terminates on a futures delivery day
(or days), there is no intrinsic time basis risk in the hedge because the yield on
the Eurodollar deposit and that on Eurodollar futures will be equal, or
approximately equal, on the last day of trading of the futures contract as the
result of convergence.
23
If the hedge (or series of hedges) does not terminate on a futures
delivery day (or days), however, there is intrinsic time basis risk in the hedge
because the relationship between the yield on the Eurodollar deposit and that
on Eurodollar futures prior to the termination of the hedge is not known. As
discussed below, the relationship between these two yields depends on the
slope of the yield curve at the termination of the hedge. The uncertainty and
variability in this yield relationship cause time basis risk in a hedge. Time basis
risk cannot be eliminated in this case.
However, an understanding of the relevant relationships, how they affect
the outcome of a hedge, and an estimate of the likely future relationships
among the relevant variables may permit the hedger to minimize the time basis
risk. Typically, the futures contracts that expire nearest and subsequent to the
transaction being hedged are used.
Therefore, when time basis risk does not exist, a hedger can make a
precise calculation at the beginning of the hedge of the effective return on the
portfolio. Nonetheless, when there is time basis risk, the hedger may decide,
instead of eliminating or minimizing time basis risk,to manage time basis risk
in an attempt to increase the return on the portfolio.
Basic Hedge With No Time Basis Risk
This section considers one or a series of hedges terminating on one or
a series of futures delivery days and how time basis risk may be eliminated in
this case.®
®The rest of this chapter draws mainly from Jones, Frank J., and Krumholz, Beth A. Short Term Liability Hedging. Kidder, Peabody & Co., 1985.
24
In this context, consider an institution that has a series of Eurodollar
deposits of varying maturities and has to hedge the respective gaps on January
1. Assume that the Eurodollar gap will occur on a futures delivery day (or
days) and the hedge (or hedges) are, thus, terminated on this day (or these
days). The implementation and liquidation of the hedge (or hedges) for each
example is shown.
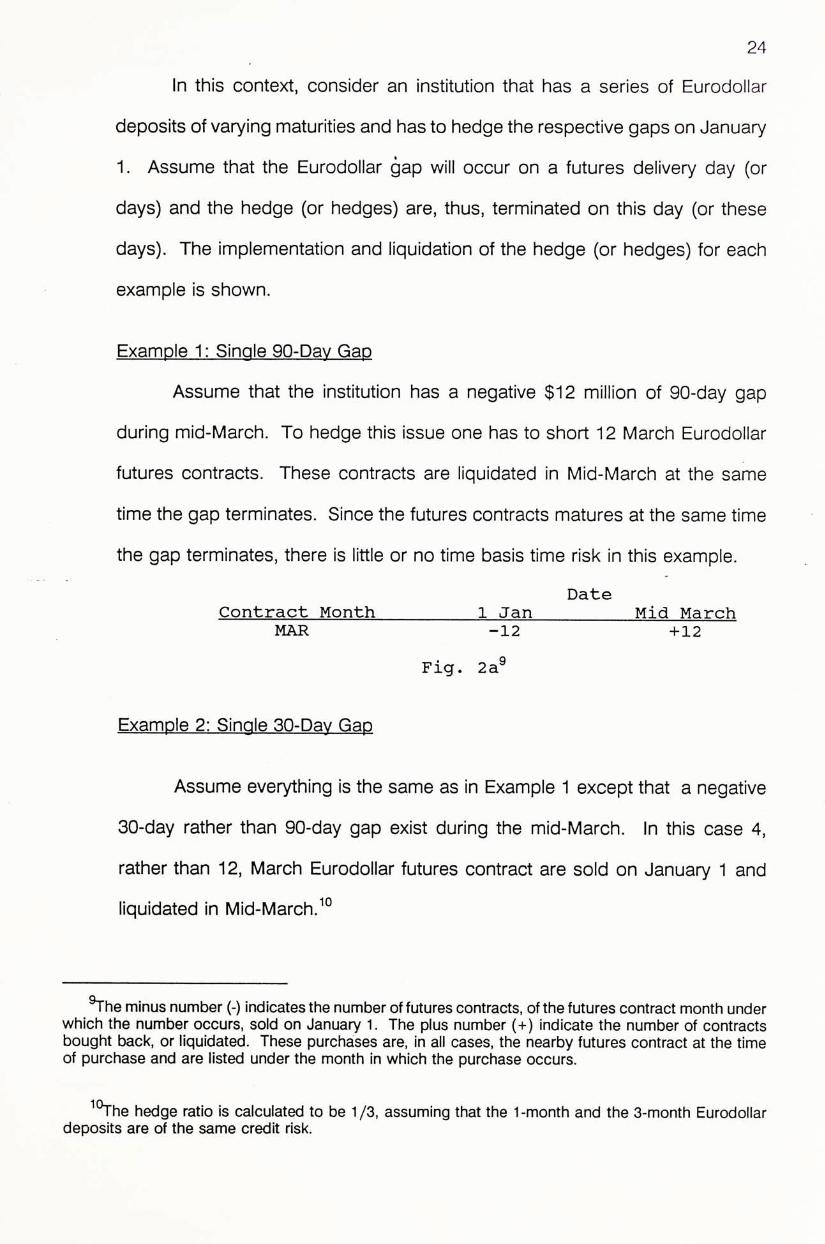
Example 1: Single 90-Day Gap
Assume that the institution has a negative $12 million of 90-day gap
during mid-March. To hedge this issue one has to short 12 March Eurodollar
futures contracts. These contracts are liquidated in Mid-March at the same
time the gap terminates. Since the futures contracts matures at the same time
the gap terminates, there is little or no time basis time risk in this example.
Date Contract Month 1 Jan Mid March
MAR ^ +12
Fig. 2a®
Example 2: Single 30-Day Gap
Assume everything is the same as in Example 1 except that a negative
30-day rather than 90-day gap exist during the mid-March. In this case 4,
rather than 12,March Eurodollar futures contract are sold on January 1 and
liquidated in Mid-March.i。
^ h e minus number (-) indicates the number of futures contracts, of the futures contract month under which the number occurs, sold on January 1. The plus number (+) indicate the number of contracts bought back, or liquidated. These purchases are, in ail cases, the nearby futures contract at the time of purchase and are listed under the month in which the purchase occurs.
1 〜he hedge ratio is calculated to be 1 /3, assuming that the 1-month and the 3-month Eurodollar deposits are of the same credit risk.
25
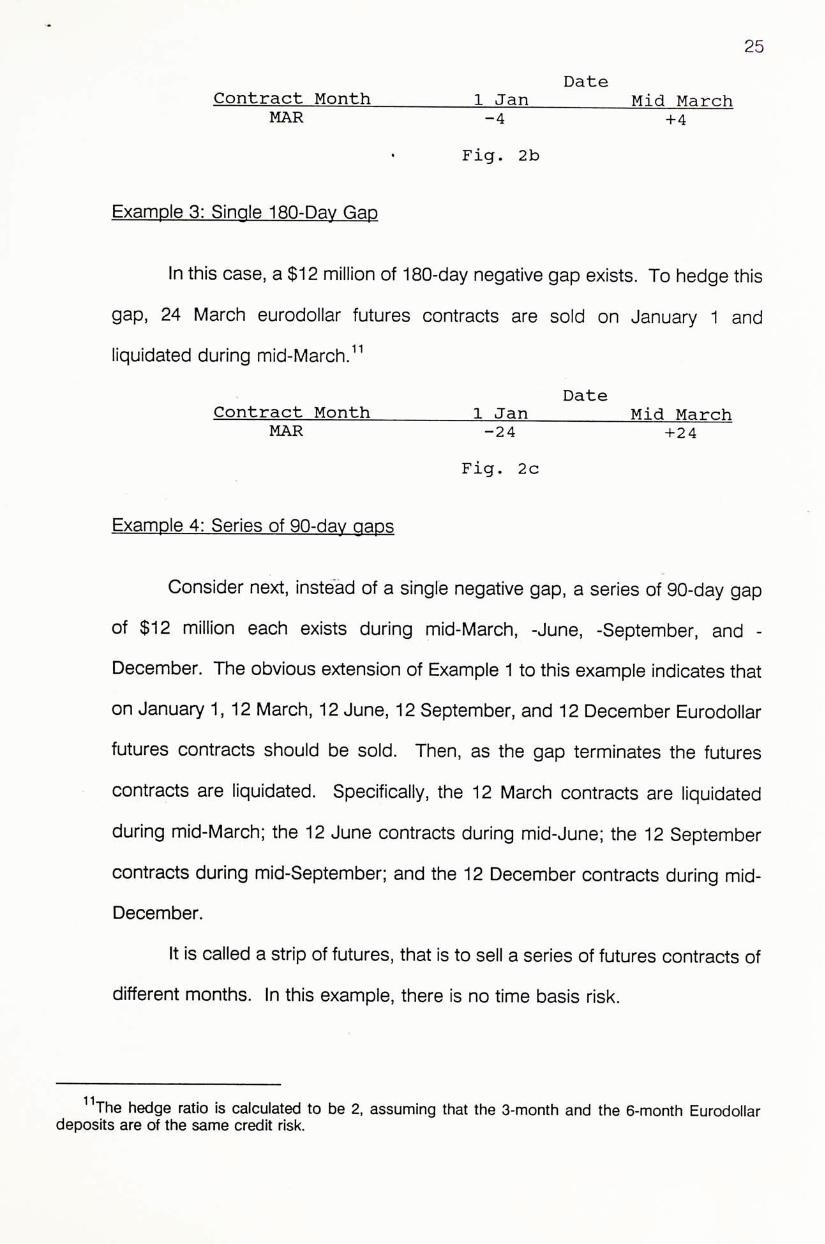
Date Contract Month 1 Jan Mid March
MAR -4 +4
• Fig. 2b
Example 3: Single 180-Day Gap
In this case, a $12 million of 180-day negative gap exists. To hedge this
gap, 24 March eurodollar futures contracts are sold on January 1 and
liquidated during mid-March.”
Date Contract Month 1 Jan Mid March
MAR -24 +24
Fig. 2c
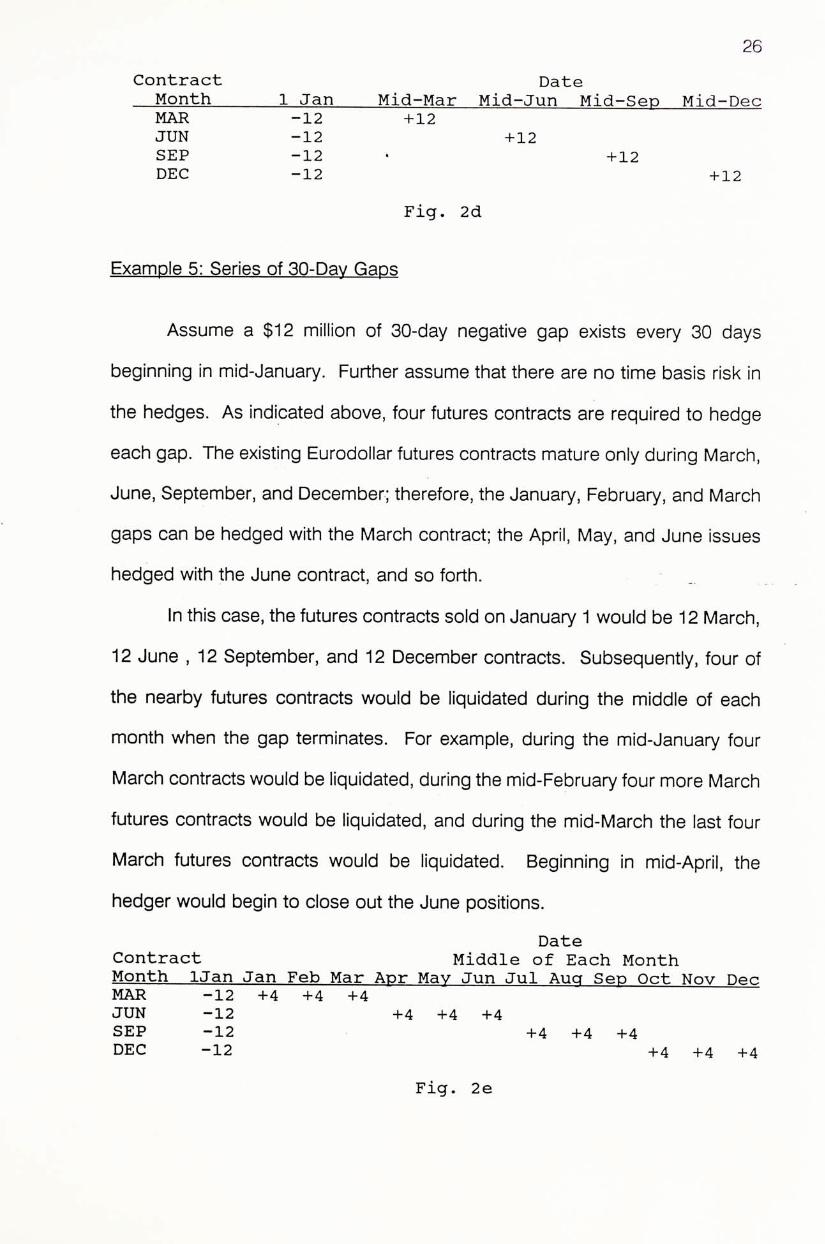
Example 4: Series of 90-dav gaps
Consider next, instead of a single negative gap, a series of 90-day gap
of $12 million each exists during mid-March, -June, -September, and -
December. The obvious extension of Example 1 to this example indicates that
on January 1,12 March, 12 June, 12 September, and 12 December Eurodollar
futures contracts should be sold. Then, as the gap terminates the futures
contracts are liquidated. Specifically, the 12 March contracts are liquidated
during mid-March; the 12 June contracts during mid-June; the 12 September
contracts during mid-September; and the 12 December contracts during mid-
December.
It is called a strip of futures, that is to sell a series of futures contracts of
different months. In this example, there is no time basis risk.
"The hedge ratio is calculated to be 2’ assuming that the 3-month and the 6-month Eurodollar deposits are of the same credit risk.
26
Contract Date Month 1 Jan Mid—Mar Mid-Jun Mid-Sep Mid-Dec MAR -12 +12 JUN -12 +12 SEP -12 • +12 DEC -12 +12
Fig. 2d
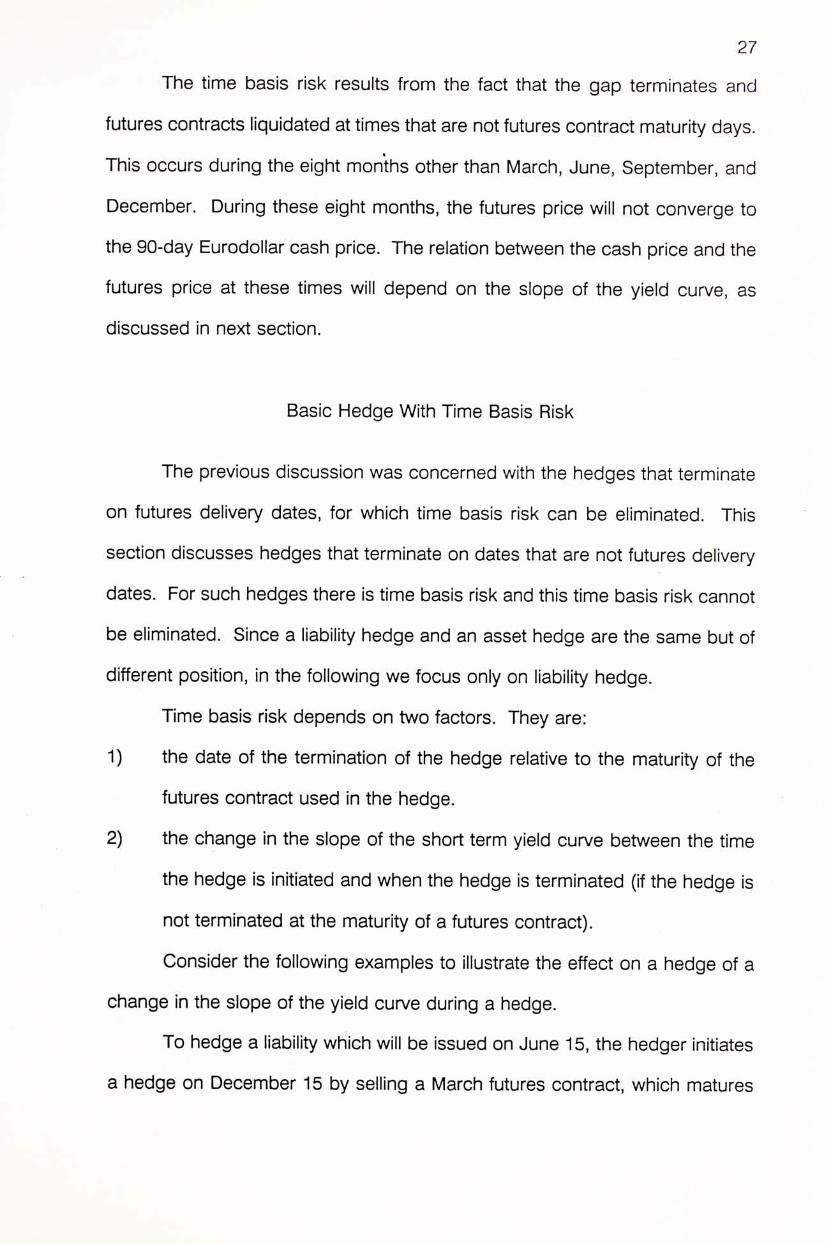
Example 5: Series of 30-Day Gaps
Assume a $12 million of 30-day negative gap exists every 30 days
beginning in mid-January. Further assume that there are no time basis risk in
the hedges. As indicated above, four futures contracts are required to hedge
each gap. The existing Eurodollar futures contracts mature only during March,
June, September, and December; therefore, the January,February, and March
gaps can be hedged with the March contract; the April, May, and June issues
hedged with the June contract,and so forth. _
In this case, the futures contracts sold on January 1 would be 12 March,
12 June,12 September, and 12 December contracts. Subsequently,four of
the nearby futures contracts would be liquidated during the middle of each
month when the gap terminates. For example, during the mid-January four
March contracts would be liquidated, during the mid-February four more March
futures contracts would be liquidated, and during the mid-March the last four
March futures contracts would be liquidated. Beginning in mid-April, the
hedger would begin to close out the June positions.
Date Contract Middle of Each Month Month IJan Jan Feb Mar Apr May Jun Jul Aug Sep Oct Nov Dec MAR -12 +4 +4 +4 JUN -12 +4 +4 +4 SEP -12 +4 +4 +4 DEC -12 +4 +4 +4
Fig. 2e
27
The time basis risk results from the fact that the gap terminates and
futures contracts liquidated at times that are not futures contract maturity days.
This occurs during the eight months other than March, June,September, and
December. During these eight months, the futures price will not converge to
the 90-day Eurodollar cash price. The relation between the cash price and the
futures price at these times will depend on the slope of the yield curve, as
discussed in next section.
Basic Hedge With Time Basis Risk
The previous discussion was concerned with the hedges that terminate
on futures delivery dates, for which time basis risk can be eliminated. This
section discusses hedges that terminate on dates that are not futures delivery
dates. For such hedges there is time basis risk and this time basis risk cannot
be eliminated. Since a liability hedge and an asset hedge are the same but of
different position, in the following we focus only on liability hedge.
Time basis risk depends on two factors. They are:
1) the date of the termination of the hedge relative to the maturity of the
futures contract used in the hedge.
2) the change in the slope of the short term yield curve between the time
the hedge is initiated and when the hedge is terminated (if the hedge is
not terminated at the maturity of a futures contract).
Consider the following examples to illustrate the effect on a hedge of a
change in the slope of the yield curve during a hedge.
To hedge a liability which will be issued on June 15, the hedger initiates
a hedge on December 15 by selling a March futures contract, which matures
28
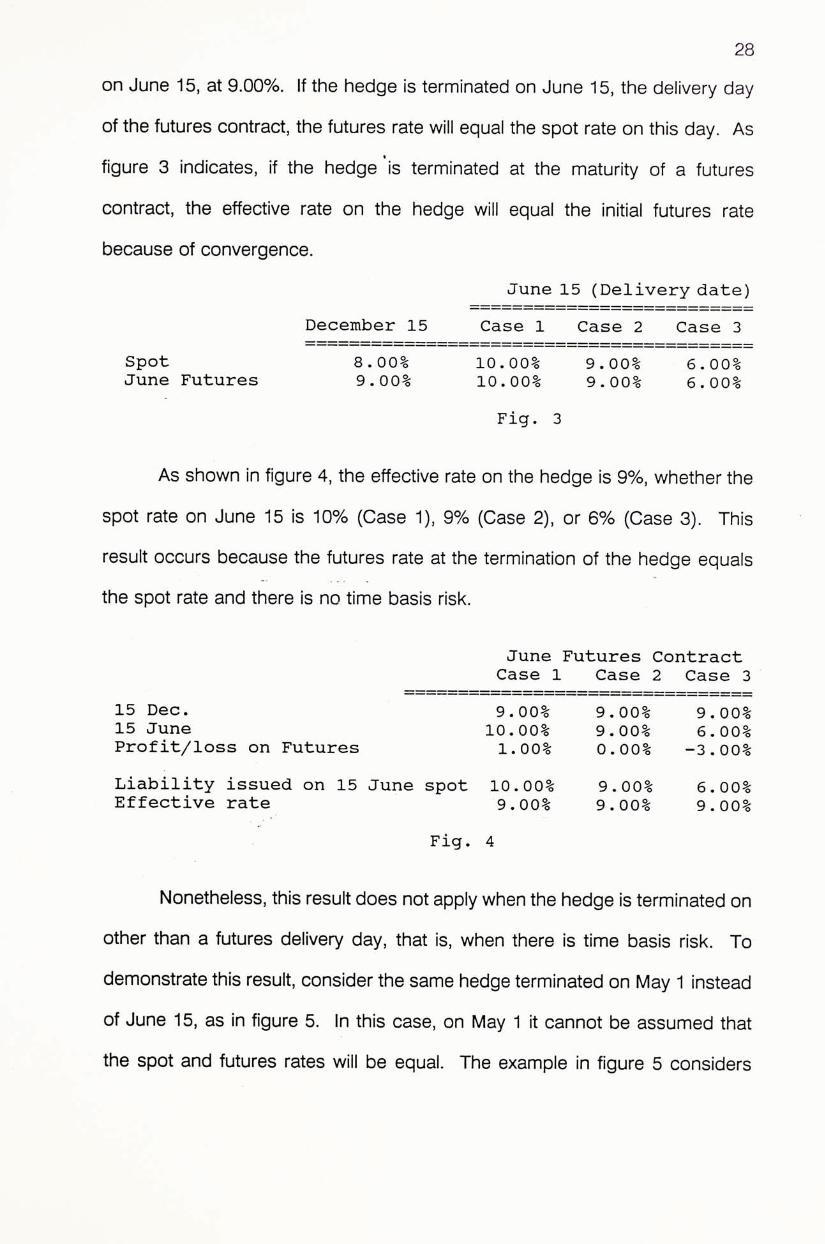
on June 15, at 9.00%. If the hedge is terminated on June 15, the delivery day
of the futures contract, the futures rate will equal the spot rate on this day. As
figure 3 indicates, if the hedge 'is terminated at the maturity of a futures
contract, the effective rate on the hedge will equal the initial futures rate
because of convergence.
June 15 (Delivery date) December 15 Case 1 Case 2 Case 3
Spot 8.00% 10.00% 9.00% 6.00% June Futures 9•00% 10.00% 9.00% 6.00%
Fig. 3
As shown in figure 4,the effective rate on the hedge is 9%, whether the
spot rate on June 15 is 10% (Case 1),9% (Case 2),or 6% (Case 3). This
result occurs because the futures rate at the termination 〇f the hedge equals
the spot rate and there is no time basis risk.
June Futures Contract Case 1 Case 2 Case 3
15 Dec. 9.00% 9.00% 9.00% 15 June 10.00% 9.00% 6.00% Profit/loss on Futures 1.00% 0.00% _3•00%
Liability issued on 15 June spot 10.00% 9.00% 6 . 00% Effective rate 9.00% 9.00% 9.00%
Fig. 4
Nonetheless, this result does not apply when the hedge is terminated on
other than a futures delivery day, that is, when there Is time basis risk. To
demonstrate this result, consider the same hedge terminated on May 1 instead
of June 15, as in figure 5. In this case, on May 1 it cannot be assumed that
the spot and futures rates will be equal. The example in figure 5 considers
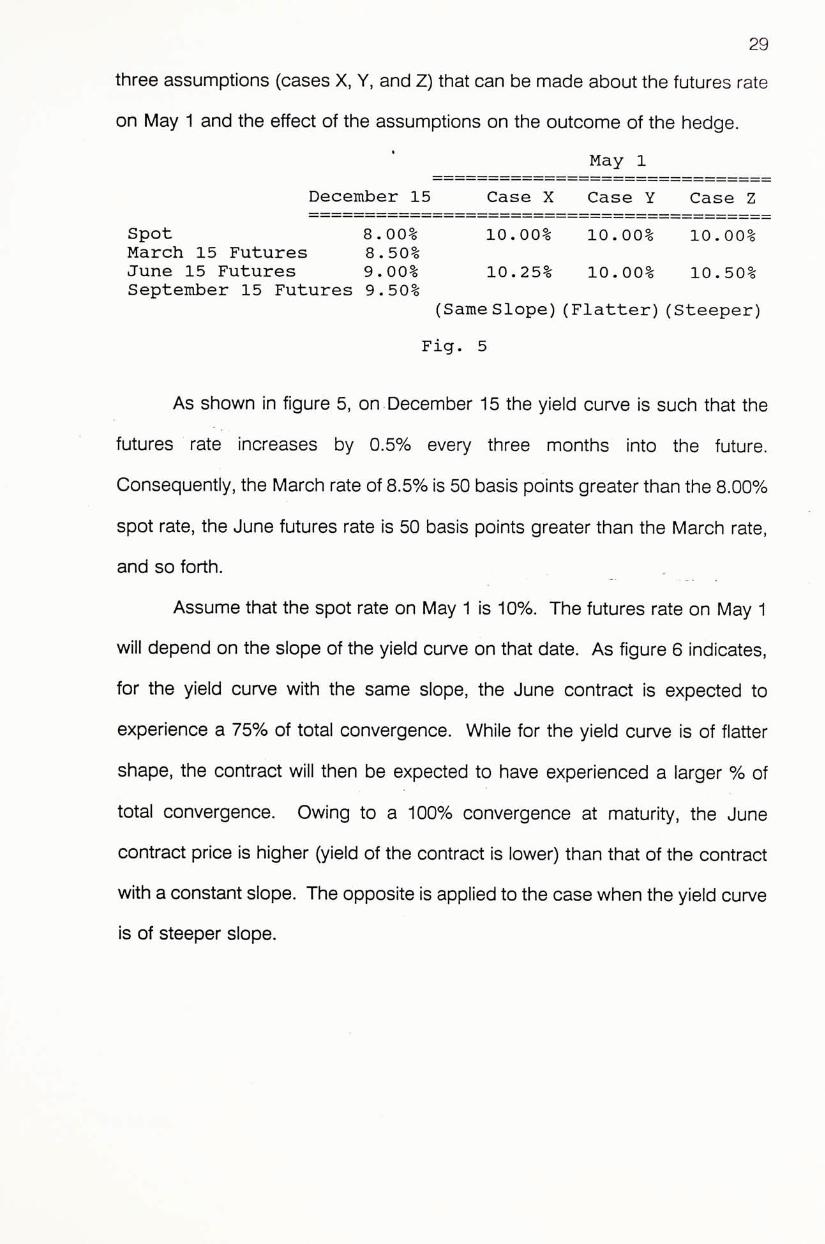
29
three assumptions (cases X, Y, and Z) that can be made about the futures rate
on May 1 and the effect of the assumptions on the outcome of the hedge.
‘ May 1 December 15 Case X Case Y Case Z
Spot 8.00% 10.00% 10.00% 10.00% March 15 Futures 8.50% June 15 Futures 9.00% 10.25% 10.00% 10.50% September 15 Futures 9.50%
(Same Slope) (Flatter) (Steeper) Fig. 5
As shown in figure 5, on December 15 the yield curve is such that the
futures rate increases by 0.5% every three months into the future.
Consequently, the March rate of 8.5% is 50 basis points greater than the 8.00%
spot rate, the June futures rate is 50 basis points greater than the March rate,
and so forth.
Assume that the spot rate on May 1 is 10%. The futures rate on May 1
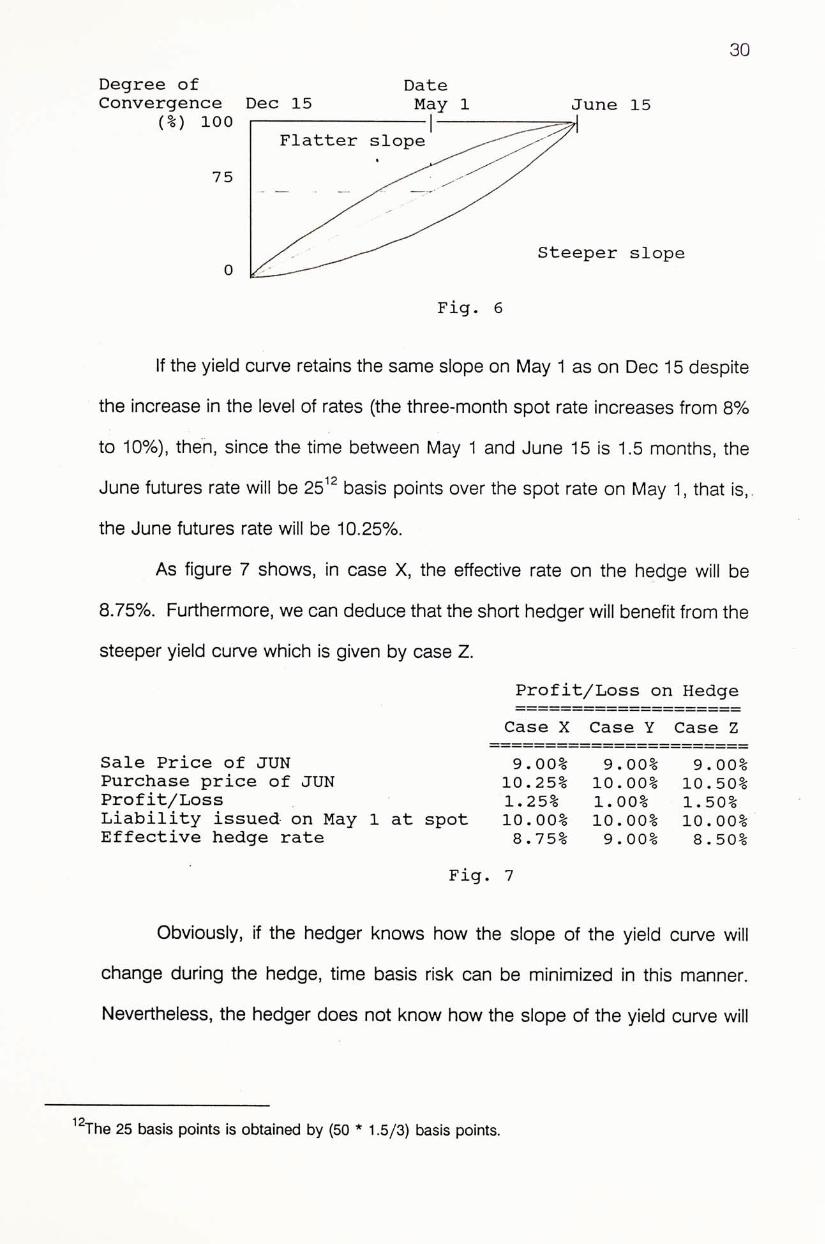
will depend on the slope of the yield curve on that date. As figure 6 indicates,
for the yield curve with the same slope, the June contract is expected to
experience a 75% of total convergence. While for the yield curve is of flatter
shape, the contract will t h e � be expected to have experienced a larger % of
total convergence. Owing to a 100% convergence at maturity, the June
contract price is higher (yield of the contract is lower) than that of the contract
with a constant slope. The opposite is applied to the case when the yield curve
is of steeper slope.
30
Degree of Date Convergence Dec 15 May 1 June 15
(%) 100 1 — r � � ^ Flatter slope
Fig. 6
If the yield curve retains the same slope on May 1 as on Dec 15 despite
the increase in the level of rates (the three-month spot rate increases from 8%
to 10%), then, since the time between May 1 and June 15 is 1.5 months,the
June futures rate will be basis points over the spot rate on May 1,that is,,
the June futures rate will be 10.25%.
As figure 7 shows, in case X, the effective rate on the hedge will be
8.75%. Furthermore, we can deduce that the short hedger will benefit from the
steeper yield curve which is given by case Z.
Profit/Loss on Hedge
Case X Case Y Case Z Sale Price of JUN 9.00% 9.00% 9.00% Purchase price of JUN 10.25% 10.00% 10.50% Profit/Loss 1.25% 1.00% 1.50% Liability issued on May 1 at spot 10.00% 10.00% 10.00% Effective hedge rate 8.75% 9.00% 8.50%
Fig. 7
Obviously, if the hedger knows how the slope of the yield curve will
change during the hedge, time basis risk can be minimized in this manner.
Nevertheless, the hedger does not know how the slope of the yield curve will
i^The 25 basis points is obtained by (50 • 1.5/3) basis points.
31
change. In this respect, time basis risk can be minimized by using a weighted
combination of the nearby and deferred futures contracts, that is the composite
hedge or mixed hedge^^. •
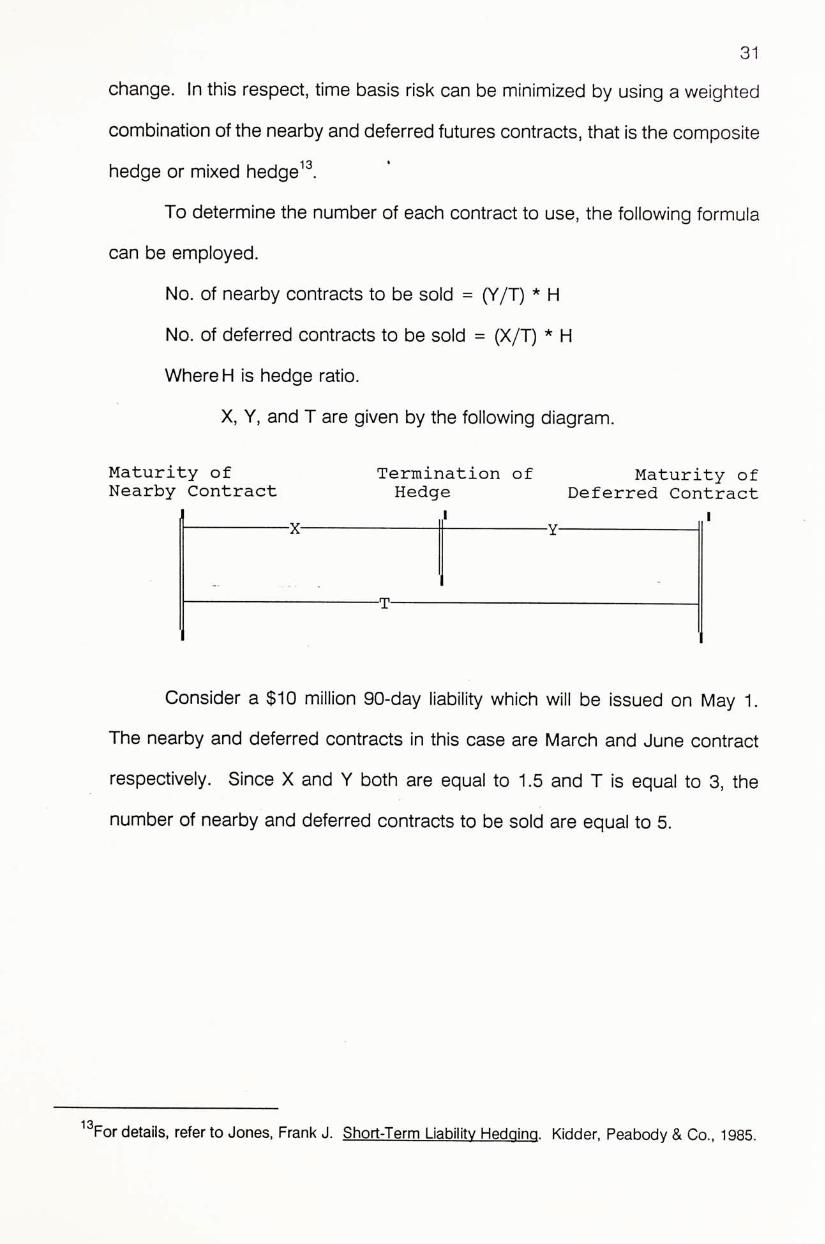
To determine the number of each contract to use, the following formula
can be employed.
No. of nearby contracts to be sold = (Y/T) * H
No. of deferred contracts to be sold : (X/T) * H
Where H is hedge ratio.
X, Y, and T are g ive� by the following diagram.
Maturity of Termination of Maturity of Nearby Contract Hedge Deferred Contract
I I X Y
T
Consider a $10 million 90-day liability which will be issued on May 1.
The nearby and deferred contracts in this case are March and June contract
respectively. Since X and Y both are equal to 1.5 and T is equal to 3, the
number of nearby and deferred contracts to be sold are equal to 5.
i3For details, refer to Jones, Frank J. Short-Term Liability Hedging. Kidder, Peabody & Co., 1985.
32
Hedging Of A Series Of Liability Issues
丁his section discusses two alternative methods for initiating and
terminating the hedge of a series of liability issues. These two methods are
called strip hedges and stack hedges. These methods can apply to hedges
whether or not the hedge terminates on a futures delivery date.
Gonsider again a series of examples. Assume that on January 1 a �
institution develops a plan to issue during mid-March, mid-June, and mid-
September $10 million of 90-day liabilities at a rate equal to the 90-day
Eurodollar rate. There are two different ways the institution could initiate and
manage a hedge of this series of liability issues.
Strip hedge
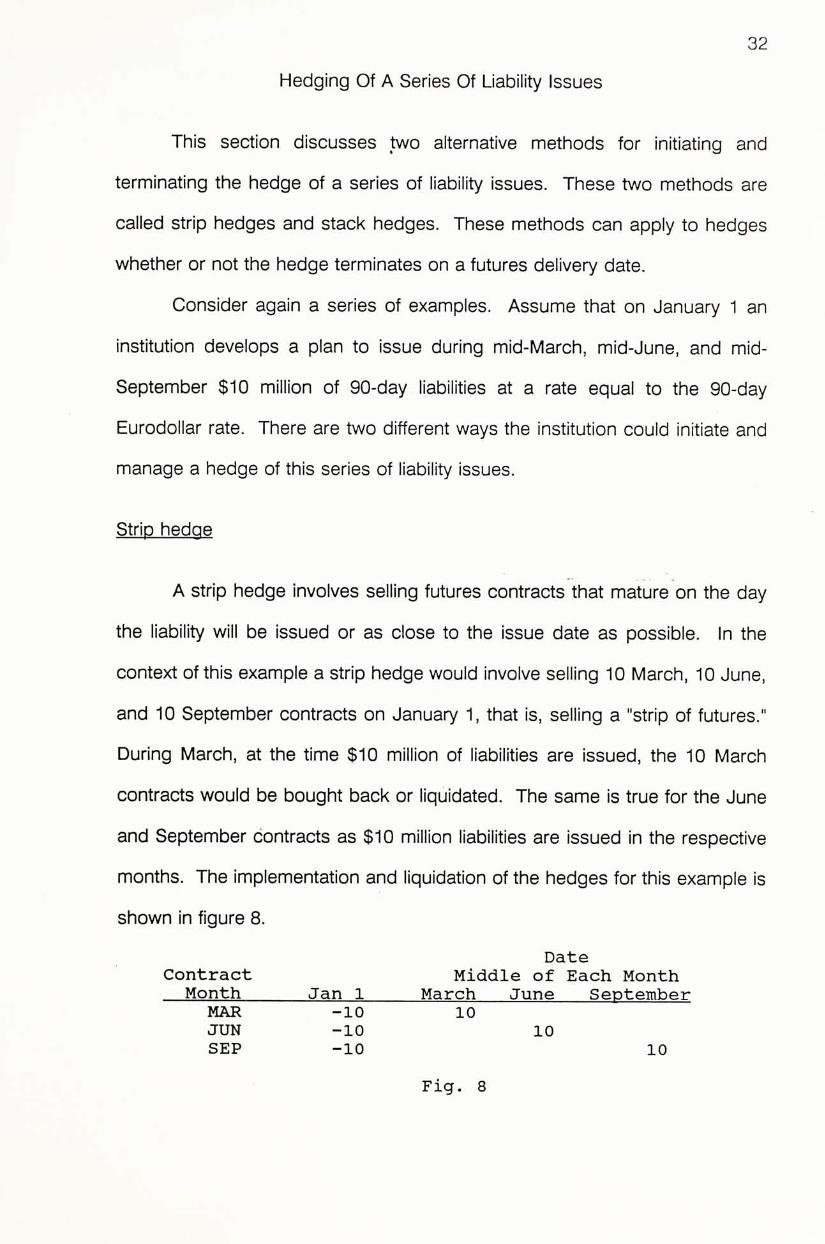
A strip hedge involves selling futures contracts that mature on the day
the liability will be issued or as close to the issue date as possible. In the
context of this example a strip hedge would involve selling 10 March, 10 June,
and 10 September contracts on January 1, that is, selling a "strip of futures."
During March, at the time $10 million of liabilities are issued, the 10 March
contracts would be bought back or liquidated. The same is true for the June
and September contracts as $10 million liabilities are issued in the respective
months. The implementation and liquidation of the hedges for this example is
shown in figure 8.
Date Contract Middle of Each Month
Month Jan 1 March June September MAR -10 10 JUN -10 10 SEP -10 10
Fig. 8
33
In this example, there is neither any cross hedge nor time basis risk.
Thus, the rate at which the futures contracts are initially sold is the rate "locked-
in" on the ultimate liability issues.‘
Stack hedge
While in stack hedge the same number of futures contracts are initially
sold as in a strip hedge, in a stack hedge all the contracts are sold in the
nearby contract month rather than spread across two or more contract months.
But, of course, the hedge must continue after the maturity of the nearby
contract month. Thus, just prior to the maturity of the nearby contract, all the
contracts in the nearby month are bought back and the correct number of
futures contracts in the next delivery month are sold. This is called "rolling" the
hedge.
A roll is essentially a spread transaction, buying the nearby contract to
liquidate the previous short position and selling the deferred contract to
reestablish a new short position. This rolling procedure is used until the end of
the hedge. At the time each liability is issued, some or all of the nearby futures
contracts are liquidated and rolled into the next deferred position. Because
liabilities are issued at the time of the roll, fewer deferred contracts are sold
than nearby contracts that are bought back (liquidated) in the roll.
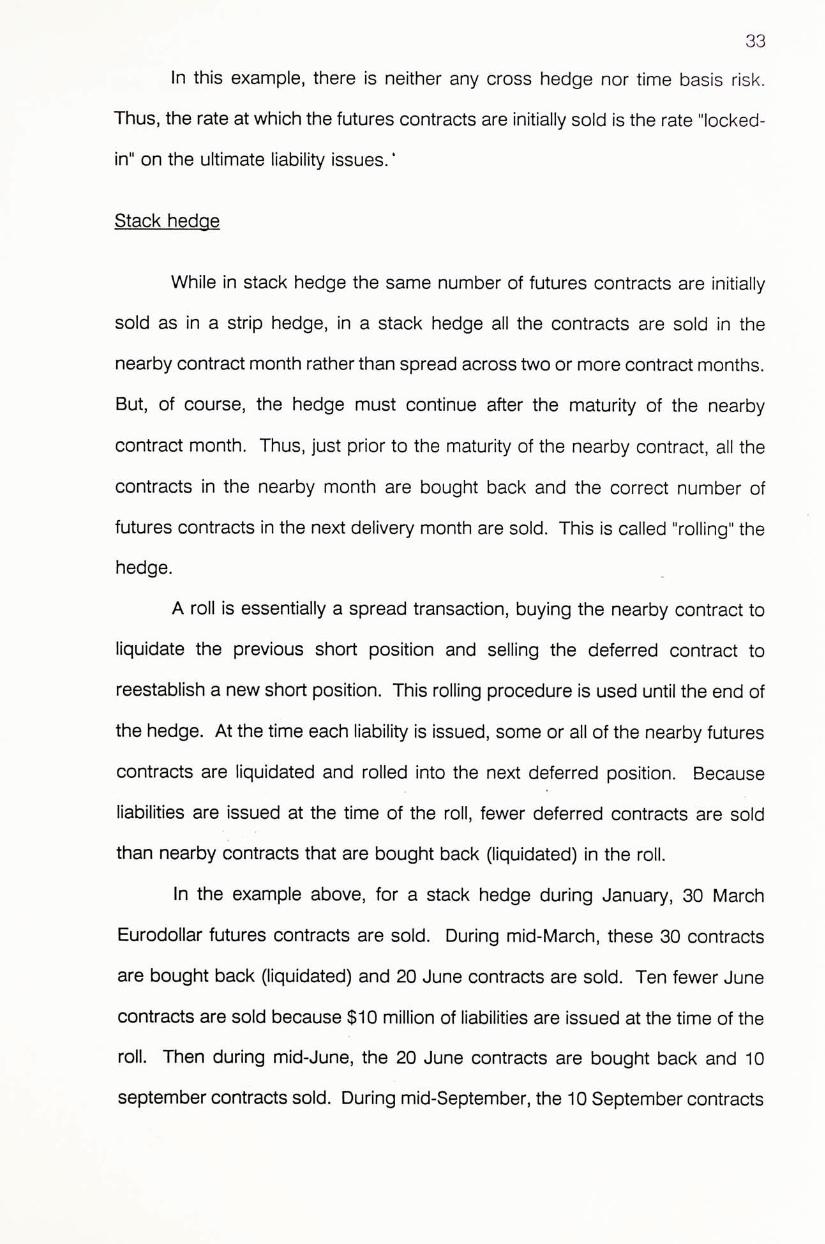
In the example above, for a stack hedge during January, 30 March
Eurodollar futures contracts are sold. During mid-March, these 30 contracts
are bought back (liquidated) and 20 June contracts are sold. Ten fewer June
contracts are sold because $10 million of liabilities are issued at the time of the
roll. Then during mid-June, the 20 June contracts are bought back and 10
September contracts sold. During mid-September, the 10 September contracts
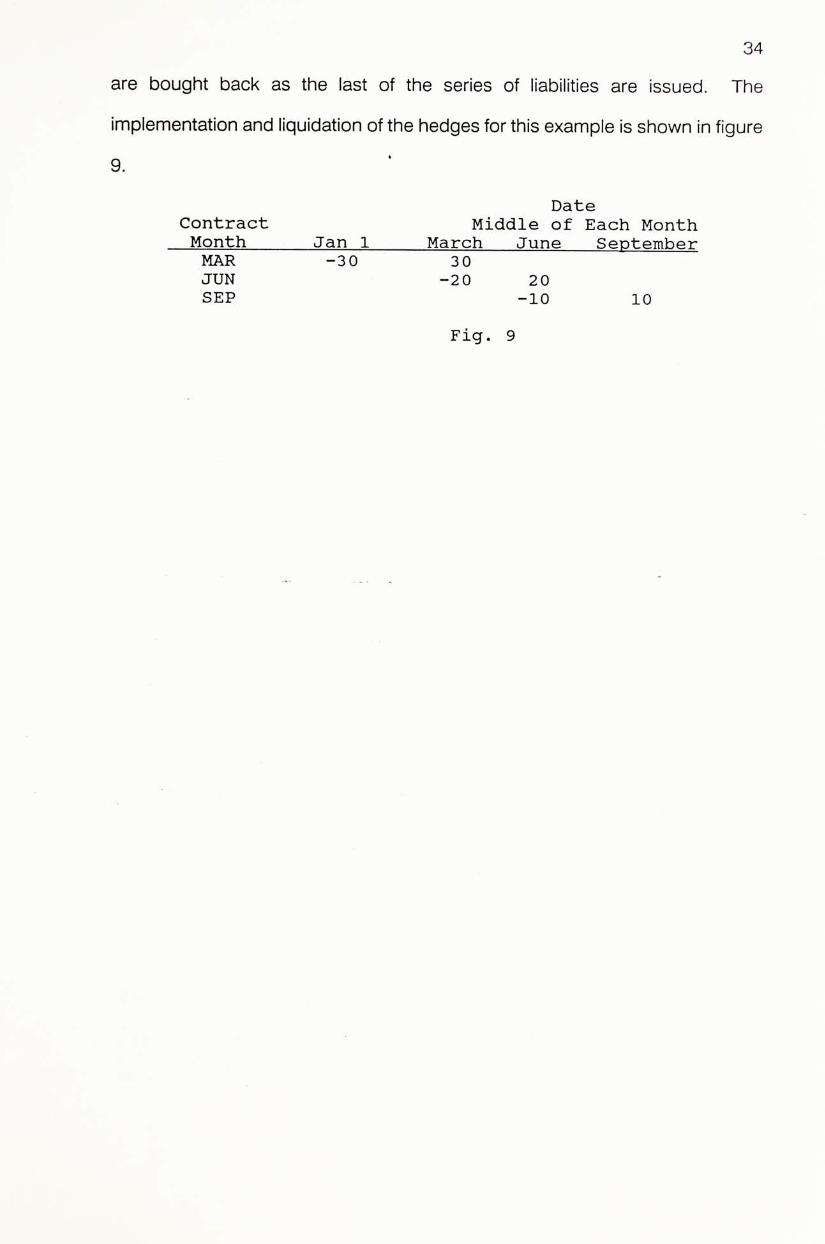
34
are bought back as the last of the series of liabilities are issued. The
implementation and liquidation of the hedges for this example is shown in figure
9. ‘
Date Contract Middle of Each Month Month Jan 1 March June September MAR -30 30 JUN -20 20 SEP -10 10
Fig. 9
35
«
CHAPTER VI
OPTIONS AND FUTURES
This chapter focuses on the similarities and differences for options and
futures. Return characteristics of both will also be covered. It is then followed
by discussion on the merits and demerits of using options and futures in
hedging the gap.
Similarities and Differences
Options and futures share some similar characteristics. First, both
options and futures prices are linked to the prices of the underlying
instruments. Second, the prices of options and futures contracts are related to
other common factors such as short-term interest rates and the income of the
underlying instrument. Third, both options and futures have a limited life.
Finally, both have contracts established by an exchange and are guaranteed by
a clearinghouse.
Options and futures also have important structural differences that make
them each uniquely suitable for different types of traders and investors. First,
the initial cash flow is greater when buying options, representing the maximum
loss on the position. For futures a deposit is required when a position is
initiated. Second, in the futures markets losses and gains are realised daily.
36
In contrast, for purchasers of options contracts, gains and losses are not
realised until the positions are offset or exercised. Third, for futures, delivery is
only possible on specific dates in the delivery month depending on contract
specifications, whereas option delivery can occur at any time in the life of an
American option.
Options and futures can be further evaluated by considering both the
expected return and the expected risk. Comparing the return distribution of a
portfolio hedged with futures and with options, we find that futures cannot
change the fundamental nature of the portfolio's return distribution. 丁he
distribution of returns of a fully hedged portfolio has a smaller dispersion and
is therefore less risky.
Buying put options, on the other hand, can protect the value of a
position and also change the distribution of returns favourably. Put protection
eliminates large losses while retaining the possibility of gains. This insurance,
however, has a cost which is the put premium. The payment of this premium
adds a cost to the portfolio that effectively reduces returns relative to those of
an unprotected position. Consequently, this strategy establishes an acceptable
minimum return in sdvsnce.
In a similar fashion, selling call options limits the return distribution on
the upside, but increases the probability of returns close to the average or
expected return.
Options, like futures, also present an opportunity to use a high degree
of leverage to speculate on expected price movements in the underlying
instrument. The cost of options is higher than futures initially, but the
speculator does not need to mark-to-market and can never lose more than the
initial cost.
37
By employing options strategies, the holder is exposed to limited risk at
a cost that is known at the start. This situation differs from that for futures »
positions with their mark-to-market requirement. Options contracts also tend
to be available in smaller units than futures contracts, which makes options
more suitable for investors with limited capital. Futures markets are popular
because of their liquidity and low trading cost per transaction.
Merits And Demerits
The primary advantage of using futures in a hedging program is that
they are flexible. Furthermore, the futures markets are very efficient markets,
offering tighter bid/ask spreads than the cash markets. This is due to the large
number of participants in the market with opposing motivations and rationales,
as well as the enormous liquidity available.
In addition, the low credit risk of futures contracts which is due to the
clearing corporation system, adds to the attractiveness of using futures
contracts.
Nevertheless, it is important to note that there are some potential
drawbacks. The main one is a possible negative cash flow from the hedger
to the futures market in meeting "margin calls." During extremely volatile
market conditions this could be of considerable consequence to the hedging
institution.
Another alternative to the cash markets is options on futures. An option
potentially offers many of the advantages of hedging with futures while
eliminating margin calls. But there is a premium to be paid for the limited risk
^ f p 、 � � • . ‘ J^rr^tM^..� • qo , ^ ^ ^ ^ . .. : : 3 8
� - � ” 、 “ ‘ ^ o f options. U ^ p ' ^ f f l m s in hedging programs could increase the cost of the K
I Wh^^^T hedge coff^pedi to using futures outright. ^ ^ ;
『•“: ’ - I 拿 :厂、: . . .:: I
1 : 已 = i S f �
辟: 〜 々 \ W • . • , ft? •LI k i ^ - ^ m
WW •• r • • T b- I, K -�,. • • - .:•• , - " i " ' - , - ‘ 、 . . . ?•••々.:' • 。 : ri ^ / ^ . — m
•• 、•• ''• � ty 锋 . : I 二 . "V ^ : r , .. ‘ >: - F
- J � �� . • : . : ‘. , � S ^ •• • ;. .、 ” - ‘ . , . iu p - • . � . ^ ^ ^ ^ fl"." . .
- . a u -• ! I . ’' ; . •
. • • • - - • •
r- • . ‘ • .- • ^ • “ ' .. . “ . “ g _• • • _.- “ .-. V., r � u L •“ • • - - ’ . 丁 - ’ 二 - • - . , ‘ V . - • ™ 2
‘ - � • - . . - � � • •� - ‘ , - . . � - . ^ J "Ti" •讓 . 3 • , , • ~ ... X • . 3 I •• • ‘ -一 . . ‘ S. . . _ .
• - • • ‘
n • w • ^ , J IL- . ] � - • ^ •-.
• “ > 、 • ‘ � : , -llr̂"-- . . ” , 、 - ’ • , J : • - …- �-r . -& •、•• k : � •• • • _
“ I I I -1 I V, . . . . . . k,,-.
r 、 . .. 1 — • —- . - . • • • , • � — 丫 ’ ‘ . i . ‘ • •- - “ • . - - .. • • . -
� � . y ^ . � � � . - . ' � - • � / - . : , . . : � ; • � �: • . . . � - � � . � - . : 、 � . r - l . � • � . - _ ) . . - .. . • ‘ ‘ 1 ‘ : . - •- - : ‘‘ • ..
t ^ " ::?:、, : ... ;. - . .:.:‘。• : . - 二
、 : : : 、 - 产 、 • 凑 丄 ; : ‘ : • - 上 : 「 . ,•丄.?i、: - ‘ . ’’ . V • • r^i^j � . � , � � : �—— •“.
. • . . ‘ . . . 、 ?: .Y. • " . , � -
〜 「 “ ‘ — - ? . -
[ V v ^ ^ � ‘� : : . .: : V : 、
' • I & ^ ^ � � � • I �� : • : : : 、 t
惑、: . 0
39
鲁
CHAPTER VII
REASONS FOR HEDGING ‘ •• . ” .. ., • “ • •• . :, , -sj:'‘
As mentioned earlier in previous chapters, taking a new position in cash
market is also an appropriate decision apart from futures and options hedging
in asset/liability management. Nevertheless, manager may still participate in
hedging. The reason is that hedging may be more appropriate in certain
cases. The following part will focus on the merits of hedging.
Merits
Hedging is more attractive when it is under the following two conditions.
They are:
First, hedging is preferable in dealing with the unanticipated fluctuation
in interest rates when portions of the portfolio are not active in cash market or
because the size of the position is so large that taking a new position in the
cash market could only be accomplished at a seriously depressed value.
Second, when the yield curve is upward sloping, the return generated
from the reinvestment of the liquidated excess assets (positive gap) would be
less than the forthcoming accrual of interest associated with the existing
positive gap. In that case, the perfect hedge on the asset would protect the
capital value of the asset while it would allow interest to accrue.
40
Demerits
Nonetheless, hedging does not promise a perfect performance. It is
because the hedge construction assumes that the yield relationship between
the cash position and futures position is known and can be manipulated by
employing a correct hedge ratio.
Furthermore, there are cross hedge basis risk and time basis risk in the
hedging process. Thus, perfect hedge is not possible.
In addition, a secondary risk deals with the nature of a futures contract
and the cash flow obligation that is inherent in its use. Once the hedge is in
place, as the futures price changes each day, the change in the value of
futures contract is passed between the two parties to the trade, making the use
of the exchange's Glearing house as an intermediary.
In the case of the gain in futures position (loss in the hedged position)�
the hedger would receive the changes in the value of futures contracts due to
the price change. This "variation margin" could be reinvested and hedge
results would be enhanced. Unfortunately, the opposite can occur with
detrimental effects. As the hedge losses, opportunity costs is associated with
financing these losses. Moreover, even though losses on futures might
ultimately balance gains on the cash position, the benefit accruing on the cash
side often is not realised long until after the variation losses have been paid.
Owing to the high-leverage nature of the futures contract, the cash flow
requirements of the losing futures position may be quite disappointing. In
contrast, in the case of using options, a premium has to be paid at the very
beginning which constitutes to a less return but a better risk structure is
obtained

41
In short, the manager's most prudent course is to evaluate both taking
a new position in the cash market and hedging the position using options or
futures and then choose the alternative that provides greater advantage.
. • : . . . .
42
CHAPTER VIII
THE SITUATION IN HONG KONG
丁his chapter explores the gap management activities in Hong Kong by
summarizing the interviews conducted with the six different users in financial
institutions located in Hong Kong. The chapter starts with the description of
gap management activities in H〇ng Kong which is followed by the discussion
of the popularity in trading futures and options.
During the interviews, all the interviewed gap management users agree
that they will either liquidate in cash market or hedge in the futures and options
market. The reason for them to hedge is that it is difficult to liquidate their cash
positions when they are of large amount. Thus hedging in futures and options
market is quite popular in Hong Kong.
Nonetheless, they do not attempt to perform perfect hedge. This is due
to the fact that they want to take profit from the gap exposure by predicting the
trend of interest rate. As regards the popularity of hedging, they believe that
hedging activity also depends on the speculative activity. For the later helps to
improve the liquidity of futures and options market.
From the interviews,the interviewees believe that trading activities in
futures and options markets will die out in the future and this will lead to poor
liquidity in these markets. The reasons for this are as follows:
43
First, high volatility. Owing to the volatile futures and options markets,
it is difficult for the trader to take large profit. In other words, he needs to
square his position after obtainirrg a small profit. Thus it is not profitable to
trade in these markets.
Second, different time zone. Since the trading in Eurodollar market
depends on the news from the United States, the movement of Eurodollar
futures and options during the Hong Kong time zone is small. As a result,
trading Eurodollar futures and options in Hong Kong is not profitable and is
risky. Furthermore, the news released from the states do not reach Hong
Kong fast enough for the trader to make decisions. Thus the futures and
options trader in Hong Kong is in an unfavourable situation. These account for
the drop in the popularity of futures and options markets.
Third, lack of expertise. All the interviewees agree that Hong Kong does
not have enough expertise in trading futures and options. Since futures
became popular two years ago, the most experienced traders in Hong Kong
have only got two to three years of experience. This experience is still not
enough for a futures trader. The situation in trading options is even worse for
it is a new product and the trader in Hong Kong cannot keep up with the new
techniques developed in. the states. Furthermore, the emigration problem
further decreases the number of experienced traders in Hong Kong.
Fourth, loss in futures and options. Since most of the financial
institutions in Hong Kong lost a lot of money in futures and options trading two
years ago, they closed their books and did not enter the market again.
Although the trading in futures and options dies out, the interviewees still
believe that the hedging in futures and options will still be carried out in the
future because of the importance in hedging the gap for the institutions. The
44
interviewees commented some problems in using futures and options to hedge
the gap, however. These problems are as follows.
First, lack of liquidity in the back month '̂̂ . The trading volume in futures
and options markets for the back month is small. This leads to the difficulty in
hedging the medium and long term gaps.
Second, lack of expertise. Without the experienced trader, it is rather
difficult for the institution to use futures and options as the hedging tools.
Furthermore, it takes time to train up new staff.
Third, lack of sensitivity in options. The interviewees do not prefer to
hedge in options market for its insensitiveness to the fluctuation of interest rate
when compared with futures market.
As regards the use of Hong Kong dollar interest rate futures in hedging
the gap, all the interviewees believe that it is still not a popular hedging tool.
This is due to the poor liquidity in Hong Kong dollar interest rate futures market.
The trading volume of the nearby contract month is around 100 and that of the
back month is around 10. With this liquidity, it is very difficult to have a good
hedging program in Hong Kong interest rate futures market.
In short, all the users trust that the use of Eurodollar futures in hedging ‘
the gap is still popular in Hong Kong though the speculative activities in the
futures market will diminish in the future. They also think that hedging in
options market will not be popular in Hong Kong because of the lack of
expertise.
14�ack month refers to the contract month one year from now.
45
I
CHAPTER IX
CONCLUSION
Owing to the fluctuation of short term interest rate, banks have to
consider their assets and liabilities exposures to reduce their associated interest
rate risks. Accordingly, they can manage their asset/liability exposures by
either liquidating in cash market or hedging in futures and options markets. In
general banks will -§cr-to-hedge their gaps because of the difficulties in
liquidating a large amount of cash positions in the market. NonethTeless, banks
sometimes do leave their gaps o p e � to benefit from the anticipated fluctuations
in interest rate. In hedging their gaps, banks can employ either macro hedging
or micro hedging. In practice, small banks tend to do macro hedging because
of their poor access to secondary cash market.
As regards setting up a hedging program, we should consider the cross
hedge basis risk and time basis risk. To lower the cross hedge basis risk, a
suitable futures contract and an appropriate hedge ratio should be chosen. As
per the time basis risk, the change in convergence rate of the yield curve
affects the performance of the hedges. In this respect, a composite hedge
which is the weighted combination of the nearby and deferred futures
contracts, is presented to minimize the associated time basis risk. In addition,
stack and strip hedging strategies which are helpful in the management of a
series of liability issues, are also discussed.
46
Regarding the hedging activities in Hong Kong, Eurodollar futures is the
most popular money market tool employed in hedging by Hong Kong banks,
especially those that accept Eurodollar deposits. This is due to its good
liquidity and its off-balance-sheet product nature which minimize interest rate
risk exposure, and at the same time, ease the pressure of year-end balance
sheet exposure.
In contrast, the poor liquidity in Hong Kong interest rate futures market
makes Hong Kong dollar interest rate futures unattractive to the gap
management users. As fewer banks have the expertise to trade options,
Eurodollar options is then not a popular hedging tool employed by the Hong
Kong users. It is because options is a new product to them.
Nevertheless, options, in contrast to Eurodollar futures, provides greater
flexibility in terms of risk management than do combinations of cash and
futures instruments. It requires less manpower to manage once the option
contract is concluded. In contrast, the futures market is volatile; hence,
requires constant attention to monitor open positions. Nonetheless, due to the
complexity in utilizing a combination of option strategies to maximize the risk-
reward relationship and the high cost of premium in the case of call options,
banks are relatively inactive in using options as part of their portfolios.
In short, the gap management users' most prudent course is to evaluate
both taking a new position in the cash market and hedging the position using
options or futures and then choose the alternative that provides greater
advantage.
47
•
APPENDIX I
MONITORING OPTION PRICES
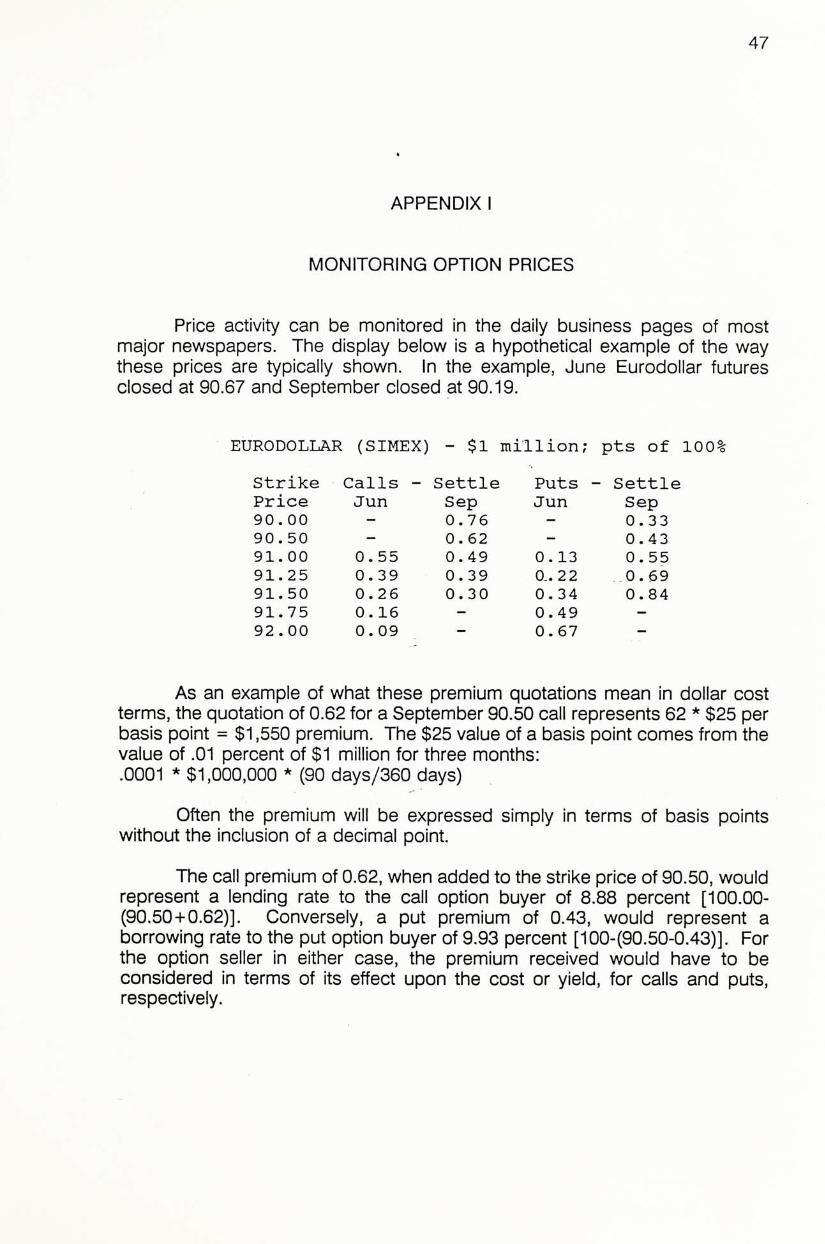
Price activity can be monitored in the daily business pages of most major newspapers. The display below is a hypothetical example of the way these prices are typically shown. In the example, June Eurodollar futures closed at 90.67 and September closed at 90.19.
EURODOLLAR (SIMEX) — $1 millionpts of 100%
Strike Calls 一 Settle Puts - Settle Price Jun Sep Jun Sep 90.00 - 0.76 - 0.33 90.50 - 0.62 一 0.43 91.00 0.55 0.49 0.13 0.55 91.25 0.39 0.39 0—.22 0. 69 91.50 0.26 0.30 0.34 0.84 91.75 0.16 一 0.49 -92.00 0.09 - 0.67 -
As an example of what these premium quotations mean in dollar cost terms, the quotation of 0.62 for a September 90.50 call represents 62 * $25 per basis point = $1,550 premium. The $25 value of a basis point comes from the value of .01 percent of $1 mil�ion for three months: .0001 * $1,000,000 * (90 days/360 days)
Often the premium will be expressed simply in terms of basis points without the inclusion of a decimal point.
The call premium of 0.62, when added to the strike price of 90.50, would represent a lending rate to the call option buyer of 8.88 percent [100.00-(90,50+0.62)]. Conversely, a put premium of 0.43, would represent a borrowing rate to the put option buyer of 9.93 percent [100-(90.50-0.43)]. For the option seller in either case, the premium received would have to be considered in terms of its effect upon the cost or yield, for calls and puts, respectively.
48
APPENDIX II
MONITORING FUTURES QUOTATIONS
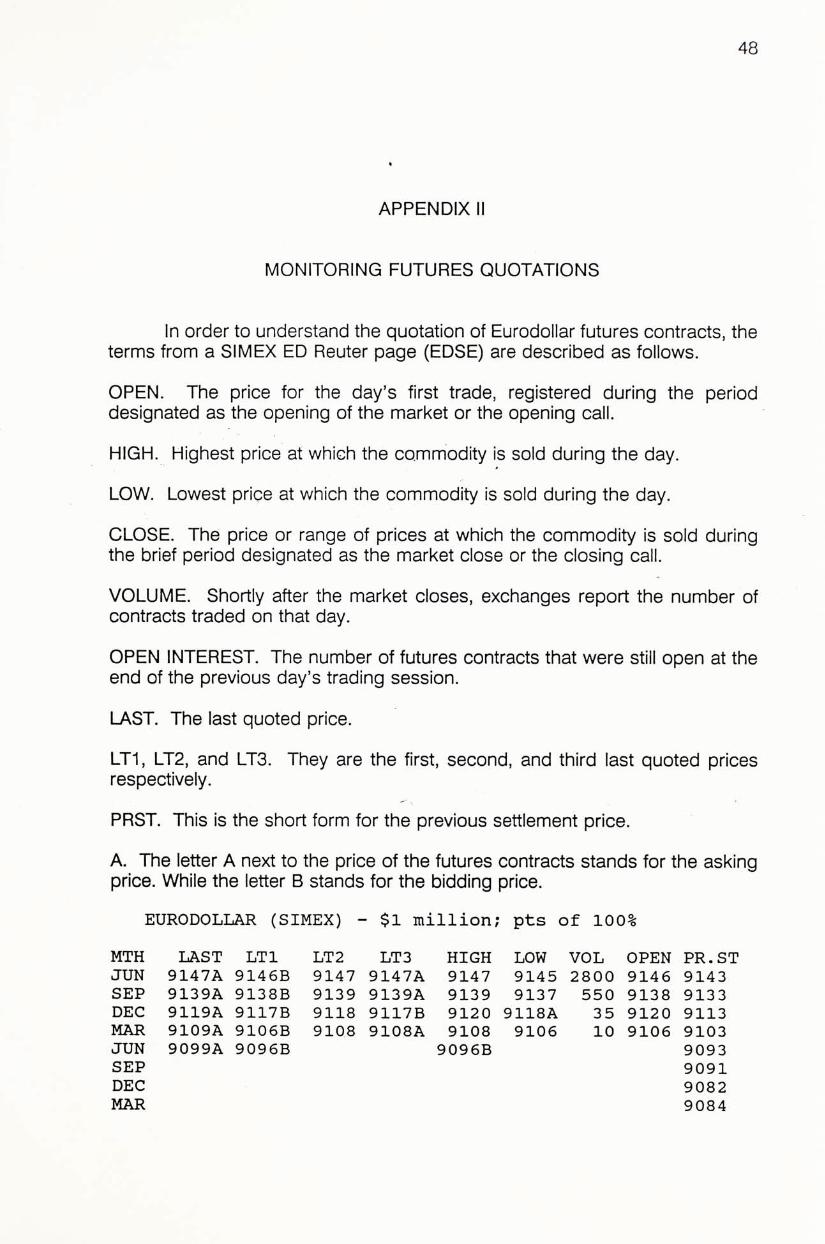
In order to understand the quotation of Eurodollar futures contracts, the terms from a SIMEX ED Reuter page (EDSE) are described as follows.
OPEN. The price for the day's first trade, registered during the period designated as the opening of the market or the opening call.
HIGH. Highest price at which the commodity is sold during the day.
LOW. Lowest price at which the commodity is sold during the day.
CLOSE. The price or range of prices at which the commodity is sold during the brief period designated as the market close or the closing call.
VOLUME. Shortly after the market closes, exchanges report the number of contracts traded on that day.
OPEN INTEREST. The number of futures contracts that were still open at the end of the previous day's trading session.
LAST. The last quoted price.
LT1, LT2, and LT3. They are the first, second, and third last quoted prices respectively.
PRST. This is the short form for the previous settlement price.
A. The letter A next to the price of the futures contracts stands for the asking price. While the letter B stands for the bidding price.
EURODOLLAR (SIMEX) 一 $1 million; pts of 100%
MTH LAST LTl LT2 LT3 HIGH LOW VOL OPEN PR. ST JUN 9147A 9146B 9147 9147A 9147 9145 2800 9146 9143 SEP 9139A 9138B 9139 9139A 9139 9137 550 9138 9133 DEC 9119A 9117B 9118 9117B 9120 9118A 35 9120 9113 MAR 9109A 9106B 9108 9108A 9108 9106 10 9106 9103 JUN 9099A 9096B 9096B 9093 SEP 9091 DEC 9082 MAR 9084
49
BIBLIOGRAPHY
Books
Gordon, Gail, and Rebell, Arthur L. Financial Futures and ��vestment Strategy. Homewood, Illinois: Dow Jones-Irwin, 1984.
Hill, Joanne M.,Schneeweis, Thomas, and Schwarz, Edward W. F i � 3 � c i s i Futures: Fundamentals, Strategies, and Applications. Homewood, Illinois: Richard D. Irwin, Inc., 1986. 、
Hull, John. Options, Futures, and Other Derivative Securities. Englewood Cliffs, New Jersey: Prentice Hall Inc., 1989.
Jarrow, Robert A., and Rudd, Andrew. Option Pricing. Homewood, Illinois: Richard D. Irwin, Inc., 1983.
Jones, Frank J., and Krumholz, Beth A. Short Term Liability Hedging. Kidder, Peabody & Co., 1985.
Kaufman, Perry J. Handbook Of Futures Market. New York: John Wiley & Sons Inc., 1984. ‘
Melton, Carroll R.,and Pukula, Terry Vance. Financial Futures: Practical Applications For Financial Institutions. Reston, Virginia: Reston Publishing Company, Inc.,1984.
Periodical
Goodman, Laurie. "New Options Markets." Quarterly Review. Federal Reserve Bank of New York. Autumn 1983,p.35-47.
50
Interviews
Chin, Patrick K.K. Citicorp, Hong Kong. Interview, 23 April 1990. «
Chow, Anson LK. Marshalls (Hong Kong) 1983 Ltd. Interview, 12 April 1990.
Fung, Andrew. Citicorp, Hong Kong. Interview, 23 April "1990.
Harteam, Jeffrey P. Martin Bierbaum (HK) Ltd. Interview, 12 April 1990.
Hsieh, Sammy. Discount Corporation of New York Futures, Hong Kong. Interview, 12 April 1990.
Wong, Yu-May. Banque Indosuez,Hong Kong. Interview,27 April 1990.


CUHK L i b r a r i e s
• ••3Cn3b3