Embed Size (px)
Citation preview
The Use of Useful Daylight Illuminance (UDI) to Test New
Designs for Improving Daylight Performance of Office Buildings
in Dubai-UAE
By
Moana Ghazi Abu-Dakka
Student ID: 60032
Dissertation submitted in partial fulfillment of
M. Sc Sustainable Design of the Built Environment
Faculty of Engineering
The British University in Dubai
November-2009
Dissertation supervisor - Prof. Bassam Abu-Hijleh
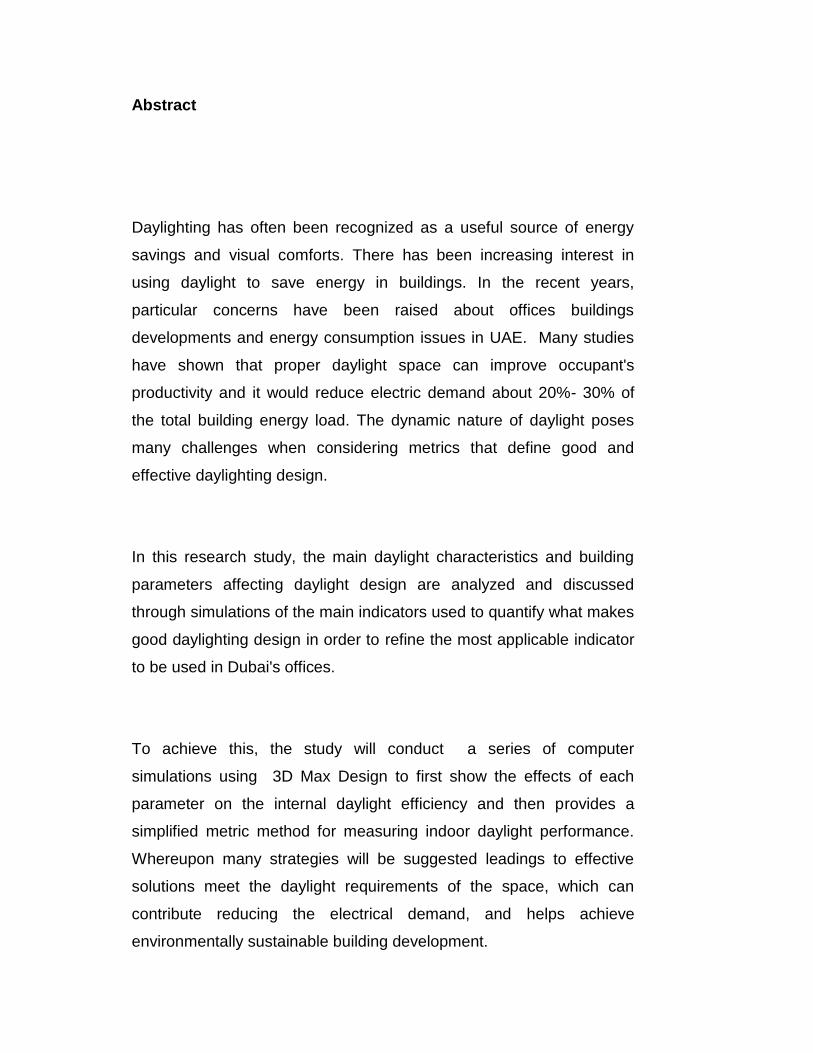
Abstract
Daylighting has often been recognized as a useful source of energy
savings and visual comforts. There has been increasing interest in
using daylight to save energy in buildings. In the recent years,
particular concerns have been raised about offices buildings
developments and energy consumption issues in UAE. Many studies
have shown that proper daylight space can improve occupant's
productivity and it would reduce electric demand about 20%- 30% of
the total building energy load. The dynamic nature of daylight poses
many challenges when considering metrics that define good and
effective daylighting design.
In this research study, the main daylight characteristics and building
parameters affecting daylight design are analyzed and discussed
through simulations of the main indicators used to quantify what makes
good daylighting design in order to refine the most applicable indicator
to be used in Dubai's offices.
To achieve this, the study will conduct a series of computer
simulations using 3D Max Design to first show the effects of each
parameter on the internal daylight efficiency and then provides a
simplified metric method for measuring indoor daylight performance.
Whereupon many strategies will be suggested leadings to effective
solutions meet the daylight requirements of the space, which can
contribute reducing the electrical demand, and helps achieve
environmentally sustainable building development.
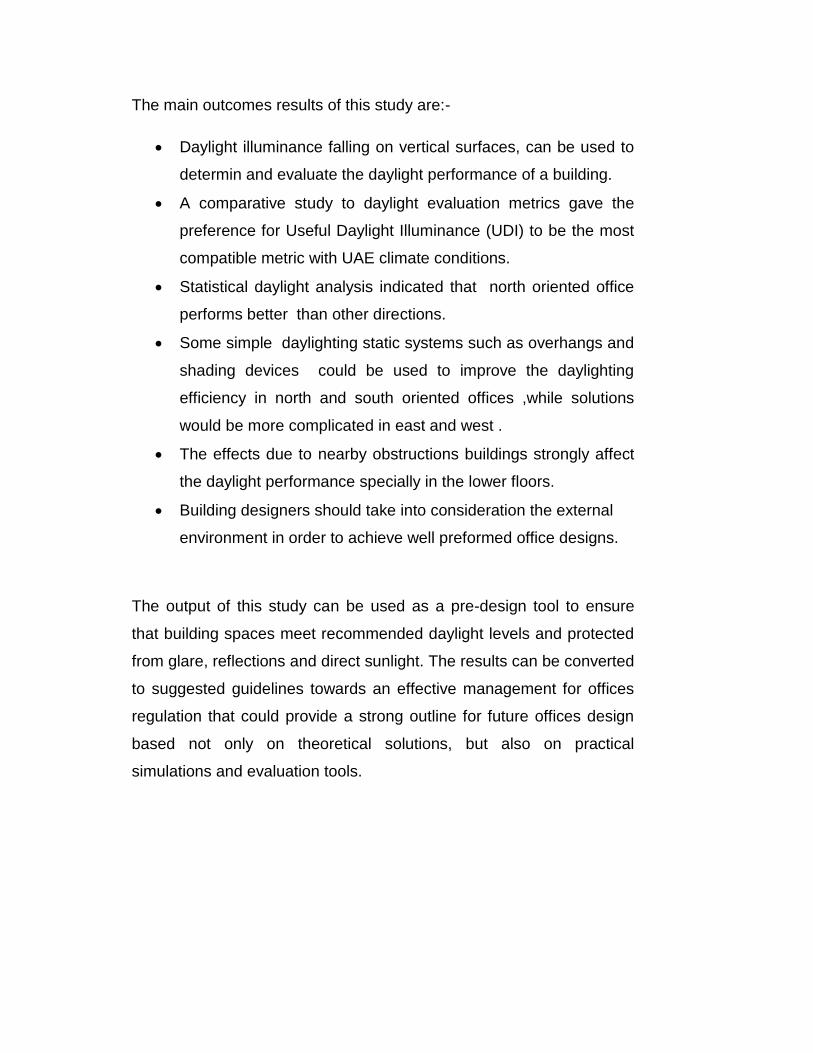
The main outcomes results of this study are:-
Daylight illuminance falling on vertical surfaces, can be used to
determin and evaluate the daylight performance of a building.
A comparative study to daylight evaluation metrics gave the
preference for Useful Daylight Illuminance (UDI) to be the most
compatible metric with UAE climate conditions.
Statistical daylight analysis indicated that north oriented office
performs better than other directions.
Some simple daylighting static systems such as overhangs and
shading devices could be used to improve the daylighting
efficiency in north and south oriented offices ,while solutions
would be more complicated in east and west .
The effects due to nearby obstructions buildings strongly affect
the daylight performance specially in the lower floors.
Building designers should take into consideration the external
environment in order to achieve well preformed office designs.
The output of this study can be used as a pre-design tool to ensure
that building spaces meet recommended daylight levels and protected
from glare, reflections and direct sunlight. The results can be converted
to suggested guidelines towards an effective management for offices
regulation that could provide a strong outline for future offices design
based not only on theoretical solutions, but also on practical
simulations and evaluation tools.
Acknowledgments
I would like to express my sincerest to my dissertation tutor, Prof.
Bassam Abu-Hijleh, for his wisdom, patients, and guidance. His
priceless suggestions made this work interesting and useful for me.
Many thanks for my parents for their encouragement, constant prayers
and continuing support.
Thank you whole heatedly to my wife, Amani for her love,
understanding and supporting me throughout the duration of preparing
this dissertation.
Finally, My sincere appreciations is expressed to my colleague, Eng
Emmanuel for assisting to edit the dissertation.
Table of contents
Abstract ................................................................................................... i
Acknowledgments ................................................................................ iii
List of Figures .................................................................................... viii
List of Tables ...................................................................................... xiv
Chapter1 - Introduction
1.1 Sustainability and Energy consumption in buildings ............. 1
1.2 Daylight and Sunlight .................................................................. 2
1.3 Daylighting Benefits .................................................................... 3
1.4 Successful Daylight Design ........................................................ 5
1.4.1 Successful Daylight characteristics ........................................ 5
1.4.2 Direct Sunlight Tolerance ....................................................... 7
1.4.3 Integrated urban fabric and Daylight Design........................... 7
1.4.5 Solar Control ........................................................................... 8
1.4.6 Recommended daylight levels in offices ................................. 8
1.4.6 What is a high-performance building? .................................... 9
1.5 Daylighting and Dubai offices .................................................... 9
1.6 Motivation of the research ....................................................... 10
1.6.1 Justification ........................................................................... 10
1.6.2 Aims and Objectives ............................................................. 11
1.6.3 Questions to be answered through this research ................ 12
Chapter2 - Literature Review
2.1 Introduction to evaluation metric ........................................... 13
2.2 Static Daylight metrics(Daylight Factor)................................... 14
2.3 Dynamic Daylight metrics ....................................................... 19
2.3.1 Daylight Autonomy .............................................................. 22
2.3.2 Continues Daylight Autonomy ............................................. 23
2.3.3 Useful Daylight Illuminances ................................................ 24
2.4 Summary of Daylighting Metrics ............................................. 25
Chapter3 - Methodology
3.1 Different methods used in the past for daylight design ...... 27
3.2 Computer Simulation as Method of testing .......................... 31
3.3 Determine parameters of field investigations in line with
intent of the study ................................................................... 34
3.3.1 Direct and diffuse illuminance falling on vertical external
facades ................................................................................. 35
3.3.2 The Daylight performance of offices interiors ..................... 37
3.4 Identification of relevant case studies modeling and
characteristics ......................................................................... 37
3.4.1 Sheikh Zayed Road Modeling .............................................. 37
3.4.2 The Generic Office Design modeling ................................... 40
3.5 Model Simulation..................................................................... 43
3.6 Data Collection ........................................................................ 45
3.7 Analysis & Discussion ............................................................ 49
3.8 Summaries ................................................................................ 49
Chapter4 - Simulations and Discussion
4.1 Direct and diffuse illuminance falling on vertical external
facades
5
1
4.1.1 Outline of the simulation process ......................................... 51
4.1.2 Results and Analysis ........................................................... 53
4.1.3 Summary of results and findings for external facades . ....... 73
4.2 Simulation for internal daylight level in a generic office ..... 74
4.3 Useful Daylight Illumination(UDI) as evaluation metric ........ 79
4.3.1 UDI for North facing office ................................................... 85
4.3.2 UDI for South facing office ................................................... 89
4.3.3 UDI for West facing office .................................................... 94
4.3.4 Summary of results and findings for UDI tests in
different orientations .......................................................... 100
4.3.5 UDI for offices in different buildings shapes in different
levels within setback ......................................................... 101
4.3.5.1 UDI for offices in standard square building layout
(30X30m) at SZR ............................................................. 101
4.3.5.2 UDI for offices in proposed rectangular building
layout (15X60M) at SZR ................................................... 106
4.3.6 Summary of results and findings for UDI tests for
office in different building geometries and setbacks ........ 109
Chapter5 - Conclusion and Recommendations
5.1 Conclusions of illuminance falling on vertical external facades
tests ................................................................................................. 111
5.2 Conclusions of Daylight levels for a generic offices interiors
tests ................................................................................................. 112
5.3 Conclusions of UDI evaluation metric for internal office
performance. .................................................................................... 113
5.3 Recommendations for future studies ........................................ 115
References ......................................................................................... 116
Bibliography ...................................................................................... 121
Appendix A Full Excel calculations for Test S.1 (page62) as an
example of illuminance falling on vertical external
surfaces tests.
Appendix B Full Excel calculations for Test S.1 (page89) as an
example of (UDI) internal Tests for Different office
parameters.
List of Figures
Figure page #
Figure 2.1 Different components of the split
fluxmethod (www.squ1.com).
Figure 2.2 DF analysis for Burjuman Offices Tower
using Ecotect CIE overcast sky
(Aboulnaga 2005).
Figure 3.1 The Waldram diagram as daylight
testing method (www.waterslade.com)
Figure3.2 BRS Sky Component Protractor for
Horizontal Glazing
(personal.cityu.edu.hk)
Figure 3.3 Artificial sky dome at Welsh School of
Architecture (www.cardiff.ac.uk)
Figure 3.4 full-scale test rooms in (BRE) (Christoph
Reinhart 2009)
15
18
28
28
30
33
Figure 3.5 Shiekh Zayed Road the most attractive
and prestigious spot in the Middle East
(www.dubai.ae)
Figure 3.6 (right)Google earth survey show a 78%
of SZR offices building s have a
square Geometry while 12% were
rectangular , 6% circular and 4%
triangular. (www.googleearth.com) and
(left) Arial view for SZR
(www.dubai.ae).
Figure 3.7 (left) rendered image for SZR model by
3D Max Design, (right) false color
render for SZR represent illuminance
measurements for different surfaces in
the model.
Figure 3.8 Ecotect model indicating for SZR
orientation and sun path
Figure 3.9 (right) 78% of Towers at SZR have
30X30m plan with 10 meter setback.
(left) upside view between two
buildings in SZR shows the small
separation distance between buildings.
(personal archive 7/2009).
Figure 3.10 Standard office building layout plan in
SZR.
39
40
41
42
Figure 3.11 Generic office Section and window
elevation.
Figure 3.12 Process method for Daylight simulation
using 3D Max Deign.
Figure 3.13 Real image render is one of simulation
output formats by 3D Max Design.
Figure 3.14 Different types of daylight measurements
presentation by 3D Max Design. (left &
right up) represent data measurements
for SZR as false gradient color
rendering ranged from blue for the
lowest value to red for the highest
illuminance value, (left down) represent
overlay grid data measurements
covering the whole image, (right down)
shows overlay grid data measurements
on some selected surfaces in SZR
model.
Figure 3.15 Research methodology stages.
Figure 4.1 (left)four grid light meters were placed
on SZR different towers.
Figure 4.2 Test N.1 daylight illuminance falling on
North surface of The Index Tower
without shading protections.
57
58
Figure 4.3 Test N.1 Vertical illumnation falling on
North surfaces
(The Index Tower Dubai-UAE 9:00
am).
Figure 4.4 Test N.1 Vertical illumnation falling on
North surfaces
(The Index Tower Dubai-UAE 12:00
pm).
Figure 4.5 Test N.1 vertical illumnation falling on
North surfaces
(The Index Tower Dubai-UAE 4:00
pm).
Figure 4.6 Ecotect graph represent sun path
during the year. June path is yellow
highlighted when the sun getting its
maximum position towards North
direction causing some daylight
fluctuations.
Figure 4.7 Test N.2 daylight illuminance falling on
North surface of The Index Tower with
50cm projection from slab level.
Figure 4.8 Test N.2 vertical illumnation falling on
North surfaces
(The Index Tower Dubai-UAE 9:00
am).
Figure 4.9 Test N.2 Vertical illumnation falling on
North surfaces
(The Index Tower Dubai-UAE 12:00
pm).
Figure 4.10 Test N.2 Vertical illumnation falling on
North surfaces
(The Index Tower Dubai-UAE 14:00
pm)
Figure 4.11 TestS.1 daylight illuminance falling on
South surface of The Index Tower
without shading protection.
Figure 4.12 Test S.1 Vertical illumnation falling on
north surfaces
(The Index Tower Dubai-UAE 9:00
am)
Figure 4.13 Test S.1 vertical illumnation falling on
South surfaces
(The Index Tower Dubai-UAE 12:00
pm)
Figure 4.14 Test S.1 vertical illumnation falling on
South surfaces
(The Index Tower Dubai-UAE 4:00
pm)
Figure 4.15 Ecotect graph represent sun path
during the year .March and December
paths are yellow highlighted when the
sun located closest to south and
taking the shortest path causing
excessively high direct illuminance on
south facade.
62
63
63
64
64
Figure 4.16 Test S.2 daylight illuminance falling
on South surface of The Index Tower
with a 50 cm projection from slab
level.
Figure 4.17 Test S.3 daylight illuminance falling
on South surface of The Index Tower
with a 50 cm projection 1 meter below
slab level (1.2 meter above work
plane level).
Figure 4.18 Test S.3 Vertical illumnation falling on
South surfaces
(The Index Tower Dubai-UAE 9:00
am)
Figure 4.19 Test S.3 vertical illumnation falling on
South surfaces
(The Index Tower Dubai-UAE 12:00
pm)
Figure 4.20 Test S.3 vertical illumnation falling on
South surfaces
(The Index Tower Dubai-UAE 4:00
pm)
Figure 4.21 (left) Test W.1 daylight illuminance
falling on West surface of Al Attar
Tower without shading protections
(right) Al Attar western facade at SZR
(personal archive, August 2009).
Figure 4.22 Test W.1 vertical illumnation falling on
West surfaces
(Al Attar Tower Tower Dubai-UAE
9:00 am)
67
68
Figure 4.23 Test W.1 vertical illumnation falling on
West surfaces
(Al Attar Tower Dubai-UAE 12:00 pm)
Figure 4.24 Test W.1 vertical illumination falling
on West surfaces
(Al Attar Tower Dubai-UAE 4:00 pm)
Figure 4.25 Ecotect graph represent sun path
During the year . Horizontal shading
devices are ineffective against the
early morning or afternoon sun as the
sun located at very low angel at that
time.
Figure 4.26 (left) Test SB.1 daylight illuminance
falling on Side facade of Al Mousa
Tower on the 10-meter setback
surface, (right) Al Mousa Tower at
SZR (www.dubai.ae).
Figure 4.27 Yearly average diffuse illuminance
falling to Al Mousa Tower on the 10-
meter setback side facade, from roof
to ground level.
Figure 4.28 UDI metric graph example giving data
about the percentage of year that
every meter in the office achieving
UDI, HDI and LDI
Figure 4.29 UDI for North oriented office and flush
glazing facade with glass VT 70%.
Figure 4.30 UDI for North oriented office, 40cm
recessed glass and glass VT 70%.
86
87
Figure 4.31 UDI for North oriented office, 40cm
recessed glass and glass VT 70%
for the lower panel and clear glass for
the upper part.
Figure 4.32 UDI for North oriented office, 40cm
recessed glass and glass VT 70% for
the lower panel and clear glass for the
upper part with 40 prjection fitted
along the glazing partition.
Figure 4.33 UDI for South oriented office . Flush
glazing facade with Glass VT 70%.
Figure 4.34 UDI for South oriented and 40cm
recessed glass .Glass VT is 70% in
the lower panel, and upper panel is
clear glass panel.
Figure 4.35 UDI for South oriented office, 40cm
recessed glass with glass VT 70% for
the lower panel and clear glass for the
upper part .50cm projction fitted along
the glazing partition.
Figure 4.36 UDI for South oriented office, 40cm
recessed glass with glass VT 70% for
the lower panel and clear glass for
the upper part with 50cm projection
fitted to outside and 50 cm projection
to inside the office.
Figure 4.37 UDI for North oriented office, 40cm
recessed glass and glass VT 70% for
the lower panel and clear glass for
the upper part with 50 prjection fitted
along the glazing partition and
serious of 50cm vertical shadings.
Figure 4.38 UDI for West oriented office. Flush
glazing facade with Glass VT 70%.
Figure 4.39 UDI for West oriented office , VT 70%
for lower panel glass, and upper
panel is clear glass panel.
Figure 4.40 UDI for West oriented office , VT 70%
for lower panel glass, and upper
panel is clear glass panel with 50cm
projection.
Figure 4.41 Ecotect graph shows sun path during
the year. Horizontal shading devices
are useless against the morning or
afternoon sun as the sun located at
very low angel at that time.
Figure 4.42 UDI for West oriented office , VT 70%
for lower panel glass, and upper
panel is clear glass panel with
vertical shading rotated towards
north direction.
Figure 4.43 UDI for West oriented office , VT 70%
for lower panel glass, and upper
panel is clear glass panel with
dynamic movable vertical shading
system open at morning times and
close afternoon.
Figure 4.44 Rectangular plots of SZR (40mx90m)
used as front 30X30m as tower
giving only 10 meter as separation
distance to neighbor. While 60 meter
94
95
96
96
97
98
in the backside is used as parking
lots or facilities areas.
Figure 4.45 Standard office is placed in Al Mousa
Tower Side elevation in high floor
level and UDI results are represnted
in the chart.
Figure 4.46 Standard office is placed in Al Mousa
Tower Side elevation in
intermeadiate floor level and UDI
results are represnted in the chart.
Figure 4.47 Standard office is placed in Al Mousa
Tower Side elevation in low floor level
and UDI results are represnted in the
chart.
Figure 4.48 Standard office is placed in Al Mousa
Tower Side elevation with full clear
glass facade in low floor level and UDI
results are represnted in the chart.
Figure 4.49 Standard office is placed in proposed
rectangular Tower layout in Side
elevation in high floor level and UDI
results are represnted in the chart.
Figure 4.50 Standard office is placed in proposed
rectangular Tower layout in Side
elevation in intermediate floor level
and UDI results are represnted in the
chart.
Figure 4.51 Standard office is placed in proposed
rectangular Tower layout in Side
103
104
105
106
107
elevation in low floor level and UDI
results are represnted in the chart.
Figure 4.52 Standard office is placed in proposed
rectangular Tower layout on Side
elevation in lowe floor level and clear
glass seleation . UDI results are
represnted in the chart.
List of Tables
Table Page
#
Table 3.1 partial excel sheet layout produced by 3D
Max Design daylight simulation.
Table 4.1 3D images renders for the current
situation on Sheikh Zayed Roadwith
three readings at 9:00am, 12:00pm
and 4:00pm in four seasonal
months(March, June, Sep, Dec).
Table 4.2 Daylight illuminance values for the
same simulation are presented by
false gradient colors with a scale
ranges from 10000 lux in blue to
80000 in red.
48
54
55
56
Table 4.3 Brief description of tests for the
illuminance falling on different
surfaces
Table 4.4 Upside view for Al Mousa Tower side
surface. Result values were presented
on the surface in four seasonal months
(March, June, Sep and Dec). Gradient
color ranges from 3000 lux in blue to
30000 in red. Light meter results were
shown as numbers on each figure.
Table 4.5 Internal simulations by 3Dmax Design
for West oriented office on for seasonal
months (March, June, September,
December) at two times 9:00am and
4:00pm .
Table 4.6 Partial excels sheet represent a
measurements been collected from
work plane level on March only.
Table 4.7 General description and classification for
UDI simulations.
78
84
1
Chapter1 - Introduction
1.1 Sustainability and Energy consumption in buildings
Recent economic revolution in the Gulf region particularly in Dubai,
United Arab Emirates (U.A.E) has led to a sharp increase in the number
of new buildings and buildings under construction. This revolution has
attracted many businesses to the region and increased job opportunities.
Furthermore, several facilities provided by Dubai government have
attracted global companies to Dubai. Accordingly, developers have given
priority to the construction of commercial buildings in Dubai. That rapid
progress for business in Dubai has increased Energy consumption
dramatically in the region. Increased demand for electricity is a very
critical factor particular for a region like UAE where the capacity to
provide renewable energy recourses is very limited. Energy efficiency
and strategies to reduce electrical demands that reduce the total power
consumption are two important priorities in Dubai efforts to reduce
customer bills for electricity.
Daylighting is an effective factor in interior design as it contributes to
occupant visual and thermal comfort, occupants’ productivity and energy
use in buildings. Energy savings would result from increased day lighting
efficiency due to reduced electric lighting consumption and due to
reduced cooling loads with possibilities of utilizing smaller heating and
air-conditioning (HVAC) equipment size.
In commercial buildings, electric lighting and cooling represent two of the
largest electric end uses. Li and Lam (1999) and Li (2007) revealed in
both studies that the effective daylight design solutions for electric lights
and air-conditioning accounts for over 70% of the total electricity
consumption in commercial buildings. Air-conditioning accounts for over
50% of the total electricity consumption in commercial buildings and
2
electric lighting comes second with 20–30%.Moreover; heat gain due to
electric lighting represents additional percentage of the total cooling load
during the hot summer months. Further later investigations (Li Lam and
Wong 2005) indicated that the daily energy savings in electric lighting for
open plan offices ranged from 1.1 to 1.7 kWh using simple daylight
controls. The estimated annual saving was 365 kWh, representing a 33%
reduction in energy use for the total electric lighting bill. Such results
clearly present the role of day lighting as a key objective for sustainable
building design that reduces the building energy consumption and
provides reliable long-term benefits, a useful indicator to developers to
incorporate the necessary design considerations at project onset.
1.2 Daylight and Sunlight
Daylight – “refers to the level of diffuse natural light coming from the
surrounding sky dome or reflected off adjacent
surfaces.” (www.squ1.com).
Sunlight, on the other hand, refers to direct sunshine and it is much
brighter than ambient daylight. The position of the sun changes
consistently as the day progresses. The way an individual views the sun
from any particular point, ie, whether clearly or obscured is effected by
presence or absence of clouds, buildings, topography, foliage, smog etc.
The sun also has a varying intensity at different times of the day and also
over the course of a year’s seasonal changes (www.squ1.com). New
Buildings Institute (2003) mentioned that daylight and sunlight
illuminance can vary by different locations, times and months.
Illuminance caused by sunlight can reach up to 10000lux while diffuse
sun light produces illuminance value between 5000 to 20000lux.
Moreover, the sun also provides effective radiation outside its visible
spectrum. Sunlight has potentially much more heat content per lumen
than daylight. Because of all these inconsistencies in daylight and in
3
sunlight, the sun is not the most reliable source for optimum lighting of
internal function spaces as these work best within specific ranges of light
intensity. e.g to obtain an optimum of 200-2000 lux at worktop level
within a typical office space. Furthermore, the sun’s intensity is such that
it can be a significant source of undesirable glare when falling on a work
surface or reflected off a computer screen. As a result, direct sunlight is
rarely included in architectural daylighting calculations.
Daylight, however, can be a very effective light source, even on the most
dark and overcast day, diffuse daylight is about 5 times more efficient
than a normal incandescent globe and as much as twice as efficient as a
fluorescent tube. In a typical office building, turning the lights off and
substituting daylight alone can reduce overall heat loads by as much as
40% (www.squ1.com).
Daylight levels also vary greatly depending on various factors such as ,
the amount of cloud cover, type of cloud and the time of day. However,
there exist mathematical models that allow the calculation of how bright
different parts of the sky will be under different sky conditions. These
models allow us to choose a set of worst-case situations around which to
design the building.
1.3 Daylight Benefits
Psychologically, the presence of controlled daylight, as has been
illustrated in several studies, significantly improves the overall attitude
and well-being of the occupants.
“Seasonal Affective Disorder” (SAD) and headaches are related to
insufficient light levels. Research carried out by Edwards and Torcellini
(2002) and Boyce et al (2003) pointed that use of daylighting decreases
the occurrence of headaches, S.A.D, and eyestrain. These ailments
occur less as the daylighting level improves by use of proper spectral
4
light. They further demonstrated that daylighting also has a positive effect
on the mood for employees which results in increased job satisfaction,
work involvement, motivation, organizational attachment, and lowered
absenteeism.
Other studies show that office workers’ productivity does increase with
the quality of natural light. Natural daylighting aids in increasing attention
and alertness during the post-lunch dip and has shown to be helpful in
increasing alertness for boring or monotonous work (Heerwagen et al
2000). Li and Lam (2001) studied the effects of windowless offices in
Hong Kong. Investigation results supported earlier findings (Heerwagen
et al 2000) that employees in windowless buildings had much less job
satisfaction and were substantially less positive. It was demonstrated by
the California Energy Commission (2003) that greater illumination level or
glare potential affects office worker performance by decreasing
performance by up to 15% - 21%. They further demonstrated that a
workers primary view had a positive relationship to performance only if
there was no glare potential from that view.
From an energy efficiency standpoint, Li et al (2005) investigation's
indicated the potential role that daylight plays in reducing electric
demands with up to 33% reduction in energy use for the total electric
lighting bill achieved simply by use sun shading protections.
The Collaborative for High Performance Schools (CHPS) (2006) pointed
out that day lighting can offer great energy savings due to reduced
electric lighting loads and in turn, reduced cooling loads. Electric lighting
can represent 40 to 50 percent of a building's total energy consumption
according to the U.S Green Building Council (USGBC). Turning off
unnecessary artificial lights makes a big difference in a company's utility
bill and bottom-line. The savings are further compounded because when
5
unnecessary electric lights are on, they generate waste heat that has to
be removed by a building's air conditioning system. This saves an
additional three to five percent in total energy consumption. Properly
designed daylighting can see a reduction in energy consumption for
lighting by up to 50 to 80 percent, according to the USCGB.
1.4 Successful Daylight Design
1.4.1 Successful Daylight characteristics and parameters
The CHPS Daylighting Committee (2006) presented the general
daylighting performance goals for day lit spaces. Outlined below are
characteristics they identified which represent successful day lighting
design:
Quantity , daylight should provide ambient lighting requirements
for the most of the year.
Quality , it has been believed that uniform distribution of daylight
helps in reducing uncomfortable high brightness ratios and aid in
controlling direct sunlight which causes glare .
Usability, daylight has to allow the user’s adjustment and override
and provide view and connection to the outdoors.
Building Integration, successful daylighting design must be fully
integrated with the architectural expression of the building inside
out and other building systems such as HVAC, Electrical, Lighting,
Structural, Interior elements.
Cost Effective, in order to convince investors on the benefits of
having a daylight efficient building, a daylight system must be
implemented within the overall construction budget of the project
and it should demonstrate achieving significant energy savings by
reducing lighting costs and electricity bill .
6
In order to achieve the mentioned daylight design characteristics, Li and
Tsang (2007) investigated the factors that a designer should consider
when designing an efficient daylight building. Li and Tsang (2007)
surveyed 35 offices building in Hong Kong to determine the main building
parameters affecting the mentioned Daylight characteristics designs. The
study indicated five key parameters affecting daylight design:
Lease Span: The lease span is the distance from a fixed interior
element, such as the building core, to an exterior window wall.
There is a need to concentrate on the lease span in tall office
buildings design as the quantity and quality of daylight can be
determined by the lease span distance.
Glass Type: Glass type controls the amount of daylight
penetrating into an interior in terms of light transmittance and heat
transmutation as well. Clear glass provides a high transmission of
daylight with typical visible transmittance (VT) of 0.88 but it also
allows a large amount of solar heat (high shading coefficient) to
pass through into a building. Tinted glass absorbs a considerable
amount of infrared light with some reduction of visible light with the
VT ranging from 0.23 to 0.51. Reflective glass absorbs more heat
than tinted glass and offers good reflecting characteristic in the
infrared region with a certain reduction of VT. The VT can be a low
of 0.12 with perfect heat protection but the rooms may look
gloomy especially with low illumination levels .With an average VT
values, occupants can enjoy more natural light as well as maintain
a good visual contact with the outdoor
Window Area : For a given glazing type, the critical factor
determining the daylight entering a building is the window area.
According to Li and Tsang (2007) study, the required window area
should be more than one-tenth of the floor area of the room in
order to get enough daylight illumination. Higher window heads
and wider spaces allow deeper plan room designs.
7
Shading: Shading devices shade the window from direct sun
penetration but may allow diffuse daylight to be admitted that aid
in have better distribution of light and prevent the internal spaces
from the heat caused by the direct sun radiation
External Obstruction: External obstruction influences the
daylighting performance in two aspects. First, is the amount of the
sky being obstructed or unobstructed by an adjacent building.
Second, the color of the external surface finish that can be
considered as the reflected luminance from neighboring buildings.
1.4.2 Direct Sunlight Tolerance
In offices, controlling direct sunlight is critical, it is important to consider
direct sunlight control strategies early in the design process to avoid
having to resort to more expensive solar control strategies, and less
integrated with the rest of the design. Offices could be oriented to the
north, where incident sunlight is minimal. Space layout is important, since
the location of interior walls can affect the direct sunlight and would
dictate the cutoff angles required. The Collaborative for High
Performance Schools (CHPS) (2006) pointed out the importance of
controlling solar gain by controlling the direct sunbeams penetrating any
space. Several strategies were suggested to achieve that purpose by
using different shading techniques such as recessed floors and the
strategic location of stairwells or less critical component to act as sun
shading elements.
1.4.3 Integrated urban fabric and Daylight Design
When considering introducing daylight into a building, surrounding
buildings and urban features should be considered in simulations and
solution strategies. Depending on specific site conditions, neighboring
buildings might obstruct daylight in some cases while in other cases they
could provide daylight through reflections.
8
1.4.4 Solar Control
The daylight in a harsh climate such as found in the UAE, is
characterized by high levels of solar radiation and intense sunlight
throughout the year. In order for a daylighting design to be effective in
improving the energy efficiency of a building, it is critical to consider solar
heat gain control of spaces.
1.4.5 Recommended daylight levels in offices
Within a typical office space, different task areas require different lighting
levels. It has been recommended by the Illuminating Engineering Society
of North America (IESNA) (2003) to use a range between 200 lux to 1500
as the optimum indoor lux ratings for regular office work in accounting,
auditing, business, detailed designing & drafting. IESNA suggested that
100 lux in corridors and stairways is sufficient for office occupants. There
is no sharp line to describe the quantity of daylight. Interior space’s
“darkness” or “brightness” varies across different researchers and
investigators, as the individual’s human eye factor is the only certified
scale for daylight levels.
Nabil and Mardaljevic (2006) suggested the term "useful daylight" for
the level of illumination between 200 lux and 2000 lux , with illumination
<200 accepted as too dark and illumination of <2000 lux considered too
bright. However daylight illuminance between 200-1000 lux was
suggested by many other investigators to be the convenient daylight level
(Selkowitz and Lee, 1998, Li, 2007 and Ko et al, 2008 ).
9
1.4.6 What is a high-performance office?
From the preceding discussion about daylight characteristics, parameters
and recommended daylight levels; high performance office can be
defined as one that :-
• Meets design objectives.
• Maximizes occupant comfort and productivity.
• Minimizes occupant complaints and tenant turnover.
• Maximizes building value to the owner.
• Yields a lifetime of energy efficiency and lower operating costs.
1.5 Daylighting and Dubai offices
The United Arab Emirates lies between latitudes 22°–26.5°N and
longitudes 51°–56.5°E It is described as the earth's sun belt. The yearly
solar radiation for the UAE is believed to be around 2,200 kilowatt hours
per square meter, and the direct illumination falling to the earth exceeds
90000 lux in summer, the second highest in the world (Al-Sallal and
Ahmed, 2007). Being on the tropic of cancer (24 deg N) results in that the
UAE region receiving the highest annual rate of solar radiation and sun
illumination. In such a harsh climate of the UAE, which is characterized
by high levels of solar radiation and intense sunlight, the design should
minimizes direct sunlight by means of shading and provides diffuse
daylight reflected from the ceiling.
Bhavani and Khan (2006) pointed that most buildings in the UAE are not
designed to achieve proper daylight level. In office buildings, many
10
offices have deep spaces that are lit from one side only. Many other
offices have a fully glazed facade facing east and west which creates
serious problems of high brightness contrast and acute glare that result
reducing visual comfort and in some cases causing health problems
such as headache and fatigue. Aboulnaga (2006) investigated the use
and misuse of glass as a building element in offices. He pointed out the
extensive use of large area of glazing in Dubai's offices facades without
the provision of any protection against overheating and sun glare in
summer. He also introduced simulations for 15 existing buildings in Dubai
to evaluate the current problem of misused glass. His conclusions
reinforced that Daylighting is a real problem in the UAE and that no
active solution have been identified. There are currently only suggestions
on what architects could do in the design process to achieve good
daylight distribution. Al-Sallal (et al. 2006), Al-Sallal (2007), Al-sallal and
Ahmed (2007) did recommended techniques that can help to redistribute
and filter daylight coming from windows and skylights in order to
overcome high brightness and glare problems in educational spaces in
the UAE.
In general Dubai designers suffer lack of necessary methods and user
friendly tools for environmental evaluation at an early stage of a design.
Therefore, there are few published works that are directly linked to the
specific topic of this research.
1.6 Motivation of the study
1.6.1 Justification
Architects involved in office design should consider many factors when
designing office buildings. It varies from urban surroundings or site
characteristics, orientation and architectural design of the building, choice of
building materials, shading technique, etc. These factors were not given
enough importance in Dubai because of:-
11
A lack of up-to-date knowledge among architects, planners
and engineers on often misunderstood concepts such as
day lighting, thermal capacity and thermal insulation
Considering daylight in design poses many challenges and
difficulties because of the dynamic nature of the sun.
The lifestyle and the inflation of Dubai Real Estate market
has driven people to turn to the easiest and fastest
solutions .
The lack of user-friendly, accessible appropriate simulations
soft wares.
The illusion that it is more expensive to build in a
sustainable manner.
In the few past years; as the consequences of “sick buildings” were being
felt together with the repercussions of global warming, people have
became more sensitive about health and well being. New knowledge
started permeating among people to find new energy recourses and to
use new strategies to reduce total energy consumption. Daylighting is
considered as an important and useful strategy in energy-efficient
building designs and operations. A proper daylighting planning can help
reduce electrical demand and contribute to achieving environmentally
sustainable building development.
1.6.2 Aims and Objectives
The main aims and objectives of this study are summarized as follows:
Investigate what makes a good daylight design and discuss broader
daylight characteristics and parameters.
Investigate Daylight Performance metrics to refine the most
consistent meter to be used in Dubai.
12
Establish criteria for what should be considered good,
adequate, or insufficient daylighting performance.
Demonstrate how UDI metric can be constructed and used as
a fast evaluating metric for different design solutions.
Define strategies to be applied to increase the day lighting
efficiency.
Propose a pre-design metric to ensure that building meets the
recommended daylight level and at the same time protected
from glare, reflections and direct sunlight.
Provide guidelines and recommendations to what designers
should include and focus on to design an effective office
space.
1.6.3 Questions to be answered through this research
Which daylighting performance metric that have been
proposed in the past can be reliable and Commensurate with
UAE climate conditions.
Which tools to use and what design elements to study
according to the variants investigations?
What are the systems and effective strategies that can be used
to enhance daylighting in offices?
13
Chapter2 - Literature Review
2.1 Introduction to evaluation metric
Evaluation performance metrics are supposed to be “quality measures”
for offices with respect to their energy efficiency, safety, quality of design,
and so on. It has been used by building designers in the past for
comparative studies to provide a guideline to analyze how effective
different proposed architectural solutions are.
Performance metrics provides a shortened summarized tool to read the
data measurements and get the conclusion in order to find the best
solution to be applied for the select strategies. They range from being
rather specific, for example, how well one office is oriented, to very
general, for example, how efficient a building is.
It has been very difficult however for designers in the past to post clear
daylight performance metric.
Reinhart et al (2006) pointed that there were two main reasons creating
this difficulty. The first reason is linked to the lack of unity on daylight
definition among the different fields of engineering. Architectural
engineers defined it as the interplay of natural light and building form to
provide a visually stimulating, healthful, and productive interior
environment .Lighting Energy Savings Engineers describe it as the
replacement of indoor electric illumination needs by natural daylight.
Building Energy Consumption pointed it as the use of fenestration
systems and responsive artificial lighting, while costing consultants
describe it as the use of daylighting strategies to minimize operating
costs and maximize output, sales, or productivity. Differences in
absorption for daylight scope became a forestation for designers that
14
which definition should be considered when they establish a performance
metric.
The second reason from the writer standpoint is the failure of green
building rating systems (like LEED and ASHRAE) in guiding design team
in implementing efficient day lighting evaluation metric. Besides the basic
guidance noted by the United State Green Building Council (USGBC) ,
no further detailed regulation has been provided and no metrics exist to
quantify the effectiveness of such solar control devices .The USGBC
does mention glare and thermal control as the common failures for
daylighting strategies. They recommend the use of shading devices as a
solution for these problems.
We note however that, there is no detail on how the designer can carry
out an effective self assessment on various proposed architectural
solutions on avoiding glare and direct sunlight. Due to the lack of an
efficient evaluation method, several key design parameters are
neglected, which puts some day lighting techniques at a subjective
disadvantage compared to others. This study tries partially to present
such evaluation tool.
2.2 Static Daylight metrics (Daylight Factor)
The use of Static daylight simulation came to reduce the number of
simulations needed, that was because this type of simulation neglect
season, time of day, direct solar ingress, variable sky conditions, building
orientation, or building location.
15
There presently are several static quantitative performance metrics in
use for the implementation of day lighting in office design. Each of these
metrics vary according to their definition of daylight and according to the
requirements of every area. This study will discuss the most common
quantitative metric (Daylight Factor).
Daylight Factor
Daylight factor (DF) is the most common parameter to characterize the
daylight situation at a point in a building. The Institute for Research in
Construction (2006) defined it as the ratio of the indoor illuminance at a
point of interest to the outdoor horizontal illuminance under a standard
uniform sky developed by the overcast Commission International de
l'Eclairage (CIE). Marsh,(www.squ1.com) defined it as the ratio of the
illumination at particular point within an enclosure to the simultaneous un
obstructed outdoor illuminance under overcast CIE sky condition
expressed in percentage.
Daylight factor enjoys considerable popularity since it is a quantity which
can be measured and/or calculated either based on calculation tables or
more refined simulation methods.
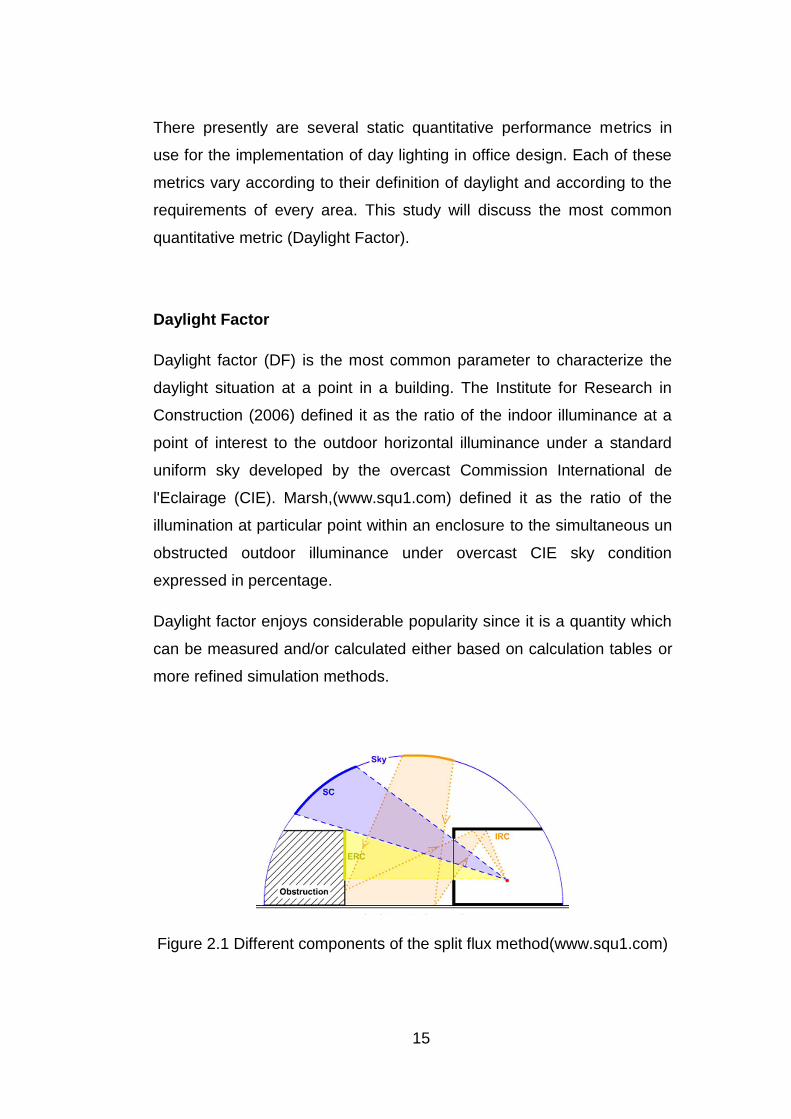
Figure 2.1 Different components of the split flux method(www.squ1.com)
16
The calculation of daylight factor depend on split flux method which
based on the assumption that, ignoring direct sunlight, as been shown in
Figure(2.1) the natural light reaches a point inside a building in three
ways:
Sky Component (SC).
Directly from the sky, through an opening such as a window.
Externally Reflected Component (ERC)
light reflected off the ground, trees or other buildings.
Internally Reflected Component (IRC)
The inter-reflection of (SC) and (ERC) off other surfaces within the
room.
The resulting Daylight Factor is given as a percentage and is simply
the sum of each of these three components:
DF = SC+ ERC+ IRC.............................................. (1)
The main weakness of daylight factor is that the orientation of the
investigated building does not influence the daylight factor since the CIE
reference sky is rotationally constant and independent of the
geographical latitude of the investigated building. Another shortcoming of
the daylight factor approach is that the underlying CIE overcast sky tends
to underestimate luminance near the horizon. (Reihart, 2006)
Consequently, illuminances in sidelit/toplit spaces are usually under/over
predicted. However, daylight factor is commonly used and provides a
feeling of how “bright“ or “dark“ the interior of a given building only is.
Since it is based on a single sky condition, its credibility to judge the
overall daylight situation in a given building in a given location and
orientation is intrinsically limited. The main barrier that hindered
researchers on investigating alternate metric is that daylight factor is the
same for all facade orientations and building locations. This is because
17
daylight factor does not consider season, time of day, direct solar
penetration, variable sky conditions, building orientation, or building
location.
The reduced variables allow researchers to diminish the number of
simulations needed to compare the efficiency of two different designs.
Morris (2002) confirmed that in his investigation to propose an optimum
classroom design. He accepted Daylight factor as an evaluating metric
justifying that as lighting conditions are changing continually , "absolute
sky illumination levels are difficult and often impossible to calculate and
determine a clear sky condition as the number of simulations will be in
need are too large to be carried by slow simulation engines" (Morris
2002).
Li and Tsang (2007) investigated the main building parameters affecting
daylight factor in offices in Hong Kong by conducting a series of Ecotect
simulation tests for 35 selected office towers. It would have been very
complex and unmanageable for them to carry out different simulations for
different skies in different times of the year for 35 buildings.
According to the BBC forecast the average of cloud coverage over the
year in Hong Kong exceed 70%, that is Hong Kong has an overcast sky
most of the year. This was a proper justification for Morris (2002) and Li
(2007) to use daylight factor metric with an overcast sky as the priority of
orientation comes last. For analysis of building in regions with
predominantly overcast sky it may not be worthwhile to run thousands of
simulations to determine orientation and other design factors into
consideration. This study is based in Dubai, U.A.E. According to the BBC
forecast the average of cloud coverage over the year in Dubai does not
exceed 9%. A daylight factor simulation analysis for a building in Dubai
cannot be based on an overcast sky condition as this would give grossly
inaccurate data. This study tries partially to present a more accurate
efficient tool that takes into account the realistic sky.
18
Aboulnaga (2005) conducted a quantitative analysis in Dubai's towers to
assess the impact of glass on the building users' performance in terms of
daylight environment. His investigation was to assess whether selected
glass provides the recommended daylight factor (DF) and daylight level
(DL). He ran many simulations using Ecotect to evaluate the misuse of
glass at different offices in Dubai. His results came to reinforce the
existence of very high level of (DF) and (DL) in some of Dubai offices. He
used the CIE overcast sky for his simulations, the only sky available in
Ecotect, his program of choice. As noted above, because the overcast
sky model neglects the unique characteristics of a locations atmosphere
and building orientation, his findings were inaccurate.
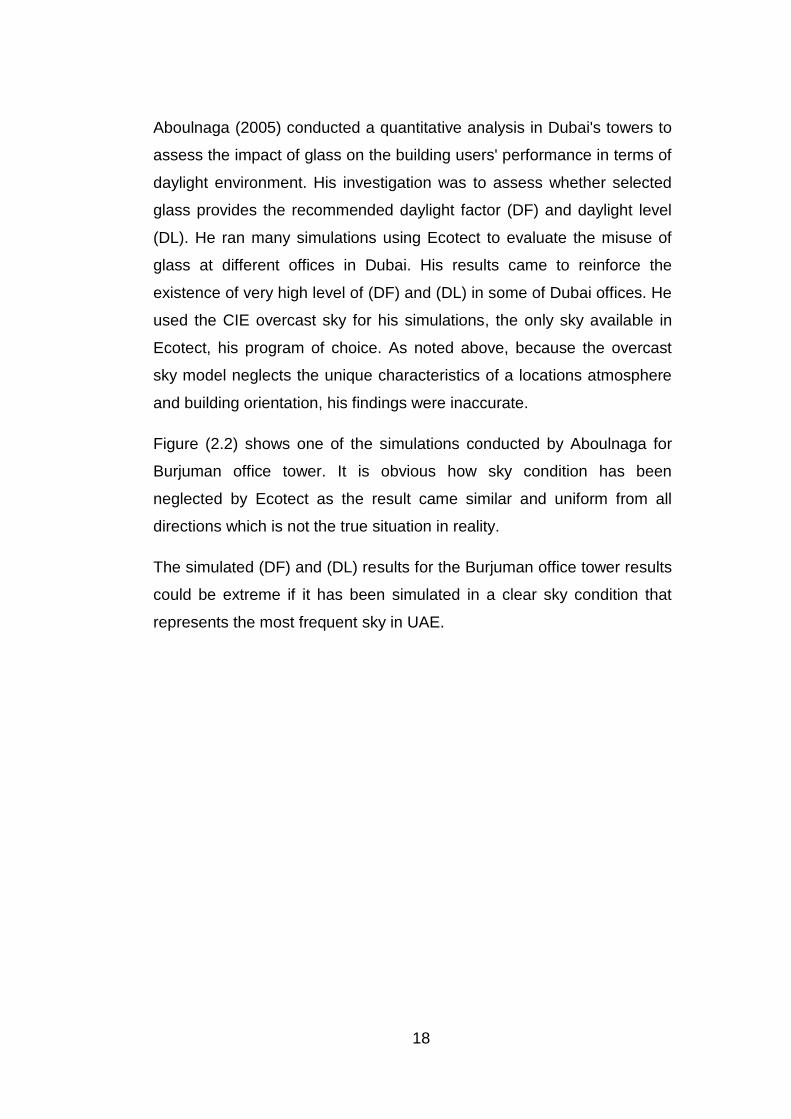
Figure (2.2) shows one of the simulations conducted by Aboulnaga for
Burjuman office tower. It is obvious how sky condition has been
neglected by Ecotect as the result came similar and uniform from all
directions which is not the true situation in reality.
The simulated (DF) and (DL) results for the Burjuman office tower results
could be extreme if it has been simulated in a clear sky condition that
represents the most frequent sky in UAE.
19
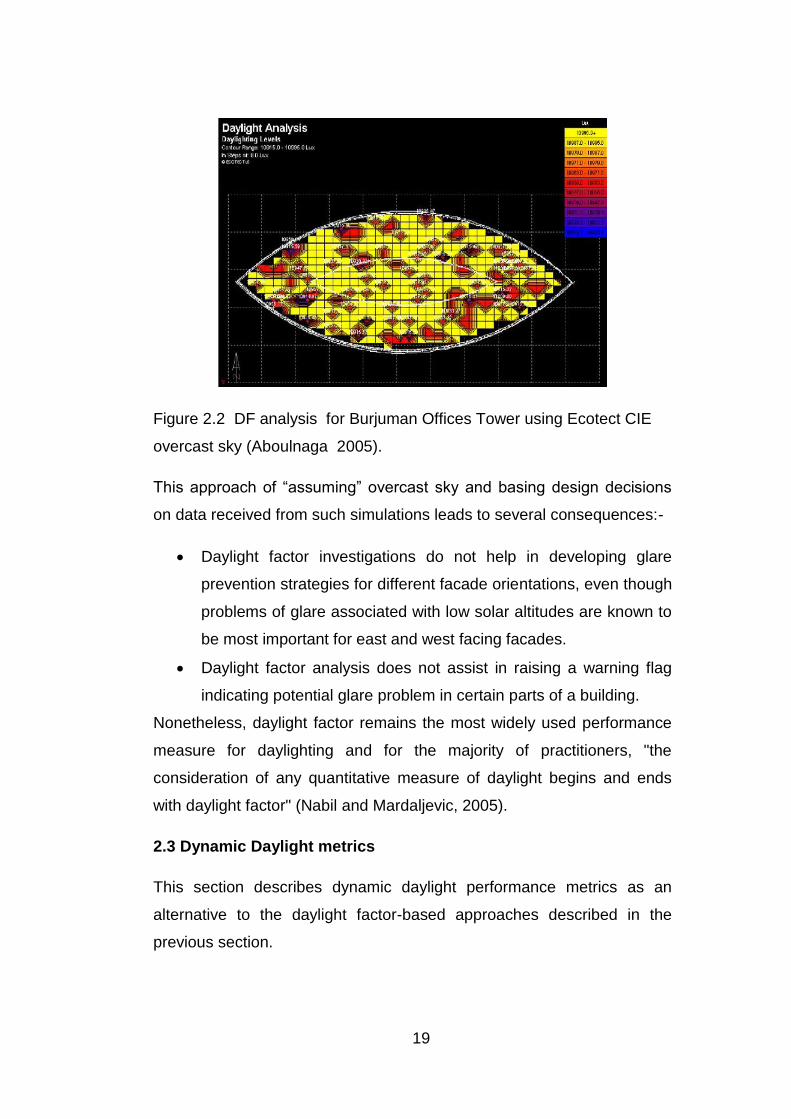
Figure 2.2 DF analysis for Burjuman Offices Tower using Ecotect CIE
overcast sky (Aboulnaga 2005).
This approach of “assuming” overcast sky and basing design decisions
on data received from such simulations leads to several consequences:-
Daylight factor investigations do not help in developing glare
prevention strategies for different facade orientations, even though
problems of glare associated with low solar altitudes are known to
be most important for east and west facing facades.
Daylight factor analysis does not assist in raising a warning flag
indicating potential glare problem in certain parts of a building.
Nonetheless, daylight factor remains the most widely used performance
measure for daylighting and for the majority of practitioners, "the
consideration of any quantitative measure of daylight begins and ends
with daylight factor" (Nabil and Mardaljevic, 2005).
2.3 Dynamic Daylight metrics
This section describes dynamic daylight performance metrics as an
alternative to the daylight factor-based approaches described in the
previous section.
20
For many years, investigators realized the importance of using dynamic
metrics because of its accuracy and correspondence to reality; however,
requirements of the dynamic system have made it very difficult or nearly
impossible for them to consider it, as it requires the use of three-
dimensional CAD software. In addition, to evaluate a single space would
require a daylight simulation model to run hundreds of simulations to
capture all possible day lighting situations for a building throughout the
course of one year.
Nowadays it became more practical to use a dynamic system for the
following reasons:
Access to softwares became affordable in prices for small to
medium sized Architectural and Engineering firms.
Widespread computer, information technology and multimedia
among current generation of architects have allowed quicker use
of any dynamic metric.
The boom in computer technology, graphic abilities and multi core
processer has caused a dramatic reduction in simulations and
rendering time.
Many developments and upgrading seen in recent softwares has
fired competition amongst software development companies
leading to availability of more realistic simulation engines.
The key advantage of dynamic daylight performance metrics compared
to static metrics is that they consider the quantity and character of daily
and seasonal variations of daylight for a given building site together with
irregular meteorological events. Dynamic daylight performance metrics
are based on time series of illumination within a building. These time
series usually extend over the whole calendar year and are based on
external, annual solar radiation data for the building site such as the
21
Energy Plus weather files for over 2000 locations worldwide where can
be downloaded from:
http://www.eere.energy.gov/buildings/energyplus/cfm/weather_data.cfm.
CHPS Daylighting Committee (2006) gave some recommendations for
variables that need to be addressed to standardize the calculation of any
dynamic metric as:
Time Frame: because of the broad range in daylight level during the
coarse of a year, It is important to determine which times of the year to
be considered for calculations by considering:
Counting nighttime hours does not make sense and would drop
the overall trend towards lower values.
Including times of the day where the sun is located in a very low
angle at sunrise and sun set will also play a role in reducing the
average results.
It is important to optimize the daylighting design in offices to the
occupied day hours, for example, it is make no sense to take 7:00
am into calculations while the offices timing hours is 8:00 am.
Testing Points Consideration: Determining a specific point in a daylit
space for use in calculating can be tricky. Where having the testing
points to be in the middle not in very deep corners. New technologies
have replaced the testing points into formal analysis grid that can offer
more accurate calculations.
22
Target Illuminance: Another variable to define is the illuminance
thresholds to use for Daylights Calculations. There was diversity between
different committees and investigators about which rang of daylight
illuminance should be considered in calculations. As been clarified
before, there was a unity in most of the reviews about considering 200
lux to be the lower limit for calculation. However there is still some
frustration about the higher limit. While some take it as 1000 lux (Nabil
and Mardaljevic, 2006) and others consider 2000 lux (Selkowitz and Lee
1998, Li 2007 Ko et al 2008).This research will try to argue the optimal
upper limit of daylight illuminance.
Location and Climate: A more accurate approach would be to use the
most representative climate data available for a given projects site. There
are 58 typical climate data stations providing hour-by-hour climate data
all around the UAE according to the official statistic by the metrological
authority in UAE (2006).
2.3.1 Daylight Autonomy
The definition of daylight autonomy being "the percentage of the year
when a minimum illuminance threshold is met by daylight alone "goes at
least as far back as 1989 when it was mentioned in a Swiss norm
Association Suisse des Electriciens, (1989). After that it disappeared until
the new millennium when (Reinhart and a Walkenhorst, 2001) proposed
this metric to replace daylight factor (DF) because as he stipulated, DF
had many limitations for the prevention of direct sunlight parallel with
daylight factor predictions. "Actual climate in which the building is placed
is not considered. A building in Vancouver, Canada, (latitude 49° N), a
climate renowned for its rainy winters, is treated the same as a building in
Regina, Canada, (latitude 50° N), a climate characterized through clear
23
winter days with a snow covered ground for several months of the year."
Reinhart and Walkenhorst (2001).
The daylight autonomy at a point in a building was defined later with
some modifications as the percentage of occupied hours per year, when
the minimum illuminance level can be maintained by daylight alone, or it
is the percentage of time over a year at which daylight can provide a
given illuminance for a given point. "if a space requires a minimum of 200
lux on the work plane, any hour that does not provide at least 200 lux of
daylight illuminance counts as 0% daylight and any hour that exceeds
200 lux of daylight illuminance counts as 100% daylight" Reinhart and
Walkenhorst (2001). Essentially, this method only gives credit to daylight
when it exceeds the required illuminance and does not give any credit for
partially daylight points.
In contrast to the more widely used daylight factor, daylight autonomy
considers all sky conditions throughout the year. Daylight Autonomy (DA)
can work very efficiently to detect low day lit spaces, but the main
limitations to that metric is the absence of having any upper limit to alert
of overexposing areas or glare problems as it give a value of 100% for
any point that exceed 200 lux. Another important limitation is that DA
cannot be utilized to identify the specific problem area in the design. DA
gives the efficiency as a final percentage, an example, office X achieves
a daylight autonomy of 60%, meaning the office achieve 200 lux for 60%
of the whole year. It however neglects the areas where the shortage,
40% arises from and also any over exposed areas.
2.3.2 Continuous Daylight Autonomy
Continuous Daylight Autonomy (DA con) recently proposed by Rogers
(2005). Another set of metrics represents dynamic sky conditions
measurements. Continuous Daylight Autonomy use the same technique
of Daylight Autonomy but this metric gives partial credit to time steps
when the daylight illuminance lies below the minimum illuminance level
24
(200lux). "In the case where 500 lux are required and 400 lux are
provided by daylight at a given time step, a partial credit of
400lux/500lux=0.8 is given for that time step. The result is that instead of
a hard threshold the transition between compliance and non-compliance
becomes softened" Rogers (2005). A partial involvement of low daylight
illuminance at a space is still beneficial as study was indicating that
illumination preferences vary between individuals and that many office
occupants tend to work at lower daylight levels than the commonly
referred level. However, lack of upper threshold criteria in Continuous
Daylight Autonomy is the main limitation where there is no indication for
occurrence of direct sunlight or other potentially glary conditions.
2.3.3 Useful Daylight Illuminances
Useful Daylight Illuminances (UDI) was proposed by Nabil and
Mardaljevic (2006). It is a dynamic daylight performance metric based
also on work plane Illuminances. UDI aims to determine when daylight
levels are ‘useful’ for the occupant, The UDI scheme applied by
determining the occurrence of daylight illuminances that:
1. Are within the range defined as useful (i.e. 200–2000 lx).
2. Fall short of the useful range (i.e. less than 200 lx).
3. Exceed the useful range (i.e. greater than 2000 lx).
The suggested range was founded on reported occupant preferences in
daylight offices. The system proposes that if the daylight illuminance is
too small (i.e. below minimum), it may not contribute in any useful
manner to either the perception of the visual environment or in the
carrying out of visual tasks. Conversely, if the daylight illuminance is too
great (i.e. above a maximum), it may generate visual or thermal
25
discomfort, or both. Illuminances that fall within the bounds of minimum
and maximum were called useful daylight illuminances. However bins
given by Nabil and Mardaljevic (2006) for Low, Useful and High daylight
illuminance might vary across various investigators in different regions
depending on their interpretation of the vision term (Useful). Ko et al
(2008) pointed that the range between 200-1000 lux is the most desired
daylight illuminance in most internal space. Li (2007) also considered
1000 lux as the upper illuminance level. From his standpoint, 2000 lux
still considered accepted value for human eye but this value would lead
for more heat gain, which is not acceptable for Hong Kong subtropical
climate.
The UDI scheme is both informative and simple. It is more complex than
the daylight autonomy method, but it gives a much better approach into
the sequential dynamics of daylight illumination. In particular, it gives an
indication of the predilection for high levels of illumination that are linked
with discomfort glare and heat gains. "UDI is based primarily on human
factor considerations, high values of achieved UDI might well be
associated with low energy usage for electric lighting, and possibly also
for cooling but high values of daylight Autonomy does not indicate
thermal and visual problems " Nabil and Mardaljevic (2006). In addition,
UDI metrics provides a more informative and comprehensive assessment
of daylight conditions than that which can be gained from daylight
autonomy.
2.4 Summary of Daylighting Metrics
The daylight factor is widely used and it provides a feeling of how
“bright“or “dark“ the interior is. Daylight factor approach is therefore
inapplicable for realistic, daylight conditions. Daylight factor is equal in all
four facades, since it is based on a single sky condition. Its credibility to
judge the overall daylight situation in a given building is as such limited.
26
On the other hand Dynamic metrics offer a far more realistic account of
true daylighting conditions than the highly idealized daylight factor
approach The three dynamic metrics all have their merits and
shortcomings.
Daylight autonomy only relies on task-specific minimum illuminance
levels that have the advantage of already being well established for
different space types, but it's been blemished for excluding the high
values of illumnance which make it insufficient to determine the heating
and glare problems.
Continuous daylight autonomy retains the concept of space–specific
design illuminances but introduces partial credit for daylight contributions
that lie below the design illuminance. This softens the transition between
compliance and noncompliance but also that metric was failed to give
any warning flag for the high threshold of daylighting, which could lead to
visual and thermal problems.
Useful Daylight Illuminances (UDI) require upper and lower thresholds
that first have to be established for different building zones, requiring
further research. UDI is more complex metric and gives more information
about the space situation. It provides an effective mechanism to flag the
zone in a building in which a shading device is needed, which makes it
attractive for initial design investigations that concentrates on the
daylighting/shading performance of the fixed building form.
From previous investigation for different static and dynamic metrics
characteristics, UDI would be the best metric to comply with UAE’s
climate as it considers the different types of skies and its high flexibility to
capture the weak and the over exposed areas.
27
Chapter3 – Methodology
3.1 Different methods used in the past for daylight design
For many years, daylighting design was relied on client expectations and
architect experience. Simple methods were introduced in early
developments for daylighting testing methods were mainly involved with
quantity of daylight as an engineering solution. The continued reliance on
daylighting and high expenses of energy led investigators to introduce
mathematical methods as an attempt to increase daylighting
performance. Today, modern performance methods are just as varied as
different technologies that take place in daylight design. Methods of
testing daylight varied from the past include many types of mathematical
formulas, model types and simulation softwares.
Manual Tools
Manual mathematical methods are some of the earliest methods for
daylight testing. The use of manual tools enables designers to obtain
rough calculations for the amount of daylight penetrating a space.
Edwards (2002) investigated different manual methods been used for
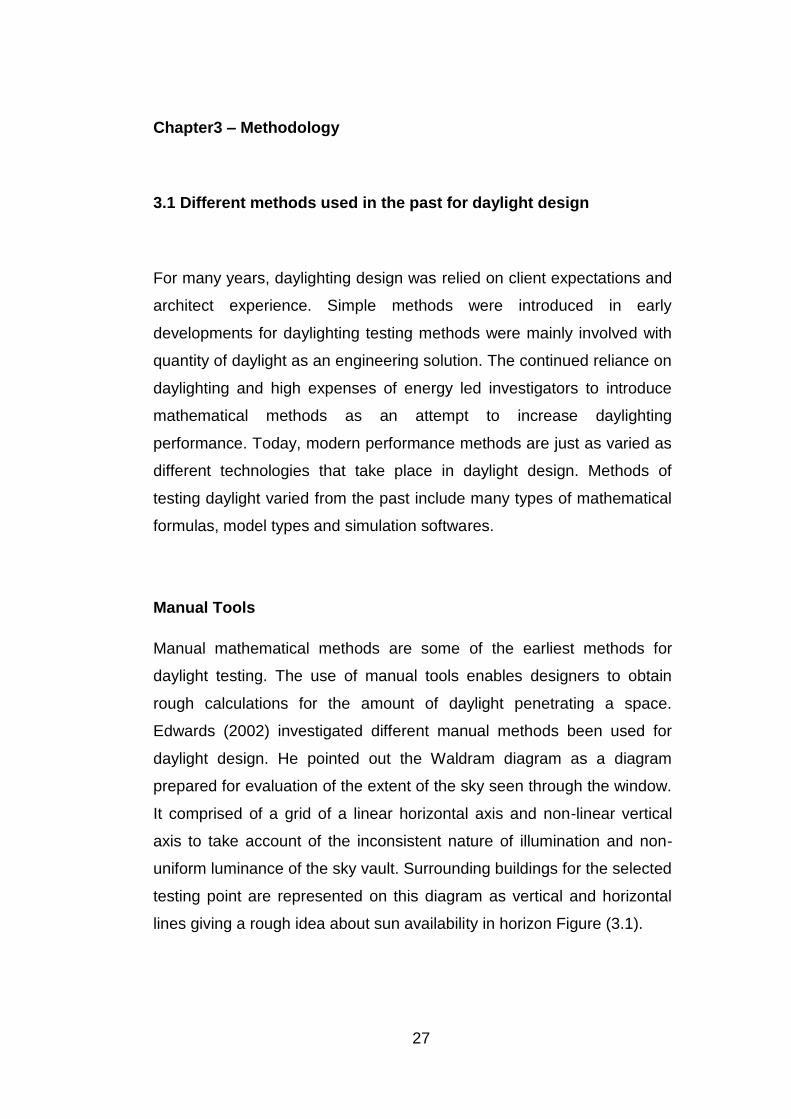
daylight design. He pointed out the Waldram diagram as a diagram
prepared for evaluation of the extent of the sky seen through the window.
It comprised of a grid of a linear horizontal axis and non-linear vertical
axis to take account of the inconsistent nature of illumination and non-
uniform luminance of the sky vault. Surrounding buildings for the selected
testing point are represented on this diagram as vertical and horizontal
lines giving a rough idea about sun availability in horizon Figure (3.1).
28
Figure 3.1 The Waldram diagram as manual daylight testing method (www.waterslade.com)
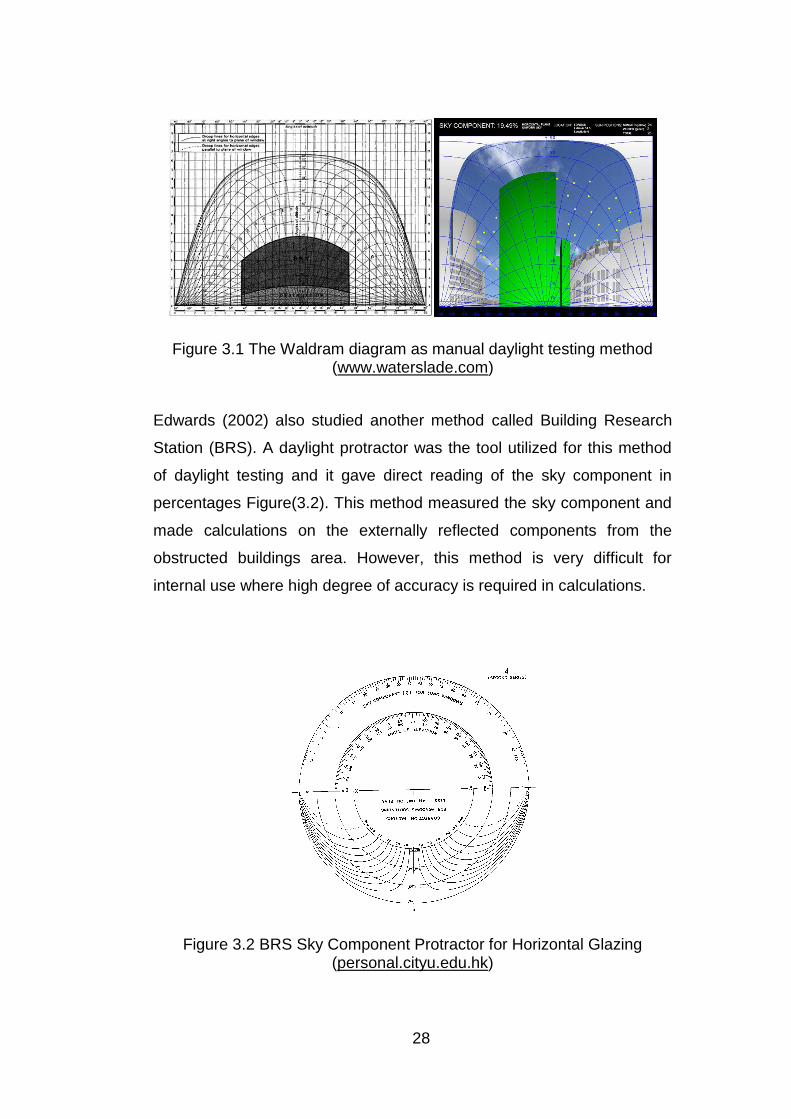
Edwards (2002) also studied another method called Building Research
Station (BRS). A daylight protractor was the tool utilized for this method
of daylight testing and it gave direct reading of the sky component in
percentages Figure(3.2). This method measured the sky component and
made calculations on the externally reflected components from the
obstructed buildings area. However, this method is very difficult for
internal use where high degree of accuracy is required in calculations.
Figure 3.2 BRS Sky Component Protractor for Horizontal Glazing (personal.cityu.edu.hk)
29
Mathematical Tools
These methods used mathematical formulas to test daylight availability in
the space. Ernest Orlando Lawrence Berkeley National Laboratory
(1998) pointed (Feasibility Factor)(FF) as a formula that aims to
determine roughly the amount of daylight that can be achieved in various
areas of a selected space. FF is measured by using the following
formula:
WWR X VT X OF = FF......................................................... (2).
Window to Wall Ratio (WWR) is the Net glazing area (window area
minus mullions and framing, or ~80% of rough opening) divided
by gross exterior wall area.
Visible Transmittance (VT) is the percentage of light amount that
can pass through the glass panel to the interior of a room , this
number varies from .4 for a double glaze tinted glass to 1 for clear
glass.
Obstruction factor (OF) is the percentage of obstructed view from
the window center. The value of OF vary from .4 for heavily
obstructed window to 1 for unobstructed window.
If Feasibility Factor (FF) more than >0.25, then daylighting has significant
energy saving. If Feasibility Factor less than <0.25, then the designer
should remove obstructions, increasing window area, or increase VT in
order to reduce the factor amount above 0.25. This formula can help
designers to have a very quick idea about how bright is the place, but
again it misses out on accuracy where the final scale has only two cases
<0.25 and >.25 . Moreover, this method cannot give any idea about glare
and over exposed areas in the tested place.
30
The previous testing methods can only be applied to very simple spaces
in shapes and materials where the distribution of light in a complex
space requires more accurate tools and complex formulas. Also the
results produced by the previous methods doesn't have any kind of
visual presentation format to be presented for normal people and clients.
Scale Model
Scale model is one of the widely used methods for daylight testing. Light
wavelength behaves in a similar manner inside a scale model at 1:50 as
it would in the actual space. Scale model gives a clear idea to clients
about what is happening in the design. This is very important to insure
client's satisfaction about design outcome.
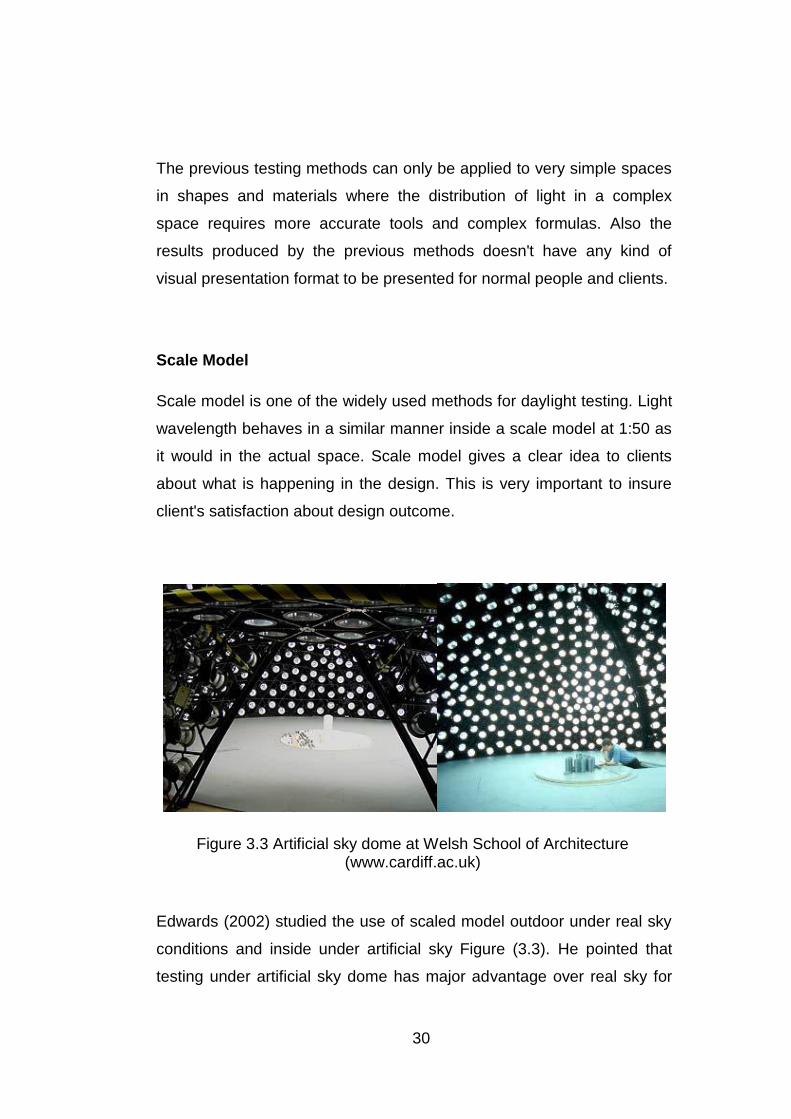
Figure 3.3 Artificial sky dome at Welsh School of Architecture (www.cardiff.ac.uk)
Edwards (2002) studied the use of scaled model outdoor under real sky
conditions and inside under artificial sky Figure (3.3). He pointed that
testing under artificial sky dome has major advantage over real sky for
31
it’s ability to control sky conditions. The artificial sky can model different
conditions by adjustable laminar around the dome’s frame in any location
at any time during the year. Daylight illuminance levels in any space
measured by using photometric sensor placed inside the model and the
results are directly converted to the linked computer.
Furthermore, Edwards (2002) pointed many advantages for using scale
model as testing method. This method can provide designer with
quantitative results, which can be used to determine the quality and
sufficiency of daylight as calculations or photographs. In addition,
different scenarios for materials, colors, furniture and reflections can be
easily managed for testing in scaled model. Shading techniques can be
easily added and adjusted in scale model. However, from the author
perspective detailed model can be very expensive especially when they
have internal furniture details. Also using the real material sometimes
gives incorrect results where some fabrics or textures cannot be scaled
easily. Moreover artificial sky dome is very expensive technology and it
is not available to everyone but mainly constructed in affluent universities
for study purposes or in specialized research centers. On the other hand,
the dynamic movements of the sun made testing under real sky
ineffective for investigators to test models where it needs one year
testing in order to determine different daylight cases. Next section will
investigate simulation as alternate testing method.
3.2 Computer Simulation as Method of testing
Aburdene (2001) defined the simulation term in general as, the process
of developing a simplified model of a complex system and using the
model to analyze and predict the behavior of the original system in
reality. However, Reinhart (2006) defined daylight simulation particularly,
as a computer-based calculation, which aims to predict the amount of
daylight available in a building either under selected sky conditions (static
32
simulation) or during the course of the whole year (dynamic simulation).
Computer simulations give very wide options for changing it’s parameters
and to study daylight in different locations. Simulations calculate quantity
values like illuminance and luminance. Results can be presented by
different outputs as real image, false color mapping or presenting values
in numeric numbers. The technology boom and recent awareness about
the importance of sustainability as a design method have opened the
door for many different companies to enter into competition to develop
sustainable simulation engines.
Next section will run a comparison between three major simulation
softwares 3D Max Design, Radiance and Daysim. Ecotect was excluded
from the following comparison as it is using only uniform over cast sky,
which cannot be acceptable for UAE’s climate.
3D Max Design vs. Radiance\Daysim
The unique high technology of 3D Max Design Exposure technology
made a significantly Superior against the other simulation softwares like
(Daysim ,Ecotect and Radiance) which are using the technology of
Radiance backward raytracer combined with a daylight coefficient
approach.
Radiance backward raytracer is a lighting simulation program that was
initially developed by Greg Ward in the late eighties at Lawrence
Berkeley National Laboratory (Ward and Rubinstein, 1988). The program
generally enjoys the status of a ‘gold standard’ among daylight simulation
programs. Rinhart et al (2006) conducted a survey of close to two
hundred daylighting modelers from twenty-seven countries which
expressed a strong bias towards Radiance. However, Daysim is limited
edition from Radiance but it has been developed to be a practical tool to
develop indoor illuminances under multiple sky conditions when
Radiance Classic could not achieve it within a reasonable time frame. In
33
spite of this Daysim, still uses the same technology of raytracer
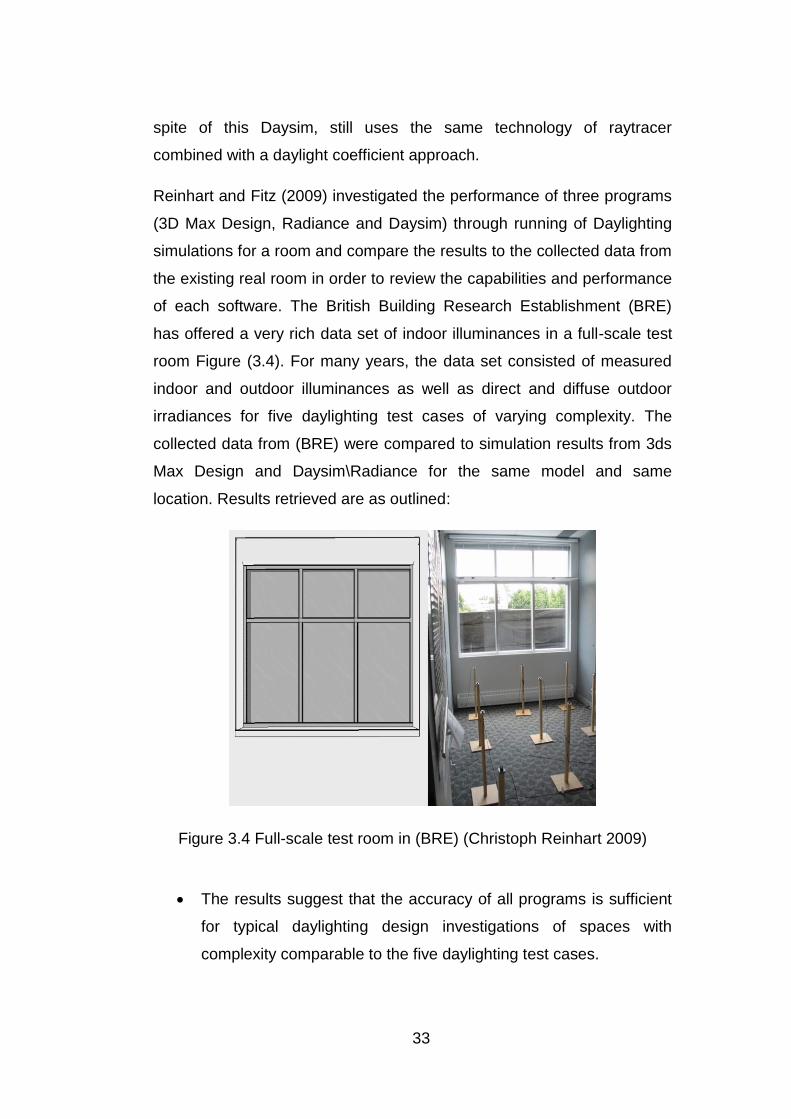
combined with a daylight coefficient approach.
Reinhart and Fitz (2009) investigated the performance of three programs
(3D Max Design, Radiance and Daysim) through running of Daylighting
simulations for a room and compare the results to the collected data from
the existing real room in order to review the capabilities and performance
of each software. The British Building Research Establishment (BRE)
has offered a very rich data set of indoor illuminances in a full-scale test
room Figure (3.4). For many years, the data set consisted of measured
indoor and outdoor illuminances as well as direct and diffuse outdoor
irradiances for five daylighting test cases of varying complexity. The
collected data from (BRE) were compared to simulation results from 3ds
Max Design and Daysim\Radiance for the same model and same
location. Results retrieved are as outlined:
Figure 3.4 Full-scale test room in (BRE) (Christoph Reinhart 2009)
The results suggest that the accuracy of all programs is sufficient
for typical daylighting design investigations of spaces with
complexity comparable to the five daylighting test cases.
34
Simulation times for the daylighting test cases under a sunny sky
were 0.6 to 4 hours for Radiance Classic compared to 12
seconds for 3ds Max.
For an hourly time step, annual simulation calculation time would
be around 15 hours for Daysim while it took 5 to 7 hours for 3D
Max Design.
The previous results suggest that 3D Max Design is the best tool for
daylighting simulations design decisions, as it is fair to state that it is
significantly faster than Radiance Classic for daylight factor or CIE clear
sky simulations and Daysim for annual simulation calculation. "Since
Daysim and Radiance are really the only programs that have thus far
been rigorously validated. This finding is not that surprising given that
both programs are based on very comparable models: They use the
same sky model and a backward raytracer for the global illumination
simulation". Reinhart and Fitz (2009).
3D Max Design as a simulation tool
From the results been pointed by Reinhart and Fitz (2009), 3D Max
Design was recommended as the best tool for daylight simulation due to
its significant speed and it,s combining features of both software
Radiance and Daysim modeling. 3D Max Design (with its mental ray
software raytracer for the global illumination calculation) selected to be
the preferred simulation software in this study.
3.3 Determine parameters of field investigations in line with intent of
the study
The field investigation shall aim to collect data on daylight illuminance
falling on vertical building's facades and office interior spaces in Dubai in
order to evaluate the Daylight performance through using (Useful
Daylight illuminance) evaluation metric.
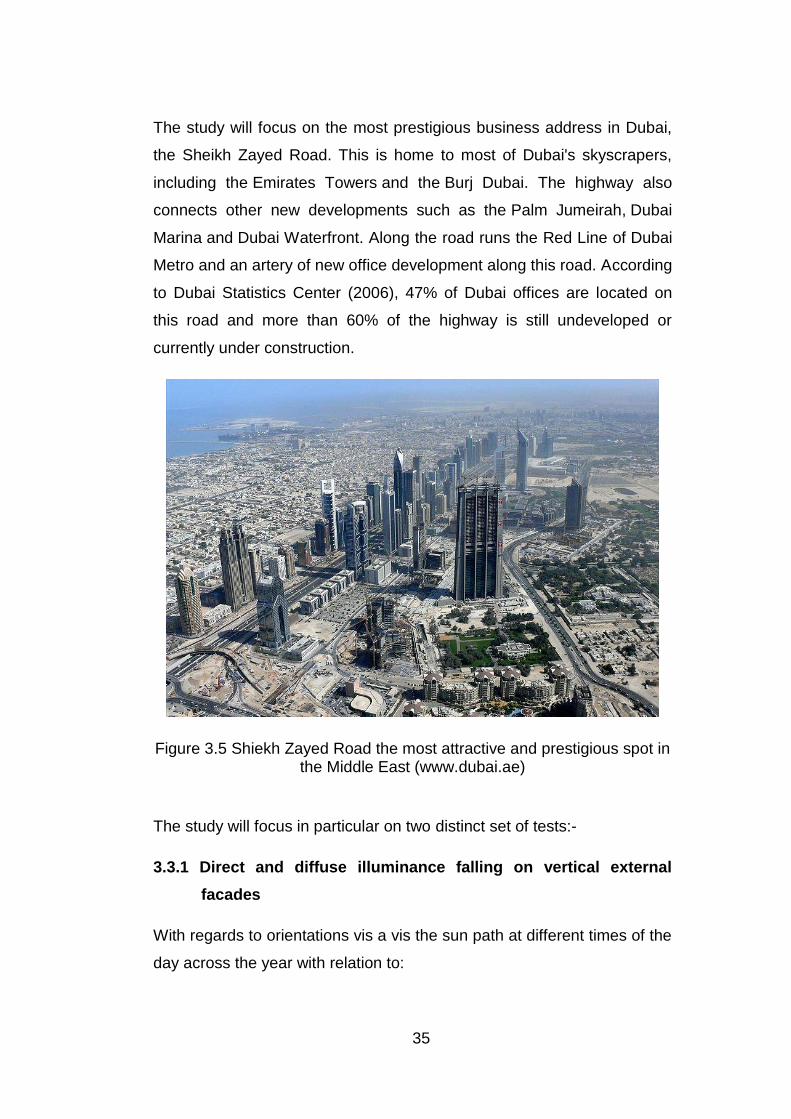
35
The study will focus on the most prestigious business address in Dubai,
the Sheikh Zayed Road. This is home to most of Dubai's skyscrapers,
including the Emirates Towers and the Burj Dubai. The highway also
connects other new developments such as the Palm Jumeirah, Dubai
Marina and Dubai Waterfront. Along the road runs the Red Line of Dubai
Metro and an artery of new office development along this road. According
to Dubai Statistics Center (2006), 47% of Dubai offices are located on
this road and more than 60% of the highway is still undeveloped or
currently under construction.
Figure 3.5 Shiekh Zayed Road the most attractive and prestigious spot in the Middle East (www.dubai.ae)
The study will focus in particular on two distinct set of tests:-
3.3.1 Direct and diffuse illuminance falling on vertical external
facades
With regards to orientations vis a vis the sun path at different times of the
day across the year with relation to:
36
The cumulative frequency distribution of the outdoor
illuminance, which will provide valuable information on the
predication of the probable electric lighting savings and the
amount of heat received by that elevation.
The effect of building setback from neighboring plots and
its effects on daylighting especially for offices on lower
floors.
Office buildings geometry, using Google earth, a quick
survey for Sheikh Zayed Road Buildings plans geometries
came up with the following: Out of 63 high-rise office
buildings road over 30-storeys tall, 78% were square, 12%
were rectangular, 6% were circular and 4% were triangular.
This means that there has been a tendency to use a square
plan when the building height is increased. Second, in
structural terms, the square plan resists loads equally in all
directions and is more economical compared with
rectangular forms. Buildings with symmetrical plans are less
susceptible to lateral wind impact than unsymmetrical
buildings, and are more efficient than curved and irregular
shapes. For these reasons, a square plan was considered
in this research.
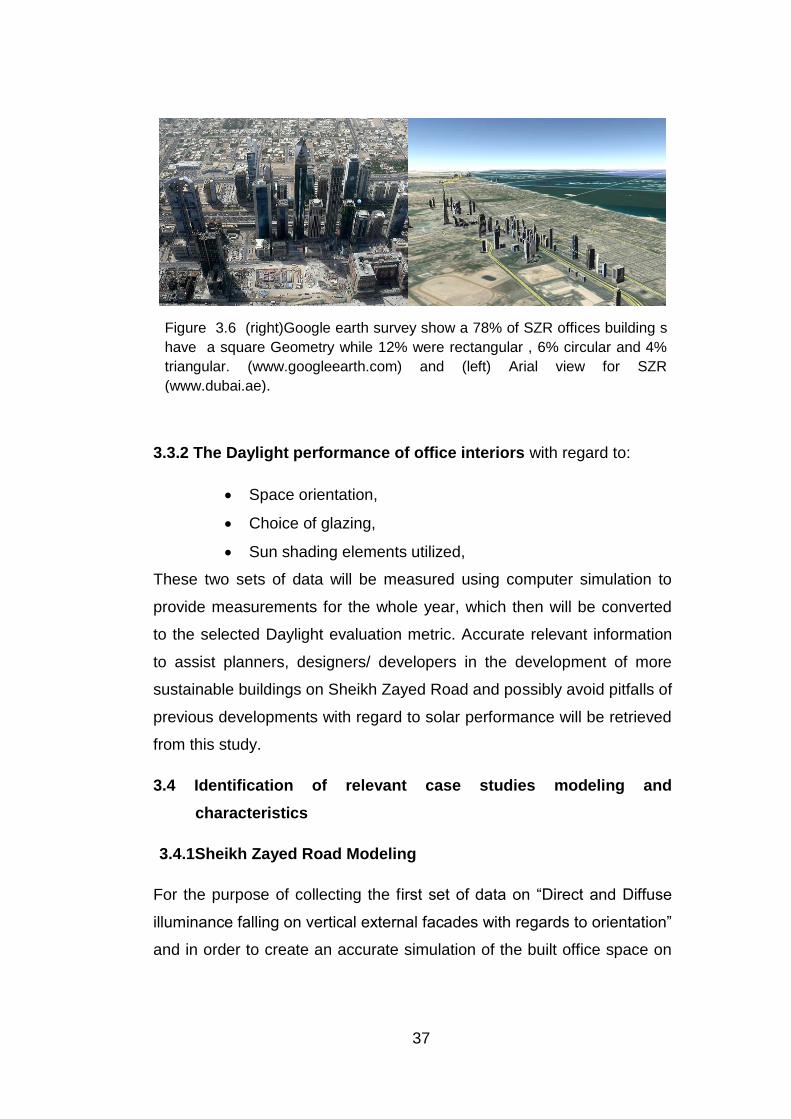
37
Figure 3.6 (right)Google earth survey show a 78% of SZR offices building s
have a square Geometry while 12% were rectangular , 6% circular and 4%
triangular. (www.googleearth.com) and (left) Arial view for SZR
(www.dubai.ae).
3.3.2 The Daylight performance of office interiors with regard to:
Space orientation,
Choice of glazing,
Sun shading elements utilized,
These two sets of data will be measured using computer simulation to
provide measurements for the whole year, which then will be converted
to the selected Daylight evaluation metric. Accurate relevant information
to assist planners, designers/ developers in the development of more
sustainable buildings on Sheikh Zayed Road and possibly avoid pitfalls of
previous developments with regard to solar performance will be retrieved
from this study.
3.4 Identification of relevant case studies modeling and
characteristics
3.4.1Sheikh Zayed Road Modeling
For the purpose of collecting the first set of data on “Direct and Diffuse
illuminance falling on vertical external facades with regards to orientation”
and in order to create an accurate simulation of the built office space on
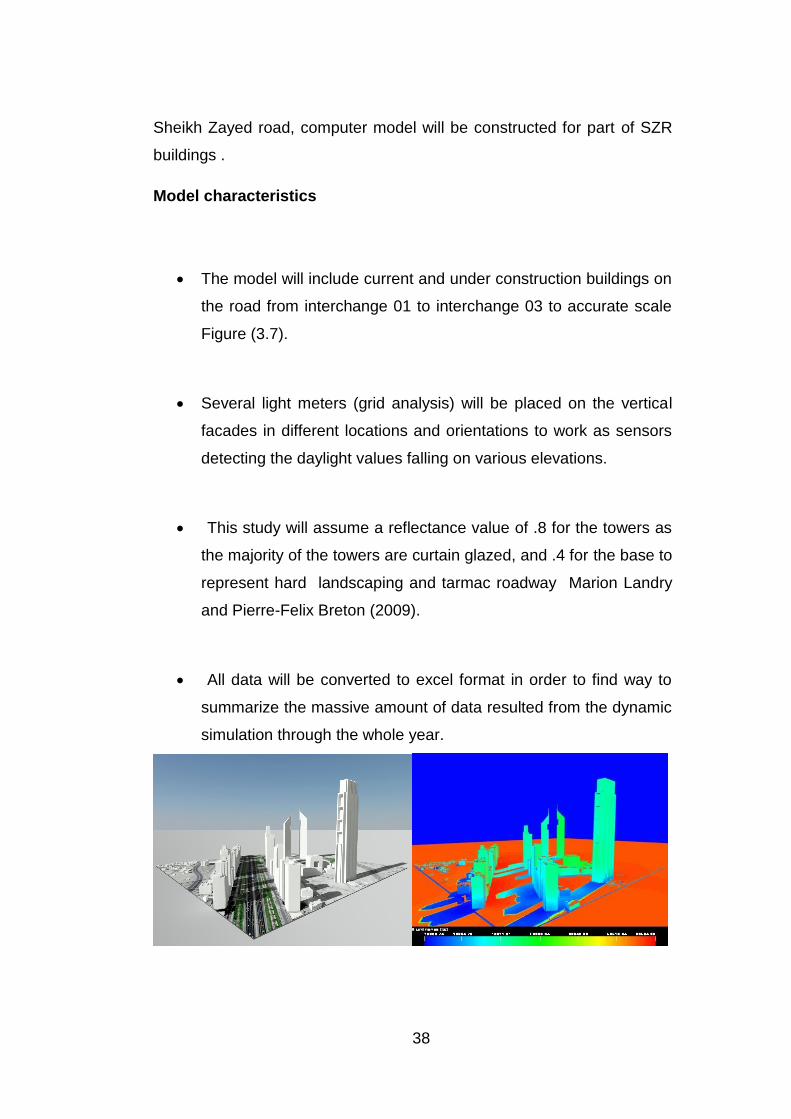
38
Sheikh Zayed road, computer model will be constructed for part of SZR
buildings .
Model characteristics
The model will include current and under construction buildings on
the road from interchange 01 to interchange 03 to accurate scale
Figure (3.7).
Several light meters (grid analysis) will be placed on the vertical
facades in different locations and orientations to work as sensors
detecting the daylight values falling on various elevations.
This study will assume a reflectance value of .8 for the towers as
the majority of the towers are curtain glazed, and .4 for the base to
represent hard landscaping and tarmac roadway Marion Landry
and Pierre-Felix Breton (2009).
All data will be converted to excel format in order to find way to
summarize the massive amount of data resulted from the dynamic
simulation through the whole year.
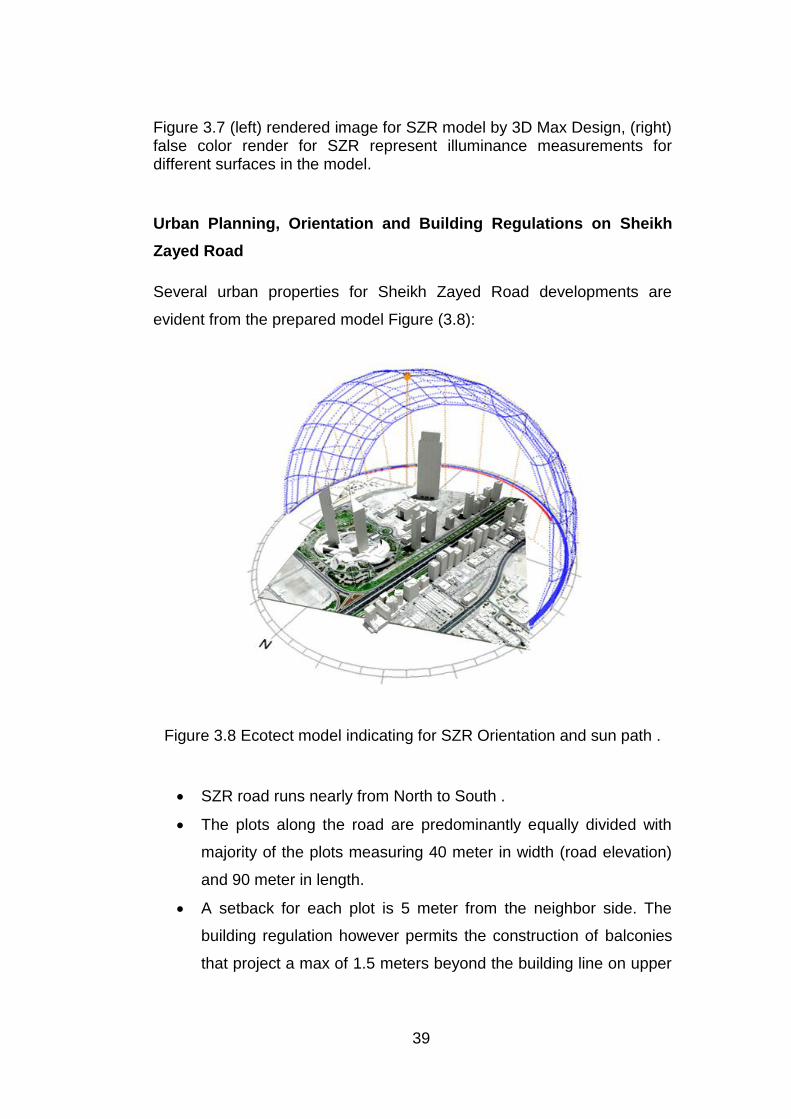
39
Figure 3.7 (left) rendered image for SZR model by 3D Max Design, (right) false color render for SZR represent illuminance measurements for different surfaces in the model.
Urban Planning, Orientation and Building Regulations on Sheikh
Zayed Road
Several urban properties for Sheikh Zayed Road developments are
evident from the prepared model Figure (3.8):
Figure 3.8 Ecotect model indicating for SZR Orientation and sun path .
SZR road runs nearly from North to South .
The plots along the road are predominantly equally divided with
majority of the plots measuring 40 meter in width (road elevation)
and 90 meter in length.
A setback for each plot is 5 meter from the neighbor side. The
building regulation however permits the construction of balconies
that project a max of 1.5 meters beyond the building line on upper
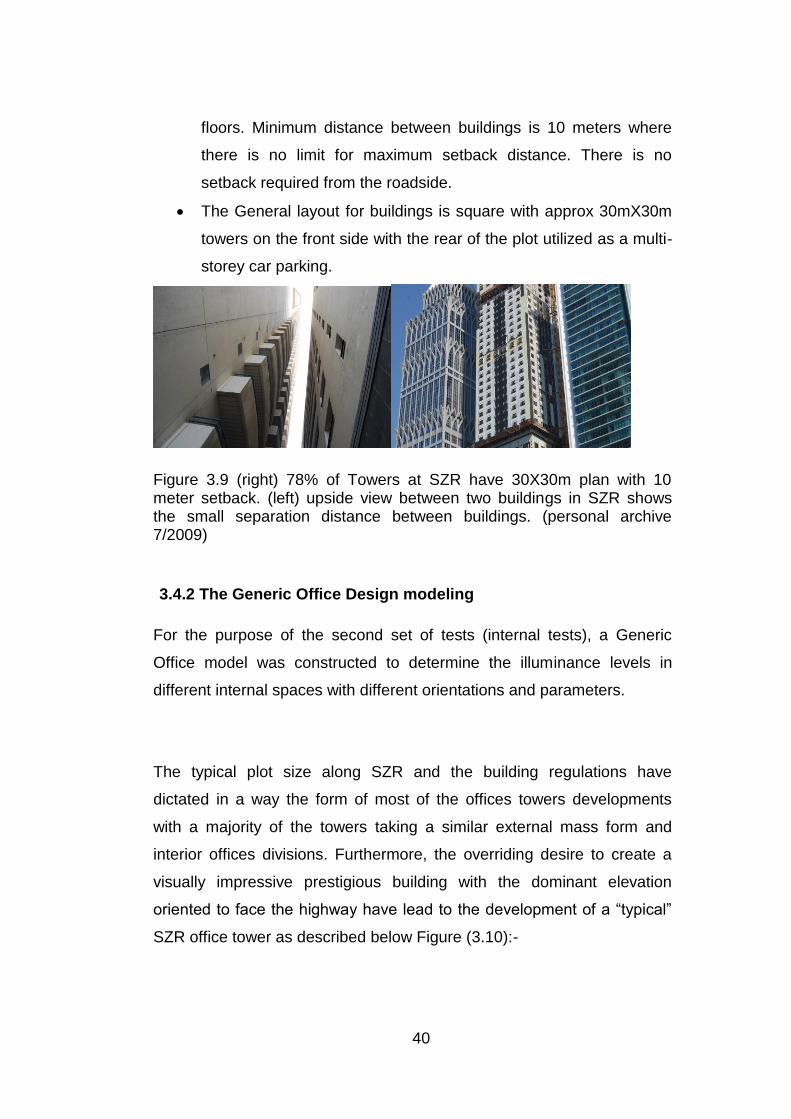
40
floors. Minimum distance between buildings is 10 meters where
there is no limit for maximum setback distance. There is no
setback required from the roadside.
The General layout for buildings is square with approx 30mX30m
towers on the front side with the rear of the plot utilized as a multi-
storey car parking.
Figure 3.9 (right) 78% of Towers at SZR have 30X30m plan with 10 meter setback. (left) upside view between two buildings in SZR shows the small separation distance between buildings. (personal archive 7/2009)
3.4.2 The Generic Office Design modeling
For the purpose of the second set of tests (internal tests), a Generic
Office model was constructed to determine the illuminance levels in
different internal spaces with different orientations and parameters.
The typical plot size along SZR and the building regulations have
dictated in a way the form of most of the offices towers developments
with a majority of the towers taking a similar external mass form and
interior offices divisions. Furthermore, the overriding desire to create a
visually impressive prestigious building with the dominant elevation
oriented to face the highway have lead to the development of a “typical”
SZR office tower as described below Figure (3.10):-
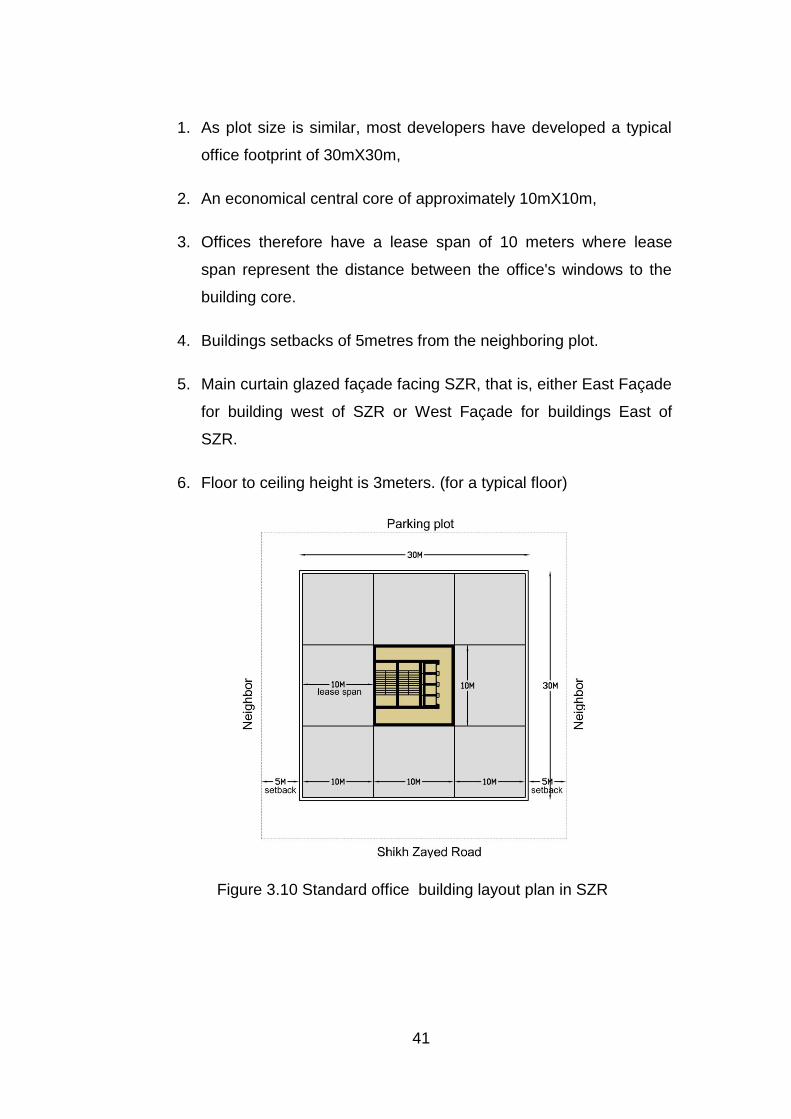
41
1. As plot size is similar, most developers have developed a typical
office footprint of 30mX30m,
2. An economical central core of approximately 10mX10m,
3. Offices therefore have a lease span of 10 meters where lease
span represent the distance between the office's windows to the
building core.
4. Buildings setbacks of 5metres from the neighboring plot.
5. Main curtain glazed façade facing SZR, that is, either East Façade
for building west of SZR or West Façade for buildings East of
SZR.
6. Floor to ceiling height is 3meters. (for a typical floor)
Figure 3.10 Standard office building layout plan in SZR
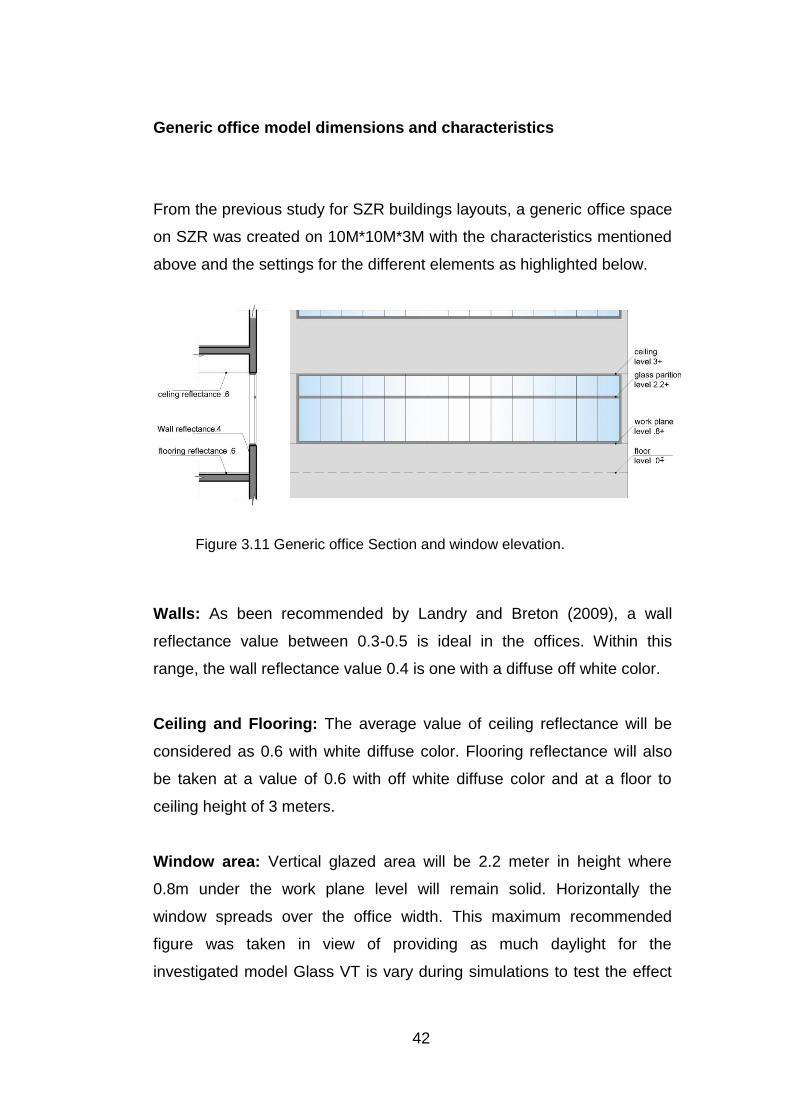
42
Figure 3.11 Generic office Section and window elevation.
Generic office model dimensions and characteristics
From the previous study for SZR buildings layouts, a generic office space
on SZR was created on 10M*10M*3M with the characteristics mentioned
above and the settings for the different elements as highlighted below.
Walls: As been recommended by Landry and Breton (2009), a wall
reflectance value between 0.3-0.5 is ideal in the offices. Within this
range, the wall reflectance value 0.4 is one with a diffuse off white color.
Ceiling and Flooring: The average value of ceiling reflectance will be
considered as 0.6 with white diffuse color. Flooring reflectance will also
be taken at a value of 0.6 with off white diffuse color and at a floor to
ceiling height of 3 meters.
Window area: Vertical glazed area will be 2.2 meter in height where
0.8m under the work plane level will remain solid. Horizontally the
window spreads over the office width. This maximum recommended
figure was taken in view of providing as much daylight for the
investigated model Glass VT is vary during simulations to test the effect
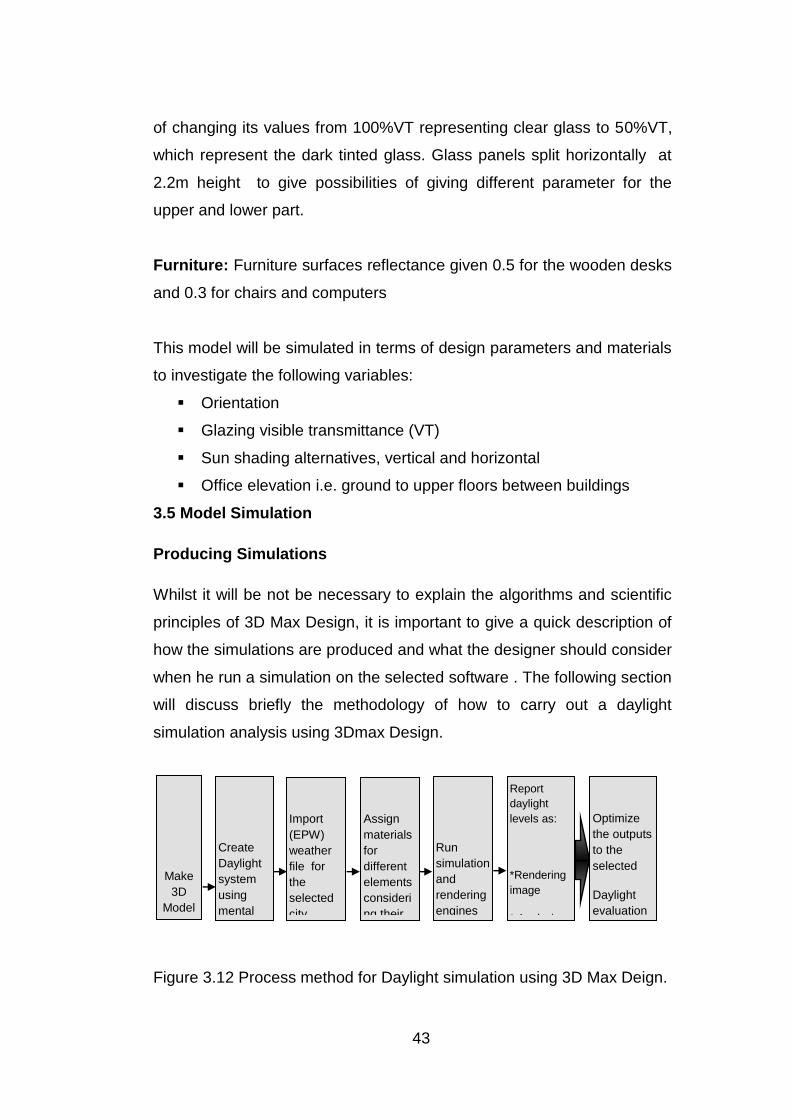
43
of changing its values from 100%VT representing clear glass to 50%VT,
which represent the dark tinted glass. Glass panels split horizontally at
2.2m height to give possibilities of giving different parameter for the
upper and lower part.
Furniture: Furniture surfaces reflectance given 0.5 for the wooden desks
and 0.3 for chairs and computers
This model will be simulated in terms of design parameters and materials
to investigate the following variables:
Orientation
Glazing visible transmittance (VT)
Sun shading alternatives, vertical and horizontal
Office elevation i.e. ground to upper floors between buildings
3.5 Model Simulation
Producing Simulations
Whilst it will be not be necessary to explain the algorithms and scientific
principles of 3D Max Design, it is important to give a quick description of
how the simulations are produced and what the designer should consider
when he run a simulation on the selected software . The following section
will discuss briefly the methodology of how to carry out a daylight
simulation analysis using 3Dmax Design.
Figure 3.12 Process method for Daylight simulation using 3D Max Deign.
Make
3D
Model
Create
Daylight
system
using
mental
sun
Import
(EPW)
weather
file for
the
selected
city
(Dubai)
Assign
materials
for
different
elements
consideri
ng their
real
metrics
Run
simulation
and
rendering
engines
Report
daylight
levels as:
*Rendering
image
* Analysis
grid
*Microsoft
excel format
Optimize
the outputs
to the
selected
Daylight
evaluation
metric.
44
Make 3D model: Good simulation result requires a good
geometry. Creating good model does not mean modeling
everything but it means that the geometry must communicate
roughly to what the renderer expects. It is important to start with a
clean model. According to Landry and Breton (2009: b) the
margins of having modeling errors in 3D max is larger than
Ecotect and Radiance, because the mental ray technology is more
tolerant than Radiosity. Therefore, it is not essential to create
perfect models, but models that are more accurate make
simulation easier and more efficient.
Create Daylight system: Once the geometry properly modeled,
“Daylight System” must be created to illuminate the geometry. The
daylight system in 3DMax Design models the orientation and
space hemisphere under which the geometry placed.
Import (EPW) weather file: 3ds Max Design has capability of
loading an EnergyPlus weather file (*.EPW) files, which produce
an automatic time series of HDR images and/or illuminances
under multiple sky conditions. EPW files contain annual data for
typical climatic conditions at a given site, including ambient
temperature, relative humidity, wind speed direction, cloud
coverage, and radiation data as direct or diffuse. EnergyPlus
weather files for over 2000 locations worldwide can be
downloaded from:
http://www.eere.energy.gov/buildings/energyplus/cfm/weather_data.cfm.
Assign materials for different elements: In order to produce
accurate lighting analysis results, the importance of materials
definitions come in the same consequence of light and model
45
setup. To deal with 3D Max Design materials, the user must have
enough awareness about the real material parameters. Glass is
playing a major role in Daylight analysis as it is the only way to
connect inside to outside. Therefore, ignoring glass parameter
would affect the amount of light penetrating into the space, which
would result in reflected incorrect results. A simulator should
consider the amount of Glass reflection and the visible transmitting
which control the amount of light will pass through the glass, also
Index Of Refraction (IOR) is a major parameter as its represent
the changing in sun rays angel after it hit glass Landry and Breton
(2009: b).
Several glass manufacturers provide optical data to the windows
provided by Lawrence Berkeley National Laboratory. This data
can be exported to Radiance files (*.Rad). Good advantage of 3D
Max Design its corresponds with Radiance as it accept (*.Rad) as
materials .In addition walls and flooring planes must be given their
accurate diffuse color and reflection amount.
Run simulation and rendering engines: It's very important
before running the final simulation to check the automatic error
detector provided by 3D Max Design which make a quick checkup
for light, modeling and material settings in order to avoid wasting
the investigator’s time.
3.6 Data Collection
Reporting daylight levels over a period is the most exciting part in
simulation where investigators harvesting the results. Simulation's results
in 3D Max Design are retrieved in different formats as following:
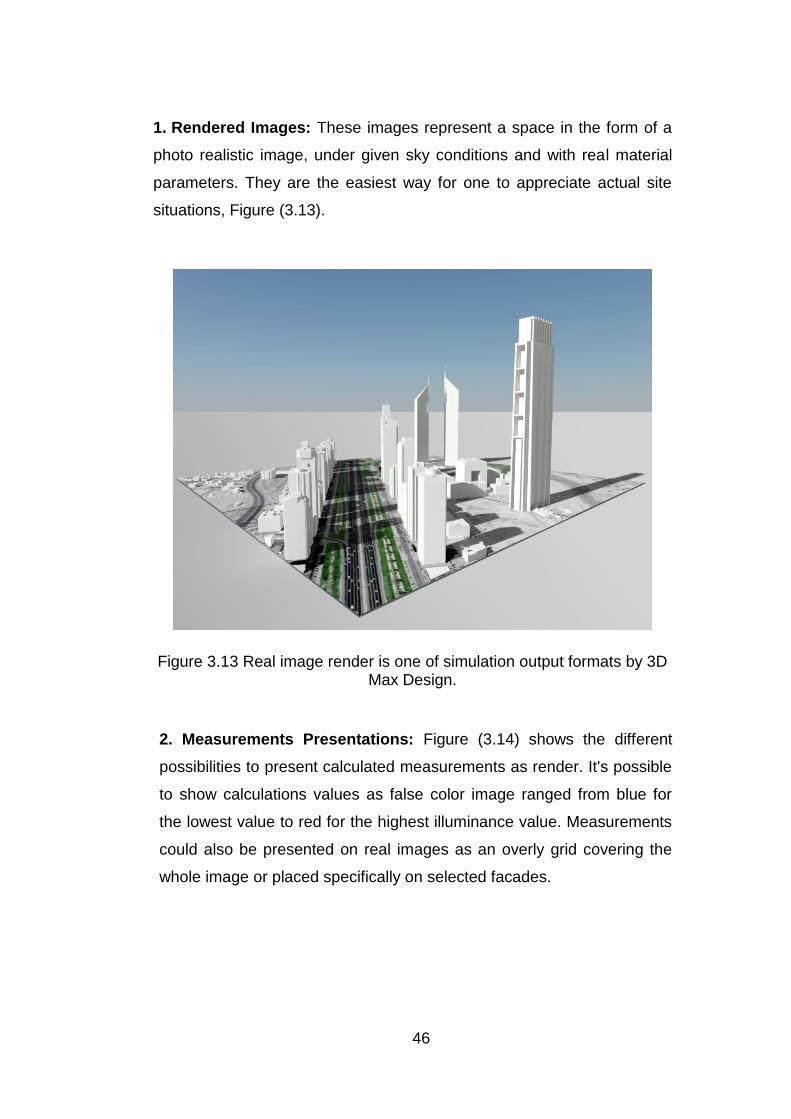
46
1. Rendered Images: These images represent a space in the form of a
photo realistic image, under given sky conditions and with real material
parameters. They are the easiest way for one to appreciate actual site
situations, Figure (3.13).
Figure 3.13 Real image render is one of simulation output formats by 3D Max Design.
2. Measurements Presentations: Figure (3.14) shows the different
possibilities to present calculated measurements as render. It's possible
to show calculations values as false color image ranged from blue for
the lowest value to red for the highest illuminance value. Measurements
could also be presented on real images as an overly grid covering the
whole image or placed specifically on selected facades.
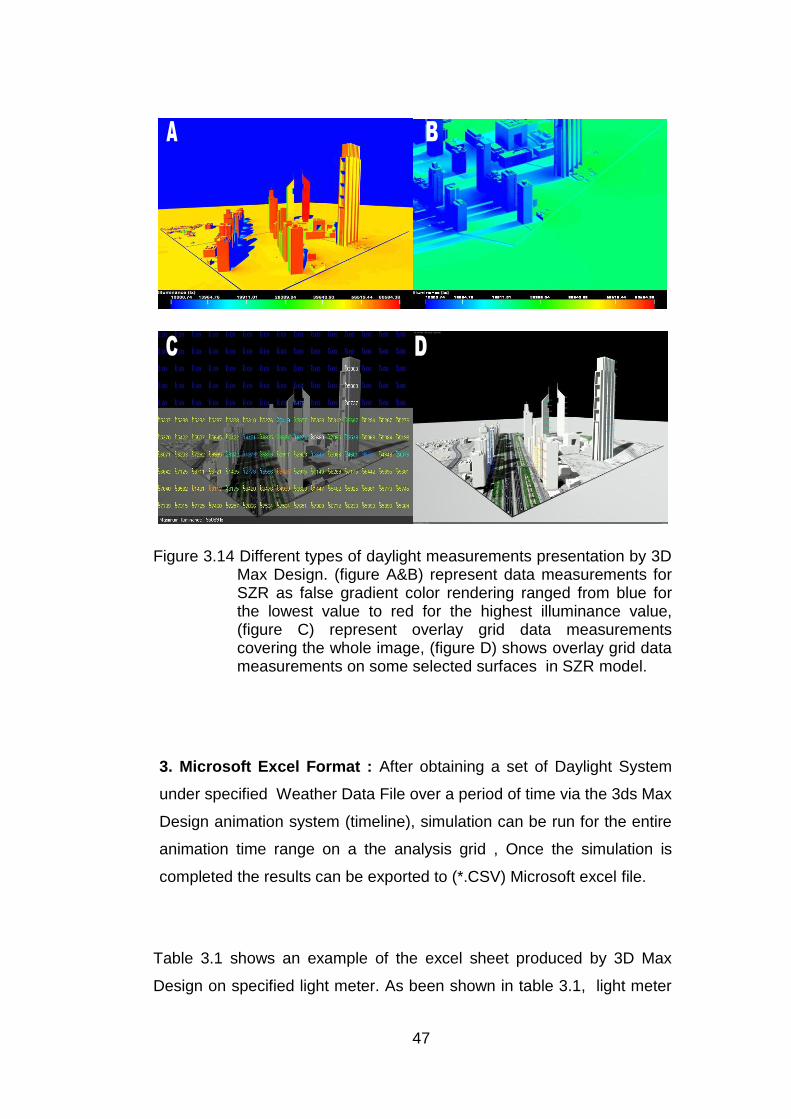
47
Figure 3.14 Different types of daylight measurements presentation by 3D Max Design. (figure A&B) represent data measurements for SZR as false gradient color rendering ranged from blue for the lowest value to red for the highest illuminance value, (figure C) represent overlay grid data measurements covering the whole image, (figure D) shows overlay grid data measurements on some selected surfaces in SZR model.
3. Microsoft Excel Format : After obtaining a set of Daylight System
under specified Weather Data File over a period of time via the 3ds Max
Design animation system (timeline), simulation can be run for the entire
animation time range on a the analysis grid , Once the simulation is
completed the results can be exported to (*.CSV) Microsoft excel file.
Table 3.1 shows an example of the excel sheet produced by 3D Max
Design on specified light meter. As been shown in table 3.1, light meter
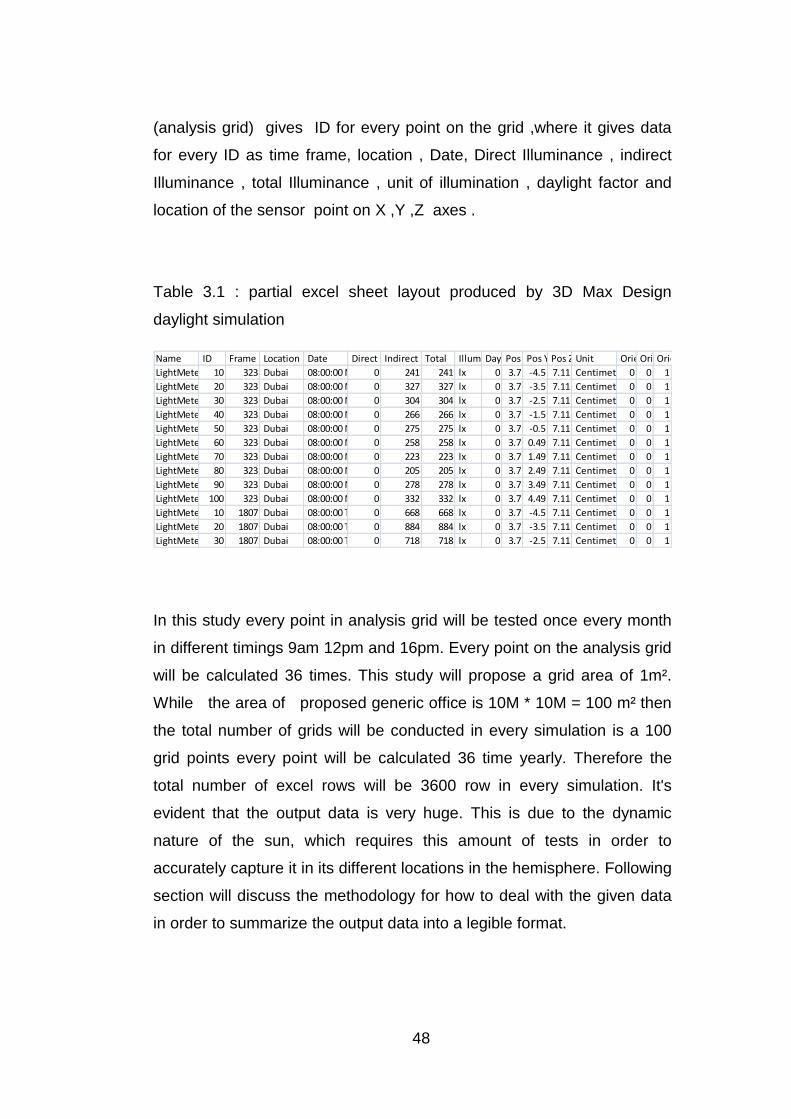
48
(analysis grid) gives ID for every point on the grid ,where it gives data
for every ID as time frame, location , Date, Direct Illuminance , indirect
Illuminance , total Illuminance , unit of illumination , daylight factor and
location of the sensor point on X ,Y ,Z axes .
Table 3.1 : partial excel sheet layout produced by 3D Max Design
daylight simulation
Name ID Frame Location Date Direct Indirect Total Illum. Unit Daylight Factor Pos X Pos Y Pos Z Unit Orient. X Orient Y Orient Z
LightMeter Helper0110 323 Dubai 08:00:00 Monday February 2 1987 0 241 241 lx 0 3.7 -4.5 7.11 Centimeters0 0 1
LightMeter Helper0120 323 Dubai 08:00:00 Monday February 2 1987 0 327 327 lx 0 3.7 -3.5 7.11 Centimeters0 0 1
LightMeter Helper0130 323 Dubai 08:00:00 Monday February 2 1987 0 304 304 lx 0 3.7 -2.5 7.11 Centimeters0 0 1
LightMeter Helper0140 323 Dubai 08:00:00 Monday February 2 1987 0 266 266 lx 0 3.7 -1.5 7.11 Centimeters0 0 1
LightMeter Helper0150 323 Dubai 08:00:00 Monday February 2 1987 0 275 275 lx 0 3.7 -0.5 7.11 Centimeters0 0 1
LightMeter Helper0160 323 Dubai 08:00:00 Monday February 2 1987 0 258 258 lx 0 3.7 0.49 7.11 Centimeters0 0 1
LightMeter Helper0170 323 Dubai 08:00:00 Monday February 2 1987 0 223 223 lx 0 3.7 1.49 7.11 Centimeters0 0 1
LightMeter Helper0180 323 Dubai 08:00:00 Monday February 2 1987 0 205 205 lx 0 3.7 2.49 7.11 Centimeters0 0 1
LightMeter Helper0190 323 Dubai 08:00:00 Monday February 2 1987 0 278 278 lx 0 3.7 3.49 7.11 Centimeters0 0 1
LightMeter Helper01100 323 Dubai 08:00:00 Monday February 2 1987 0 332 332 lx 0 3.7 4.49 7.11 Centimeters0 0 1
LightMeter Helper0110 1807 Dubai 08:00:00 Thursday July 1 1993 0 668 668 lx 0 3.7 -4.5 7.11 Centimeters0 0 1
LightMeter Helper0120 1807 Dubai 08:00:00 Thursday July 1 1993 0 884 884 lx 0 3.7 -3.5 7.11 Centimeters0 0 1
LightMeter Helper0130 1807 Dubai 08:00:00 Thursday July 1 1993 0 718 718 lx 0 3.7 -2.5 7.11 Centimeters0 0 1
In this study every point in analysis grid will be tested once every month
in different timings 9am 12pm and 16pm. Every point on the analysis grid
will be calculated 36 times. This study will propose a grid area of 1m².
While the area of proposed generic office is 10M * 10M = 100 m² then
the total number of grids will be conducted in every simulation is a 100
grid points every point will be calculated 36 time yearly. Therefore the
total number of excel rows will be 3600 row in every simulation. It's
evident that the output data is very huge. This is due to the dynamic
nature of the sun, which requires this amount of tests in order to
accurately capture it in its different locations in the hemisphere. Following
section will discuss the methodology for how to deal with the given data
in order to summarize the output data into a legible format.
49
3.7 Analysis & Discussion
From the data collected in the tests, an analysis on the performance of
different vertical facades and daylight performance in the internal office
space will be conducted. Changing specifications of one or all of
mentioned parameters will be studied and the effect of illumination falling
on vertical facade or penetrating to the internal space will be analyzed
rendered images. Tables and charts will represent the measured values.
UDI (useful daylight illuminance) will be displayed as an evaluation metric
for daylight performance where a simple comparison method will be done
between different UDI for different offices parameter will finally leads to
the optimum solution.
3.8 Summaries
In the conclusion, tables and charts presented in the analysis will be
referred to , then a summary outcome of the testes will be presented to
support the final conclusion . The conclusion for the UDI tables will give
an indication as to where a Designer should focus on in the early stage of
design. Those indications will be written as a general guidance to be
useful for every one authorities ,architects ,developers or investigators.
The research will conclude with some recommendations on research
direction that future investigators wishing to further extend the study may
focus on. Figure 3.16 summarize research methodology stages in
sequence.
Figure (3.15) summarize the maintained Research stages process:
Different methods used in
the past for daylight
design
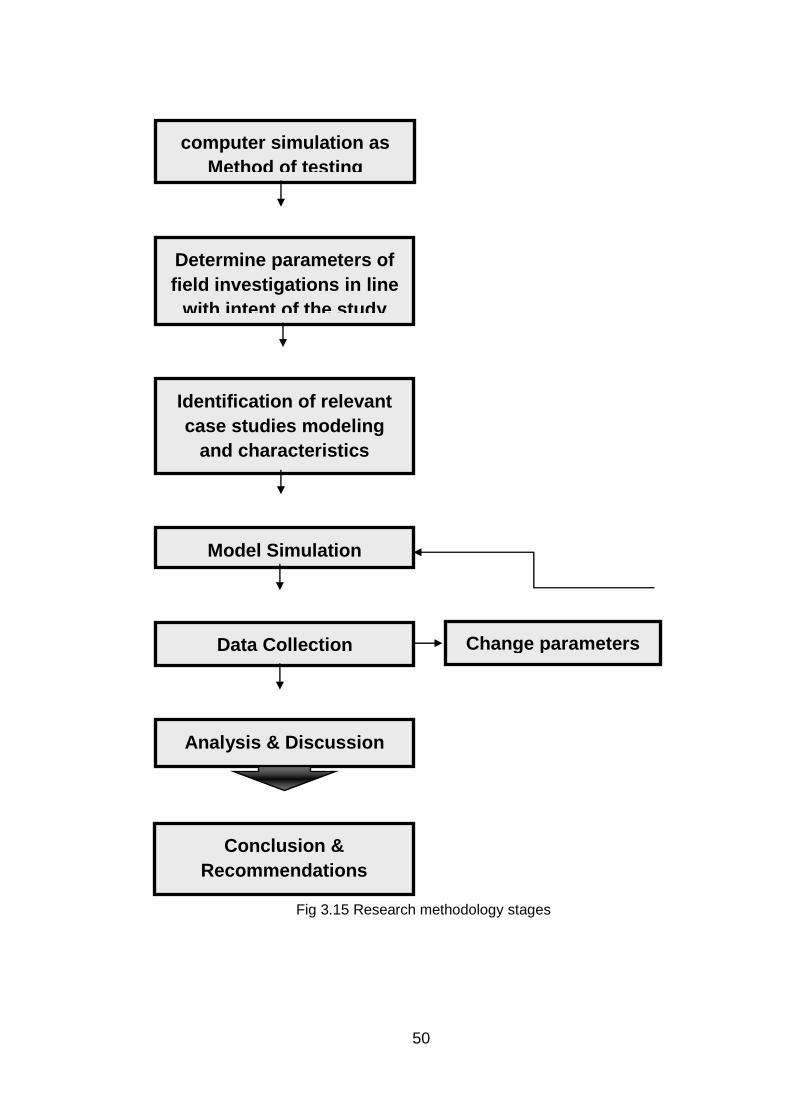
50
Fig 3.15 Research methodology stages
Conclusion &
Recommendations
Model Simulation
Data Collection
Analysis & Discussion
Identification of relevant
case studies modeling
and characteristics
Determine parameters of
field investigations in line
with intent of the study
computer simulation as
Method of testing
Change parameters
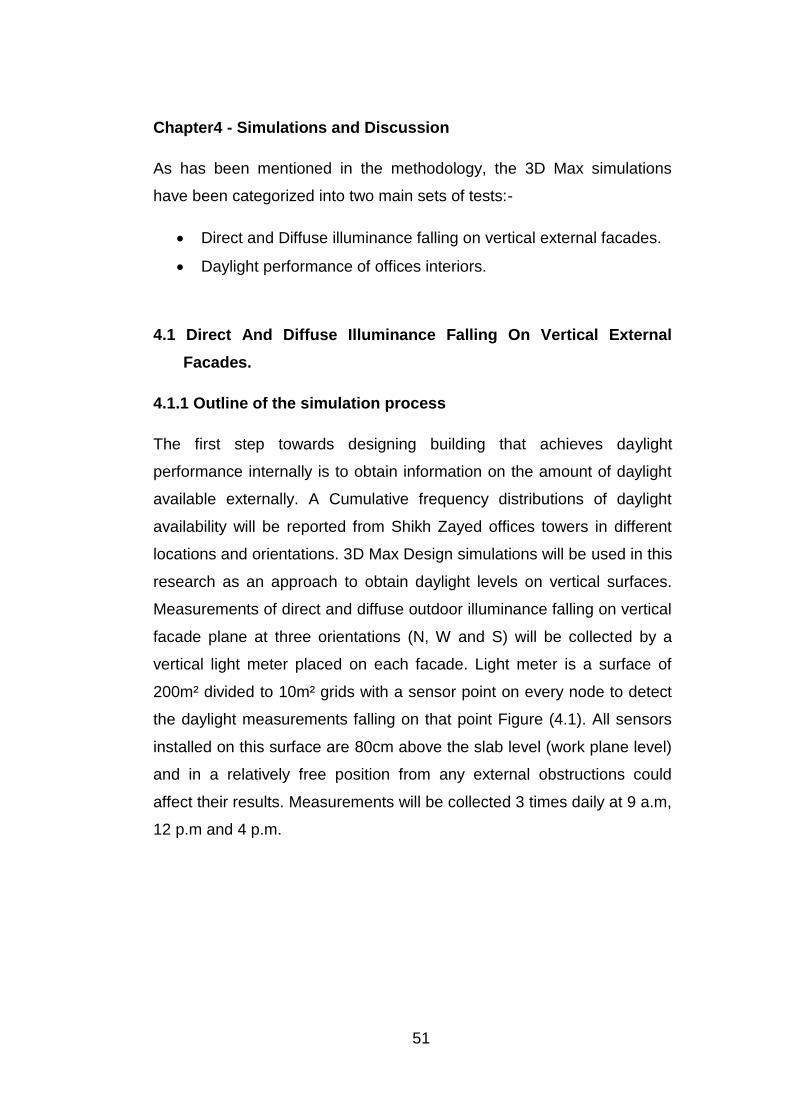
51
Chapter4 - Simulations and Discussion
As has been mentioned in the methodology, the 3D Max simulations
have been categorized into two main sets of tests:-
Direct and Diffuse illuminance falling on vertical external facades.
Daylight performance of offices interiors.
4.1 Direct And Diffuse Illuminance Falling On Vertical External
Facades.
4.1.1 Outline of the simulation process
The first step towards designing building that achieves daylight
performance internally is to obtain information on the amount of daylight
available externally. A Cumulative frequency distributions of daylight
availability will be reported from Shikh Zayed offices towers in different
locations and orientations. 3D Max Design simulations will be used in this
research as an approach to obtain daylight levels on vertical surfaces.
Measurements of direct and diffuse outdoor illuminance falling on vertical
facade plane at three orientations (N, W and S) will be collected by a
vertical light meter placed on each facade. Light meter is a surface of
200m² divided to 10m² grids with a sensor point on every node to detect
the daylight measurements falling on that point Figure (4.1). All sensors
installed on this surface are 80cm above the slab level (work plane level)
and in a relatively free position from any external obstructions could
affect their results. Measurements will be collected 3 times daily at 9 a.m,
12 p.m and 4 p.m.
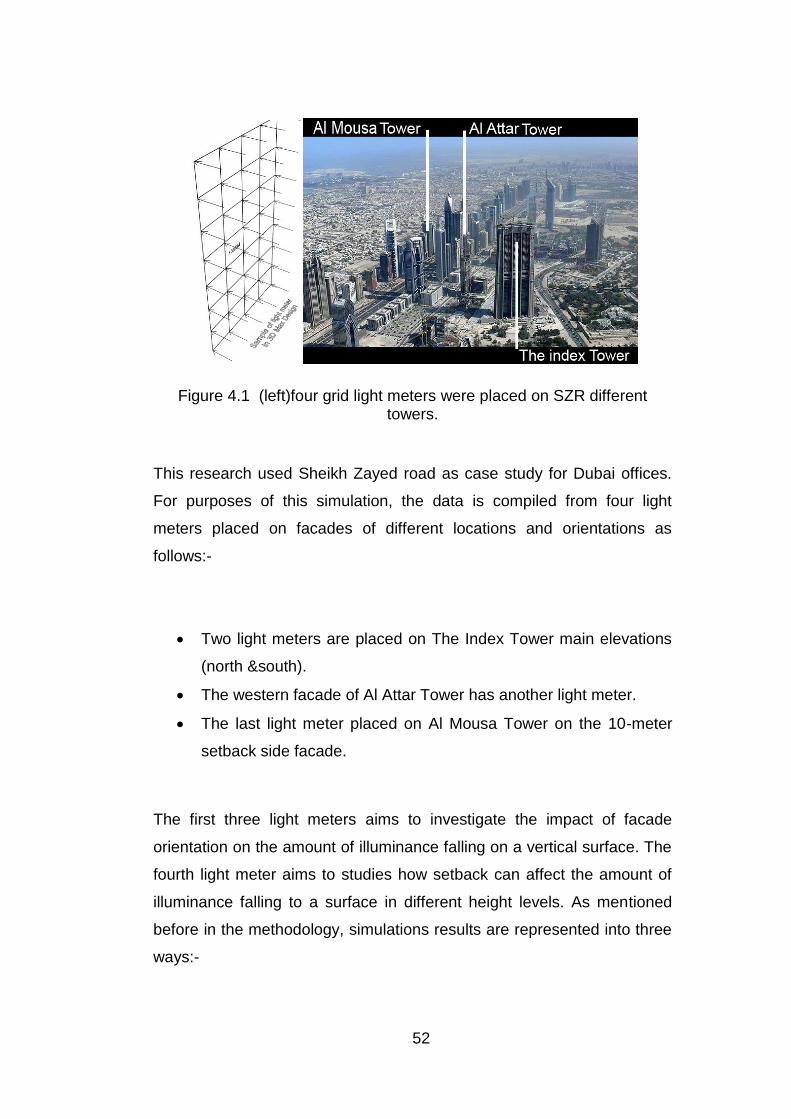
52
Figure 4.1 (left)four grid light meters were placed on SZR different towers.
This research used Sheikh Zayed road as case study for Dubai offices.
For purposes of this simulation, the data is compiled from four light
meters placed on facades of different locations and orientations as
follows:-
Two light meters are placed on The Index Tower main elevations
(north &south).
The western facade of Al Attar Tower has another light meter.
The last light meter placed on Al Mousa Tower on the 10-meter
setback side facade.
The first three light meters aims to investigate the impact of facade
orientation on the amount of illuminance falling on a vertical surface. The
fourth light meter aims to studies how setback can affect the amount of
illuminance falling to a surface in different height levels. As mentioned
before in the methodology, simulations results are represented into three
ways:-
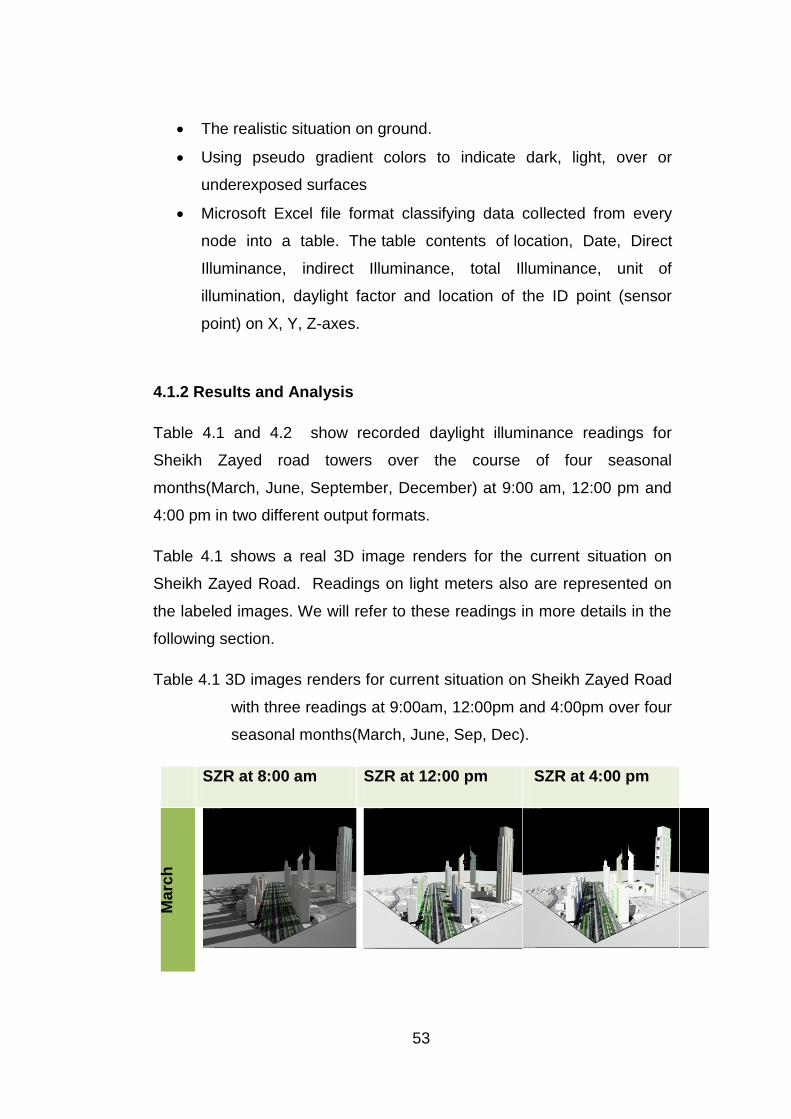
53
The realistic situation on ground.
Using pseudo gradient colors to indicate dark, light, over or
underexposed surfaces
Microsoft Excel file format classifying data collected from every
node into a table. The table contents of location, Date, Direct
Illuminance, indirect Illuminance, total Illuminance, unit of
illumination, daylight factor and location of the ID point (sensor
point) on X, Y, Z-axes.
4.1.2 Results and Analysis
Table 4.1 and 4.2 show recorded daylight illuminance readings for
Sheikh Zayed road towers over the course of four seasonal
months(March, June, September, December) at 9:00 am, 12:00 pm and
4:00 pm in two different output formats.
Table 4.1 shows a real 3D image renders for the current situation on
Sheikh Zayed Road. Readings on light meters also are represented on
the labeled images. We will refer to these readings in more details in the
following section.
Table 4.1 3D images renders for current situation on Sheikh Zayed Road
with three readings at 9:00am, 12:00pm and 4:00pm over four
seasonal months(March, June, Sep, Dec).
SZR at 8:00 am SZR at 12:00 pm SZR at 4:00 pm
Ma
rch
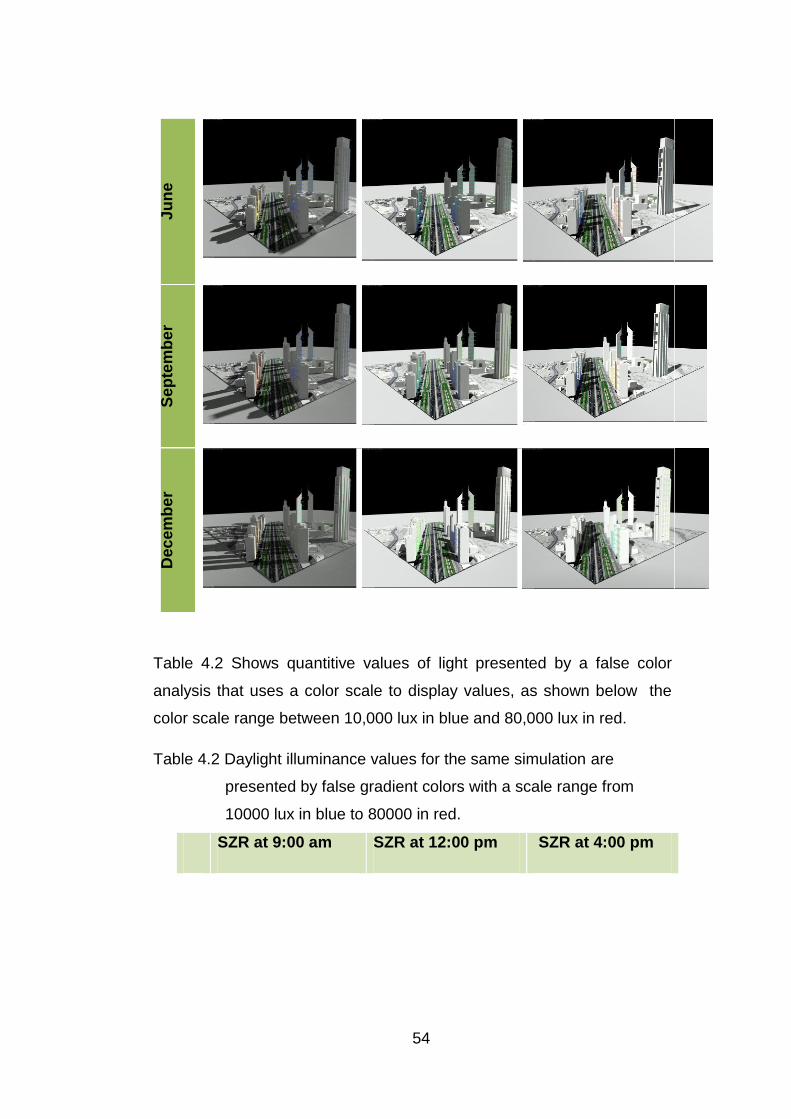
54
Ju
ne
Se
pte
mb
er
Dec
em
be
r
Table 4.2 Shows quantitive values of light presented by a false color
analysis that uses a color scale to display values, as shown below the
color scale range between 10,000 lux in blue and 80,000 lux in red.
Table 4.2 Daylight illuminance values for the same simulation are
presented by false gradient colors with a scale range from
10000 lux in blue to 80000 in red.
SZR at 9:00 am SZR at 12:00 pm SZR at 4:00 pm
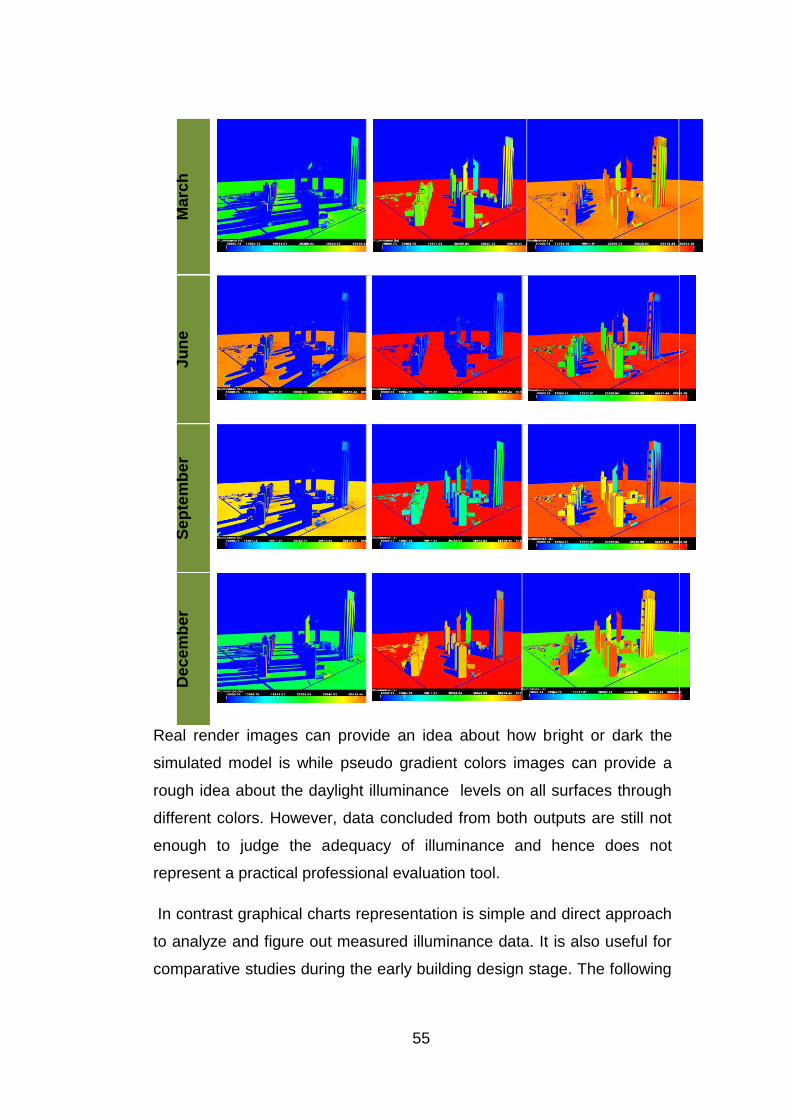
55
Ma
rch
Ju
ne
Se
pte
mb
er
Dec
em
be
r
Real render images can provide an idea about how bright or dark the
simulated model is while pseudo gradient colors images can provide a
rough idea about the daylight illuminance levels on all surfaces through
different colors. However, data concluded from both outputs are still not
enough to judge the adequacy of illuminance and hence does not
represent a practical professional evaluation tool.
In contrast graphical charts representation is simple and direct approach
to analyze and figure out measured illuminance data. It is also useful for
comparative studies during the early building design stage. The following
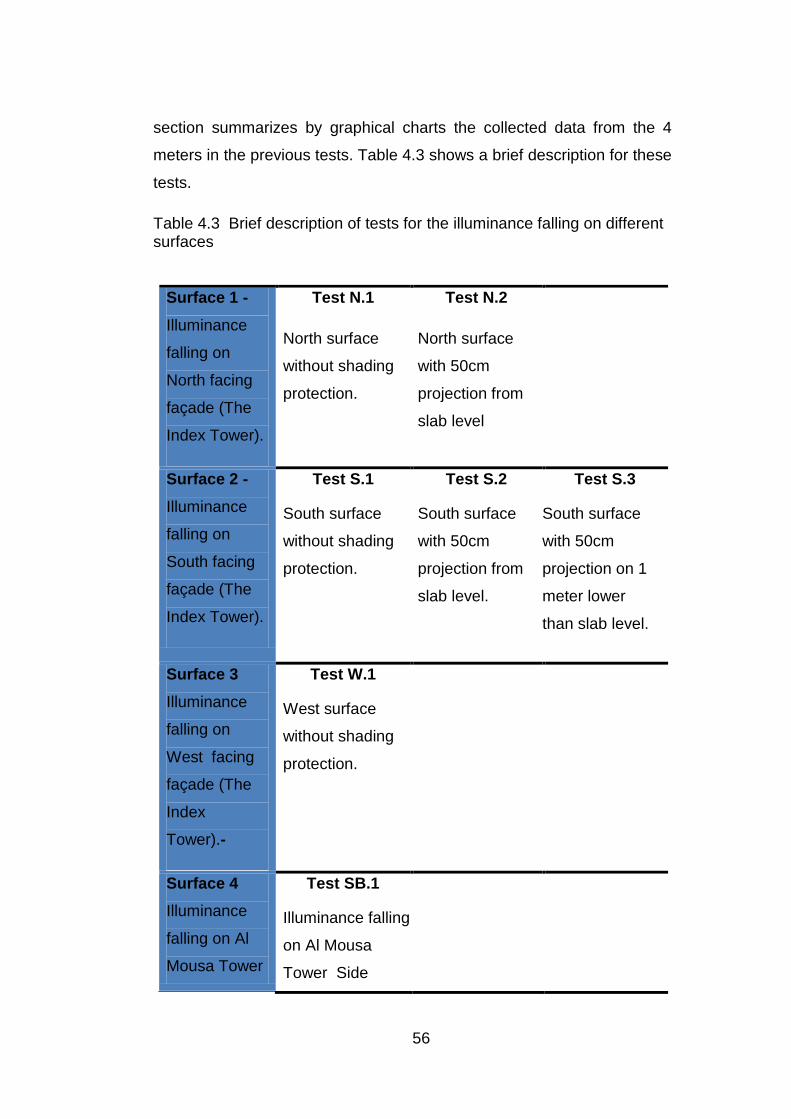
56
section summarizes by graphical charts the collected data from the 4
meters in the previous tests. Table 4.3 shows a brief description for these
tests.
Table 4.3 Brief description of tests for the illuminance falling on different surfaces
Surface 1 -
Illuminance
falling on
North facing
façade (The
Index Tower).
Test N.1
North surface
without shading
protection.
Test N.2
North surface
with 50cm
projection from
slab level
Surface 2 -
Illuminance
falling on
South facing
façade (The
Index Tower).
Test S.1
South surface
without shading
protection.
Test S.2
South surface
with 50cm
projection from
slab level.
Test S.3
South surface
with 50cm
projection on 1
meter lower
than slab level.
Surface 3
Illuminance
falling on
West facing
façade (The
Index
Tower).-
Test W.1
West surface
without shading
protection.
Surface 4
Illuminance
falling on Al
Mousa Tower
Test SB.1
Illuminance falling
on Al Mousa
Tower Side
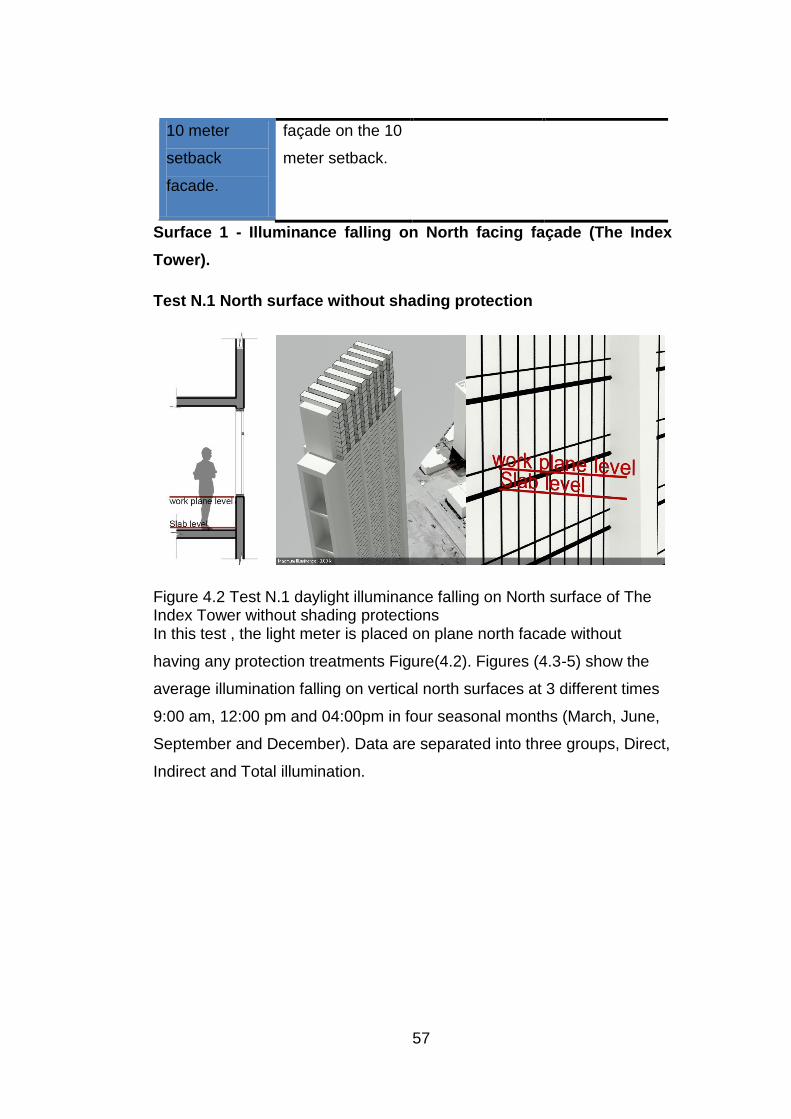
57
10 meter
setback
facade.
façade on the 10
meter setback.
Surface 1 - Illuminance falling on North facing façade (The Index
Tower).
Test N.1 North surface without shading protection
Figure 4.2 Test N.1 daylight illuminance falling on North surface of The Index Tower without shading protections In this test , the light meter is placed on plane north facade without
having any protection treatments Figure(4.2). Figures (4.3-5) show the
average illumination falling on vertical north surfaces at 3 different times
9:00 am, 12:00 pm and 04:00pm in four seasonal months (March, June,
September and December). Data are separated into three groups, Direct,
Indirect and Total illumination.
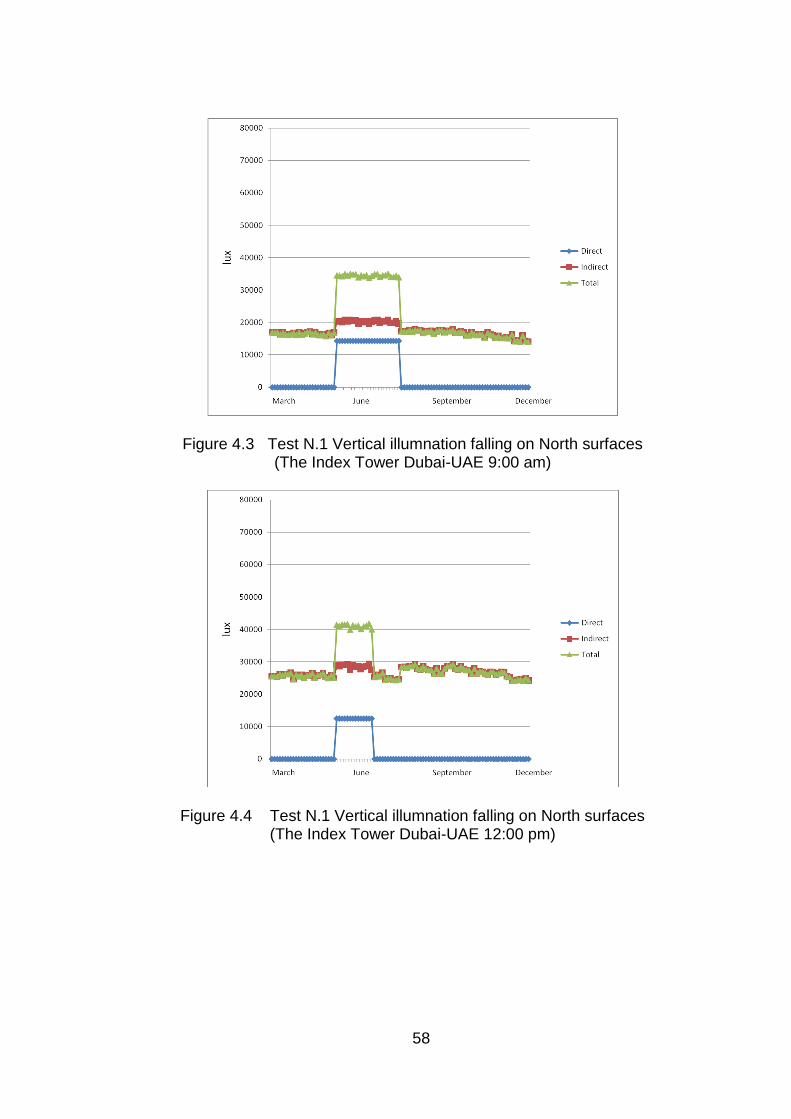
58
Figure 4.3 Test N.1 Vertical illumnation falling on North surfaces (The Index Tower Dubai-UAE 9:00 am)
Figure 4.4 Test N.1 Vertical illumnation falling on North surfaces (The Index Tower Dubai-UAE 12:00 pm)
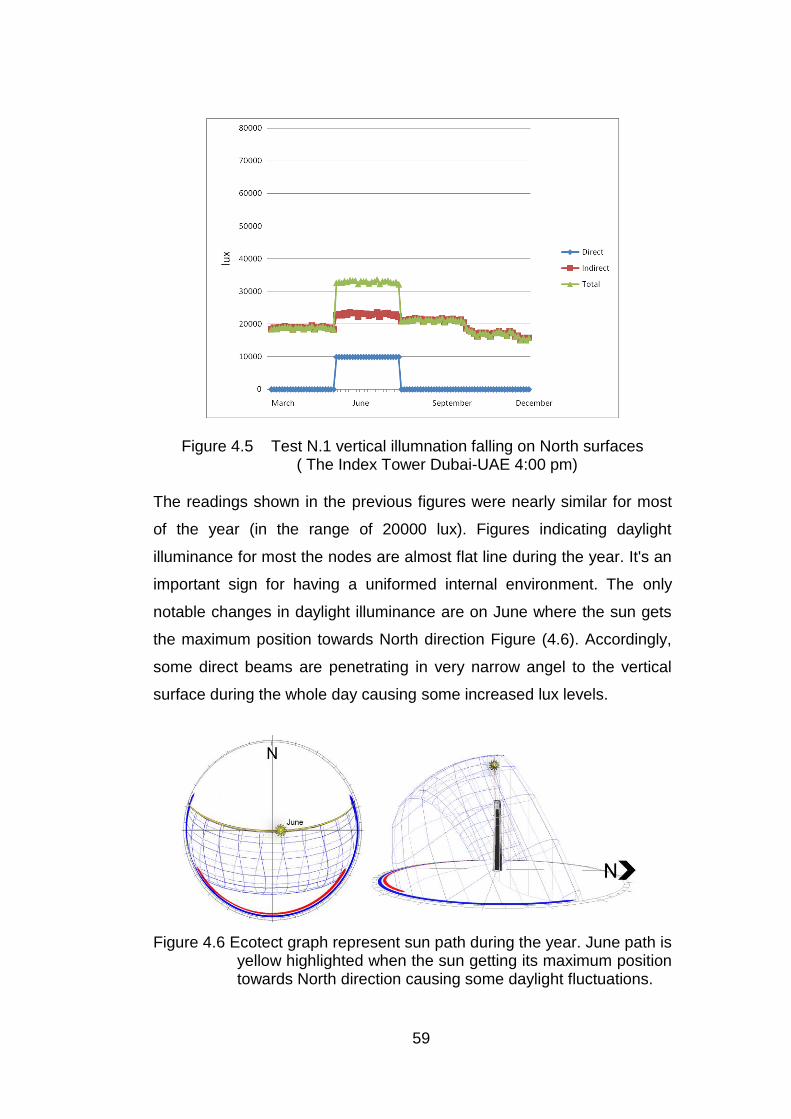
59
Figure 4.5 Test N.1 vertical illumnation falling on North surfaces ( The Index Tower Dubai-UAE 4:00 pm)
The readings shown in the previous figures were nearly similar for most
of the year (in the range of 20000 lux). Figures indicating daylight
illuminance for most the nodes are almost flat line during the year. It's an
important sign for having a uniformed internal environment. The only
notable changes in daylight illuminance are on June where the sun gets
the maximum position towards North direction Figure (4.6). Accordingly,
some direct beams are penetrating in very narrow angel to the vertical
surface during the whole day causing some increased lux levels.
Figure 4.6 Ecotect graph represent sun path during the year. June path is yellow highlighted when the sun getting its maximum position towards North direction causing some daylight fluctuations.
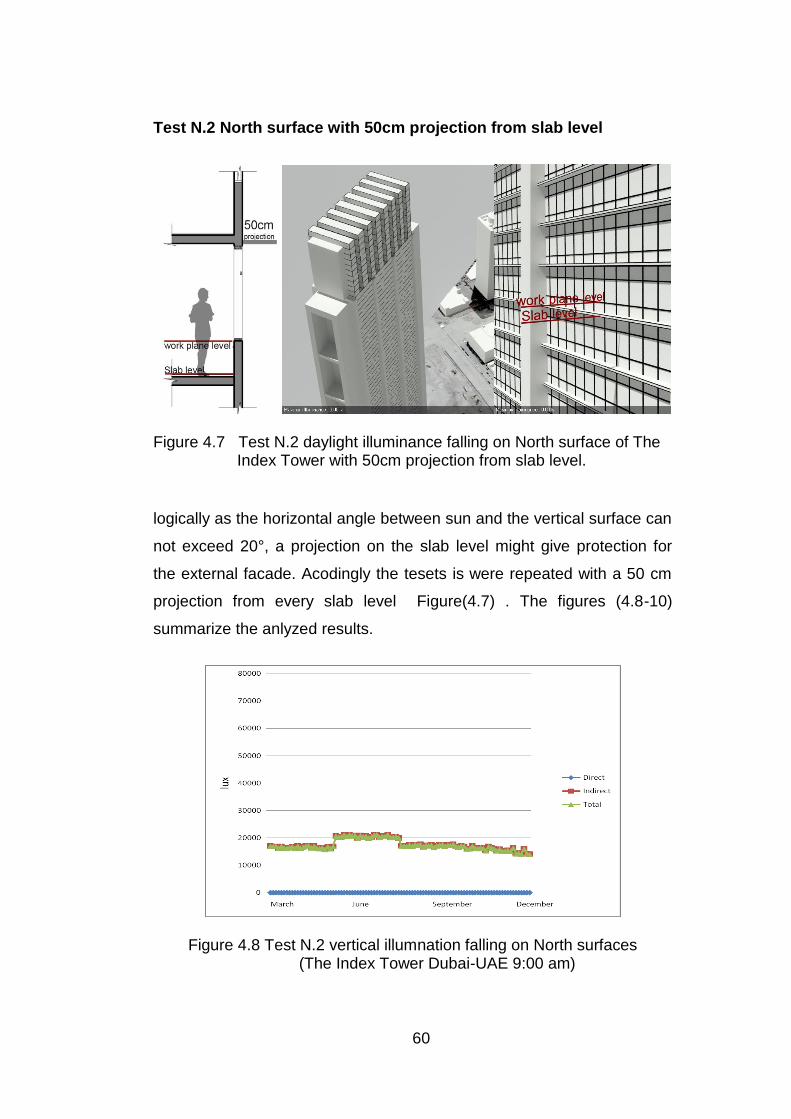
60
Test N.2 North surface with 50cm projection from slab level
Figure 4.7 Test N.2 daylight illuminance falling on North surface of The Index Tower with 50cm projection from slab level.
logically as the horizontal angle between sun and the vertical surface can
not exceed 20°, a projection on the slab level might give protection for
the external facade. Acodingly the tesets is were repeated with a 50 cm
projection from every slab level Figure(4.7) . The figures (4.8-10)
summarize the anlyzed results.
Figure 4.8 Test N.2 vertical illumnation falling on North surfaces (The Index Tower Dubai-UAE 9:00 am)
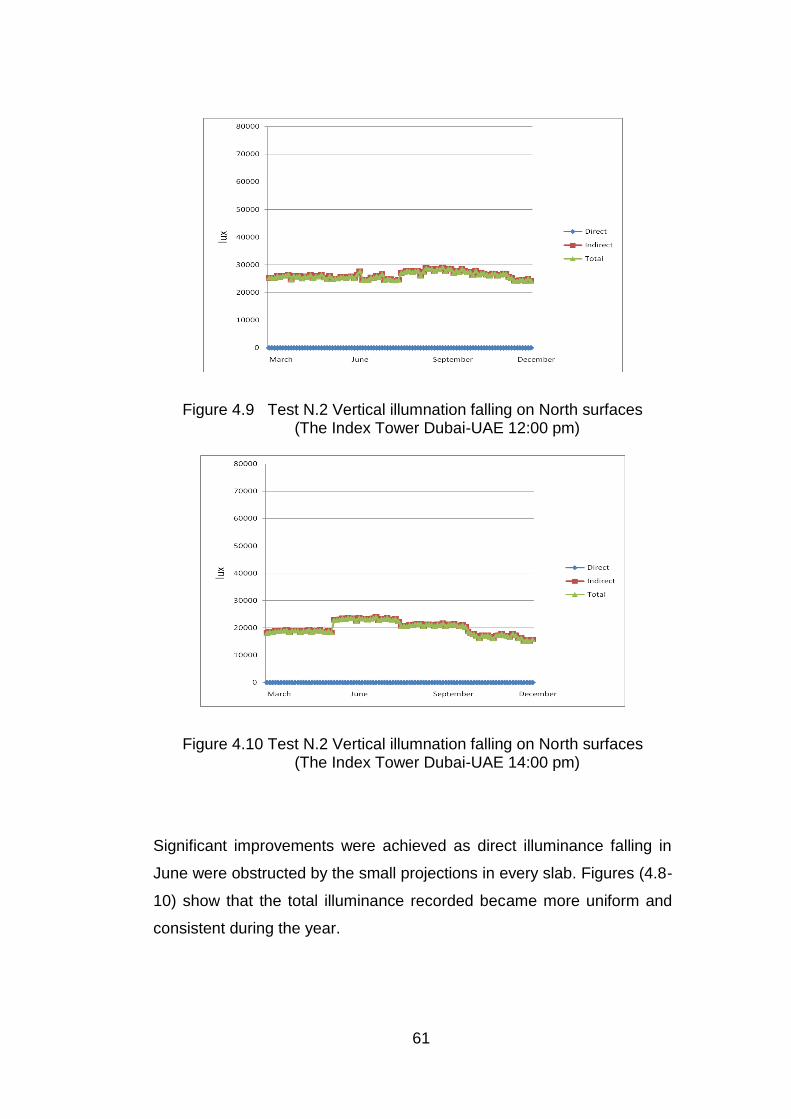
61
Figure 4.9 Test N.2 Vertical illumnation falling on North surfaces (The Index Tower Dubai-UAE 12:00 pm)
Figure 4.10 Test N.2 Vertical illumnation falling on North surfaces (The Index Tower Dubai-UAE 14:00 pm)
Significant improvements were achieved as direct illuminance falling in
June were obstructed by the small projections in every slab. Figures (4.8-
10) show that the total illuminance recorded became more uniform and
consistent during the year.
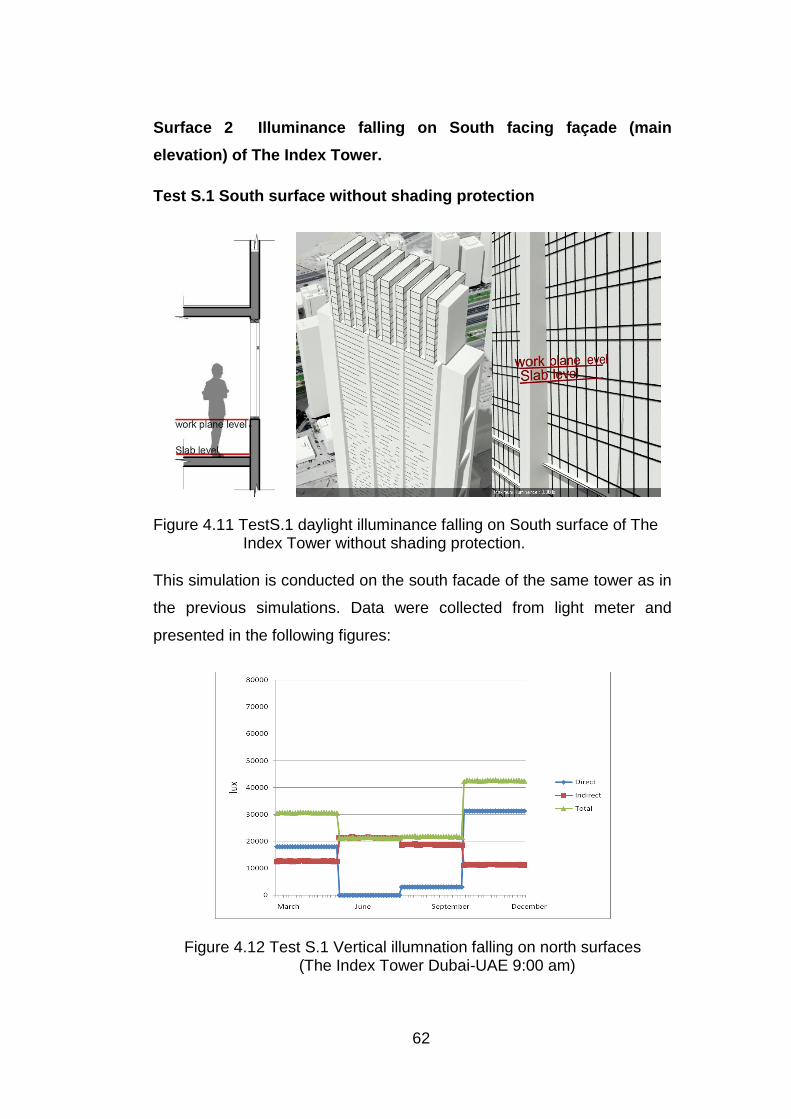
62
Surface 2 Illuminance falling on South facing façade (main
elevation) of The Index Tower.
Test S.1 South surface without shading protection
Figure 4.11 TestS.1 daylight illuminance falling on South surface of The Index Tower without shading protection.
This simulation is conducted on the south facade of the same tower as in
the previous simulations. Data were collected from light meter and
presented in the following figures:
Figure 4.12 Test S.1 Vertical illumnation falling on north surfaces (The Index Tower Dubai-UAE 9:00 am)
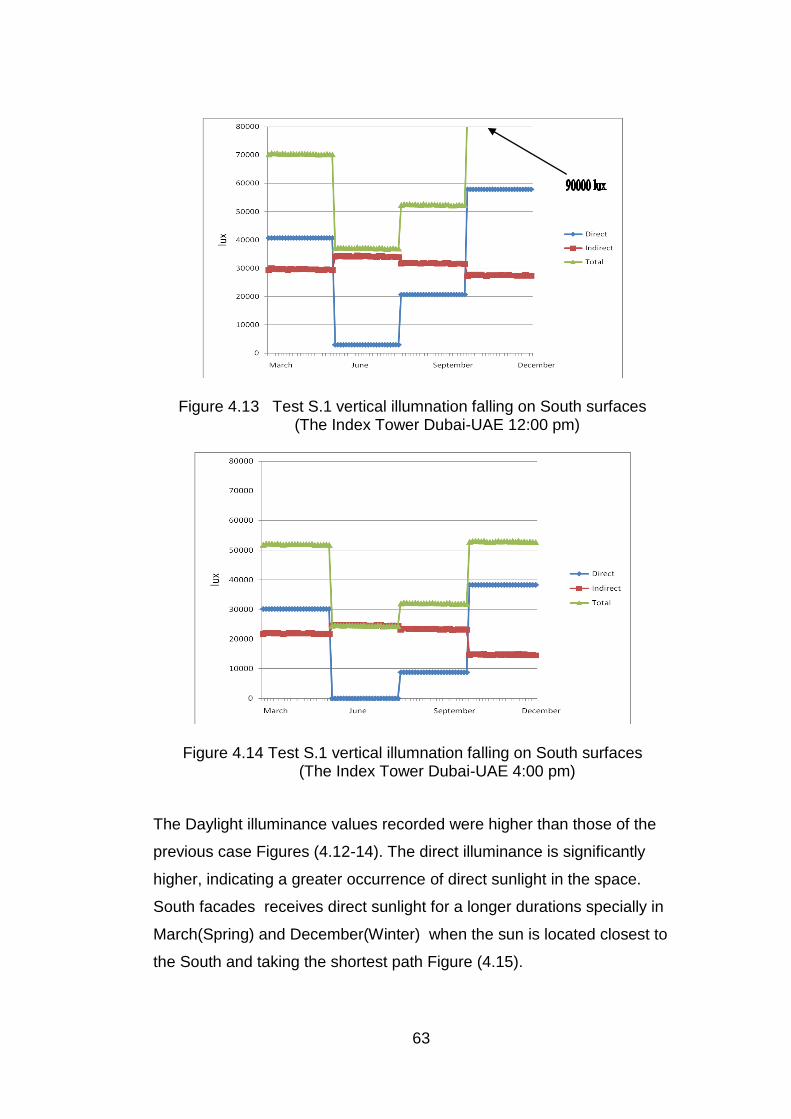
63
Figure 4.13 Test S.1 vertical illumnation falling on South surfaces (The Index Tower Dubai-UAE 12:00 pm)
Figure 4.14 Test S.1 vertical illumnation falling on South surfaces (The Index Tower Dubai-UAE 4:00 pm)
The Daylight illuminance values recorded were higher than those of the
previous case Figures (4.12-14). The direct illuminance is significantly
higher, indicating a greater occurrence of direct sunlight in the space.
South facades receives direct sunlight for a longer durations specially in
March(Spring) and December(Winter) when the sun is located closest to
the South and taking the shortest path Figure (4.15).
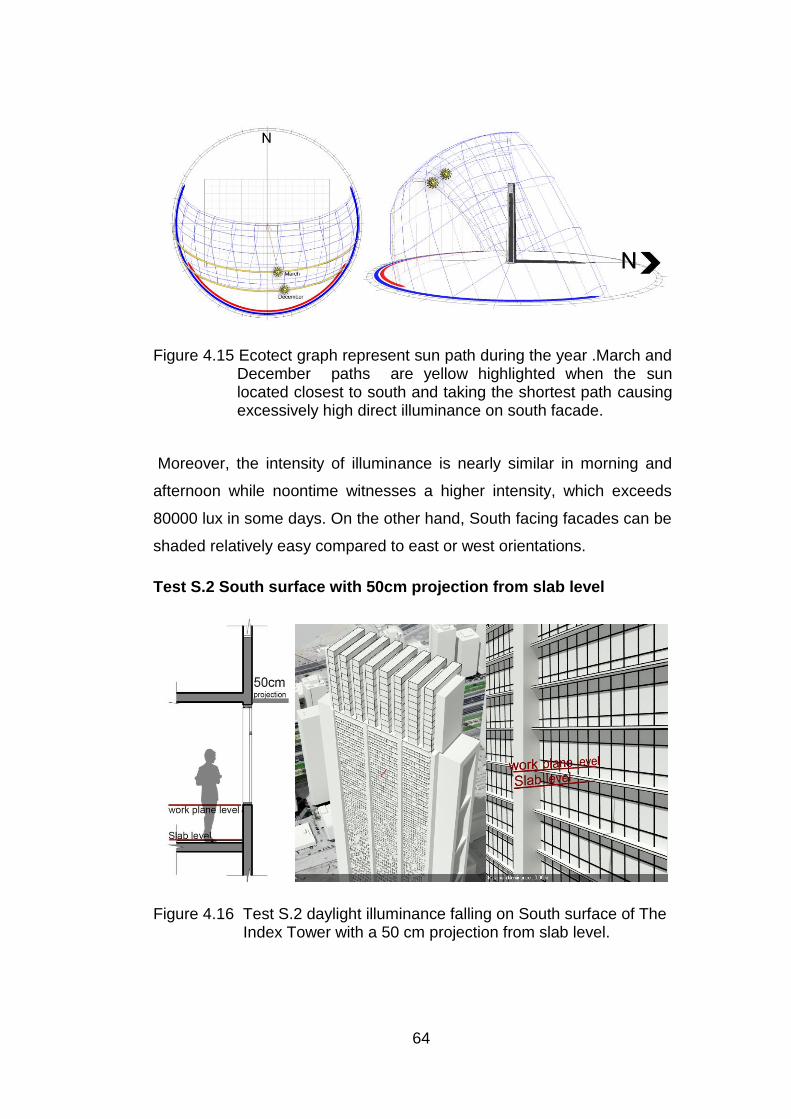
64
Figure 4.15 Ecotect graph represent sun path during the year .March and December paths are yellow highlighted when the sun located closest to south and taking the shortest path causing excessively high direct illuminance on south facade.
Moreover, the intensity of illuminance is nearly similar in morning and
afternoon while noontime witnesses a higher intensity, which exceeds
80000 lux in some days. On the other hand, South facing facades can be
shaded relatively easy compared to east or west orientations.
Test S.2 South surface with 50cm projection from slab level
Figure 4.16 Test S.2 daylight illuminance falling on South surface of The Index Tower with a 50 cm projection from slab level.
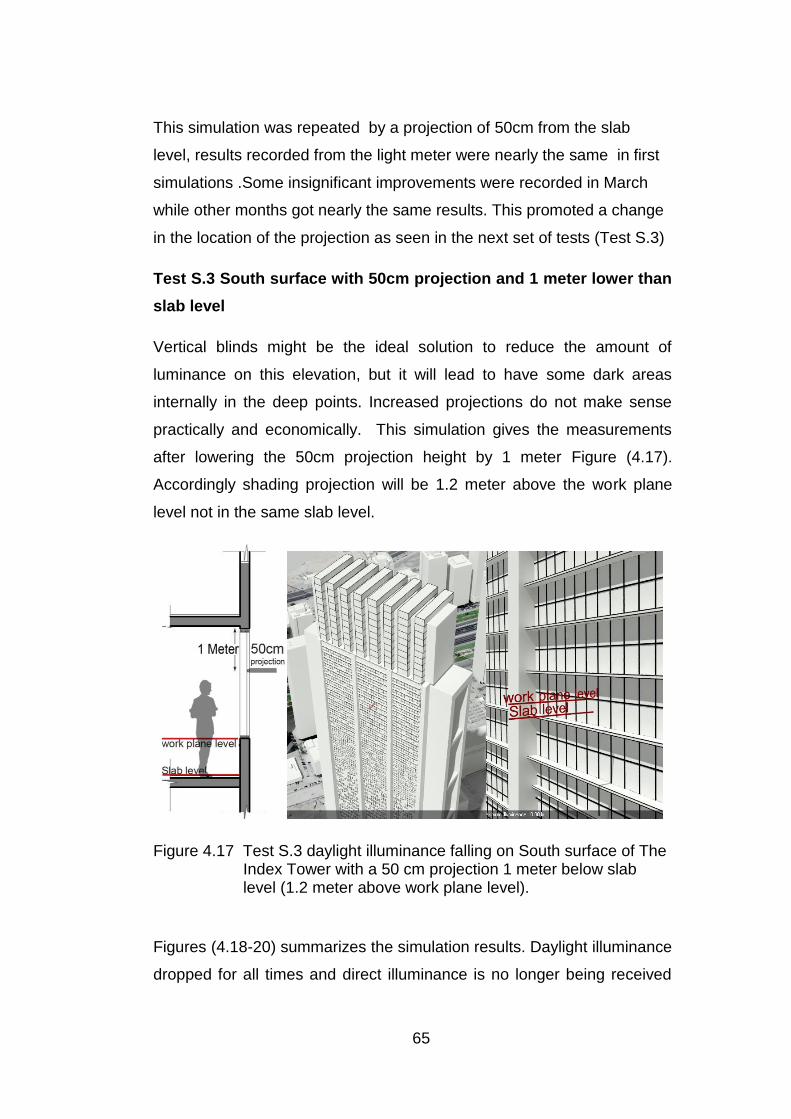
65
This simulation was repeated by a projection of 50cm from the slab
level, results recorded from the light meter were nearly the same in first
simulations .Some insignificant improvements were recorded in March
while other months got nearly the same results. This promoted a change
in the location of the projection as seen in the next set of tests (Test S.3)
Test S.3 South surface with 50cm projection and 1 meter lower than
slab level
Vertical blinds might be the ideal solution to reduce the amount of
luminance on this elevation, but it will lead to have some dark areas
internally in the deep points. Increased projections do not make sense
practically and economically. This simulation gives the measurements
after lowering the 50cm projection height by 1 meter Figure (4.17).
Accordingly shading projection will be 1.2 meter above the work plane
level not in the same slab level.
Figure 4.17 Test S.3 daylight illuminance falling on South surface of The Index Tower with a 50 cm projection 1 meter below slab level (1.2 meter above work plane level).
Figures (4.18-20) summarizes the simulation results. Daylight illuminance
dropped for all times and direct illuminance is no longer being received
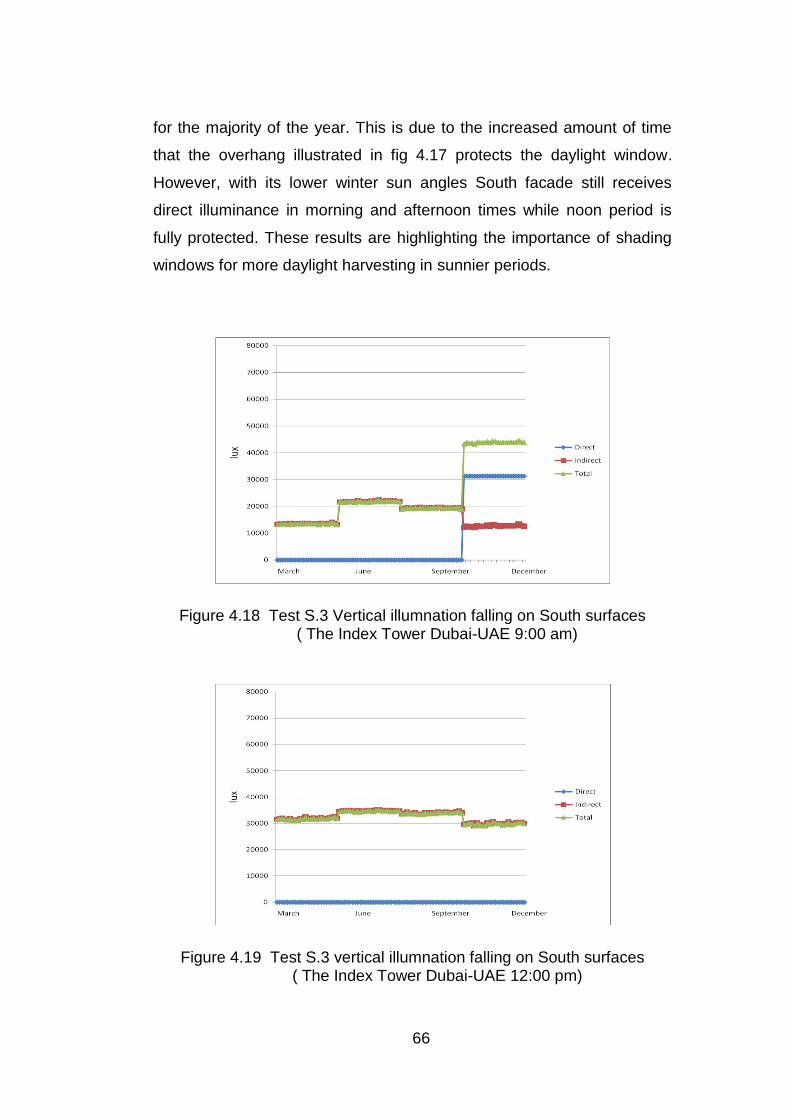
66
for the majority of the year. This is due to the increased amount of time
that the overhang illustrated in fig 4.17 protects the daylight window.
However, with its lower winter sun angles South facade still receives
direct illuminance in morning and afternoon times while noon period is
fully protected. These results are highlighting the importance of shading
windows for more daylight harvesting in sunnier periods.
Figure 4.18 Test S.3 Vertical illumnation falling on South surfaces ( The Index Tower Dubai-UAE 9:00 am)
Figure 4.19 Test S.3 vertical illumnation falling on South surfaces ( The Index Tower Dubai-UAE 12:00 pm)
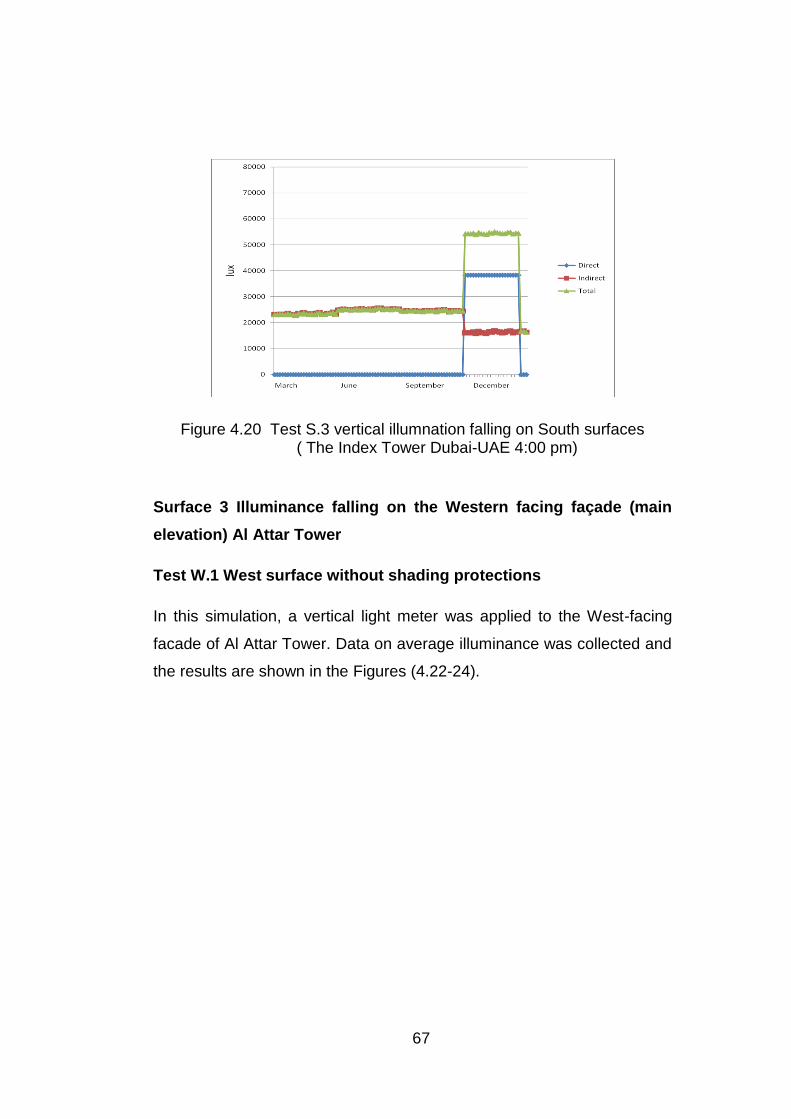
67
Figure 4.20 Test S.3 vertical illumnation falling on South surfaces ( The Index Tower Dubai-UAE 4:00 pm)
Surface 3 Illuminance falling on the Western facing façade (main
elevation) Al Attar Tower
Test W.1 West surface without shading protections
In this simulation, a vertical light meter was applied to the West-facing
facade of Al Attar Tower. Data on average illuminance was collected and
the results are shown in the Figures (4.22-24).
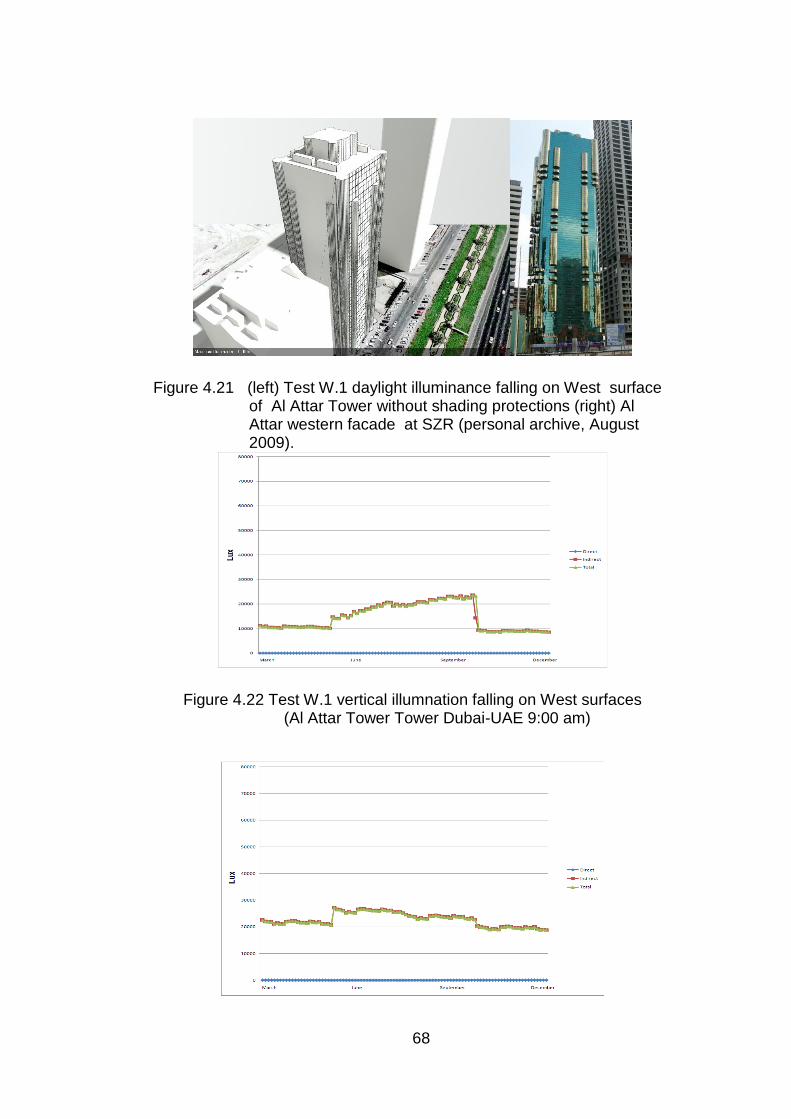
68
Figure 4.21 (left) Test W.1 daylight illuminance falling on West surface of Al Attar Tower without shading protections (right) Al Attar western facade at SZR (personal archive, August 2009).
Figure 4.22 Test W.1 vertical illumnation falling on West surfaces (Al Attar Tower Tower Dubai-UAE 9:00 am)
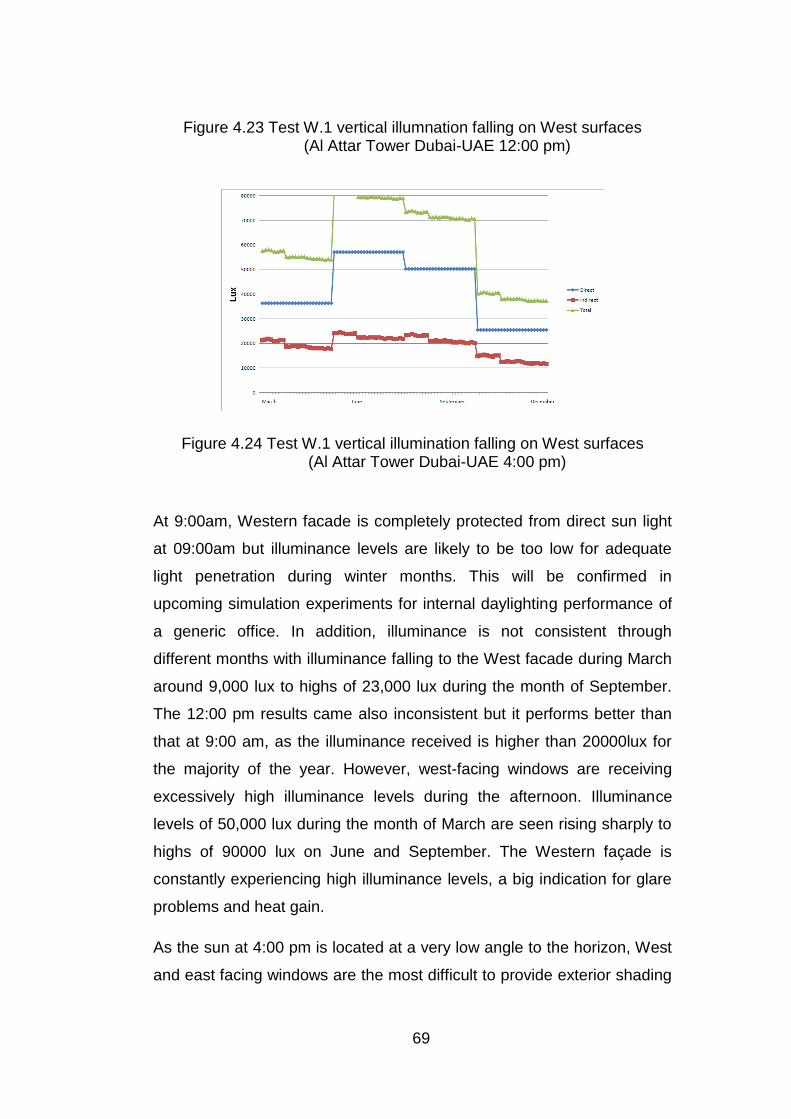
69
Figure 4.23 Test W.1 vertical illumnation falling on West surfaces (Al Attar Tower Dubai-UAE 12:00 pm)
Figure 4.24 Test W.1 vertical illumination falling on West surfaces (Al Attar Tower Dubai-UAE 4:00 pm)
At 9:00am, Western facade is completely protected from direct sun light
at 09:00am but illuminance levels are likely to be too low for adequate
light penetration during winter months. This will be confirmed in
upcoming simulation experiments for internal daylighting performance of
a generic office. In addition, illuminance is not consistent through
different months with illuminance falling to the West facade during March
around 9,000 lux to highs of 23,000 lux during the month of September.
The 12:00 pm results came also inconsistent but it performs better than
that at 9:00 am, as the illuminance received is higher than 20000lux for
the majority of the year. However, west-facing windows are receiving
excessively high illuminance levels during the afternoon. Illuminance
levels of 50,000 lux during the month of March are seen rising sharply to
highs of 90000 lux on June and September. The Western façade is
constantly experiencing high illuminance levels, a big indication for glare
problems and heat gain.
As the sun at 4:00 pm is located at a very low angle to the horizon, West
and east facing windows are the most difficult to provide exterior shading
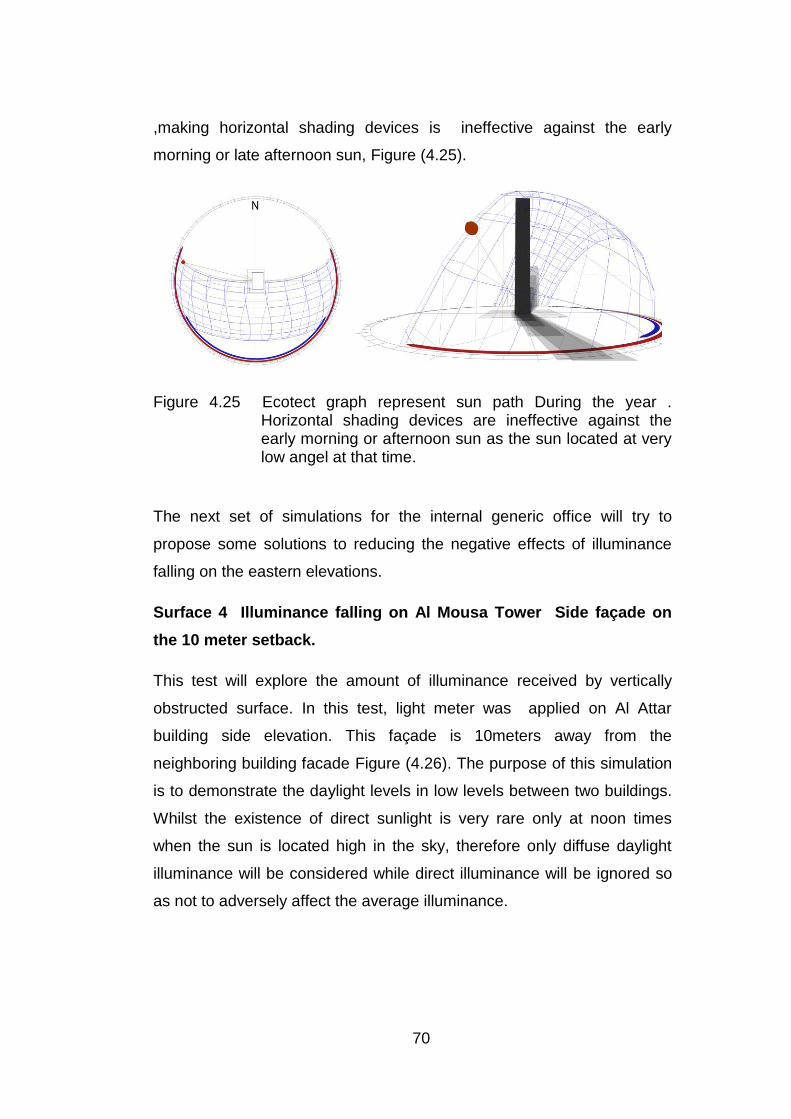
70
,making horizontal shading devices is ineffective against the early
morning or late afternoon sun, Figure (4.25).
Figure 4.25 Ecotect graph represent sun path During the year . Horizontal shading devices are ineffective against the early morning or afternoon sun as the sun located at very low angel at that time.
The next set of simulations for the internal generic office will try to
propose some solutions to reducing the negative effects of illuminance
falling on the eastern elevations.
Surface 4 Illuminance falling on Al Mousa Tower Side façade on
the 10 meter setback.
This test will explore the amount of illuminance received by vertically
obstructed surface. In this test, light meter was applied on Al Attar
building side elevation. This façade is 10meters away from the
neighboring building facade Figure (4.26). The purpose of this simulation
is to demonstrate the daylight levels in low levels between two buildings.
Whilst the existence of direct sunlight is very rare only at noon times
when the sun is located high in the sky, therefore only diffuse daylight
illuminance will be considered while direct illuminance will be ignored so
as not to adversely affect the average illuminance.
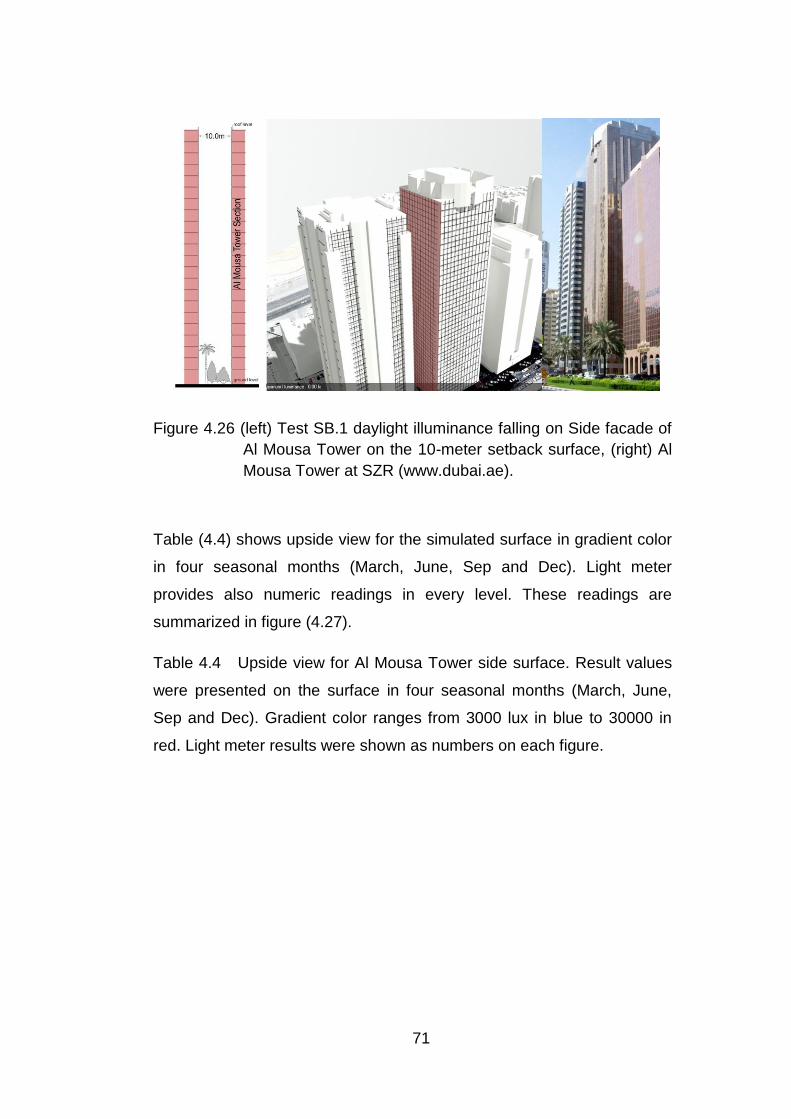
71
Figure 4.26 (left) Test SB.1 daylight illuminance falling on Side facade of
Al Mousa Tower on the 10-meter setback surface, (right) Al
Mousa Tower at SZR (www.dubai.ae).
Table (4.4) shows upside view for the simulated surface in gradient color
in four seasonal months (March, June, Sep and Dec). Light meter
provides also numeric readings in every level. These readings are
summarized in figure (4.27).
Table 4.4 Upside view for Al Mousa Tower side surface. Result values
were presented on the surface in four seasonal months (March, June,
Sep and Dec). Gradient color ranges from 3000 lux in blue to 30000 in
red. Light meter results were shown as numbers on each figure.
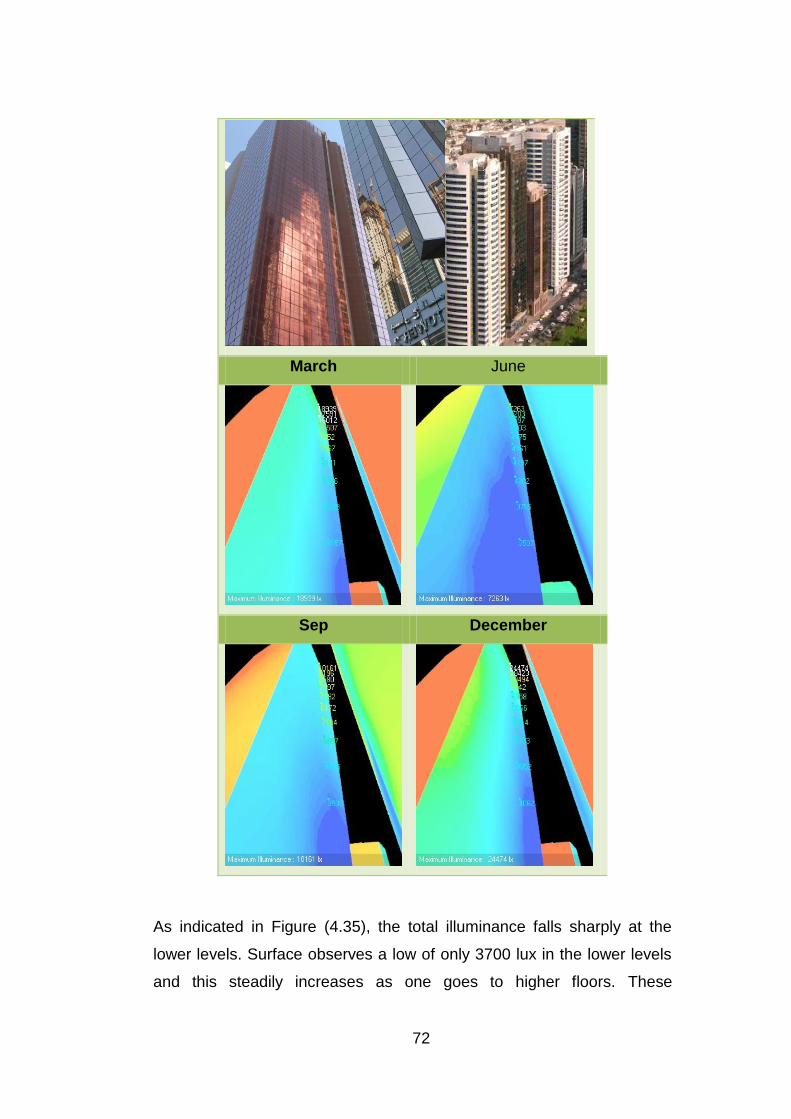
72
March June
Sep December
As indicated in Figure (4.35), the total illuminance falls sharply at the
lower levels. Surface observes a low of only 3700 lux in the lower levels
and this steadily increases as one goes to higher floors. These
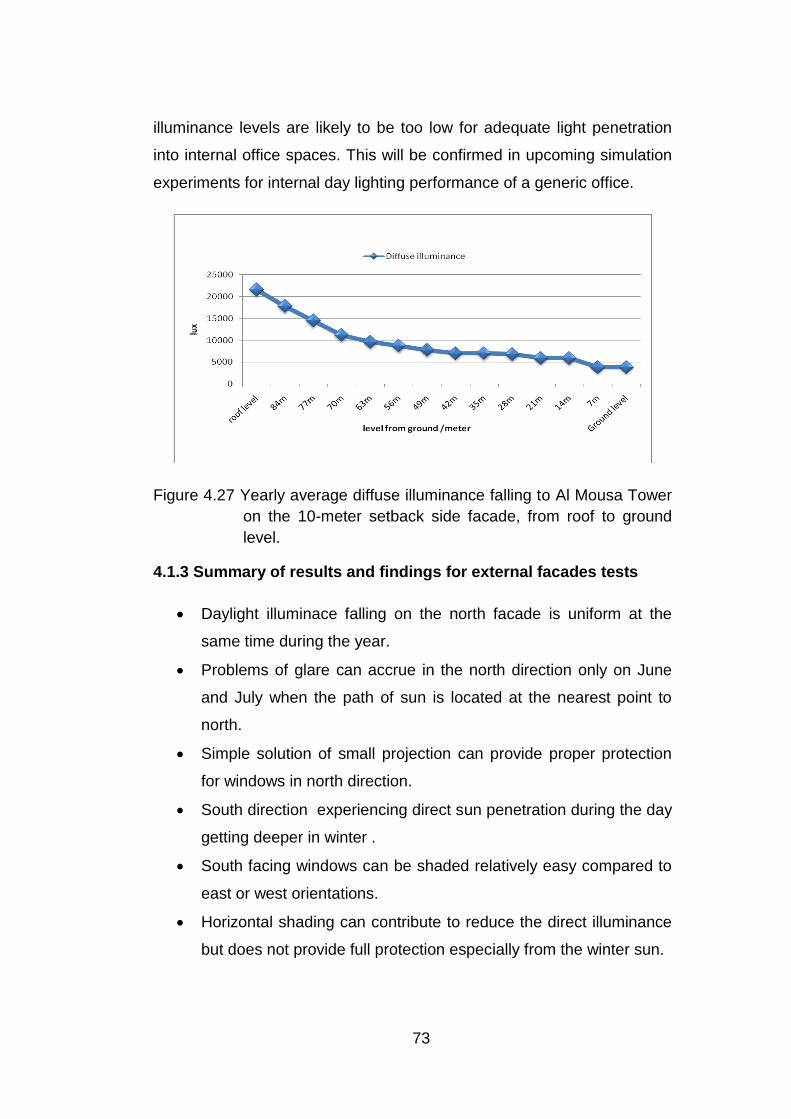
73
illuminance levels are likely to be too low for adequate light penetration
into internal office spaces. This will be confirmed in upcoming simulation
experiments for internal day lighting performance of a generic office.
Figure 4.27 Yearly average diffuse illuminance falling to Al Mousa Tower
on the 10-meter setback side facade, from roof to ground
level.
4.1.3 Summary of results and findings for external facades tests
Daylight illuminace falling on the north facade is uniform at the
same time during the year.
Problems of glare can accrue in the north direction only on June
and July when the path of sun is located at the nearest point to
north.
Simple solution of small projection can provide proper protection
for windows in north direction.
South direction experiencing direct sun penetration during the day
getting deeper in winter .
South facing windows can be shaded relatively easy compared to
east or west orientations.
Horizontal shading can contribute to reduce the direct illuminance
but does not provide full protection especially from the winter sun.
74
Western elevation experience greater illumination levels up to
90000 lux in the afternoon hours throughout the entire year.
The sun is located very low in the sky during the afternoon hours,
which complicates shading solutions and makes horizontal
shadings ineffective as protection method.
Western facades receive relatively low illuminance levels on
morning times especially in winter when the illuminance level lows
below 5000lux in some days.
Daylight illuminance falling to vertical surface recorded very low
values in the lower floor levels between two buildings has a
separation distance of 10 meter.
4.2 Simulations for internal daylight level in a generic office
This set of simulations will focus on the internal daylight performance for
a generic office. The office model was constructed by 3D Max Design. As
been presented in methodology office model had dimensions of 10X10
meter and a clear height of 3 meter. Office characteristics and
parameters were mentioned previously in Chapter3.
results for the first set of simulations will be discussed into detail and
focus on the main problems facing every orientation then the different
solutions for every direction will be displayed after introducing UDI
evaluation metric to clarify the measurements outcome in figures to be
absorbed by anyone and summarize the huge excel data file into small
chart.
As been discussed in the previous section, noontime does not make big
challenge for all directions as sun is usually high in the sky and simple
horizontal projection can always succeed to protect facade at this time.
Since interior simulations consuming relatively more time than the
external one because of the complicated calculations caused by surfaces
reflections and glass refraction. Hence, this set of simulations will
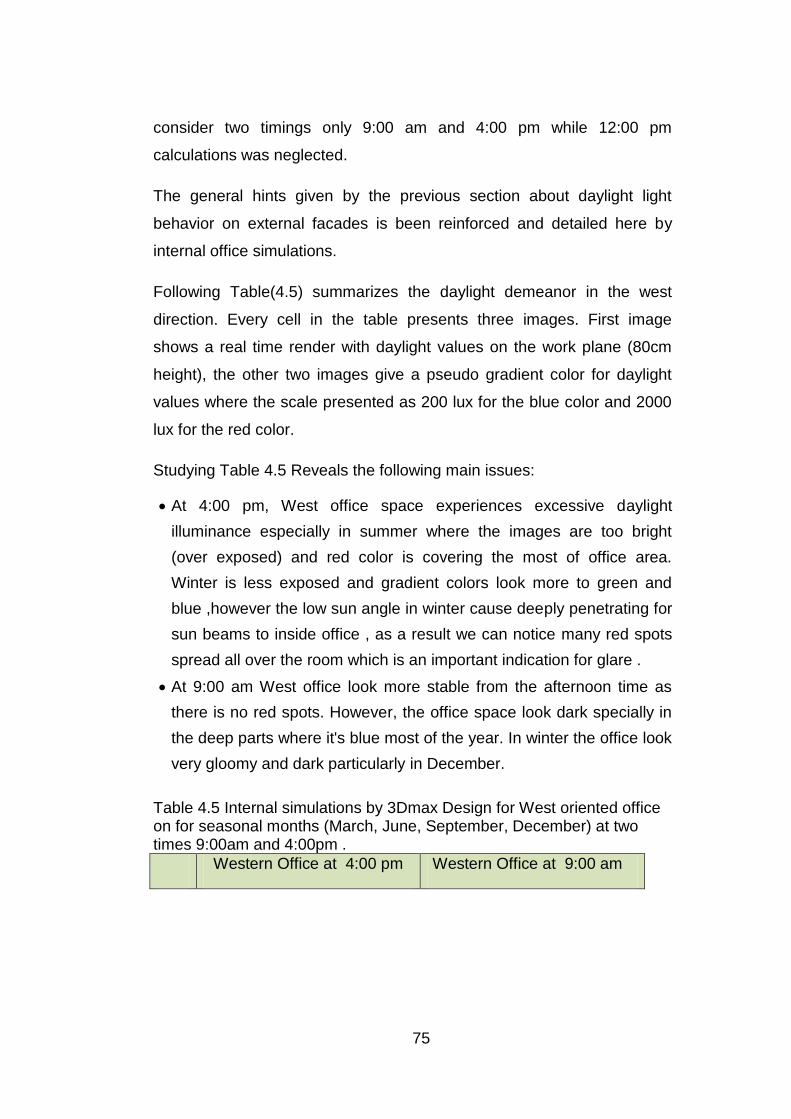
75
consider two timings only 9:00 am and 4:00 pm while 12:00 pm
calculations was neglected.
The general hints given by the previous section about daylight light
behavior on external facades is been reinforced and detailed here by
internal office simulations.
Following Table(4.5) summarizes the daylight demeanor in the west
direction. Every cell in the table presents three images. First image
shows a real time render with daylight values on the work plane (80cm
height), the other two images give a pseudo gradient color for daylight
values where the scale presented as 200 lux for the blue color and 2000
lux for the red color.
Studying Table 4.5 Reveals the following main issues:
At 4:00 pm, West office space experiences excessive daylight
illuminance especially in summer where the images are too bright
(over exposed) and red color is covering the most of office area.
Winter is less exposed and gradient colors look more to green and
blue ,however the low sun angle in winter cause deeply penetrating for
sun beams to inside office , as a result we can notice many red spots
spread all over the room which is an important indication for glare .
At 9:00 am West office look more stable from the afternoon time as
there is no red spots. However, the office space look dark specially in
the deep parts where it's blue most of the year. In winter the office look
very gloomy and dark particularly in December.
Table 4.5 Internal simulations by 3Dmax Design for West oriented office on for seasonal months (March, June, September, December) at two times 9:00am and 4:00pm .
Western Office at 4:00 pm Western Office at 9:00 am
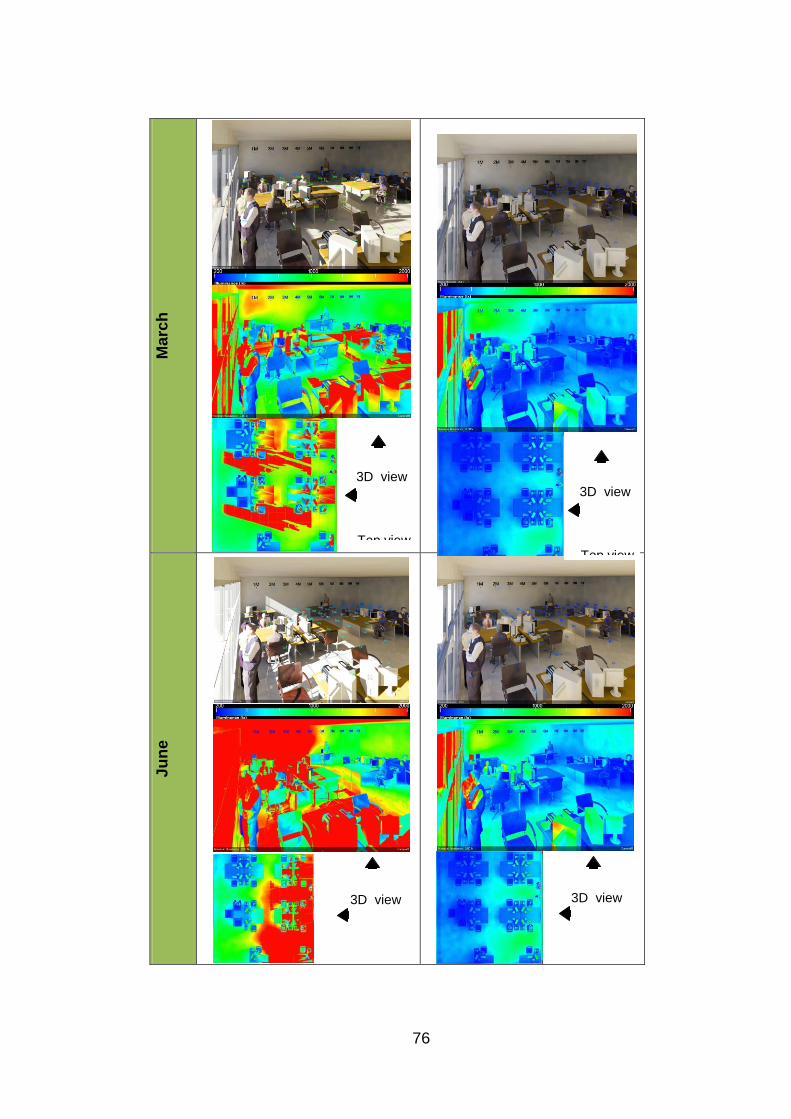
76
Ma
rch
J
un
e
3D view
Top view
3D view
Top view
3D view
Top view
3D view
Top view
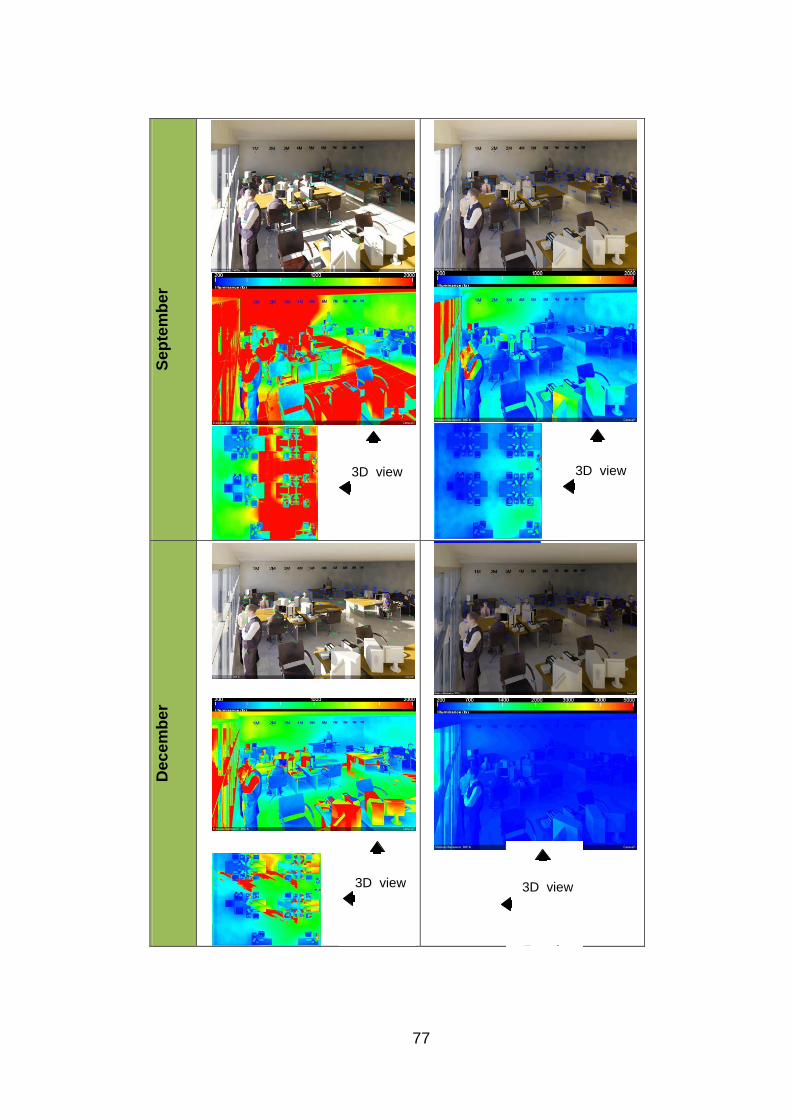
77
Se
pte
mb
er
Dec
em
be
r
3D view
Top view
3D view
Top view
3D view
Top view
3D view
Top view
78
Simulations results came out also as Excel file format presenting a
monthly based data. Following 300 rows table shows sample of Data
been collected on March only from a Western oriented office.
Table 4.6 Partial excels sheet represent a measurements been collected
from work plane level on March only.
Full year data measurements requires 12 tables like that shown in
Table(4.6). 3600 rows of measurements are representing one simulation
over the course of one year for. Therefore, using the measurements as
its in current situation defiantly is ineffective to make evaluation for office
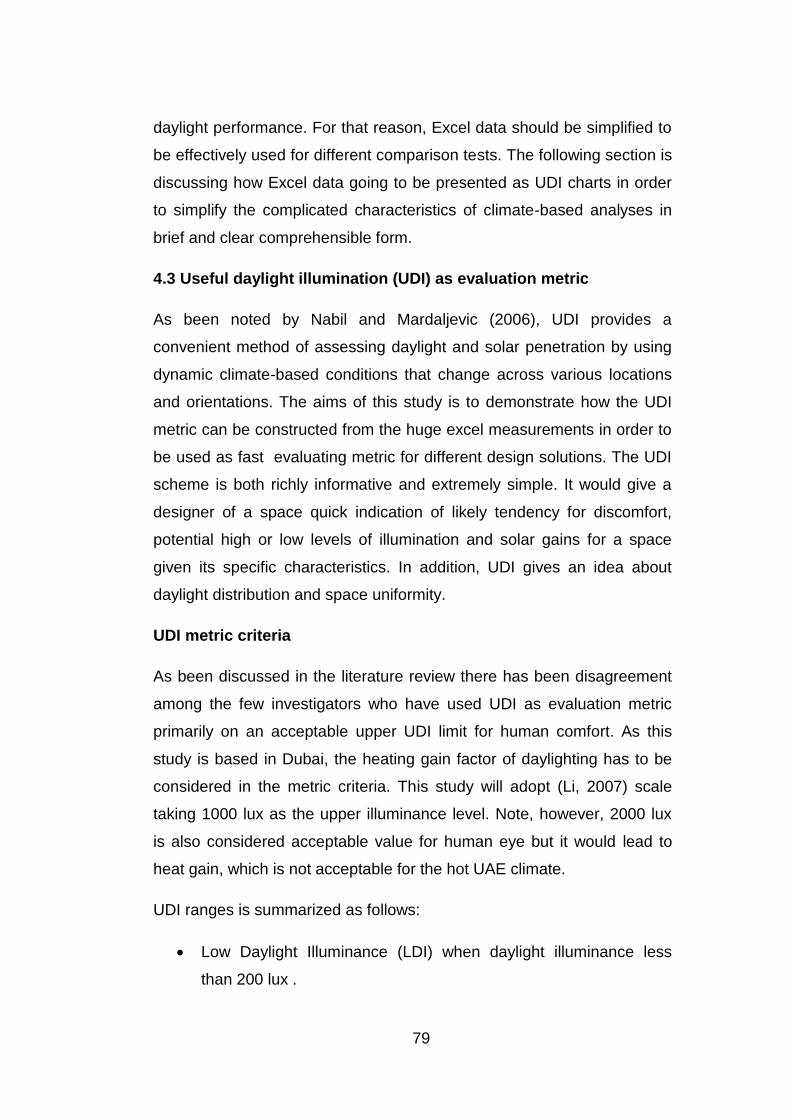
79
daylight performance. For that reason, Excel data should be simplified to
be effectively used for different comparison tests. The following section is
discussing how Excel data going to be presented as UDI charts in order
to simplify the complicated characteristics of climate-based analyses in
brief and clear comprehensible form.
4.3 Useful daylight illumination (UDI) as evaluation metric
As been noted by Nabil and Mardaljevic (2006), UDI provides a
convenient method of assessing daylight and solar penetration by using
dynamic climate-based conditions that change across various locations
and orientations. The aims of this study is to demonstrate how the UDI
metric can be constructed from the huge excel measurements in order to
be used as fast evaluating metric for different design solutions. The UDI
scheme is both richly informative and extremely simple. It would give a
designer of a space quick indication of likely tendency for discomfort,
potential high or low levels of illumination and solar gains for a space
given its specific characteristics. In addition, UDI gives an idea about
daylight distribution and space uniformity.
UDI metric criteria
As been discussed in the literature review there has been disagreement
among the few investigators who have used UDI as evaluation metric
primarily on an acceptable upper UDI limit for human comfort. As this
study is based in Dubai, the heating gain factor of daylighting has to be
considered in the metric criteria. This study will adopt (Li, 2007) scale
taking 1000 lux as the upper illuminance level. Note, however, 2000 lux
is also considered acceptable value for human eye but it would lead to
heat gain, which is not acceptable for the hot UAE climate.
UDI ranges is summarized as follows:
Low Daylight Illuminance (LDI) when daylight illuminance less
than 200 lux .
80
Useful Daylight Illuminance(UDI) when daylight illuminance in the
range 200–1000 lux .
High Daylight Illuminance (HDI) when Daylight illuminance in
exceeds 1000 lux .
A light meter grid with 100 measurement points (10X10) was uniformly
distributed on plan across the workplane (height 0.8 m) above the ground
level inside the generic office model Figure (4.28). The average
illuminances levels were recorded at each of these points at (9:00am &
4:00pm) one day per month over the course of one year. The total
number of illuminance values computed in every simulation therefore
was (2X100 points X12 months) = 2400 values.
Figure 4.28 UDI metric graph example giving data about the percentage of year that every meter in the office achieving UDI,HDI and LDI.
81
Figure (4.28) shows final UDI metric graph. it's been described as
following :
The 2400 measurements were grouped into 10 bins of columns
representing the office depth measured from window wall (meter
#1) to internal wall (meter #10).
Every group of bars in the graph contains three UDI metrics (UDI
in blue, LDI in red and HDI in green).
The value at each light meter grid node on the office plan is
classified under one of these three mentioned categories. For
example when the value is less than 200 lux the point will be
determined as LDI(red), when the illuminance detected falls
between 200 to 1000 its classified as UDI(blue) and if detected
illuminance at the point exceeds1000 lux it is classified as
HDI(green).
The final results are represented as a percentage of the working
year (%)
There are additional group of columns on the right showing the
UDI average for the whole office space.
Examples for graph description:
Ex1. The workspaces within the first 1 meter (adjacent to window)
achieve UDI (200-1000lux) for 40% of the year, while workspaces
within 9 -10 meters from the window (adjacent to internal wall)
achieve UDI for up to 70% of the working year.
Ex1. The workspaces within the first 1 meter (adjacent to window) get
over exposed for up to 50% of the year with illuminance exceeding
1000lux.This percentage of HDI start falling to below 5% as one
moves further away from the window.
Ex3. The percentage of the time in the working year when UDI was
achieved in the whole office is 61%; it means that this office can be
lit using daylight only for more than 60% of the working year.
82
In General UDI levels between 80%-100% represent excellent daylight
designs parameters, while good daylighting designs could fall to a range
60%-80% UDI average range. 60% UDI average and below indicating for
low daylight design performance, CHPS (2006).
Based on the UDI graph readings, investigator can be with ease evaluate
the space performance and pin out day lighting problems either to do
with high levels of illumination associated with discomfort and solar gains
or low illuminated areas.
(UDI) Tests for Different office parameters, levels and orientations
To determine the suitable benchmark levels that define good daylighting
in office using UDI evaluation metric discussed above, series of tests
were conducted and the UDI metric were calculated for each test. Some
parameters such as office dimension (10mX10mX3m) and workplane
level (80cm from FFL) were held constant throughout the different tests.
Other parameters however were altered. These are, changes to:-
External Glass Visible Transmittance (VT),
Orientation
Vertical obstructions and office level
Shading treatments
This has been carried out so that investigator may test how one or a
group of these parameters can affect daylight performance.
The following sections present series of tests, each test will be
summarized by a UDI graph. First three sets of tests will investigate the
UDI for different orientations and parameters, while the last two sets of
simulations will focus on how UDI change with different levels and
building separations (setback). Table 4.7 classifies the different tests in
the following section.
Table 4.7 General description and classification for UDI simulations
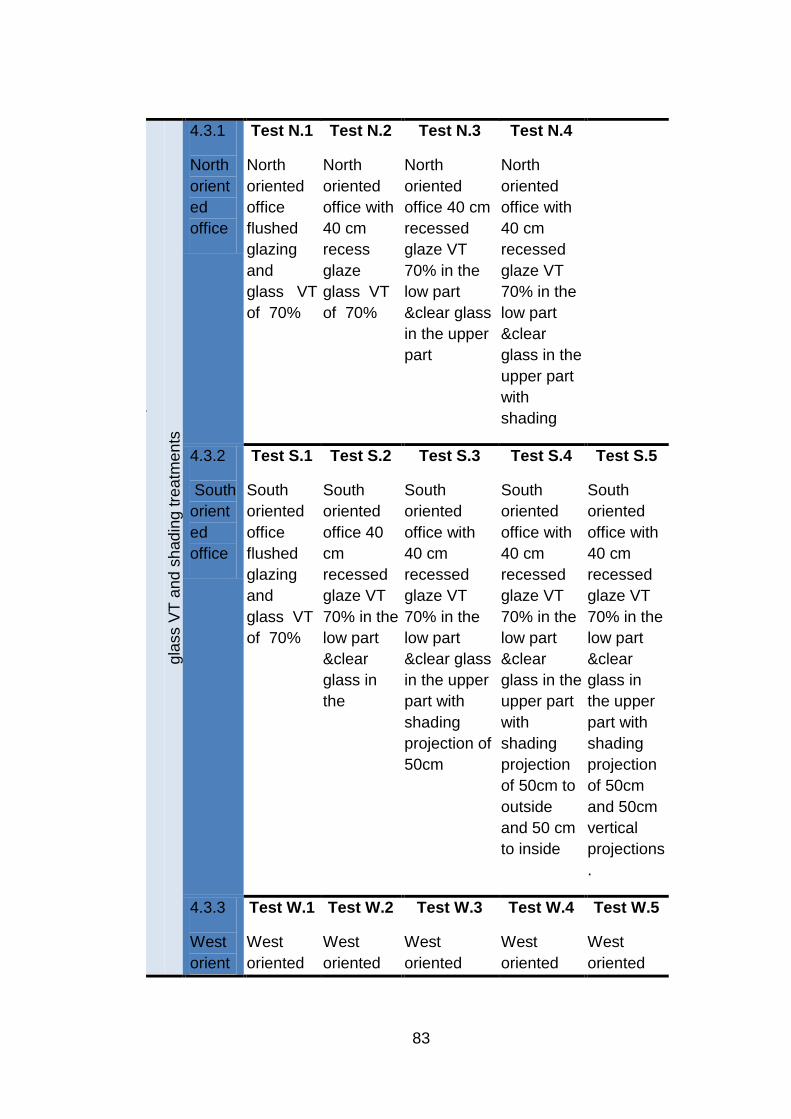
83
Te
sts
fo
r o
ffic
es in
diffe
ren
t O
rien
tatio
n,
gla
ss V
T a
nd s
had
ing
tre
atm
en
ts
4.3.1
North
orient
ed
office
Test N.1
North
oriented
office
flushed
glazing
and
glass VT
of 70%
Test N.2
North
oriented
office with
40 cm
recess
glaze
glass VT
of 70%
Test N.3
North
oriented
office 40 cm
recessed
glaze VT
70% in the
low part
&clear glass
in the upper
part
Test N.4
North
oriented
office with
40 cm
recessed
glaze VT
70% in the
low part
&clear
glass in the
upper part
with
shading
4.3.2
South
orient
ed
office
Test S.1
South
oriented
office
flushed
glazing
and
glass VT
of 70%
Test S.2
South
oriented
office 40
cm
recessed
glaze VT
70% in the
low part
&clear
glass in
the
Test S.3
South
oriented
office with
40 cm
recessed
glaze VT
70% in the
low part
&clear glass
in the upper
part with
shading
projection of
50cm
Test S.4
South
oriented
office with
40 cm
recessed
glaze VT
70% in the
low part
&clear
glass in the
upper part
with
shading
projection
of 50cm to
outside
and 50 cm
to inside
Test S.5
South
oriented
office with
40 cm
recessed
glaze VT
70% in the
low part
&clear
glass in
the upper
part with
shading
projection
of 50cm
and 50cm
vertical
projections
.
4.3.3
West
orient
Test W.1
West
oriented
Test W.2
West
oriented
Test W.3
West
oriented
Test W.4
West
oriented
Test W.5
West
oriented
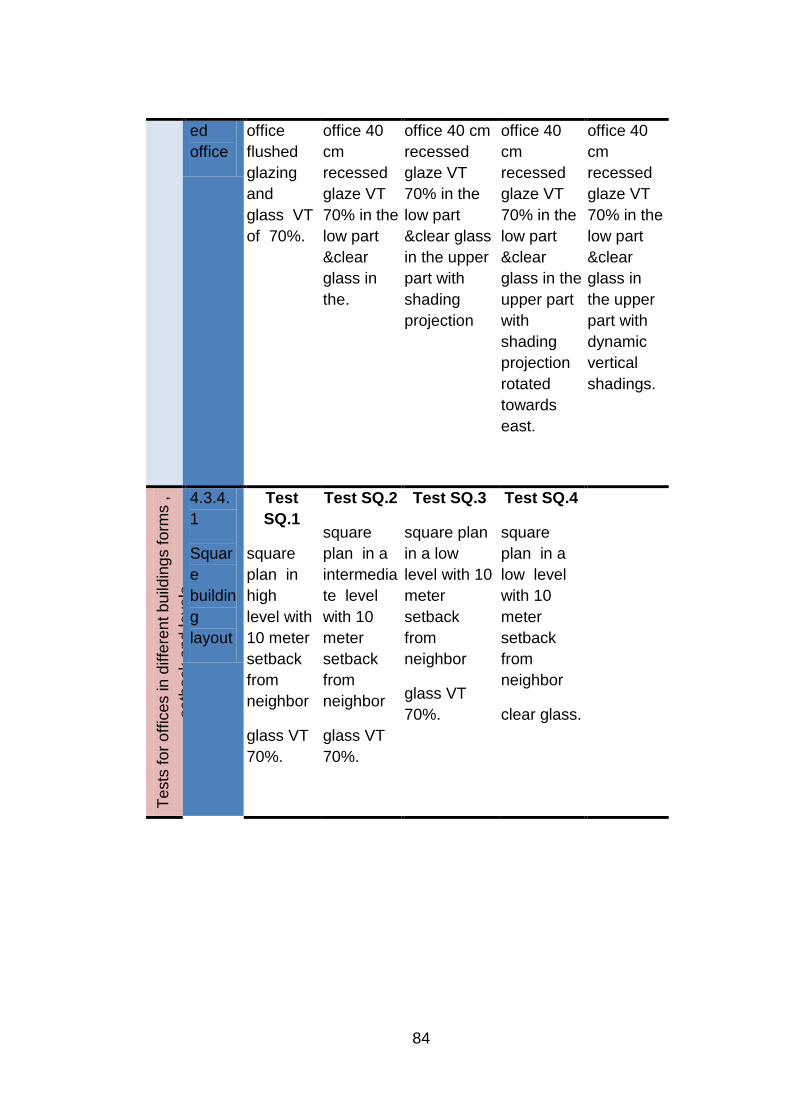
84
ed
office
office
flushed
glazing
and
glass VT
of 70%.
office 40
cm
recessed
glaze VT
70% in the
low part
&clear
glass in
the.
office 40 cm
recessed
glaze VT
70% in the
low part
&clear glass
in the upper
part with
shading
projection
office 40
cm
recessed
glaze VT
70% in the
low part
&clear
glass in the
upper part
with
shading
projection
rotated
towards
east.
office 40
cm
recessed
glaze VT
70% in the
low part
&clear
glass in
the upper
part with
dynamic
vertical
shadings.
Te
sts
fo
r o
ffic
es in
diffe
ren
t b
uild
ing
s f
orm
s ,
se
tba
ck a
nd
le
ve
ls
4.3.4.
1
Squar
e
buildin
g
layout
Test
SQ.1
square
plan in
high
level with
10 meter
setback
from
neighbor
glass VT
70%.
Test SQ.2
square
plan in a
intermedia
te level
with 10
meter
setback
from
neighbor
glass VT
70%.
Test SQ.3
square plan
in a low
level with 10
meter
setback
from
neighbor
glass VT
70%.
Test SQ.4
square
plan in a
low level
with 10
meter
setback
from
neighbor
clear glass.
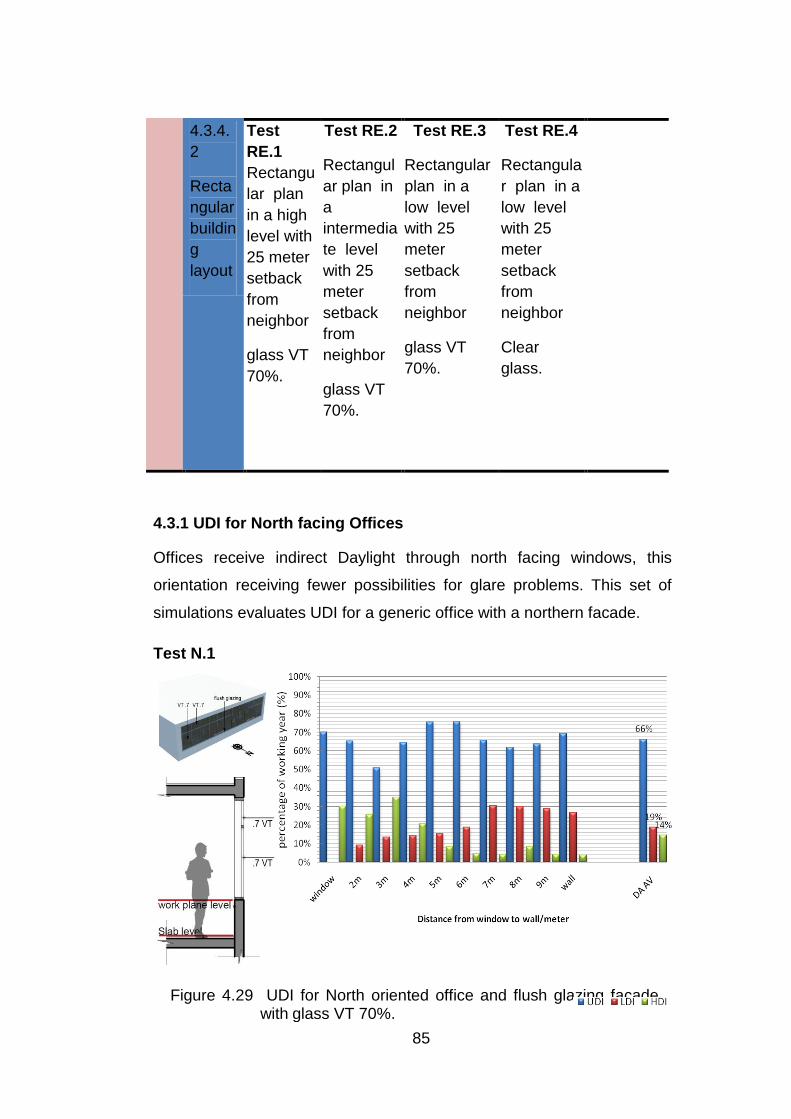
85
Figure 4.29 UDI for North oriented office and flush glazing facade with glass VT 70%.
4.3.4.
2
Recta
ngular
buildin
g
layout
Test
RE.1
Rectangu
lar plan
in a high
level with
25 meter
setback
from
neighbor
glass VT
70%.
Test RE.2
Rectangul
ar plan in
a
intermedia
te level
with 25
meter
setback
from
neighbor
glass VT
70%.
Test RE.3
Rectangular
plan in a
low level
with 25
meter
setback
from
neighbor
glass VT
70%.
Test RE.4
Rectangula
r plan in a
low level
with 25
meter
setback
from
neighbor
Clear
glass.
4.3.1 UDI for North facing Offices
Offices receive indirect Daylight through north facing windows, this
orientation receiving fewer possibilities for glare problems. This set of
simulations evaluates UDI for a generic office with a northern facade.
Test N.1
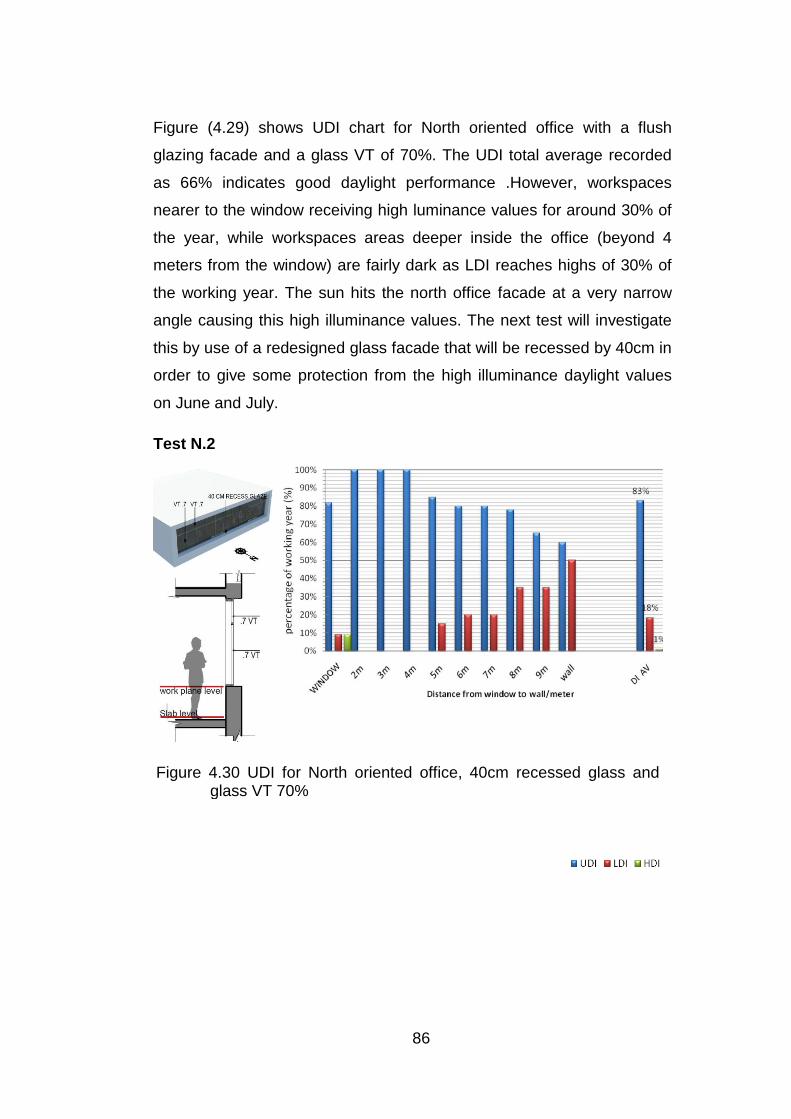
86
Figure 4.30 UDI for North oriented office, 40cm recessed glass and glass VT 70%
Figure (4.29) shows UDI chart for North oriented office with a flush
glazing facade and a glass VT of 70%. The UDI total average recorded
as 66% indicates good daylight performance .However, workspaces
nearer to the window receiving high luminance values for around 30% of
the year, while workspaces areas deeper inside the office (beyond 4
meters from the window) are fairly dark as LDI reaches highs of 30% of
the working year. The sun hits the north office facade at a very narrow
angle causing this high illuminance values. The next test will investigate
this by use of a redesigned glass facade that will be recessed by 40cm in
order to give some protection from the high illuminance daylight values
on June and July.
Test N.2
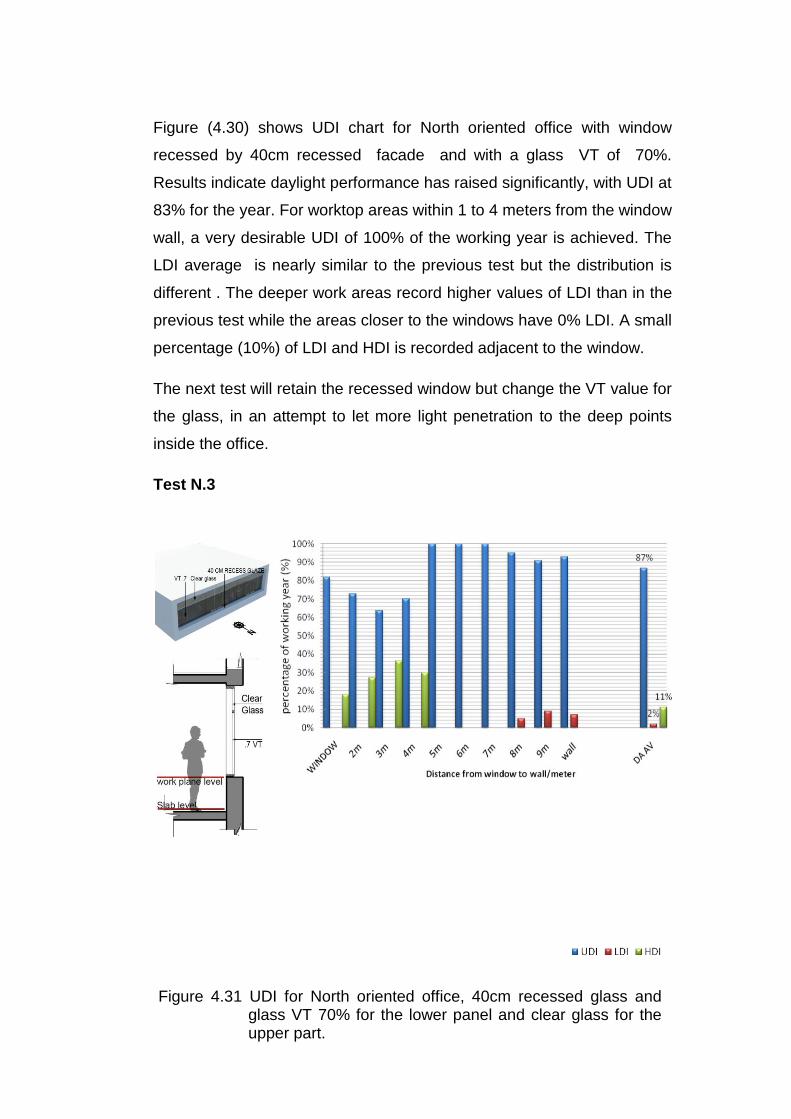
87
Figure 4.31 UDI for North oriented office, 40cm recessed glass and glass VT 70% for the lower panel and clear glass for the upper part.
Figure (4.30) shows UDI chart for North oriented office with window
recessed by 40cm recessed facade and with a glass VT of 70%.
Results indicate daylight performance has raised significantly, with UDI at
83% for the year. For worktop areas within 1 to 4 meters from the window
wall, a very desirable UDI of 100% of the working year is achieved. The
LDI average is nearly similar to the previous test but the distribution is
different . The deeper work areas record higher values of LDI than in the
previous test while the areas closer to the windows have 0% LDI. A small
percentage (10%) of LDI and HDI is recorded adjacent to the window.
The next test will retain the recessed window but change the VT value for
the glass, in an attempt to let more light penetration to the deep points
inside the office.
Test N.3
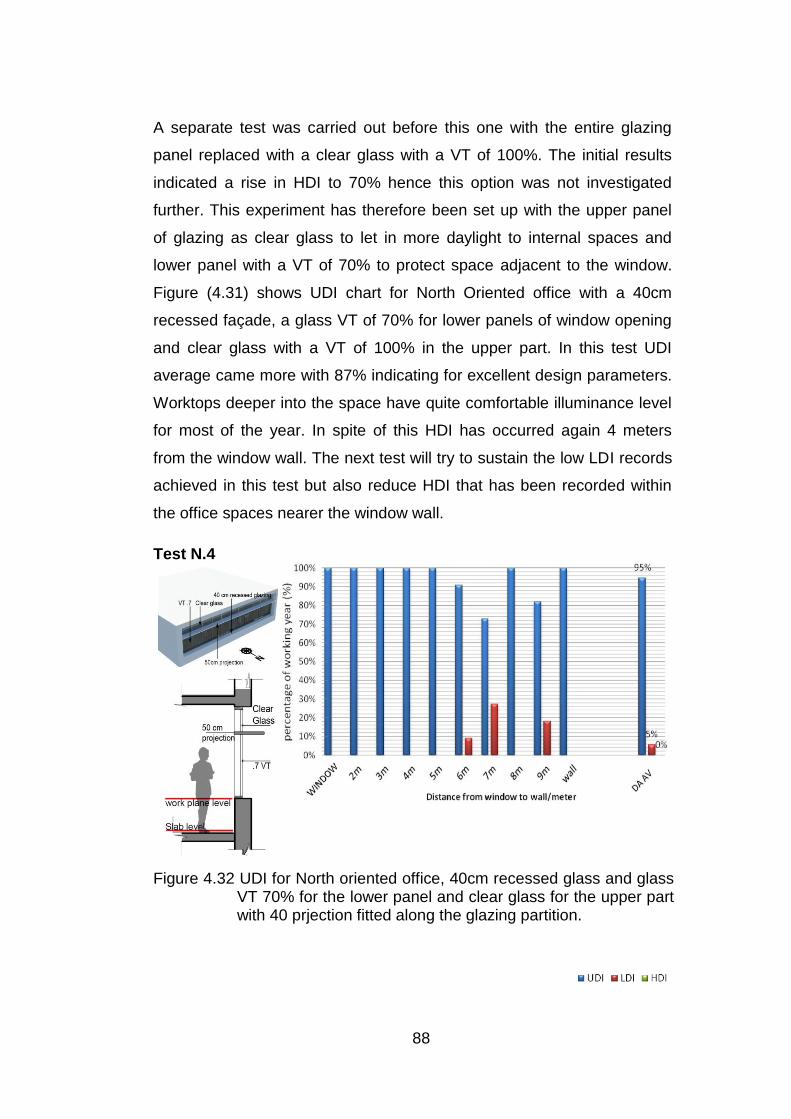
88
Figure 4.32 UDI for North oriented office, 40cm recessed glass and glass VT 70% for the lower panel and clear glass for the upper part with 40 prjection fitted along the glazing partition.
A separate test was carried out before this one with the entire glazing
panel replaced with a clear glass with a VT of 100%. The initial results
indicated a rise in HDI to 70% hence this option was not investigated
further. This experiment has therefore been set up with the upper panel
of glazing as clear glass to let in more daylight to internal spaces and
lower panel with a VT of 70% to protect space adjacent to the window.
Figure (4.31) shows UDI chart for North Oriented office with a 40cm
recessed façade, a glass VT of 70% for lower panels of window opening
and clear glass with a VT of 100% in the upper part. In this test UDI
average came more with 87% indicating for excellent design parameters.
Worktops deeper into the space have quite comfortable illuminance level
for most of the year. In spite of this HDI has occurred again 4 meters
from the window wall. The next test will try to sustain the low LDI records
achieved in this test but also reduce HDI that has been recorded within
the office spaces nearer the window wall.
Test N.4
89
Figure (4.32) shows UDI chart for North oriented office with a 40cm
recessed glazed façade, with a lower glass planes with VT of 70% and
clear upper glass planes with VT 100% in the upper part and a
horizontal projection of 40 cm fitted along the glazing partition between
the upper and the lower panels of glass. UDI average is much more ideal
with averaging at 95% of the working year. Workspaces within the first
5metres from the window record an average UDI of 100% of the working
year. The deeper areas in the office also recorded average UDI of 100%
while some intermediate minimal areas still have some LDI values. This
result demonstrates the multiple roles that projection play, as shading
device for the workspaces adjacent to the window wall and as a sunlight
reflector shelf for deeper workspaces.
4.3.2 UDI for South facing Office
As noted earlier in the first set of simulations for external surfaces, South
facing facades in the UAE have the probability of experiencing direct
solar penetration during day. We also noted earlier that South facing
windows could be protected from extreme direct sunlight at noon when
the sun is located high in the sky by use of horizontal shading devices
while vertical protection might be required during the morning and
afternoon hours. As in the previous set of tests, the following tests will
investigate UDI for south oriented office with parameters progressively
altered to create maximum UDI for the internal space. From the external
tests, we can expect that this orientation will be relatively easy compared
to east or west orientations. Also, the direct sun incident on a south
fenestration can also be reflected into the building with light shelves as
has been indicated for North oriented spaces which would provide for
deeper light penetration and more diffused daylight.
Test S.1
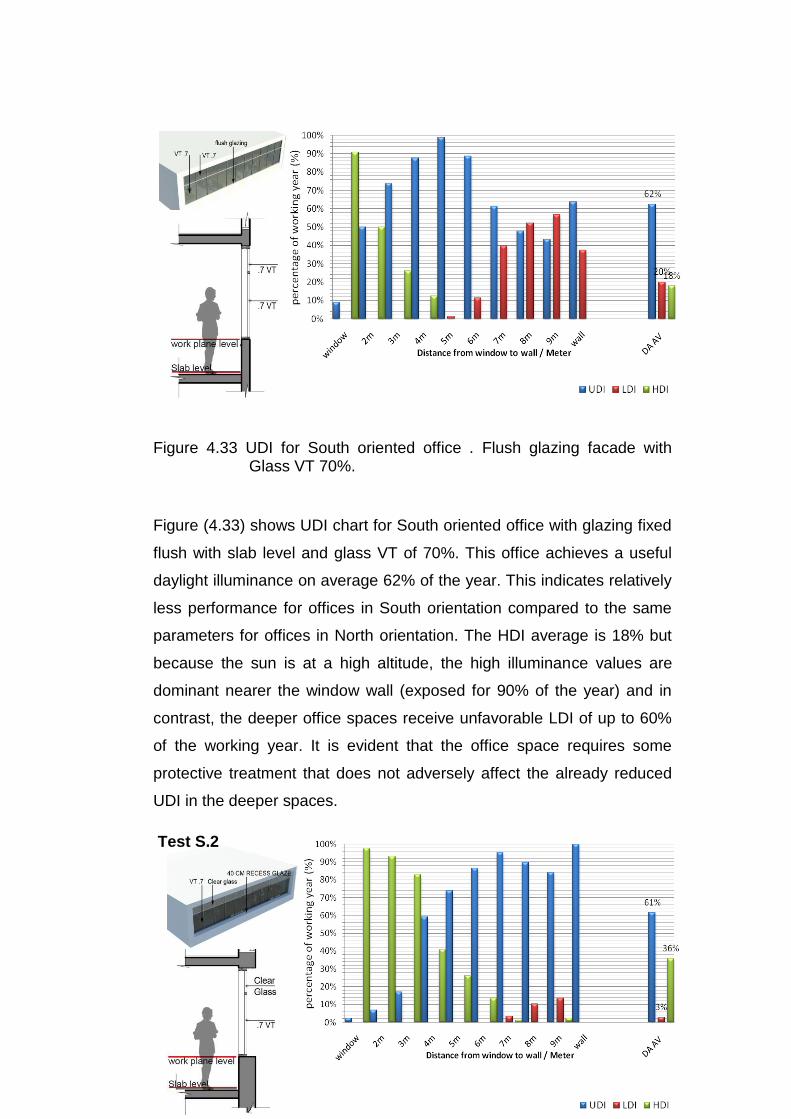
90
Figure 4.33 UDI for South oriented office . Flush glazing facade with
Glass VT 70%.
Figure (4.33) shows UDI chart for South oriented office with glazing fixed
flush with slab level and glass VT of 70%. This office achieves a useful
daylight illuminance on average 62% of the year. This indicates relatively
less performance for offices in South orientation compared to the same
parameters for offices in North orientation. The HDI average is 18% but
because the sun is at a high altitude, the high illuminance values are
dominant nearer the window wall (exposed for 90% of the year) and in
contrast, the deeper office spaces receive unfavorable LDI of up to 60%
of the working year. It is evident that the office space requires some
protective treatment that does not adversely affect the already reduced
UDI in the deeper spaces.
Test S.2
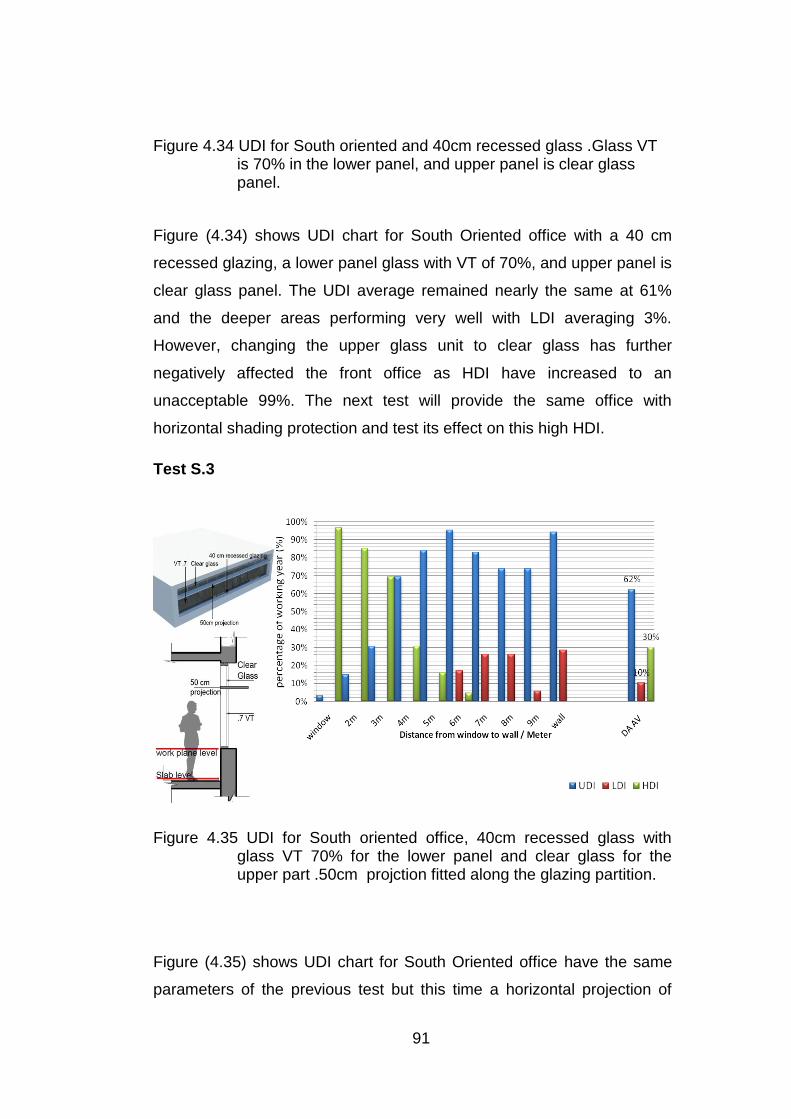
91
Figure 4.34 UDI for South oriented and 40cm recessed glass .Glass VT
is 70% in the lower panel, and upper panel is clear glass panel.
Figure (4.34) shows UDI chart for South Oriented office with a 40 cm
recessed glazing, a lower panel glass with VT of 70%, and upper panel is
clear glass panel. The UDI average remained nearly the same at 61%
and the deeper areas performing very well with LDI averaging 3%.
However, changing the upper glass unit to clear glass has further
negatively affected the front office as HDI have increased to an
unacceptable 99%. The next test will provide the same office with
horizontal shading protection and test its effect on this high HDI.
Test S.3
Figure 4.35 UDI for South oriented office, 40cm recessed glass with glass VT 70% for the lower panel and clear glass for the upper part .50cm projction fitted along the glazing partition.
Figure (4.35) shows UDI chart for South Oriented office have the same
parameters of the previous test but this time a horizontal projection of
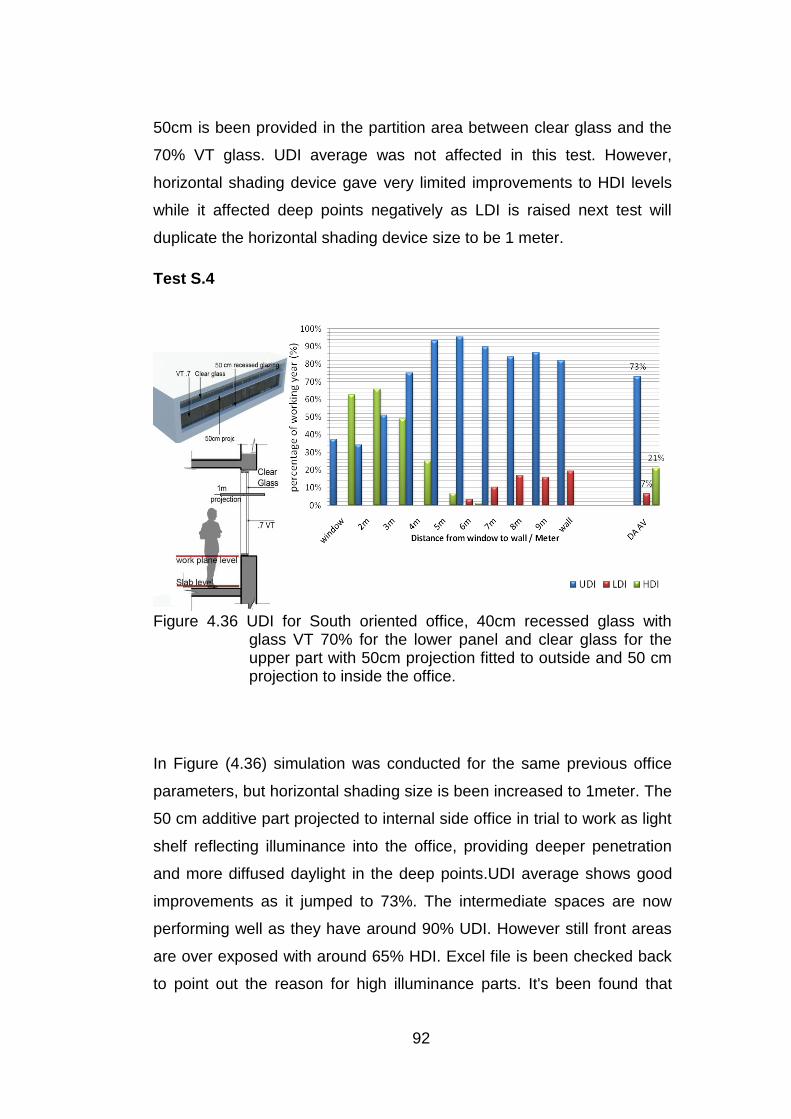
92
50cm is been provided in the partition area between clear glass and the
70% VT glass. UDI average was not affected in this test. However,
horizontal shading device gave very limited improvements to HDI levels
while it affected deep points negatively as LDI is raised next test will
duplicate the horizontal shading device size to be 1 meter.
Test S.4
Figure 4.36 UDI for South oriented office, 40cm recessed glass with glass VT 70% for the lower panel and clear glass for the upper part with 50cm projection fitted to outside and 50 cm projection to inside the office.
In Figure (4.36) simulation was conducted for the same previous office
parameters, but horizontal shading size is been increased to 1meter. The
50 cm additive part projected to internal side office in trial to work as light
shelf reflecting illuminance into the office, providing deeper penetration
and more diffused daylight in the deep points.UDI average shows good
improvements as it jumped to 73%. The intermediate spaces are now
performing well as they have around 90% UDI. However still front areas
are over exposed with around 65% HDI. Excel file is been checked back
to point out the reason for high illuminance parts. It's been found that
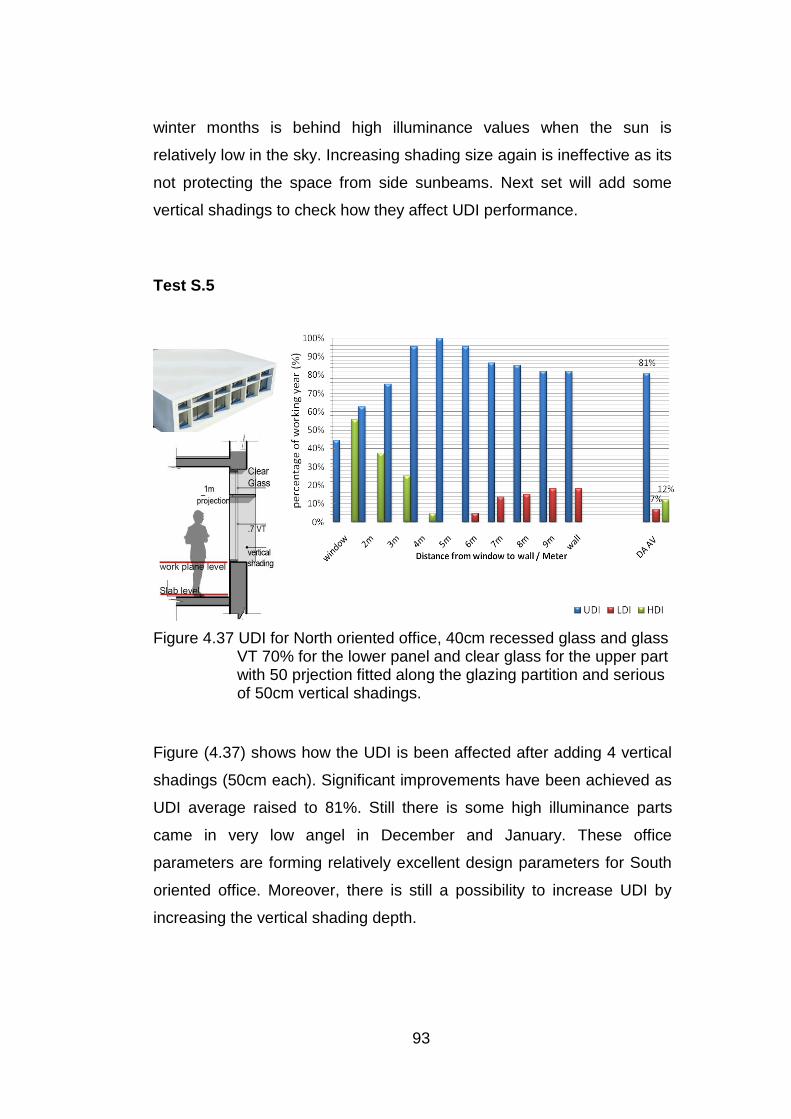
93
winter months is behind high illuminance values when the sun is
relatively low in the sky. Increasing shading size again is ineffective as its
not protecting the space from side sunbeams. Next set will add some
vertical shadings to check how they affect UDI performance.
Test S.5
Figure 4.37 UDI for North oriented office, 40cm recessed glass and glass
VT 70% for the lower panel and clear glass for the upper part with 50 prjection fitted along the glazing partition and serious of 50cm vertical shadings.
Figure (4.37) shows how the UDI is been affected after adding 4 vertical
shadings (50cm each). Significant improvements have been achieved as
UDI average raised to 81%. Still there is some high illuminance parts
came in very low angel in December and January. These office
parameters are forming relatively excellent design parameters for South
oriented office. Moreover, there is still a possibility to increase UDI by
increasing the vertical shading depth.
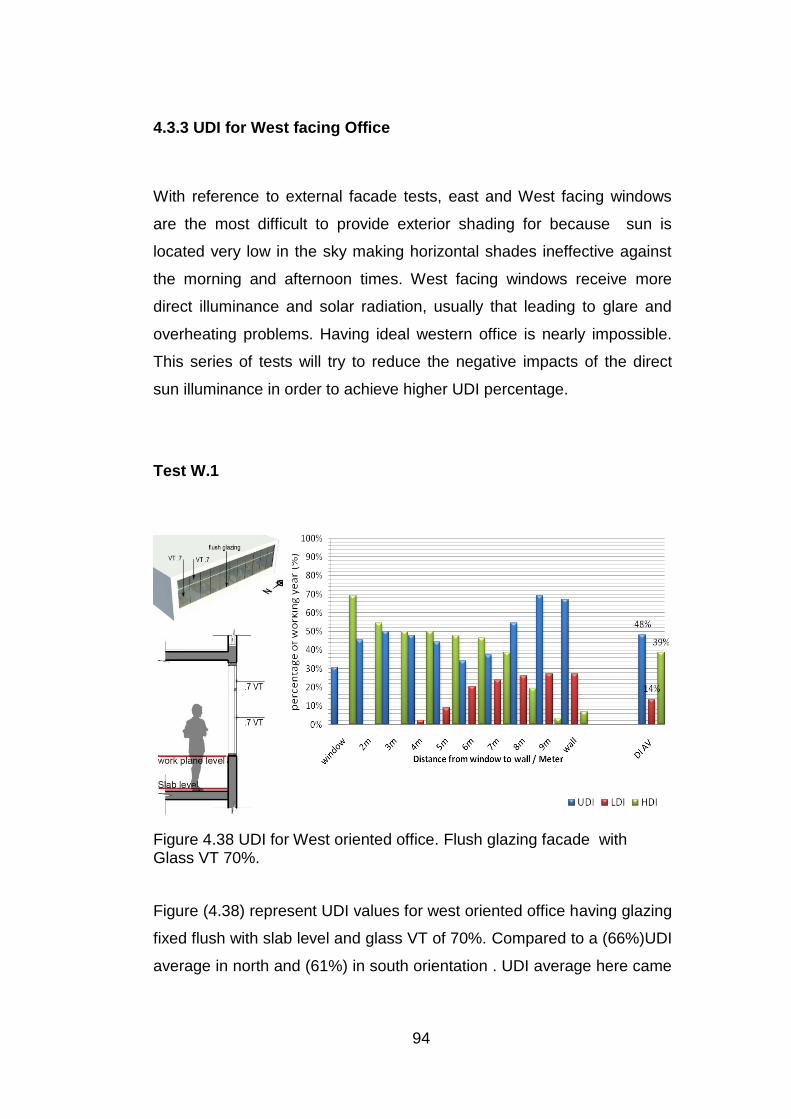
94
4.3.3 UDI for West facing Office
With reference to external facade tests, east and West facing windows
are the most difficult to provide exterior shading for because sun is
located very low in the sky making horizontal shades ineffective against
the morning and afternoon times. West facing windows receive more
direct illuminance and solar radiation, usually that leading to glare and
overheating problems. Having ideal western office is nearly impossible.
This series of tests will try to reduce the negative impacts of the direct
sun illuminance in order to achieve higher UDI percentage.
Test W.1
Figure 4.38 UDI for West oriented office. Flush glazing facade with Glass VT 70%.
Figure (4.38) represent UDI values for west oriented office having glazing
fixed flush with slab level and glass VT of 70%. Compared to a (66%)UDI
average in north and (61%) in south orientation . UDI average here came
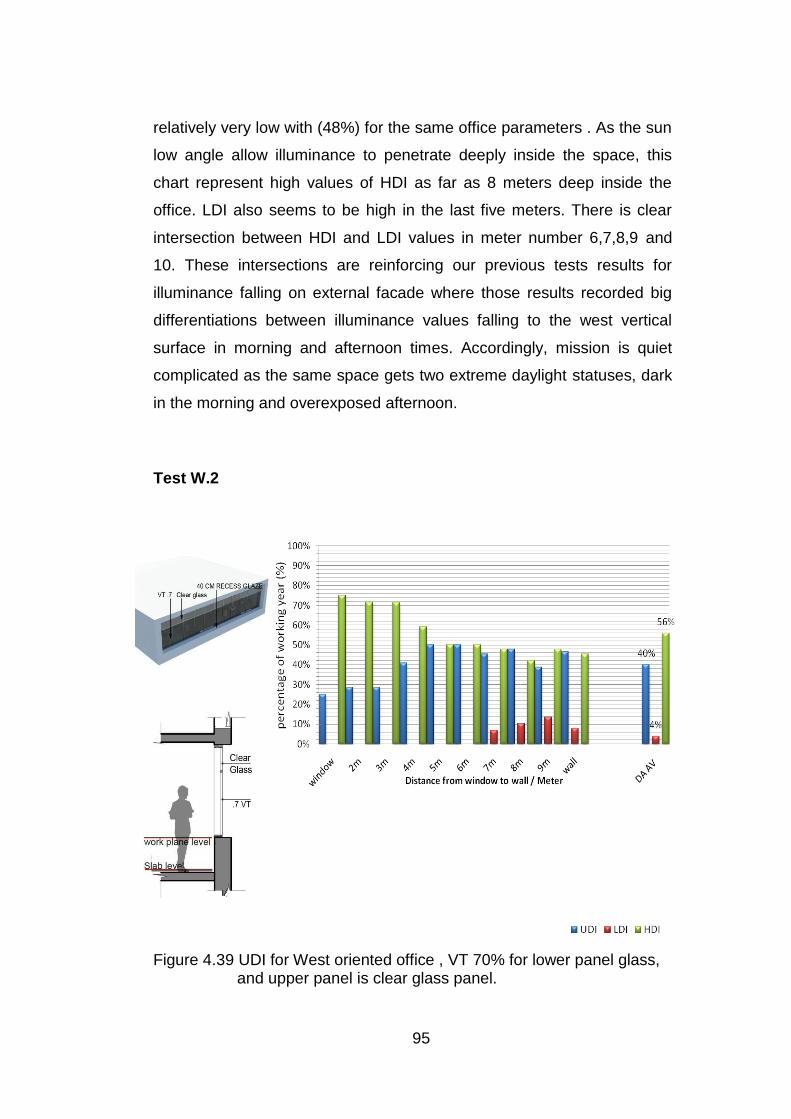
95
relatively very low with (48%) for the same office parameters . As the sun
low angle allow illuminance to penetrate deeply inside the space, this
chart represent high values of HDI as far as 8 meters deep inside the
office. LDI also seems to be high in the last five meters. There is clear
intersection between HDI and LDI values in meter number 6,7,8,9 and
10. These intersections are reinforcing our previous tests results for
illuminance falling on external facade where those results recorded big
differentiations between illuminance values falling to the west vertical
surface in morning and afternoon times. Accordingly, mission is quiet
complicated as the same space gets two extreme daylight statuses, dark
in the morning and overexposed afternoon.
Test W.2
Figure 4.39 UDI for West oriented office , VT 70% for lower panel glass,
and upper panel is clear glass panel.
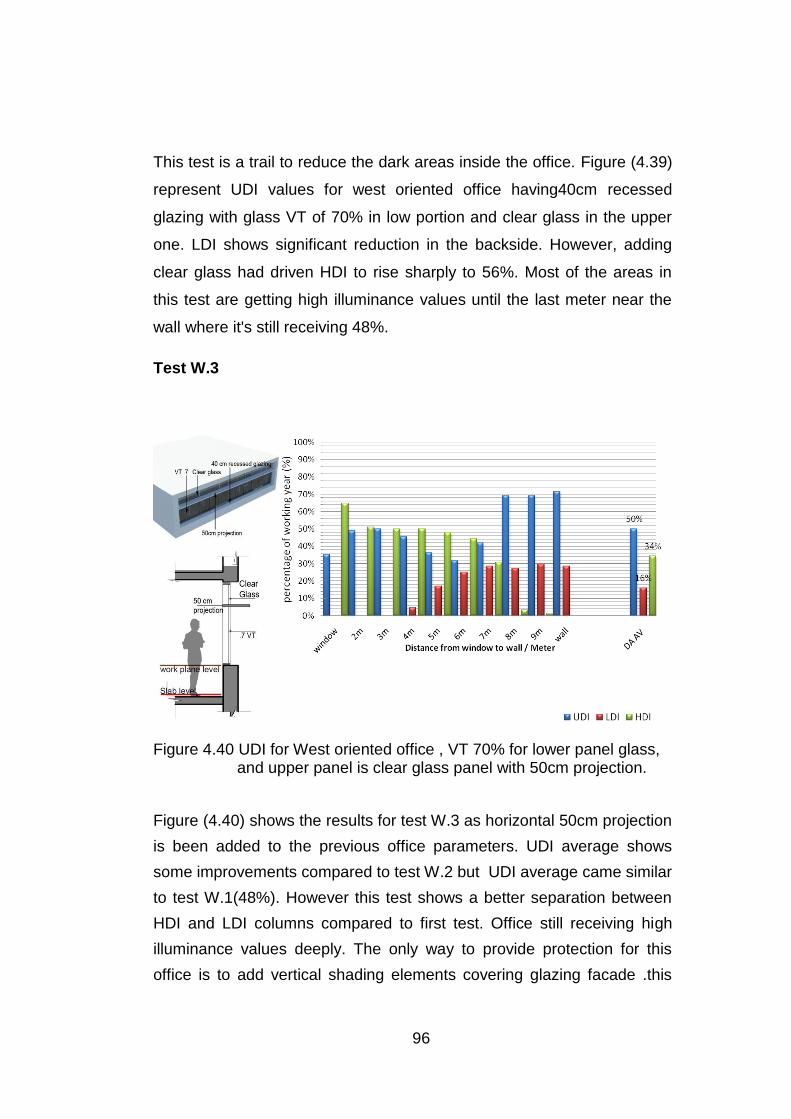
96
This test is a trail to reduce the dark areas inside the office. Figure (4.39)
represent UDI values for west oriented office having40cm recessed
glazing with glass VT of 70% in low portion and clear glass in the upper
one. LDI shows significant reduction in the backside. However, adding
clear glass had driven HDI to rise sharply to 56%. Most of the areas in
this test are getting high illuminance values until the last meter near the
wall where it's still receiving 48%.
Test W.3
Figure 4.40 UDI for West oriented office , VT 70% for lower panel glass, and upper panel is clear glass panel with 50cm projection.
Figure (4.40) shows the results for test W.3 as horizontal 50cm projection
is been added to the previous office parameters. UDI average shows
some improvements compared to test W.2 but UDI average came similar
to test W.1(48%). However this test shows a better separation between
HDI and LDI columns compared to first test. Office still receiving high
illuminance values deeply. The only way to provide protection for this
office is to add vertical shading elements covering glazing facade .this
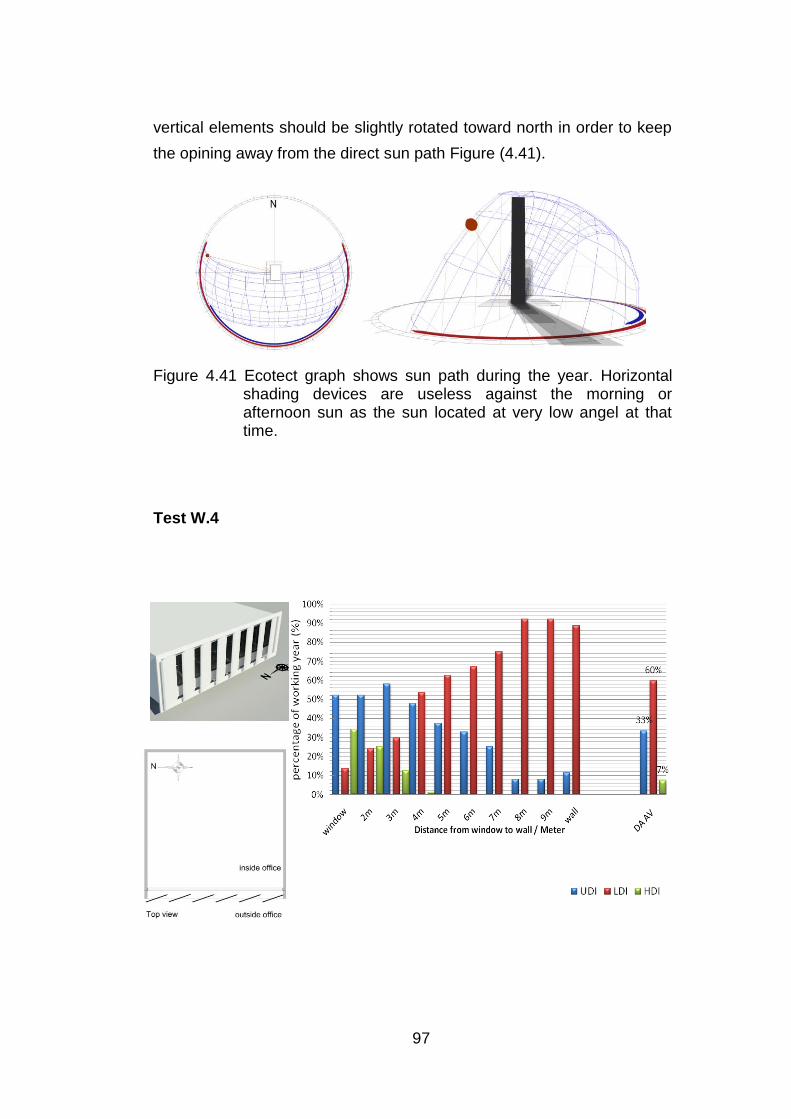
97
vertical elements should be slightly rotated toward north in order to keep
the opining away from the direct sun path Figure (4.41).
Figure 4.41 Ecotect graph shows sun path during the year. Horizontal shading devices are useless against the morning or afternoon sun as the sun located at very low angel at that time.
Test W.4
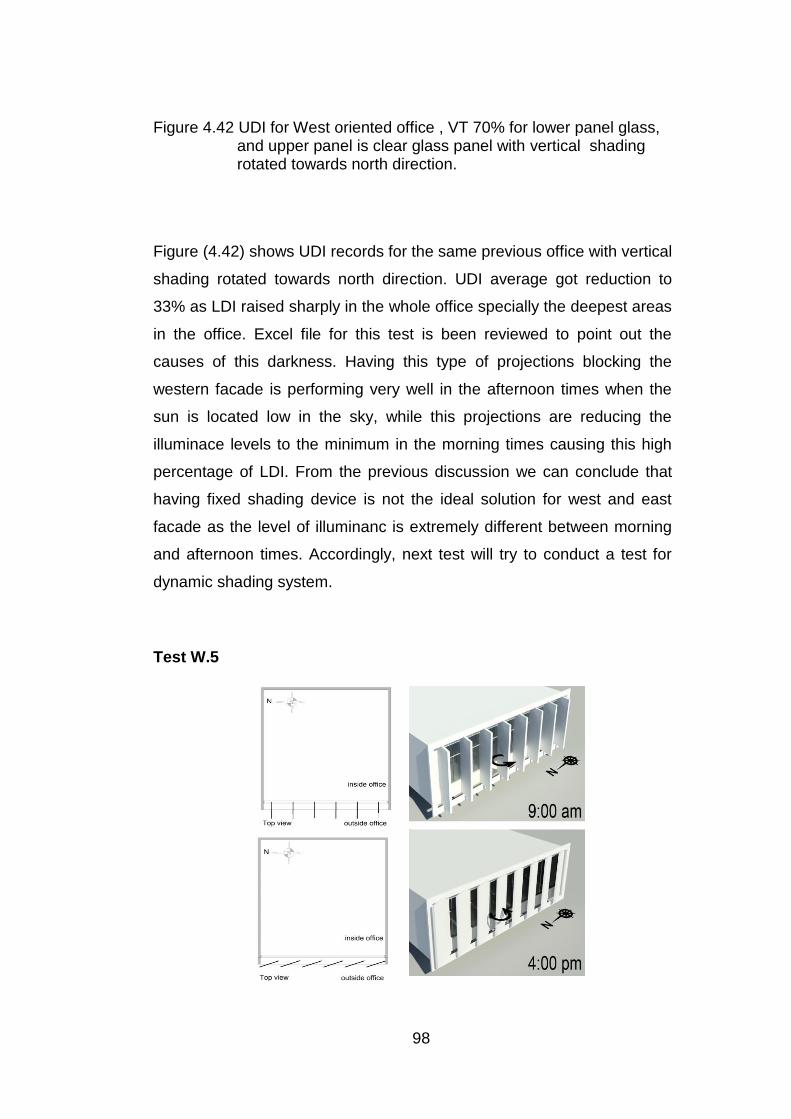
98
Figure 4.42 UDI for West oriented office , VT 70% for lower panel glass, and upper panel is clear glass panel with vertical shading rotated towards north direction.
Figure (4.42) shows UDI records for the same previous office with vertical
shading rotated towards north direction. UDI average got reduction to
33% as LDI raised sharply in the whole office specially the deepest areas
in the office. Excel file for this test is been reviewed to point out the
causes of this darkness. Having this type of projections blocking the
western facade is performing very well in the afternoon times when the
sun is located low in the sky, while this projections are reducing the
illuminace levels to the minimum in the morning times causing this high
percentage of LDI. From the previous discussion we can conclude that
having fixed shading device is not the ideal solution for west and east
facade as the level of illuminanc is extremely different between morning
and afternoon times. Accordingly, next test will try to conduct a test for
dynamic shading system.
Test W.5
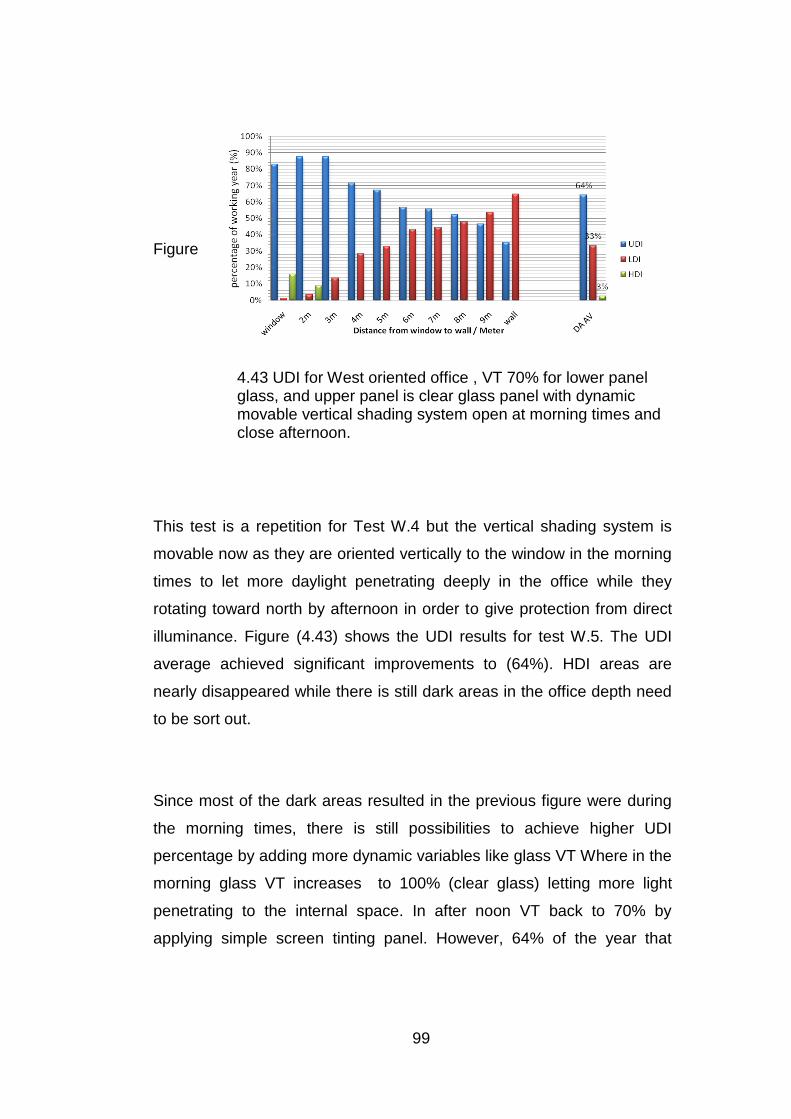
99
Figure
4.43 UDI for West oriented office , VT 70% for lower panel glass, and upper panel is clear glass panel with dynamic movable vertical shading system open at morning times and close afternoon.
This test is a repetition for Test W.4 but the vertical shading system is
movable now as they are oriented vertically to the window in the morning
times to let more daylight penetrating deeply in the office while they
rotating toward north by afternoon in order to give protection from direct
illuminance. Figure (4.43) shows the UDI results for test W.5. The UDI
average achieved significant improvements to (64%). HDI areas are
nearly disappeared while there is still dark areas in the office depth need
to be sort out.
Since most of the dark areas resulted in the previous figure were during
the morning times, there is still possibilities to achieve higher UDI
percentage by adding more dynamic variables like glass VT Where in the
morning glass VT increases to 100% (clear glass) letting more light
penetrating to the internal space. In after noon VT back to 70% by
applying simple screen tinting panel. However, 64% of the year that
100
Daylight alone can light the internal office space is good achievement
relatively for this direction.
4.3.4 Summary of results and findings for UDI tests in different orientations
North directions presented the best performance compared to the
other directions where it can achieve good UDI values without
having any protection on facade.
Recessing glass window 40cm to inside in North office gave
additional improvements, while adding shading protection give the
extreme office performance with UDI highs to 95%.
UDI for south oriented office came acceptable as 62% for
standard office without protections.
The best UDI achievements for South oriented office came after
several tests to highs of 81% after adding vertical and horizontal
50cm over hangs and changing glass VT in the upper portion to
100%.
West oriented standard office started with UDI average of 48%
only because the whole office receiving excessively high HDI
percentage deeply in afternoon time while the back areas got a big
percentage of LDI particularly in the morning times when the sun
located exactly on the opposite direction.
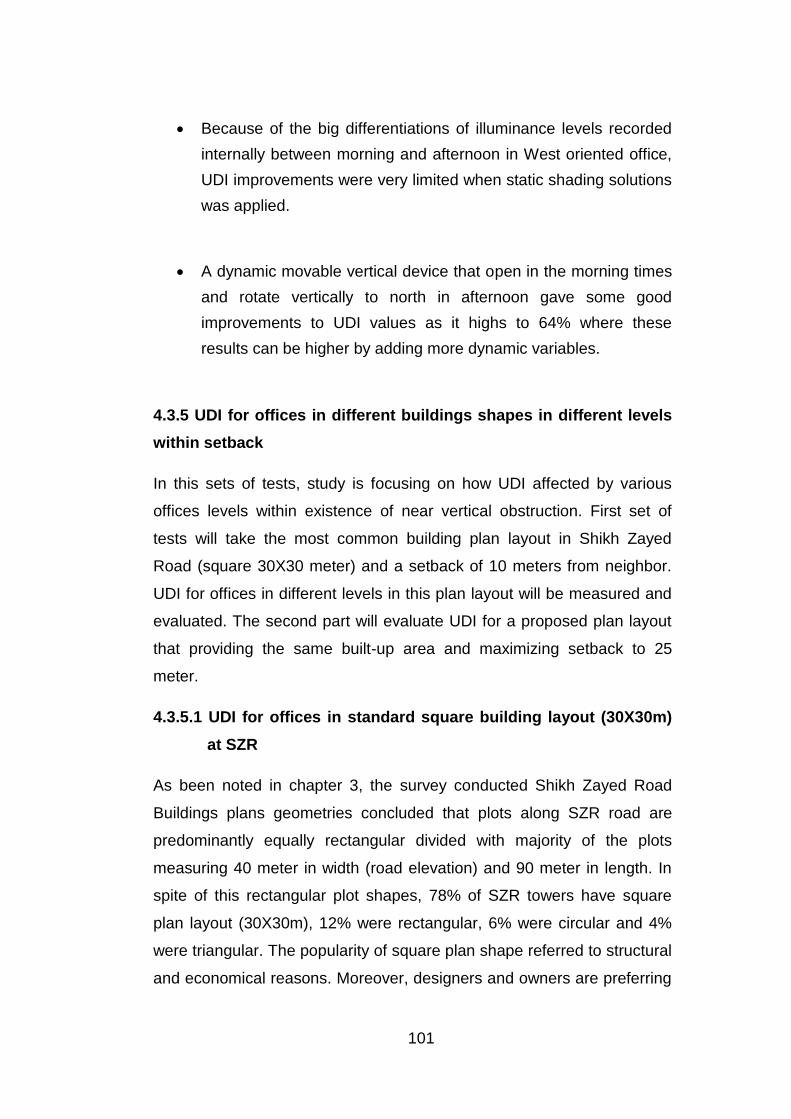
101
Because of the big differentiations of illuminance levels recorded
internally between morning and afternoon in West oriented office,
UDI improvements were very limited when static shading solutions
was applied.
A dynamic movable vertical device that open in the morning times
and rotate vertically to north in afternoon gave some good
improvements to UDI values as it highs to 64% where these
results can be higher by adding more dynamic variables.
4.3.5 UDI for offices in different buildings shapes in different levels
within setback
In this sets of tests, study is focusing on how UDI affected by various
offices levels within existence of near vertical obstruction. First set of
tests will take the most common building plan layout in Shikh Zayed
Road (square 30X30 meter) and a setback of 10 meters from neighbor.
UDI for offices in different levels in this plan layout will be measured and
evaluated. The second part will evaluate UDI for a proposed plan layout
that providing the same built-up area and maximizing setback to 25
meter.
4.3.5.1 UDI for offices in standard square building layout (30X30m)
at SZR
As been noted in chapter 3, the survey conducted Shikh Zayed Road
Buildings plans geometries concluded that plots along SZR road are
predominantly equally rectangular divided with majority of the plots
measuring 40 meter in width (road elevation) and 90 meter in length. In
spite of this rectangular plot shapes, 78% of SZR towers have square
plan layout (30X30m), 12% were rectangular, 6% were circular and 4%
were triangular. The popularity of square plan shape referred to structural
and economical reasons. Moreover, designers and owners are preferring
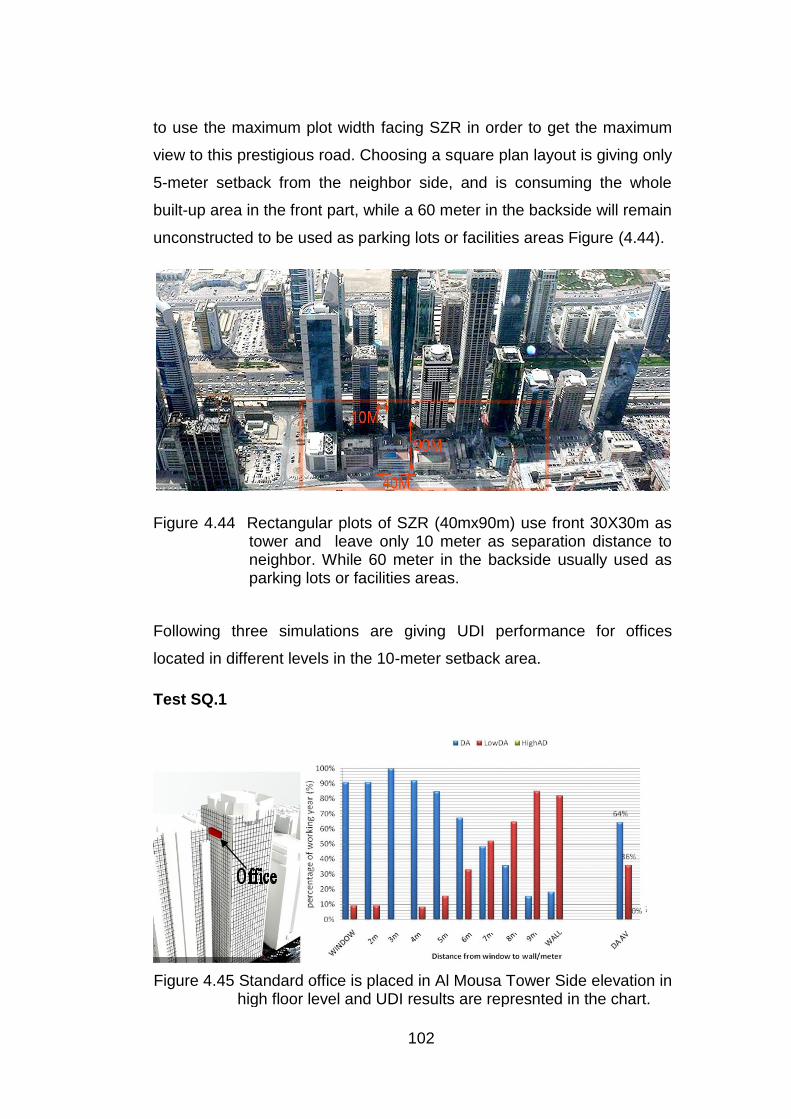
102
to use the maximum plot width facing SZR in order to get the maximum
view to this prestigious road. Choosing a square plan layout is giving only
5-meter setback from the neighbor side, and is consuming the whole
built-up area in the front part, while a 60 meter in the backside will remain
unconstructed to be used as parking lots or facilities areas Figure (4.44).
Figure 4.44 Rectangular plots of SZR (40mx90m) use front 30X30m as tower and leave only 10 meter as separation distance to neighbor. While 60 meter in the backside usually used as parking lots or facilities areas.
Following three simulations are giving UDI performance for offices
located in different levels in the 10-meter setback area.
Test SQ.1
Figure 4.45 Standard office is placed in Al Mousa Tower Side elevation in high floor level and UDI results are represnted in the chart.
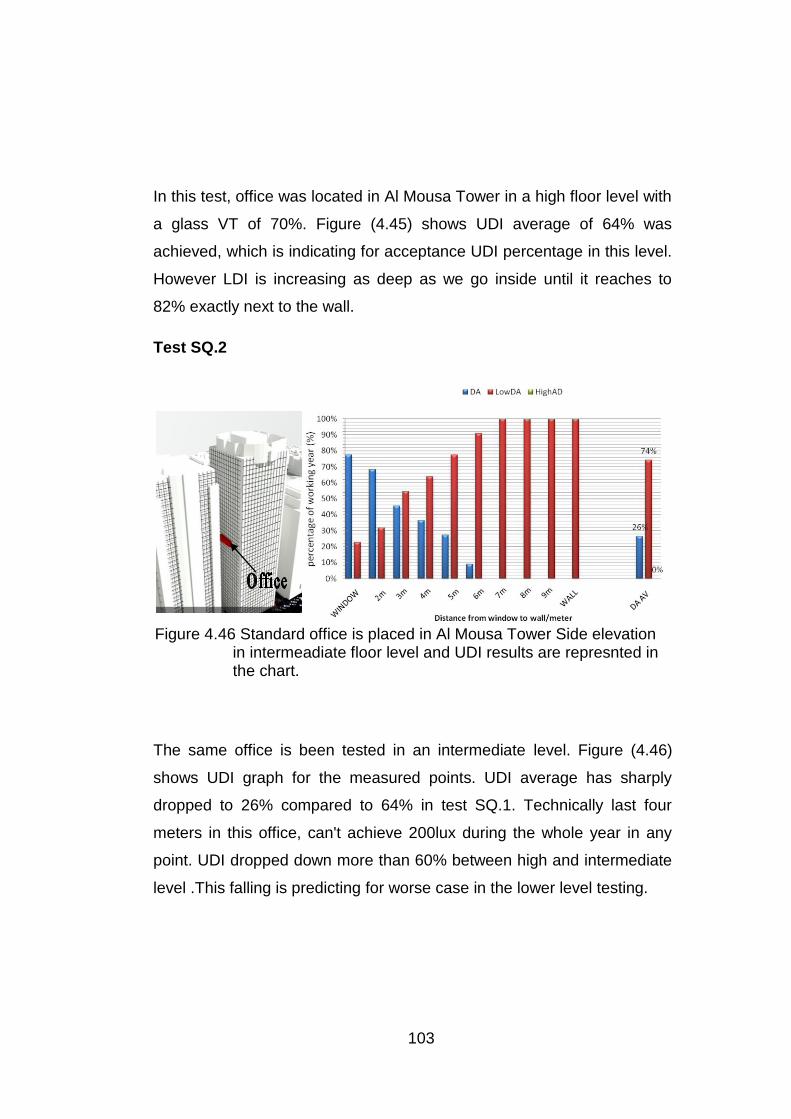
103
In this test, office was located in Al Mousa Tower in a high floor level with
a glass VT of 70%. Figure (4.45) shows UDI average of 64% was
achieved, which is indicating for acceptance UDI percentage in this level.
However LDI is increasing as deep as we go inside until it reaches to
82% exactly next to the wall.
Test SQ.2
The same office is been tested in an intermediate level. Figure (4.46)
shows UDI graph for the measured points. UDI average has sharply
dropped to 26% compared to 64% in test SQ.1. Technically last four
meters in this office, can't achieve 200lux during the whole year in any
point. UDI dropped down more than 60% between high and intermediate
level .This falling is predicting for worse case in the lower level testing.
Figure 4.46 Standard office is placed in Al Mousa Tower Side elevation in intermeadiate floor level and UDI results are represnted in the chart.
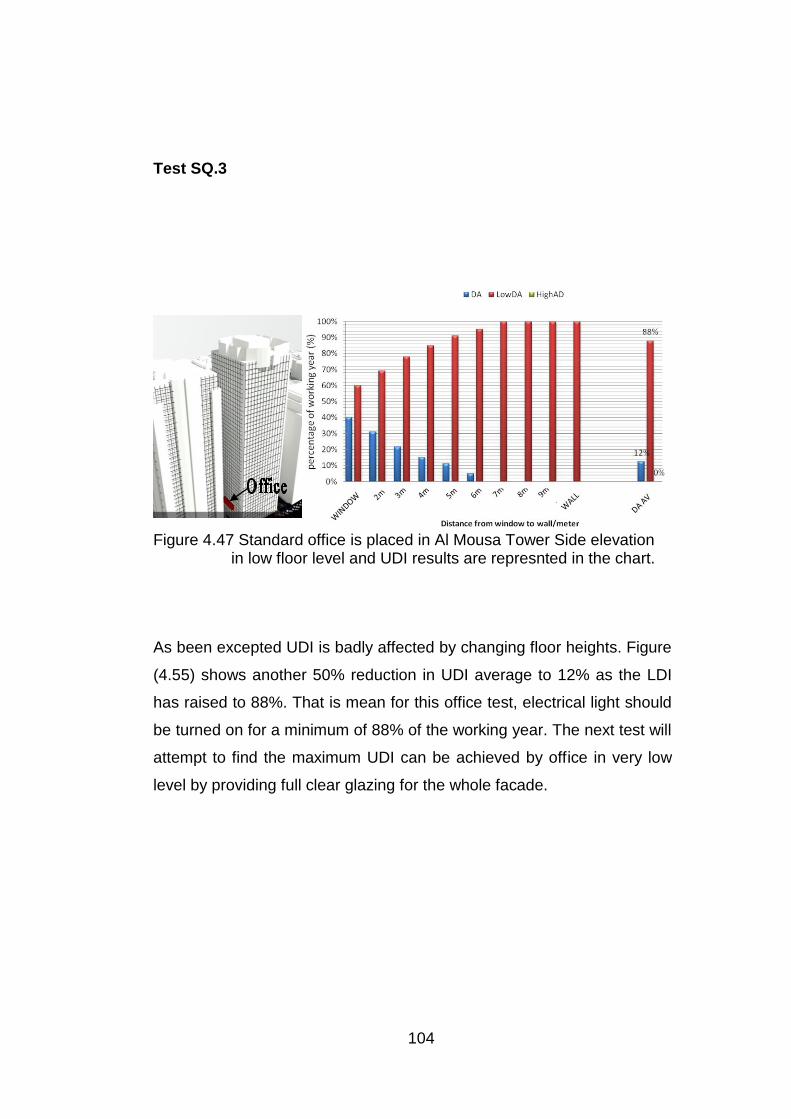
104
Test SQ.3
As been excepted UDI is badly affected by changing floor heights. Figure
(4.55) shows another 50% reduction in UDI average to 12% as the LDI
has raised to 88%. That is mean for this office test, electrical light should
be turned on for a minimum of 88% of the working year. The next test will
attempt to find the maximum UDI can be achieved by office in very low
level by providing full clear glazing for the whole facade.
Figure 4.47 Standard office is placed in Al Mousa Tower Side elevation in low floor level and UDI results are represnted in the chart.
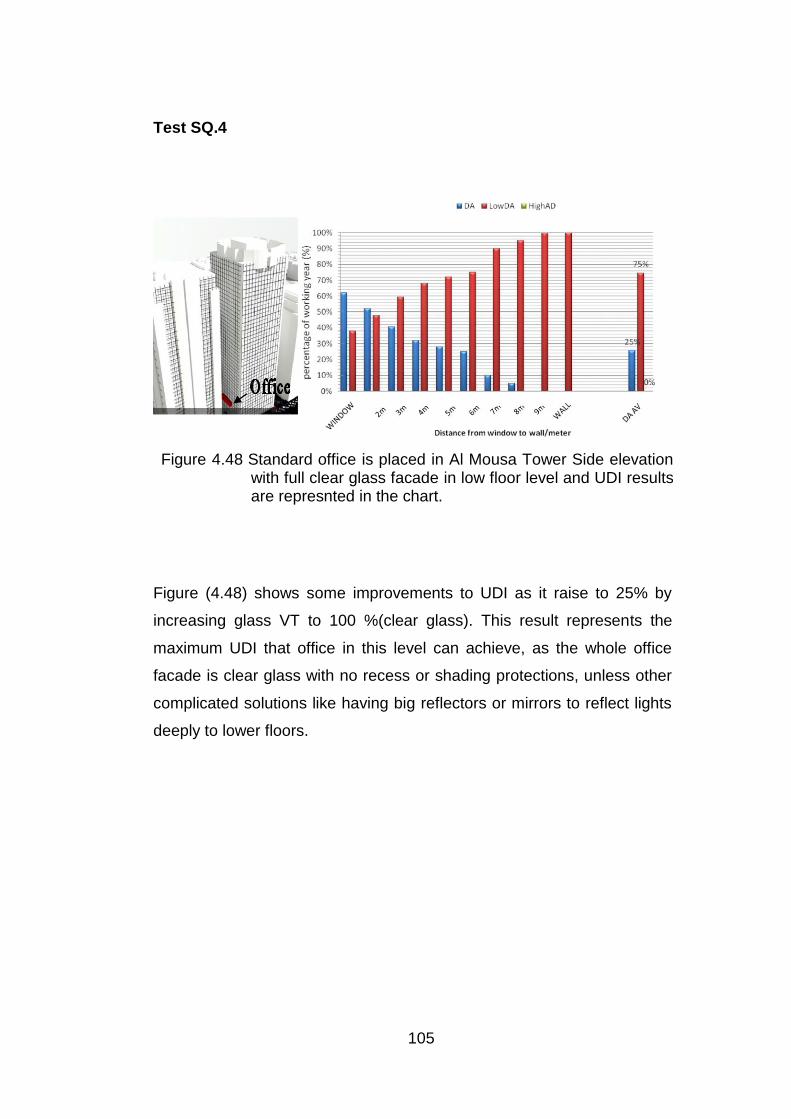
105
Test SQ.4
Figure (4.48) shows some improvements to UDI as it raise to 25% by
increasing glass VT to 100 %(clear glass). This result represents the
maximum UDI that office in this level can achieve, as the whole office
facade is clear glass with no recess or shading protections, unless other
complicated solutions like having big reflectors or mirrors to reflect lights
deeply to lower floors.
Figure 4.48 Standard office is placed in Al Mousa Tower Side elevation with full clear glass facade in low floor level and UDI results are represnted in the chart.
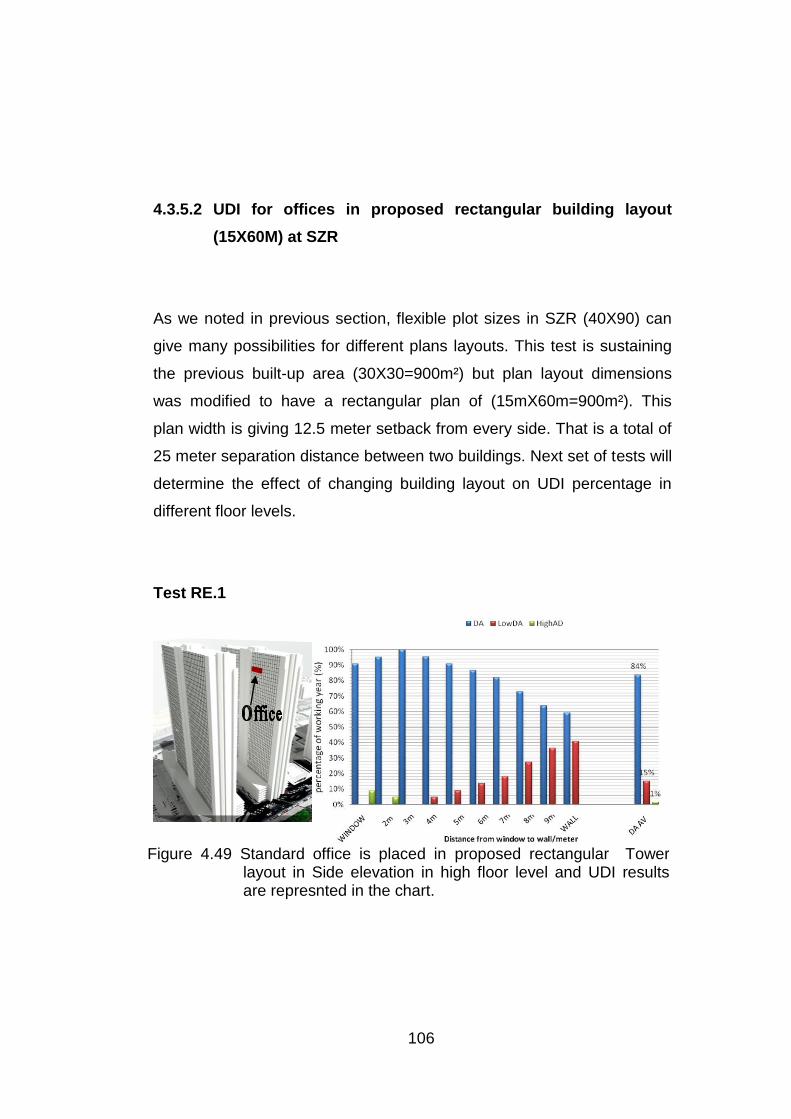
106
4.3.5.2 UDI for offices in proposed rectangular building layout
(15X60M) at SZR
As we noted in previous section, flexible plot sizes in SZR (40X90) can
give many possibilities for different plans layouts. This test is sustaining
the previous built-up area (30X30=900m²) but plan layout dimensions
was modified to have a rectangular plan of (15mX60m=900m²). This
plan width is giving 12.5 meter setback from every side. That is a total of
25 meter separation distance between two buildings. Next set of tests will
determine the effect of changing building layout on UDI percentage in
different floor levels.
Test RE.1
Figure 4.49 Standard office is placed in proposed rectangular Tower layout in Side elevation in high floor level and UDI results are represnted in the chart.
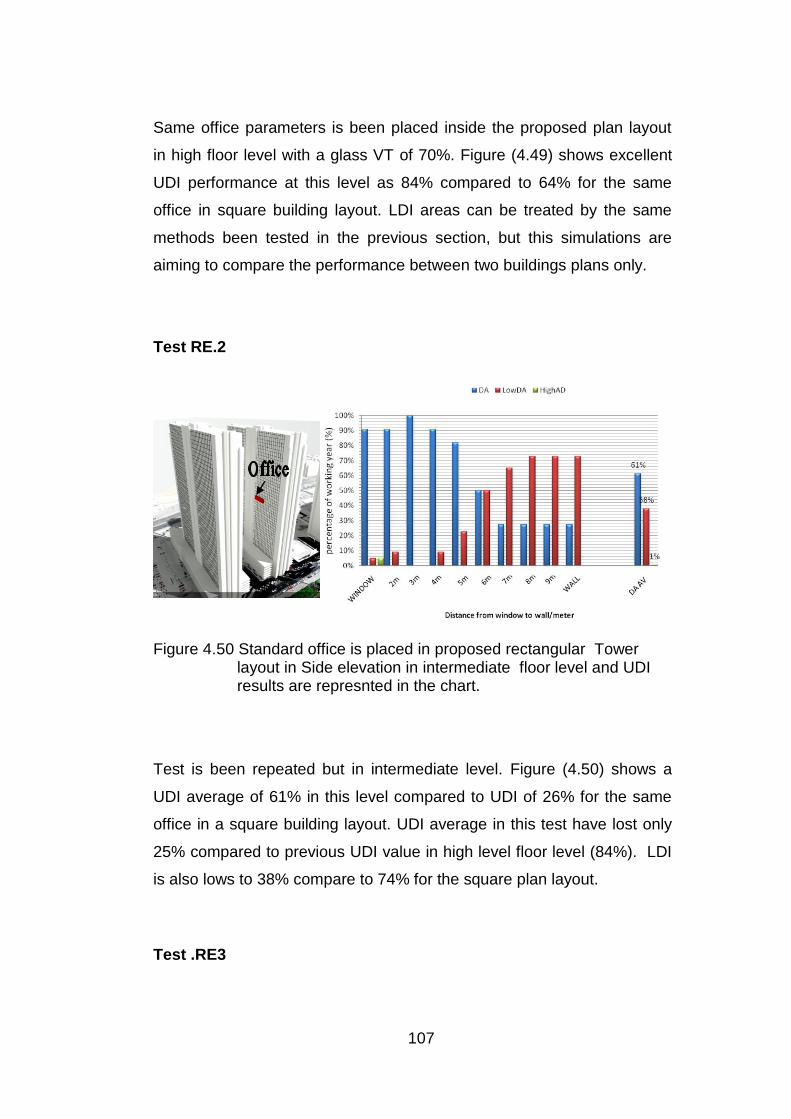
107
Same office parameters is been placed inside the proposed plan layout
in high floor level with a glass VT of 70%. Figure (4.49) shows excellent
UDI performance at this level as 84% compared to 64% for the same
office in square building layout. LDI areas can be treated by the same
methods been tested in the previous section, but this simulations are
aiming to compare the performance between two buildings plans only.
Test RE.2
Test is been repeated but in intermediate level. Figure (4.50) shows a
UDI average of 61% in this level compared to UDI of 26% for the same
office in a square building layout. UDI average in this test have lost only
25% compared to previous UDI value in high level floor level (84%). LDI
is also lows to 38% compare to 74% for the square plan layout.
Test .RE3
Figure 4.50 Standard office is placed in proposed rectangular Tower layout in Side elevation in intermediate floor level and UDI results are represnted in the chart.

108
Figure (4.51) shows test's results in low floor level. UDI average recorded
as 52% compared to 12% only in square plan tests. Next test will replace
70% VT glass by clear glass to find out the maximum UDI can be
achieved by this plan layout.
Test .RE4
Figure 4.51 Standard office is placed in proposed rectangular Tower layout in Side elevation in low floor level and UDI results are represnted in the chart.
Figure 4.52 Standard office is placed in proposed rectangular Tower layout on Side elevation in lowe floor level and clear glass seleation . UDI results are represnted in the chart.
109
Figure (4.52) shows how UDI is been affected after 70% glass VT is
been replaced by clear glass. Very major improvements are achieved in
this test as the UDI average jumped to 78% indicating for relatively
excellent performance for office in a low floor level.
4.3.6 Summary of results and findings for UDI tests for office in
different building geometries and setbacks
Buildings separations is strongly affecting daylight performance for
internal offices.
Similar built-up area can be achieved by different plans layouts
and changing building geometry is changing setback distance
between buildings.
UDI Results for square plan layout was indicating for a real lighting
problem facing this type of plans particularly for the lower floors
level where the UDI recorded as 12% only.
Rectangular plan achieved significantly better UDI results as UDI
recorded in the high levels was 84% and 52% in the lower floors.
Changing glass VT in the same facade between different levels is
strongly affecting UDI achievements.
Clear glass(VT100%) is been applied to the lower parts of the
square plan layout and UDI rose accordingly to 25% after 12%
only in the 70% VT test.
110
Clear glass (VT100%) is been applied to the lower parts of the
rectangular layout and UDI showed good improvements that highs
to 78% indicating for high office performance.
111
Chapter5 - Conclusion and Recommendations
This research has presented some office design solutions that can be
adopted to utilize daylight within office buildings in Dubai in more a
sustainable manner. Various solutions were proposed and evaluated by
using of UDI evaluation metric for office spaces while considering varying
design parameters such as orientations, glazing specifications, floor
levels vis a vis building setbacks and building layout shape.
The literature review discussed different metrics used to evaluate
daylight performance and evaluated merits and demerits of the two
variants, Static metrics and Dynamic metrics. It was demonstrated that
static metrics has been more commonly used in the past despite the
inaccuracy of data collected as it is based on a single sky condition with
the results of daylight factor being equal on all four facades. However, it
was noted that UDI metric was the best evaluation method as it
considers the different types of skies and also because of accuracy in
capturing the under or over exposed areas. A variety of testing methods
were investigated such as manual tools, mathematical method, scaled
model method and simulation. Simulation method was selected to be the
testing method for this research because of its affordability and flexibility
in changing one or group test parameters. By using 3D Max as a
simulation tool, different types of results were obtained from two
categories of tests:
Tests for illuminance falling on vertical facades tests
Daylight levels for generic offices interiors.
The interior simulation results were summarized to UDI simple graphs,
which gives informative and extremely simple method that summarizing
the massive excels data into small chart. Discussed below are the final
results outcome for different tests and conclusions drawn from each.
5.1 Conclusions of illuminance falling on vertical external facades
tests
112
The first step towards designing an office that utilizes daylight for
illuminating its interior is to acquire information on the amount of daylight
available in surroundings. This series of simulations tested the amount of
direct and diffuse illuminace values falling to external facades on different
orientations, levels and locations by using 3D Max Design as simulation
tool. For purposes of this study, a simple model for Sheikh Zayed Road
was constructed and data of external daylight illuminance was collected
from different facades in different times during the course of one year.
It was noted that the daylight illuminace falling on the north facade was
consistent throughout the course of the year, that is, it doesn't change
much over the different seasons. These results provide a general idea
about how one experiences the internal space over the duration of the
year depending on the orientation of the office space with the more
consistent North as opposed to the soon to be seen more variable West
elevation. The North facing façade experiences high illuminance values
only in June and July when the sun is at its highest altitude in the sky.
The experiment further illustrated simple solutions that successfully solve
this problem.
In contrast, South facing facades in UAE do experience direct solar
penetration during day with direct illuminace values rising in the south
facade to 80000lux at noon times. Tests conducted on this facade
concluded that South facing windows could be protected from extreme
direct sunlight at noon when the sun is located high in the sky by use of
horizontal shading devices. Vertical protection might be required during
the morning and afternoon hours particularly in winter when the sun
located in the shortest path from southwest to south east.
The daylight illuminance on the western facade on the other hand differs
from month to month in values with the western elevation experiencing
greater illumination in afternoon hrs throughout the entire year when the
sun is at a low altitude. The direct illuminance at such times can

113
potentially causing glare and heat gain problems. However western
facing building facade recorded low illuminance values in the morning
time with low illuminance in office spaces further away from the window
wall.
The last test indicated very undesirable illuminance levels results for the
lower floors of build due to the effect of a vertical obstruction, in this case,
an adjacent building within 10 meters from external facade. The
upcoming segment of the study will try to evaluate those problems
internally by providing an evaluation metric for daylight performance
within a generic office space on Sheikh Zayed road.
5.2 Conclusions of Daylight levels for a generic offices interiors
tests
The model generic office space on Sheikh Zayed road developed for
purposes of the study was based on the “typical” development
dominating the site based on current site layouts. The model office
underwent several sets of simulations in different orientations with
recorded data for a period of one year. The outcome was three main
output types of data, real image, gradient color and Excel measurements.
The data was very rich and informative, ideal for evaluating office
performance for one or two cases but would be cumbersome/ inefficient
as a comparison method between many different simulation cases with
every case having 3600 rows of data. This justified progression to the
next step which was to adopt the excel data and summarize it to useful
daylight illuminance evaluation metric (UDI).
5.3 Conclusions of UDI evaluation metric for internal office
performance
Useful Daylight Illuminance metric is been certified as evaluation metric
for different design solutions. The UDI scheme is both richly informative
and extremely simple method that summarizing the massive excels data
114
into small chart. UDI would give the designer of a space quick indication
of likely tendency for discomfort, potential high or low levels of
illumination and solar gains for a space given its specific characteristics.
In addition, UDI gives an idea about daylight distribution and space
uniformity.
The generic office design tests represented several different office types
and both good and bad daylighting performed offices. A wide range of
different tests was reviewed in previous section illustrating the ability of
the UDI evaluation metric to adequately quantify the quality of daylight in
a given test. Also it represents the abilities of this metric to identify the
areas responsible for LDI and HDI problems in order to take the suitable
action for reducing their negative impact on daylight performance.
It's been verified that having a UDI levels between 80% to 100%
represent some excellent daylight designs parameters, while good
daylighting designs could fall to a range of 60% to 80% UDI range. 60%
UDI and below indicating for low daylight design performance.
A serious of tests were conducted in this section in different orientations
and parameters. North direction presented the best performance
compared to the other directions. The North can achieve good UDI
values without having any protection on facade. however the addition of
overhangs on the north facades and recessing glass window 40cm to
inside gave additional improvements to office performance where UDI
highs to 95% indicating for a nearly perfect design performance . UDI for
south oriented office came acceptable as 62% for standard office without
protections, while this percentage rose to highs of 81% after adding
vertical and horizontal 50cm over hangs and changing glass VT in the
upper portion to 100%. UDI results for west oriented standard office
started with UDI average of 48% only as the whole office receiving
excessively high HDI percentage in afternoon time while the back areas
got a big amount of LDI particularly in the morning times. The big
115
differentiations of daylight levels between morning and afternoon times
formed a challenging case in order to increase western office
performance. Static design solutions failed to achieve significant
improvements because providing a proper protection from afternoon low
sun angle was leading to high values of LDI in the early morning time. A
dynamic movable vertical device that open in the morning times and
rotate vertically to north in afternoon gave some good improvements to
UDI values as it highs to 64%.
The next set of tests in this section were to determine how building
geometry and setback distance affecting daylight performance. It's been
found that buildings setbacks strongly affect daylight performance for
internal offices. Office footprints are mostly determined by developers’
requirements for certain built-up area yet similar built-up area can be
achieved by use different plans layouts that could possibly give a better
day lighting performance. Altering the building geometry is also changing
setback distance between buildings. As highlighted, simulations on the
common square plan (30X30m) of SZR with a separation distance of 10
meters from neighboring building was tested at different levels with the
results indicating very low LDI particularly for the lower floors level. The
UDI recorded on lower floors as low as 12%. Simulations of a rectangular
floor plan of similar usable space with separation distance of 25 meters
from neighboring building when tested at the lower floors indicated
significantly better UDI results. These tests indicated recorded UDI levels
in the higher floors of 84% and 52% in the lower floors. Note however
that these results were for unified glass VT. In addition, even better UDI
levels can be achieved if the designer specified glass with higher VT to
upper floors of the office tower and for the lower floors of the tower
specify clear glass (VT100%). This simulation indicated greatly improved
UDI values of 78% on lower floors indicating high office performance.
UDI is a relatively new concept and more studies need to be carried out
to link more external parameters with the same metric like electrical
116
consuming, heat load or HVAC In order to expand its evaluations spots.
Daylight Factor metric has been the most dominant evaluation metric for
a long time, mainly because of its inherent straightforwardness rather
than its realism. In spite of evidence of daylight factor’s lack of reality,
most investigators still prefer it as the easiest and simplest way to
evaluate their designs. As highlighted many building evaluation system
like LEED and ASHARE are framed only in term of daylight factor. The
UDI method can offer simplified characteristics of climate-based analyses
in brief and clear comprehensible form. The holistic scheme of UDI gives
many Promises for this metric to have strongly potential for replacing the
static daylight factor metric.
References
Aboulnaga, M. M., (2005) Towards green buildings: Glass as a building
element-the use and misuse in the gulf region. Renewable Energy 31 (2006)
631–653. Available from: http://www.sciencedirect.com.
Aburdene, M.F. (2001) Computer Simulation of Dynamic Systems. Building and
Environment 25 (2001) 1120-1138. Available from:
http://www.sciencedirect.com. [Accessed 16 May 2009].
Al-Sallal, K. A., (2006) Easing high brightness and contrast glare problems in
universal space design studios in the UAE: Real models testing. Renewable
Energy 31 (2006) 617–630. Available from: http://www.sciencedirect.com.
[Accessed 30 June 2009] .
117
Al-Sallal, K. A. and Ahmed, L., (2007) Improving natural light in classroom
spaces with local trees: simulation analysis under the desert conditions of the
UAE. Proceedings: Building Simulation, PP 1168-1174.
Bhavani, R. G. and Khan, M. A., (2006) Present Trends and Future Direction of
Lighting Control in Dubai. Middle East Economic Survey (MEES) 2007, vol. 50,
no. 30, pp 23-24.
Boyce, P., Hunter, G. and Howlett, o., (2003) The benefits of daylight through
windows . Lighting Research Center, Troy, New York 12180-3352. Available
from http://www.usp.br/fau/cursos/graduacao. [Accessed 14 May 2009] .
California Energy Commission (CEC), (2003) Windows and Offices: A Study of
Office Worker Performance and the Indoor Environment. California ,United
State .
CHPS Daylighting Committee Daylighting Forum, (2006) Daylighting Metric
Development Using Daylight Autonomy Calculations In the Sensor Placement
Optimization Tool. Boulder, Colorado 80301
Dubai statistic center (2006) Statistical Yearbooks. Avalibale from:
http://www.dubai.ae/en.
Edwards, L. and Torcellini, P., (2002) Literature Review of the Effects of Natural
Light on Building Occupants. National Renewable Energy Laboratory NREL/TP-
550-30769.
118
Edwards, m., (2002) An investigation into radiance and its use as a lighting
design tool. University of Wales, Cardiff, UK.
Heerwagen, J. H. and Associates, Inc., (2000) Green Buildings,
Organizational Success, and Occupant Productivity. Building Research
and Information Vol. 28 (5), 2000:353-367 London, UK Cost.
Illuminating Engineering Society of North America (IESNA), (2003)
Using Daylight as a Light Source. Available from:
http://www.ies.org/leukos.
Institute for Research in Construction, (2006) Tutorial on the Use of Daysim
Simulations for Sustainable Design. Ottawa, Canada.
Ko, D. H., Elnimeiri, M. and Clark, R. J., (2008) Assessment and prediction of
daylight performance in high-rise office buildings. The structural design of tall
and special buildings, Build. 17, 953–976 (2008). Available from:
http://www.interscience.wiley.com. [Accessed 08 August 2009]
Landry, M. and Breton, P. F. (2009: a) Daylight Simulation in 3ds Max
Design 2009 – Advanced Concepts . Available from:
http://images.autodesk.com/adsk/files/3dsmax_advanced.pdf
Landry, M. and Breton, P. F. (2009: b) Daylight Simulation in 3ds Max
Design 2009 – Getting Started . Available from:
http://images.autodesk.com/adsk/files/3dsmax_started.pdf
119
Lee, E. S. and Selkowitz, S. (1998) Advanced Fenestration Systems for
Improved Daylight Performance. Daylighting ’98 Conference Proceedings, May
11-13, 1998, Ottawa, Ontario, Canada.
Li, H. W., Lam, C., and Lau, C. S., (2001) Technical note A new approach for
predicting vertical global solar irradiance. Renewable Energy 25 (2002) 591–
606. Available from:
http://www.sciencedirect.com. [Accessed 19 June 2009]
Li, H. W. , Lau, C. S. and Lam, C., (2001) Evaluation of overcast-sky luminance
models against measured Hong Kong data. Applied Energy 70 (2001) 321–331.
Available from: http://www.sciencedirect.com. [Accessed 20 June 2009]
Li, H. W. and Lam, C., (2001) Evaluation of lighting performance in offices
buildings with daylight controls . Energy and Building 33(2001) 793-803.
Available from: http://www.sciencedirect.com. [Accessed 21 June 2009].
Li, H. W., Lam, N. T. and Wong, S. L., (2005) Lighting and energy performance
for an office using high frequency dimming controls. Energy Conversion and
Management 47 (2006) 1133–1145. Available from:
http://www.sciencedirect.com. [Accessed 5 July 2009]
Li, H. W. and Wong, S.L., (2007) Daylighting and energy implications due to
shading effects from nearby buildings. Applied Energy 84 (2007) 1199–1209.
Available from: http://www.sciencedirect.com. [Accessed 9 July 2009]
120
Li, H. W. and Tsang, K.W., (2008) An analysis of daylighting performance for
office buildings in Hong Kong. Building and Environment, 43 (2008) 1446–1458.
Available from:
http://www.sciencedirect.com. [Accessed 12 July 2009]
Nabil, A. and Mardaljevic, J.,(2006) Useful daylight illuminances: A replacement
for daylight factors. Energy and Buildings 38 (2006) 905–913. Available from:
http://www.sciencedirect.com. [Accessed 25 September 2009]
Morris, K., (2004) An investigation into the sensitivity of ECOTECT's Daylighting
Analysis and Practical implications in computer Modeling and its effect to
Daylight in primary school classroom. University of Wales, Cardiff, UK.
Reinhart, C. F., and Walkenhorst, O. (2001) Dynamic RADIANCE-based
Daylight Simulations for a full-scale Test Office with outer Venetian Blinds.
Energy & Buildings, 33(7), 683-697.
Reinhart, C.F., (2006) Tutorial on the Use of Daysim Simulations for
Sustainable Design. Institute for Research in Construction. Ottawa, Canada .
Reinhart, C.F. ,Mardaljevic, J. and Rogers, Z., (2006) Dynamic daylight
performance metrics for sustainable building design. Available from:
121
http://www.sciencedirect.com. [Accessed 18 June 2009]
Reinhart, C.F. and Fitz, A. (2009) Experimental Validation of Autodesk 3ds Max
Design 2009 and Daysim 3.0. NRC Project # B3241. Available
from:http://images.autodesk.com/adsk/files/3ds_max_design-
exposure_validation.pdf. [Accessed 18 August 2009].
Rogers Z. (2005) Architectural Energy Corporation Boulder, Colorado, USA.
Available from http://www.archenergy.com/SPOT/download.html .
U.S Green Building Council, (2009) The Green Home Guide. Available from
http://www.usgbc.org/ .
Ward, G., F. Rubinstein, (1988) A New Technique for Computer Simulation of
Illuminated Spaces, Journal of the Illuminating Engineering Society, Vol. 17, No.
1
122
Bibliography
Al-Sallal, K. A., (2007) Data Bank Testing glare in universal space design
studios in Al-Ain, UAE desert climate and proposed improvements. Renewable
Energy 32 (2007) 1033–1044. Available from:
http://www.sciencedirect.com. [Accessed 30 June 2009] .
Bahaj, A. S., James, A. B. and Jentsch, M. F., (2008) Potential of emerging
glazing technologies for highly glazed buildings in hot arid climates. Energy and
Buildings 40 (2008) 720–731. Available from: http://www.sciencedirect.com.
[Accessed 30 June 2009] .
Baldinelli, G. (2009) Double skin façades for warm climate regions: Analysis of a
solution with an integrated movable shading system. Building and Environment
44 (2009) 1107–1118. Available from: http://www.sciencedirect.com. [Accessed
30 June 2009] .
Bhavani, R. G. and Khan, M. A., (2008) prevalence and penetration of lighting
control systems in Dubai buildings: a pointer to future measurements. Journal
of applied science 8 (19): 3460-3466.
Edmonds, I. R. and Greenup, P. J., (2001) Daylighting In The Tropics. Solar
Energy Vol. 73, No. 2, pp. 111–121.
123
Ernest Orlando Lawrence Berkeley National Laboratory (1998) Tips For
Daylighting With Windows. California Institute for Energy Efficiency (CIEE),
California, United State. T H W I N D O W S
Freewan, A. A. , Shao, L. and Riffat, S.,(2007) Optimizing performance of the
lightshelf by modifying ceiling geometry in highly luminous climates. Solar
Energy 82 (2008) 343–353. Available from:
http://www.sciencedirect.com. [Accessed 12 June 2009].
International IBPSA Conference ,Montréal, Canada ,August 15-18, 2005.
BS09_0281_292.
Gugliermetti, F. and Bisegna, F.,(2005) Static And Dynamic Daylight Control
Systems: Shading Devices And Electrochromic Windows. Ninth International
IBPSA Conference Montréal, Canada August 15-18, 2005. BS05_0357_364.
James, P. A. and Bahaj, A. S. (2005) Smart glazing solutions to glare and solar
gain: a ‘sick building’ case study. Energy and Buildings 37 (2005) 1058–1067.
Available from: http://www.sciencedirect.com. [Accessed 11 September 2009]
New Building Institute (NBI) , (2003). Advanced Lighting guidelines. United
State. WA 98672. Marsh, .A (2004) Daylight factor . available from
http://squ1.org/wiki/Daylight_Factors
Ng, N., (2005) A study of the relationship between daylight performance and
height difference of buildings in high density cities using computational
simulation. Ninth
124
Kassab, M. and Love, J. A., (2005) The Potential Of Comfort Daylighting Design
On Improving The Energy Efficiency Of Commercial BUILDINGS. Ninth
International IBPSA Conference Montréal, Canada.
Lam, C., and Li, H. W.,(1997) Daylight and energy analysis for air-conditioned
office building. Energy vol.23, pp. 79-89. Available from:
http://www.sciencedirect.com. [Accessed 21 June 2009]
Lawrence Berkeley National Laboratory, (2007) Commissioning and Verification
Procedures for the Automated Roller Shade System at The New York Times
Headquarters, New York, New York. New York, USA.
Leslie, R. P. (2002) Capturing the daylight dividend in buildings: why and how?.
Building and Environment 38 (2003) 381 – 385. Available from:
http://www.elsevier.com/locate/buildenv. [Accessed 11 June 2009]
Lee, E. S. and Tavil, A., (2006) Energy and visual comfort performance of
electrochromic windows with overhangs. Building and Environment 42 (2007)
2439–2449. Available from: http://www.sciencedirect.com. [Accessed 5 July
2009].
Li, H. W. and Lam, C., (1999) Measurements of solar radiation and illuminance
on vertical surfaces and daylighting implications. Renewable Energy 20 (2000)
389±404. Available from:

125
http://www.sciencedirect.com. [Accessed 17 June 2009]
Li, H. W. and Lam, C., (1999) Evaluation of slope irradiance and illuminance
models against measured Hong Kong data. Building and Environment 35 (2000)
501±509. Available from:
http://www.sciencedirect.com. [Accessed 17 June 2009]
Li, H. W. and Lam, C., (2001) A study of atmospheric turbidity for Hong Kong.
Renewable Energy 25 (2002) 1–13. Available from:
http://www.sciencedirect.com. [Accessed 20 June 2009]
Li, H. W., Lau, C. S. and Lam, C., (2003) Overcast sky conditions and
luminance distribution in Hong Kong. Building and Environment 39 (2004) 101 –
108. Available from: http://www.sciencedirect.com. [Accessed 21 June 2009]
Li, H. W. and Lam, C., (2002) An analysis of all-sky zenith luminance data for
Hong Kong. Building and Environment 38 (2003) 739 – 744. Available from:
http://www.sciencedirect.com. [Accessed 28 June 2009]
Li, H. W., Cheung, H. W., Lau, C. S., (2005) A simplified procedure for
determining indoor daylight illuminance using daylight coefficient concept.
Building and Environment 41 (2006) 578–589. Available from:
http://www.sciencedirect.com. [Accessed 5 July 2009]
Li, H. W., Lau, C. S., Lam, C., (2005) Predicting daylight illuminance on inclined
surfaces using sky luminance data. Energy 30 (2005) 1649–1665. Available
from: http://www.sciencedirect.com. [Accessed 5 July 2009]
126
Li, H. W., (2006) Daylight and energy implications for CIE standard skies.
Energy Conversion and Management 48 (2007) 745–755. Available from:
http://www.sciencedirect.com. [Accessed 9 July 2009]
Lopin, M. K., (2002) An Overview of Daylighting systems. Solar Energy Vol. 73,
No. 2, pp. 77–82. Available from: http:// www.elsevier.com/ locate / solener .
[Accessed 11 June 2009]
Mardaljevic, J. (2006) Examples of Climate-Based Daylight Modelling . CIBSE
National Conference 2006: Engineering the Future 21-22 March 2006, Oval
Cricket Ground, London, UK.
New York State Energy Research And Development Authority, (2005)
Daylighting The New York Times Headquarters Building. New York, USA.
Ochoa, C. E. and Capeluto, I. G., (2005) Evaluating visual comfort and
performance of three natural lighting systems for deep office buildings in highly
luminous climates. Building and Environment 41 (2006) 1128–1135. Available
from:
http://www.sciencedirect.com. [Accessed 12 July 2009].
Osterhaus, K.E (2005)Discomfort glare assessment and prevention for daylight
applications in office environments. Solar Energy 79 (2005) 140–158. Available
from: http://www.sciencedirect.com. [Accessed 12 July 2009].
127
Reinhart, C.F. , (2004) An evaluation of radiance based simulations of annual
indoor illuminance distributions due to daylight. Solar Building design Group
Oltmannsstrasse 5, 79100 Freiburg, Germany. BS99_A-19.
Reinhart, C.F. and Fitz, A.,(2006) Findings from a survey on the current use of
daylight simulations in building design. Energy and Buildings 38 (2006) 824–
835. Available from : http://www.sciencedirect.com. [Accessed 18 June 2009]
Reinhart, C.F. , Bourgeois, D. , Dubrous, F. , Lopez.P and Stelescu, A., (2007)
Daylight1-2-3 – a state-of-the-art daylighting/energy analysis software for initial
design investigations. Institute for Institute for Research in Construction -
National Research Council Canada, Ottawa K1A 0R6, Canada. p233_final.
Torres, S. L. and Sakamoto, Y. (2007) Facade design optimization for daylight
with a simple genetic algorithm. Ove Arup and Partners International, London,
W1T 4BQ, United Kingdom. p117_final.
Unver, R., Ozturk, L., Adıguzel, S. and Celik, O (2003) Effect of the facade
alternatives on the daylight illuminance in offices . Energy and Buildings 35
(2003) 737–746. Available from :
http://www.sciencedirect.com. [Accessed 18 June 2009]
Wienold, J. (2007) Dynamic simulation of blind control strategies for visual
comfort and energy balance analysis. Fraunhofer Institute for Solar Energy
Systems, Heidenhofstr. 2, D-79110 Freiburg, Germany. p231_final.

128