Embed Size (px)
Citation preview

1144 Vol. 67, No. 10
© 2019 The Pharmaceutical Society of Japan
Chem. Pharm. Bull. 67, 1144–1151 (2019)
Regular Article
The Usefulness of Definitive Screening Design for a Quality by Design Approach as Demonstrated by a Pharmaceutical Study of Orally Disintegrating Tablet
Keisuke Takagaki,a Terushi Ito,b Hiroaki Arai,a Yasuko Obata,a Kozo Takayama,c and Yoshinori Onuki*,b
a Department of Pharmaceutics, Hoshi University; 2–4–41 Ebara, Shinagawa-ku, Tokyo 142–8501, Japan: b Laboratory of Pharmaceutical Technology, Graduate School of Medical and Pharmaceutical Science, University of Toyama; 2630 Sugitani, Toyama 930–0194, Japan: and c Faculty of Pharmacy and Pharmaceutical Sciences, Josai University; 1–1 Keyakidai, Sakado, Saitama 350–0295, Japan.Received July 4, 2019; accepted July 30, 2019
Definitive screening design (DSD) is a new class of small three-level experimental design that is attract-ing much attention as a technical tool of a quality by design (QbD) approach. The purpose of this study is to examine the usefulness of DSD for QbD through a pharmaceutical study on the preparation of ethenzamide-containing orally disintegrating tablet. Model tablets were prepared by directly compressing the mixture of the active pharmaceutical ingredient (API) and excipients. The five evaluated factors assigned to DSD were: the contents of API (X1) and lubricant (X2), and the compression force (X3) of the tableting process, the mix-ing time (X4), and the filling ratio of powder in the V-type mixer (X5). After tablet preparation, hardness and disintegration time were measured. The same experiments were performed by using the conventional design of experiments [i.e., L8 and L16 orthogonal array designs and central composite design (CCD)]. Re-sults showed that DSD successfully clarified how various factors contribute to tablet properties. Moreover, the analysis result from DSD agreed well with those from the L8 and L16 experiments. In additional experi-ments, response surfaces for tablet properties were created by DSD. Compared with the response surfaces created by CCD, DSD could produce reliable response surfaces for its smaller number of experiments. We conclude that DSD is a powerful tool for implementing pharmaceutical studies including the QbD approach.
Key words definitive screening design; design of experiment; quality by design; two-factor orthogonal array design; central composite design; orally disintegrating tablet
IntroductionPharmaceutical quality by design (QbD) is a modern ap-
proach to pharmaceutical development.1,2) Since the QbD concept was introduced in the International Conference on Harmonization Q8 guideline in 2008,3) it has become of cen-tral importance to the pharmaceutical industry. According to the QbD concept, quality must be built into the product. The quality of manufactured pharmaceutical products is affected by a large number of formulation variables and manufacturing process parameters. A better understanding of the relation-ships between factors and characteristics would constitute valuable knowledge for developing desirable pharmaceutical products, and would contribute to a reduction in product vari-ability and defects, thereby enhancing product development, quality, and manufacturing efficiencies. The QbD approach comprises two essential elements, namely screening crucial characteristic factors followed by optimization of the crucial factors to meet the needs of each product. To implement the QbD approach, application of design of experiments (DOE) is strongly recommended.Two-level orthogonal array designs (e.g., L8 and L16) are
cited as a common experimental design for screening crucial factors,4,5) as they enable evaluation of the contribution of characteristic factors with a smaller number of experiments. However, these methods cannot offer information on possible curvature or on the quadratic effects of factors.6) Curvature is the nonlinear effect of a variable and can be evaluated when
factors are studied on three or more levels. The center point of a two-level orthogonal array design is customarily added to obtain a global assessment of curvature. However, the qua-dratic effects of each factor remain to be identified. To deal with this issue, other experimental designs of three or more levels have to be used.Recently, a new class of three-level experimental design,
so-called definitive screening design (DSD), was proposed by Jones and Nachtsheim.7,8) To produce the experimental design, the conference matrix is employed. The conference matrix is composed of fold-over pairs corresponding to each evaluated factor and overall center points. DSD has a great capacity for assessing the main effects of factors and their two-factor interactions without confounding bias. The main effects are always orthogonal to the two-factor interactions. In addition to main effects and two-factor interactions, it enables evaluation of pure-quadratic effects of factors. According to this, we can understand the nonlinear effect of factors on characteristics. DSD is attractive in terms of the small number of experi-mental runs. Even- and odd-numbered k-factor matrices re-spectively require 2k + 1 and 2k + 3 experimental runs. These numbers are only about twice that of the evaluated factors. These features allow investigation of a large number of factors in a fairly small experiment, eventually leading to significant reductions in time, resources, and cost during pharmaceutical development. Thus, DSD is attracting considerable attention as a promising technical method for the QbD approach. To date,
* To whom correspondence should be addressed. e-mail: [email protected]
Vol. 67, No. 10 (2019) 1145Chem. Pharm. Bull.
DSD has been applied to the preparation of a wide range of dosage forms including oral disintegrating films,9) modified-release drug products,10) intranasal gel formulations,11) semi-solid dosage forms,12,13) and lyophilized products.14) However, to our knowledge, there is no pharmaceutical study comparing analytical results between DSD and conventional DOE meth-ods. To accumulate enhanced technical knowledge concerning DSD, the present study tested a model of an orally disintegrat-ing tablet (ODT) containing ethenzamide. The model tablets were prepared with different conditions of formulation and process variables assigned by DSD and then the characteris-tics of hardness and disintegration time (DT) were measured. After analyzing the observed data, the modes of contribution of crucial factors were identified and then response surfaces were created. The same experiments were also performed based on conventional DOE methods. The main conclusion from this study was that DSD is a powerful tool for imple-menting pharmaceutical studies that adopt a QbD approach.
ExperimentalMaterials Ethenzamide and magnesium stearate (MgSt)
were purchased from FUJIFILM Wako Pure Chemical Cor-poration (Osaka, Japan). SmartEx®(QD50), a coprocessed excipient granule consisting of D-mannitol, low-substituted hy-droxypropyl celluloses (L-HPC), and polyvinyl alcohol (PVA) for preparing ODTs, was purchased from Shin-Etsu Chemical (Tokyo, Japan).
Preparation of Model Tablets Model tablets were pre-pared by the direct tableting method. Ethenzamide, SmartEx® and MgSt were used as the active pharmaceutical ingredi-ent (API), the excipient for direct compression of ODT, and the lubricant of the model tablet, respectively. In brief, they were dried at 75°C for 24 h and sieved through a 20-mesh screen before tablet preparation. Designated amounts of all components were charged into a V-type mixer with a 500 mL container (VM-2; Tsutsui Scientific Instruments, Tokyo, Japan). In a preliminary experiment, the major components of the model tablet showed similar bulk density: 0.420 and 0.477 g/mL for API and SmartEx®, respectively. The volume
of tablet powder was calculated under the assumption that the bulk density values of all components were 0.477 g/mL. After mixing at 45 rpm for a designated period, the resulting tablet powder (200 mg) was compressed into a round tablet using a Handtab 100 hydraulic press. The tablet had a diameter of 8 mm with a 12 mm concave radius of curvature. Experimental designs including DSD, L8, L16, and central composite design (CCD) were designed by the statistical software JMP® 13 (SAS Institute, Cary, NC, U.S.A.).
Measurement of Tablet Properties The tablet properties were evaluated immediately after preparing the model tablets. The hardness of the tablets was determined using a tablet hardness tester (Portable checker PC-30; Okada Seiko, Tokyo, Japan). DT was measured according to the JP17 disintegration test using a disintegration tester (NT-20H; Toyama Sangyo, Osaka, Japan) and water (as solvent) at 37 ± 0.5°C.
Data Analysis The experimental data were analyzed with the statistical software JMP® 13 (SAS Institute). Multiple regression analysis applying a least squares assessment was performed to identify the factors considered to be crucial for tablet properties. The multiple regression equations were ap-proximated by a stepwise selection technique. A p-value was set at 0.1 and then selection and retention of variables were re-peated until no improvement in overall accuracy was observed from the predicted model. Regarding optimization study, the response surfaces for tablet properties were created by ex-perimental data observed from DSD and CCD experiments, and then their optimal conditions were determined by using satisfaction function.
Results and DiscussionWe investigated the effects of the following variables on
tablet properties: the contents of API (X1) and lubricant (X2) in the model tablet; the compression force (X3) of the tableting process; and the mixing time (X4) and the filling ratio of pow-der in the V-type mixer (X5) (Table 1). We evaluated the DT valuables after converting the observed data into logarithms [log(DT)] to reduce data bias. First, the accuracy of the mul-tiple regression equations constructed by DSD was evaluated.
Table 1. Formulation and Process Variables of the Model Tablets and Their Properties According to Definitive Screening Design
Run
Factors Tablet properties
X1 X2 X3 X4 X5Hardness
[N]Log (DT)API content
[%]Lubricant content
[%]Compression force
[kN]Mixing time
[min]Filling ratio
[%]
#1 30 3 8 60 80 70.7 ± 3.8 2.21 ± 0.01#2 30 1 4 10 40 32.3 ± 3.8 1.19 ± 0.02#3 50 2 4 60 80 29.0 ± 3.6 1.72 ± 0.02#4 10 2 8 10 40 77.0 ± 2.0 1.44 ± 0.02#5 50 1 6 10 80 57.0 ± 3.6 1.47 ± 0.03#6 10 3 6 60 40 53.3 ± 2.1 1.55 ± 0.01#7 50 3 4 35 40 32.3 ± 1.2 2.10 ± 0.04#8 10 1 8 35 80 80.7 ± 3.8 1.38 ± 0.05#9 50 3 8 10 60 71.7 ± 3.1 3.09 ± 0.03#10 10 1 4 60 60 32.7 ± 0.6 1.21 ± 0.06#11 50 1 8 60 40 73.3 ± 1.2 1.94 ± 0.02#12 10 3 4 10 80 33.0 ± 2.0 1.20 ± 0.00#13 30 2 6 35 60 57.0 ± 1.0 1.54 ± 0.01
Each value represents the mean ± standard deviation (S.D.) (n = 3).
1146 Vol. 67, No. 10 (2019)Chem. Pharm. Bull.
As shown in the scatterplots of experimental versus predicted values (Fig. 1), their coefficients of determination adjusted by the degrees of freedom (adjusted R2) were very high: adjusted R2 for hardness and log(DT) were 0.97 and 0.99, respectively. This indicates that the changes in these tablet properties were well explained by the evaluated factors.
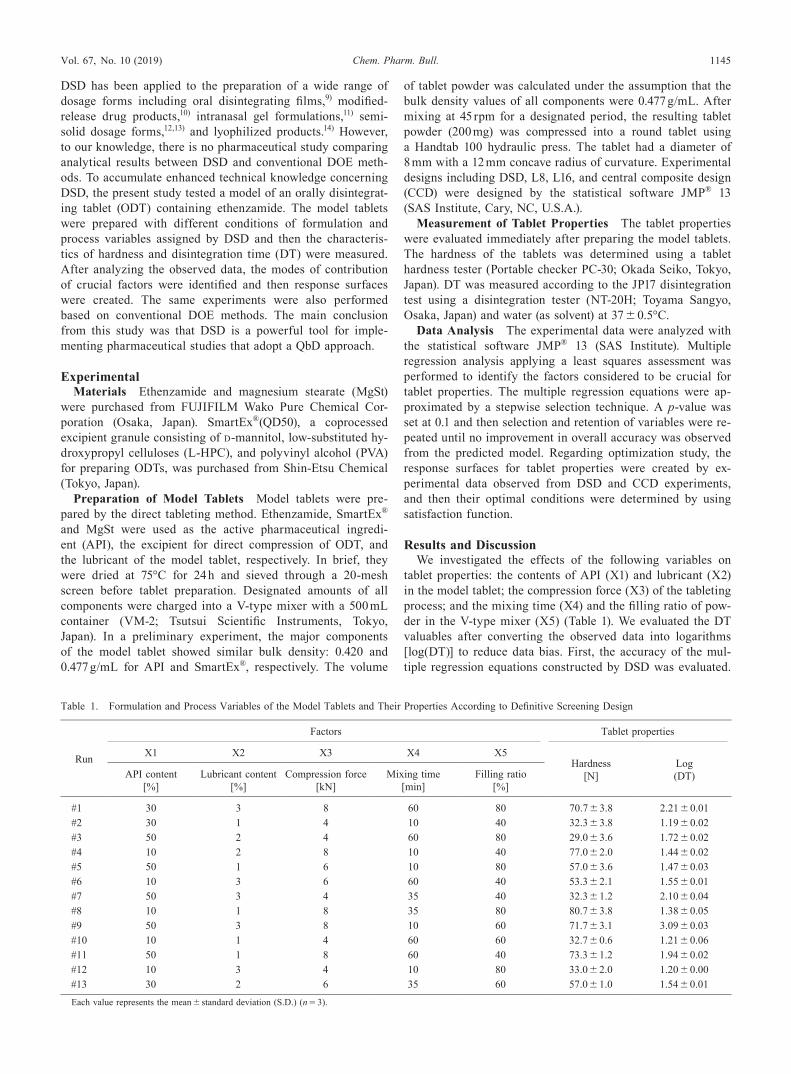
The mode of contribution of the factors to these properties was then assessed. For hardness, X3 showed a remarkable
positive effect (p < 0.0001) (Table 2). In addition, negative effects of X1, X2, and X4 were found to be slight but signifi-cant (p < 0.05). That is, tablets with higher hardness are as-sumed to be produced by higher compression force. Moreover, lower contents of API and lubricant and a shorter mixing time had a slight but significant effect on increase in the hardness. For log(DT), X1, X2, and X3 were shown to be significant factors with a strong positive effect (Table 3). As well as the
Fig. 1. Scatterplots of Experimental versus Predicted Values Modeled by DSDHardness (a) and log(DT) (b).
Table 2. Ranking of Contribution of Formulation and Process Factors to Hardness Analyzed by DOEs
RankDSD L8 L16
Factor t-Value p-Value Factor t-Value p-Value Factor t-Value p-Value
1 Compression force (X3) 37.5 <0.0001 Compression force (X3) 13.98 <0.0001 Compression force (X3) 32.39 <0.00012 Lubricant content (X2) −2.63 0.0128 API content (X1) −2.86 0.0099 API content (X1) −5.86 <0.00013 API content (X1) −2.34 0.0255 Lubricant content (X2) −2.42 0.0257 Lubricant content (X2) −4.95 <0.00014 Mixing time (X4) −2.1 0.0430 Mixing time (X4) −2.37 0.0285 X2*X3 −4.72 <0.00015 Mixing time (X4) −4.16 0.00026 X1*X3 −3.48 0.00147 X1*X2 −3.03 0.00468 X2*X4 2.63 0.01269 Filling ratio(X5) −2.23 0.0319
10 X1*X4 −2.01 0.052311 X3*X4 −2.01 0.052312 X4*X5 −1.9 0.0663
Table 3. Ranking of Contribution of Formulation and Process Factors to DT Analyzed by DOEs
RankDSD L8 L16
Factor t-Value p-Value Factor t-Value p-Value Factor t-Value p-Value
1 API content (X1) 32.28 <0.0001 API content (X1) 11.9 <0.0001 API content (X1) 40.62 <0.00012 Lubricant content (X2) 27.19 <0.0001 Compression force (X3) 7.96 <0.0001 Compression force (X3) 26.91 <0.00013 Compression force (X3) 24.18 <0.0001 Lubricant content (X2) 6.32 <0.0001 Lubricant content (X2) 25.5 <0.00014 X3*X3 15.64 <0.0001 X1*X2 9.86 <0.00015 X1*X4 −10.87 <0.0001 X1*X3 7.1 <0.00016 X5*X5 −9.13 <0.0001 Mixing time (X4) 6.25 <0.00017 Filling ratio (X5) −2.27 0.0304 X2*X3 3.47 0.00158 Mixing time (X4) 2.22 0.0344 X3*X4 −3.2 0.00309 X2*X5 −3.15 0.0035
10 Filling ratio (X5) −3.01 0.005011 X1*X4 2.79 0.008712 X4*X5 −2.61 0.013613 X1*X5 −2.15 0.038814 X3*X5 −1.85 0.0733
Vol. 67, No. 10 (2019) 1147Chem. Pharm. Bull.
main effect of the factors, the significant interaction between X1 and X4 was verified. Furthermore, quadratic effects of X3 and X5 (i.e., X3*X3 and X5*X5 shown in Table 3) were found; as noted, the capacity to evaluate the quadratic effects of factors is a great advantage of DSD compared with other screening methods such as L8 and L16. The DT of the model tablet tended to be prolonged with increasing contents of API and lubricant and higher compression force.The same screening study was also performed based on
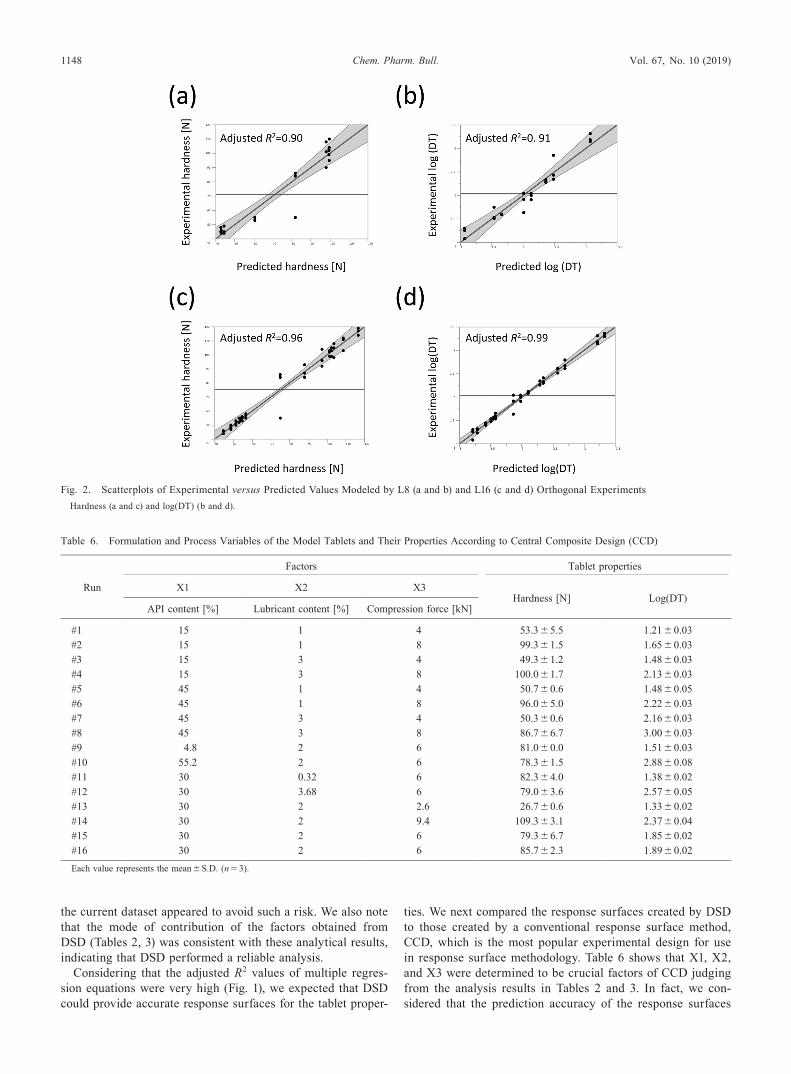
conventional L8 and L16 orthogonal array designs (Tables 4, 5). As this screening study evaluated five factors, the L8 ex-periment was used to examine only main effects, whereas the L16 experiment assessed both the main effects and their inter-actions. As is the case of the DSD experiment, the scatterplots of experimental versus predicted values for tablet properties were calculated by multiple regression equations (Fig. 2). The models correlated by the L16 experiment appeared to be more reliable than those by the L8 experiment; the L16 experiment showed 0.96 and 0.99 of adjusted R2 for hardness and log
(DT); in the L8 experiment, these values were 0.90 and 0.91. Undoubtedly, this is because the L16 orthogonal array design has a larger number of possible explanatory factors to model the properties compared with the L8 design (Tables 2, 3). The multiple regression equations created by the L16 experiment were composed of more than 10 significant factors including main effects and two-factor interactions, whereas those of the L8 experiment explained the changes in hardness and log(DT) by four (X1, X2, X3 and X4) and three significant factors (X1, X2, and X3). Except for the lower reliability of the multiple regression equations from the L8 experiment, the analysis results were similar to each other. Overall, the hardness of the model tablets was predominantly affected by compression force (Table 2). For log(DT), contents of API and lubricant and compression force were significant factors; their ranking of contribution to log(DT) did not change even though the experimental design was changed from L16 to L8 (Table 3). Although the L8 experiment involves the risk of misunder-standing the effects of some factors due to confounding bias,
Table 4. Formulation and Process Variables of the Model Tablets and Their Properties According to L8 Orthogonal Array Design
Run
Factors Tablet properties
X1 X2 X3 X4 X5Hardness
[N]Log (DT)API content
[%]Lubricant content
[%]Compression force
[kN]Mixing time
[min]Filling ratio
[%]
#1 10 1 4 10 80 53.7 ± 1.2 1.21 ± 0.12#2 10 1 8 60 40 70.0 ± 7.5 1.60 ± 0.01#3 10 3 4 60 40 46.0 ± 2.6 1.59 ± 0.13#4 10 3 8 10 80 101.3 ± 2.1 1.98 ± 0.07#5 50 1 4 60 80 44.7 ± 1.2 1.86 ± 0.21#6 50 1 8 10 40 99.7 ± 9.1 2.54 ± 0.27#7 50 3 4 10 40 46.0 ± 1.7 2.30 ± 0.03#8 50 3 8 60 80 75.0 ± 17.3 3.22 ± 0.09
Each value represents the mean ± S.D. (n = 3).
Table 5. Formulation and Process Variables of the Model Tablets and Their Properties According to L16 Orthogonal Array Design
Run
Factors Tablet properties
X1 X2 X3 X4 X5Hardness
[N]Log (DT)API content
[%]Lubricant content
[%]Compression force
[kN]Mixing time
[min]Filling ratio
[%]
#1 10 1 4 10 80 53.7 ± 1.2 1.21 ± 0.12#2 10 1 4 60 40 51.3 ± 1.5 1.28 ± 0.05#3 10 1 8 10 40 116.7 ± 2.5 1.54 ± 0.01#4 10 1 8 60 80 102.3 ± 3.1 1.57 ± 0.02#5 10 3 4 10 40 53.0 ± 1.7 1.42 ± 0.02#6 10 3 4 60 80 54.7 ± 1.5 1.50 ± 0.03#7 10 3 8 10 80 101.3 ± 2.1 1.98 ± 0.07#8 10 3 8 60 40 103.7 ± 5.1 2.10 ± 0.02#9 50 1 4 10 40 56.7 ± 1.5 1.58 ± 0.07
#10 50 1 4 60 80 44.7 ± 1.2 1.86 ± 0.21#11 50 1 8 10 80 108.7 ± 4.9 2.34 ± 0.06#12 50 1 8 60 40 97.3 ± 6.1 2.58 ± 0.06#13 50 3 4 10 80 48.7 ± 1.5 2.29 ± 0.05#14 50 3 4 60 40 48.7 ± 0.6 2.69 ± 0.09#15 50 3 8 10 40 88.0 ± 4.6 3.33 ± 0.03#16 50 3 8 60 80 75.0 ± 17.3 3.22 ± 0.09
Each value represents the mean ± S.D. (n = 3). Data #1, #7, #10 and #16 in the L16 orthogonal design are the same as those #1, #4, #5 and #8 in L8 orthogonal design (Table 4).
1148 Vol. 67, No. 10 (2019)Chem. Pharm. Bull.
the current dataset appeared to avoid such a risk. We also note that the mode of contribution of the factors obtained from DSD (Tables 2, 3) was consistent with these analytical results, indicating that DSD performed a reliable analysis.Considering that the adjusted R2 values of multiple regres-
sion equations were very high (Fig. 1), we expected that DSD could provide accurate response surfaces for the tablet proper-
ties. We next compared the response surfaces created by DSD to those created by a conventional response surface method, CCD, which is the most popular experimental design for use in response surface methodology. Table 6 shows that X1, X2, and X3 were determined to be crucial factors of CCD judging from the analysis results in Tables 2 and 3. In fact, we con-sidered that the prediction accuracy of the response surfaces
Fig. 2. Scatterplots of Experimental versus Predicted Values Modeled by L8 (a and b) and L16 (c and d) Orthogonal ExperimentsHardness (a and c) and log(DT) (b and d).
Table 6. Formulation and Process Variables of the Model Tablets and Their Properties According to Central Composite Design (CCD)
Run
Factors Tablet properties
X1 X2 X3Hardness [N] Log(DT)
API content [%] Lubricant content [%] Compression force [kN]
#1 15 1 4 53.3 ± 5.5 1.21 ± 0.03#2 15 1 8 99.3 ± 1.5 1.65 ± 0.03#3 15 3 4 49.3 ± 1.2 1.48 ± 0.03#4 15 3 8 100.0 ± 1.7 2.13 ± 0.03#5 45 1 4 50.7 ± 0.6 1.48 ± 0.05#6 45 1 8 96.0 ± 5.0 2.22 ± 0.03#7 45 3 4 50.3 ± 0.6 2.16 ± 0.03#8 45 3 8 86.7 ± 6.7 3.00 ± 0.03#9 4.8 2 6 81.0 ± 0.0 1.51 ± 0.03#10 55.2 2 6 78.3 ± 1.5 2.88 ± 0.08#11 30 0.32 6 82.3 ± 4.0 1.38 ± 0.02#12 30 3.68 6 79.0 ± 3.6 2.57 ± 0.05#13 30 2 2.6 26.7 ± 0.6 1.33 ± 0.02#14 30 2 9.4 109.3 ± 3.1 2.37 ± 0.04#15 30 2 6 79.3 ± 6.7 1.85 ± 0.02#16 30 2 6 85.7 ± 2.3 1.89 ± 0.02
Each value represents the mean ± S.D. (n = 3).
Vol. 67, No. 10 (2019) 1149Chem. Pharm. Bull.
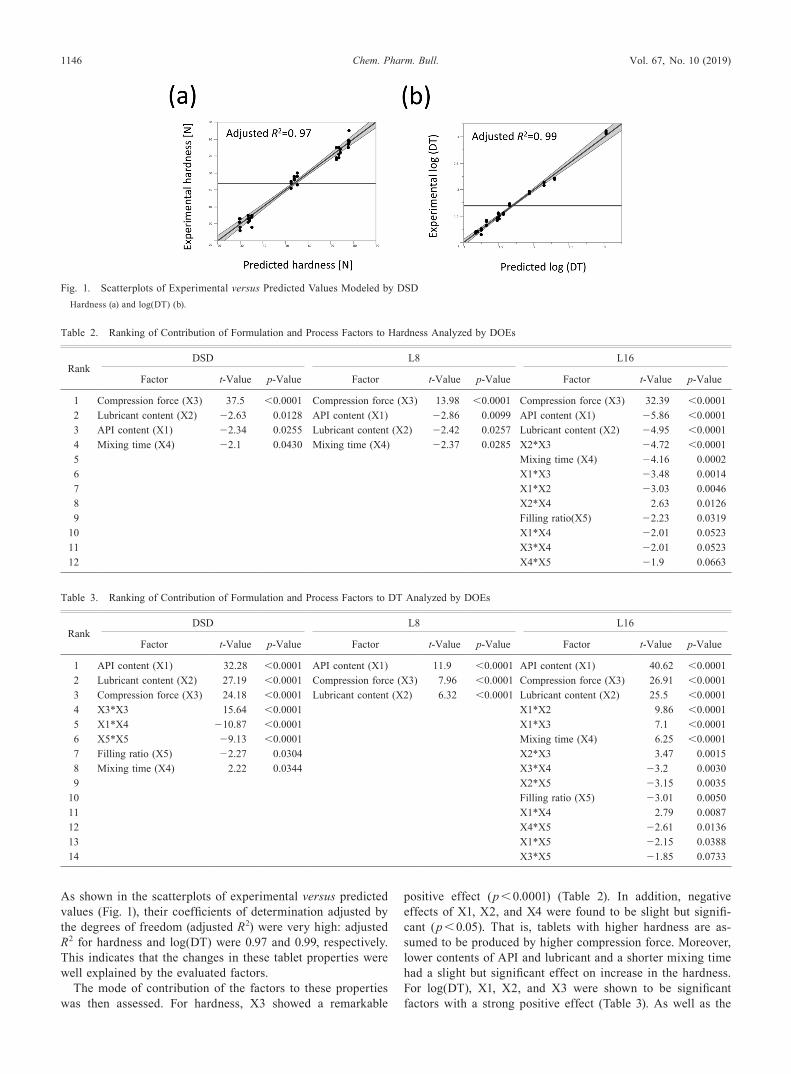
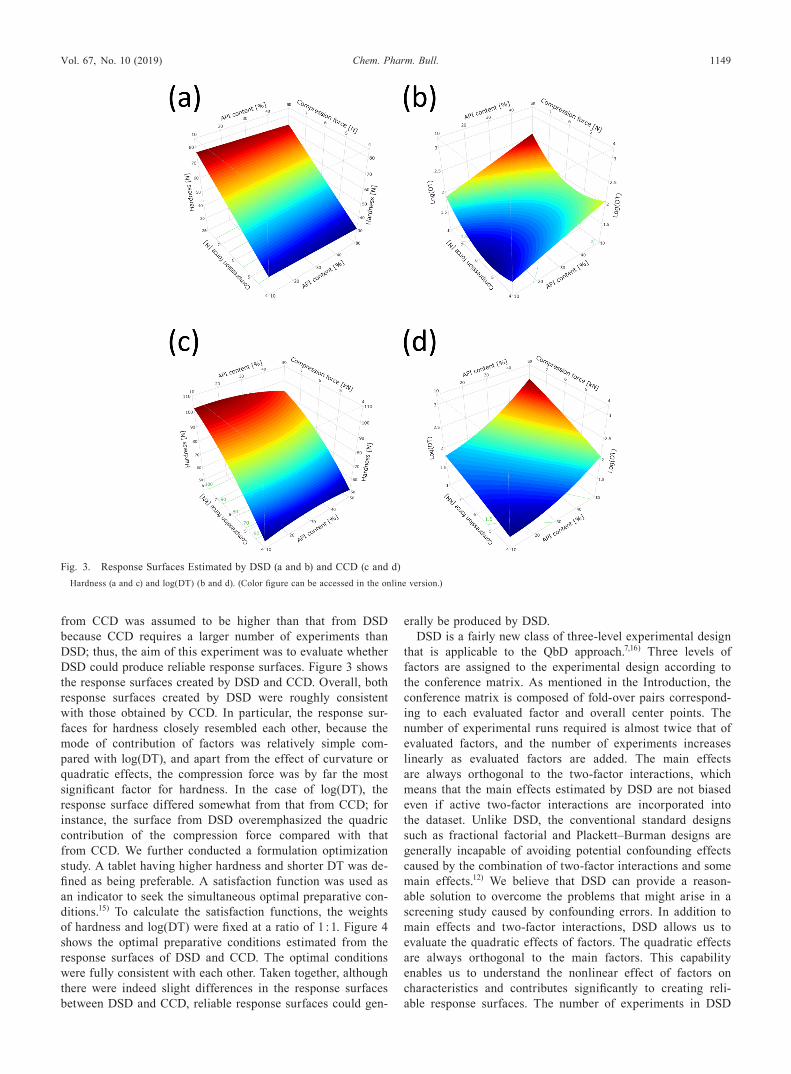
from CCD was assumed to be higher than that from DSD because CCD requires a larger number of experiments than DSD; thus, the aim of this experiment was to evaluate whether DSD could produce reliable response surfaces. Figure 3 shows the response surfaces created by DSD and CCD. Overall, both response surfaces created by DSD were roughly consistent with those obtained by CCD. In particular, the response sur-faces for hardness closely resembled each other, because the mode of contribution of factors was relatively simple com-pared with log(DT), and apart from the effect of curvature or quadratic effects, the compression force was by far the most significant factor for hardness. In the case of log(DT), the response surface differed somewhat from that from CCD; for instance, the surface from DSD overemphasized the quadric contribution of the compression force compared with that from CCD. We further conducted a formulation optimization study. A tablet having higher hardness and shorter DT was de-fined as being preferable. A satisfaction function was used as an indicator to seek the simultaneous optimal preparative con-ditions.15) To calculate the satisfaction functions, the weights of hardness and log(DT) were fixed at a ratio of 1 : 1. Figure 4 shows the optimal preparative conditions estimated from the response surfaces of DSD and CCD. The optimal conditions were fully consistent with each other. Taken together, although there were indeed slight differences in the response surfaces between DSD and CCD, reliable response surfaces could gen-
erally be produced by DSD.DSD is a fairly new class of three-level experimental design
that is applicable to the QbD approach.7,16) Three levels of factors are assigned to the experimental design according to the conference matrix. As mentioned in the Introduction, the conference matrix is composed of fold-over pairs correspond-ing to each evaluated factor and overall center points. The number of experimental runs required is almost twice that of evaluated factors, and the number of experiments increases linearly as evaluated factors are added. The main effects are always orthogonal to the two-factor interactions, which means that the main effects estimated by DSD are not biased even if active two-factor interactions are incorporated into the dataset. Unlike DSD, the conventional standard designs such as fractional factorial and Plackett–Burman designs are generally incapable of avoiding potential confounding effects caused by the combination of two-factor interactions and some main effects.12) We believe that DSD can provide a reason-able solution to overcome the problems that might arise in a screening study caused by confounding errors. In addition to main effects and two-factor interactions, DSD allows us to evaluate the quadratic effects of factors. The quadratic effects are always orthogonal to the main factors. This capability enables us to understand the nonlinear effect of factors on characteristics and contributes significantly to creating reli-able response surfaces. The number of experiments in DSD
Fig. 3. Response Surfaces Estimated by DSD (a and b) and CCD (c and d)Hardness (a and c) and log(DT) (b and d). (Color figure can be accessed in the online version.)

1150 Vol. 67, No. 10 (2019)Chem. Pharm. Bull.
is much smaller compared with conventional standard designs for use in response surface methodologies such as CCD and Box–Behnken design. For example, CCD requires at least 15, 25, 27, and 45 experiments to design a 3-, 4-, 5-, and 6-factor matrix, respectively. Regarding the disadvantages of DSD, the accuracy of analysis tends to decrease when the number of ac-tive effects is very large. This is because the concept of DSD is established under the sparsity-of-effects principle according to which most of the variation in the response is explained by a relatively small number of effects, regardless of the many factors to be evaluated. In general, for a k factor DSD matrix, if there are k active effects or more that include main effects, two-factor interactions, and quadratic effects, the analysis is likely to be problematic. Furthermore, two-factor interactions are partially confounded with other interactions and pure-quadratic effects.16) Overall, we believe that DSD has a great capacity to accomplish reliable screening and optimization studies in a single step with a small number of experiments.To date, a number of studies have applied DSD to their for-
mulations. The dosage forms that have been investigated are reported to be oral disintegrating films,9) cross-linked chitosan disc-modified drug release,10) intranasal transferosomal muco-adhesive gel formulation,11) and ointment formulation.12) In ad-dition to these, van Heugten and Vromans introduced DSD to scale up a study of semisolid dosage forms to understand the manufacturing processes using a QbD approach.13) Goldman et al. used DSD for optimization of a manufacturing process involving lyophilization for the manufacturing of monoclo-nal antibody drug products.14) The authors created response surfaces for the characteristics of primary drying time and primary drying product temperature, and established a design
space of lyophilization process parameters to satisfy the crite-ria.14) As well as in the pharmaceutical research field, DSD has also been used for the optimization of analytical parameters of mass spectrometry.17,18)However, a sizeable body of work on DSD, to our knowl-
edge, no pharmaceutical study has compared DSD with conventional DOE methods. Consequently, we compared the analytical results observed from DSD with those from com-mon DOE methods including L8 and L16 orthogonal array designs and CCD. We succeeded in characterizing the relative ability of DSD for use in pharmaceutical studies, and therefore our study offers valuable knowledge concerning DSD. As well as having sufficient capacity to screen crucial factors, we con-firmed that DSD was able to create reliable response surfaces for tablet characteristics. DSD could therefore be a promising tool for pharmaceutical studies adopting a QbD approach.
ConclusionThe present study provides enhanced technical knowledge
concerning DSD for use in pharmaceutical studies. DSD could construct accurate multiple regression equations between factors and tablet properties, and the effects of the evaluated factors were fully elucidated. As well as main effects, DSD found significant quadratic effects. Furthermore, the analysis results obtained from DSD were consistent with those from conventional methods (L8 and L16 orthogonal array designs). In addition, response surfaces for tablet properties were cre-ated by DSD, and then the optimal preparative condition for a desirable tablet were estimated. The optimal condition was consistent with that estimated from the conventional response surface method (CCD). Therefore, it was confirmed that DSD
Fig. 4. Optimization of Preparative Condition of the Model Tablet Using Response Surfaces Created by DSD and CCDBlue and red lines correspond with the contour lines of hardness and log(DT) estimated by their multiple regression equations. Higher hardness and shorter DT were re-
garded as being preferable characteristics in this study. The simultaneous optimal preparative conditions estimated were marked on the contour profiles as circles in pink. (Color figure can be accessed in the online version.)
Vol. 67, No. 10 (2019) 1151Chem. Pharm. Bull.
could produce relatively reliable response surfaces, even though the number of experiments was much smaller than for CCD. From these findings, the present study successfully characterized the usefulness of DSD for pharmaceutical stud-ies.
Acknowledgments The authors thank Mr. Naohiro Masu-kawa, SAS Institute Japan Ltd. for his solid technical support.
Conflict of Interest The authors declare that they have no financial or competing interests concerning this manuscript. The Department of Pharmaceutical Technology, University of Toyama is an endowed department, supported by an un-restricted Grant from Nichi-Iko Pharmaceutical Co., Ltd. (Toyama, Japan).
References and Notes 1) Yu L. X., Amidon G., Khan M. A., Hoag S. W., Polli J., Raju G. K.,
Woodcock J., AAPS J., 16, 771–783 (2014). 2) Yu L. X., Pharm. Res., 25, 781–791 (2008). 3) International Conference on Harmonization of Technical Require-
ments for Registration of Pharmaceuticals for Human Use, Pharma-ceutical Development-Q8 (R2).
4) Onuki Y., Hoshi M., Okabe H., Fujikawa M., Morishita M., Takaya-ma K., J. Control. Release, 108, 331–340 (2005).
5) Onuki Y., Hasegawa N., Kida C., Obata Y., Takayama K., J. Pharm. Sci., 103, 3532–3541 (2014).
6) Georgiou S. D., Stylianou S., Aggarwal M., Statistics, 48, 815–833 (2014).
7) Jones B., Nachtsheim C. J., J. Qual. Technol., 43, 1–15 (2011). 8) Jones B., Nachtsheim C. J., J. Qual. Technol., 45, 121–129 (2013). 9) Mazumder S., Pavurala N., Manda P., Xu X., Cruz C. N., Krish-
naiah Y. S. R., Int. J. Pharm., 527, 151–160 (2017).10) Gabbay R. S., Kenett R. S., Scaffaro R., Rubinstein A., Eur. J.
Pharm. Sci., 125, 102–109 (2018).11) Salem H. F., Kharshoum R. M., Abou-Taleb H. A., Naguib D. M.,
AAPS PharmSciTech, 20, 181 (2019).12) Dong Y., Qu H., Pavurala N., Wang J., Sekar V., Martinez M.
N., Fahmy R., Ashraf M., Cruz C. N., Xu X., Int. J. Pharm., 544, 254–264 (2018).
13) van Heugten A. J. P., Vromans H., AAPS PharmSciTech, 19, 2330–2334 (2018).
14) Goldman J. M., More H. T., Yee O., Borgeson E., Remy B., Rowe J., Sadineni V., J. Pharm. Sci., 107, 2592–2600 (2018).
15) Derringer G., Suich R., J. Qual. Technol., 12, 214–219 (1980).16) SAS Institute, “JMP12 Design of Experiments Guide,” Cary, NC,
U.S.A., 2015.17) Hecht E. S., McCord J. P., Muddiman D. C., Anal. Chem., 87,
7305–7312 (2015).18) Aburaya S., Aoki W., Minakuchi H., Ueda M., Bioscience, 81,
2237–2243 (2017).


![[Our Redemption] Doctrines of Grace: Definitive Atonement](https://img.pdfslide.net/doc/110x75/61934b65b86f4e773a2b24f5/our-redemption-doctrines-of-grace-denitive-atonement.jpg)