Embed Size (px)
Citation preview
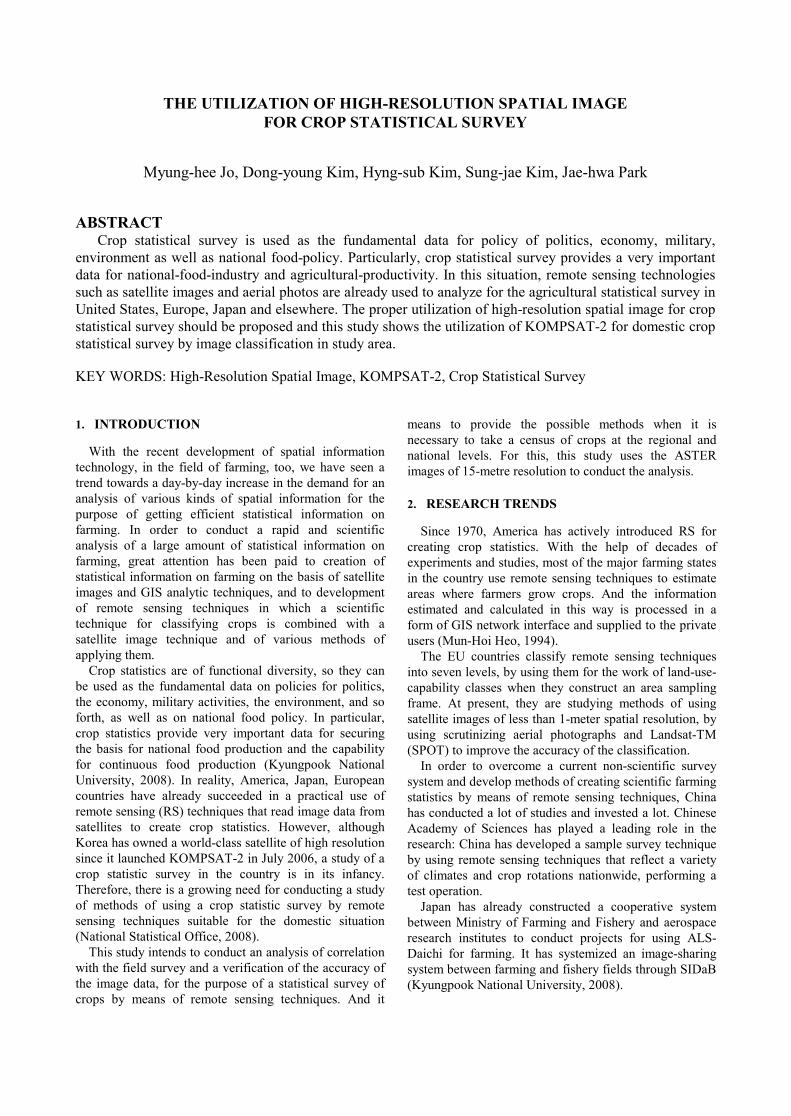
THE UTILIZATION OF HIGH-RESOLUTION SPATIAL IMAGE FOR CROP STATISTICAL SURVEY
Myung-hee Jo, Dong-young Kim, Hyng-sub Kim, Sung-jae Kim, Jae-hwa Park ABSTRACT
Crop statistical survey is used as the fundamental data for policy of politics, economy, military, environment as well as national food-policy. Particularly, crop statistical survey provides a very important data for national-food-industry and agricultural-productivity. In this situation, remote sensing technologies such as satellite images and aerial photos are already used to analyze for the agricultural statistical survey in United States, Europe, Japan and elsewhere. The proper utilization of high-resolution spatial image for crop statistical survey should be proposed and this study shows the utilization of KOMPSAT-2 for domestic crop statistical survey by image classification in study area. KEY WORDS: High-Resolution Spatial Image, KOMPSAT-2, Crop Statistical Survey 1. INTRODUCTION
With the recent development of spatial information technology, in the field of farming, too, we have seen a trend towards a day-by-day increase in the demand for an analysis of various kinds of spatial information for the purpose of getting efficient statistical information on farming. In order to conduct a rapid and scientific analysis of a large amount of statistical information on farming, great attention has been paid to creation of statistical information on farming on the basis of satellite images and GIS analytic techniques, and to development of remote sensing techniques in which a scientific technique for classifying crops is combined with a satellite image technique and of various methods of applying them.
Crop statistics are of functional diversity, so they can be used as the fundamental data on policies for politics, the economy, military activities, the environment, and so forth, as well as on national food policy. In particular, crop statistics provide very important data for securing the basis for national food production and the capability for continuous food production (Kyungpook National University, 2008). In reality, America, Japan, European countries have already succeeded in a practical use of remote sensing (RS) techniques that read image data from satellites to create crop statistics. However, although Korea has owned a world-class satellite of high resolution since it launched KOMPSAT-2 in July 2006, a study of a crop statistic survey in the country is in its infancy. Therefore, there is a growing need for conducting a study of methods of using a crop statistic survey by remote sensing techniques suitable for the domestic situation (National Statistical Office, 2008).
This study intends to conduct an analysis of correlation with the field survey and a verification of the accuracy of the image data, for the purpose of a statistical survey of crops by means of remote sensing techniques. And it
means to provide the possible methods when it is necessary to take a census of crops at the regional and national levels. For this, this study uses the ASTER images of 15-metre resolution to conduct the analysis.
2. RESEARCH TRENDS
Since 1970, America has actively introduced RS for creating crop statistics. With the help of decades of experiments and studies, most of the major farming states in the country use remote sensing techniques to estimate areas where farmers grow crops. And the information estimated and calculated in this way is processed in a form of GIS network interface and supplied to the private users (Mun-Hoi Heo, 1994).
The EU countries classify remote sensing techniques into seven levels, by using them for the work of land-use-capability classes when they construct an area sampling frame. At present, they are studying methods of using satellite images of less than 1-meter spatial resolution, by using scrutinizing aerial photographs and Landsat-TM (SPOT) to improve the accuracy of the classification.
In order to overcome a current non-scientific survey system and develop methods of creating scientific farming statistics by means of remote sensing techniques, China has conducted a lot of studies and invested a lot. Chinese Academy of Sciences has played a leading role in the research: China has developed a sample survey technique by using remote sensing techniques that reflect a variety of climates and crop rotations nationwide, performing a test operation.
Japan has already constructed a cooperative system between Ministry of Farming and Fishery and aerospace research institutes to conduct projects for using ALS-Daichi for farming. It has systemized an image-sharing system between farming and fishery fields through SIDaB (Kyungpook National University, 2008).

3. STUDY METHOD
3.1 Study Area
This study chooses Changwon City, Gyengsangnam-do, as a study area. The region has wide and flat hill-like mountains lower than 500 meters in height, except Bulmosan Mountain areas including Bulmosan Mountain (802 meters), Jeongbeongsan Mountain (567 meters) and Jangbogsan Mountain (582 meters). In the hill-like mountains dotted are small-size erosion basins. But the northeast areas on the Nakdonggang River have wide alluvial plains, which form a storehouse of crops for Gyeongsangnam-do.
The area of the city streets of Changwon Industrial Complex, adjacent to or facing Masanman Bay and Jinhaeman Bay, has a comparatively large amount of rainfall and a warm temperate climate, but its inland area has an abundance of erosion basins, which causes a big difference in annual temperature, a characteristic of continental climate. Its annual average temperature is 12.9℃ and its annual average rainfall reaches 1,577mm. The vegetation is a mixture of temperate board-leaf forests and evergreen coniferous forests.
Figure 1. Study Area 3.2 Data Collection
This study collects not only Changwon City’s satellite images of Aster (spatial resolution 15m) and the forest type map of Changwon City, but also the data on the grown crops in 2009 for the purpose of an analysis of correlation and the verification.
Figure 2. Data Collection
4. CLASSIFICATION AND MODELING METHOD
4.1 Analysis Process
The analysis process of satellite images is that the Aster of 15-meter resolution is used to conduct an unsupervised classification and a supervised classification. And it verifies the accuracy by a comparative analysis of the data on the grown crops.
This study uses the satellite images of ASTER (Spatial resolution 15m). The ASTER on the following Table has 14 bands and 15-meter resolution.
Table 1. Dimension of ASTER Instrument VNIR SWIR TIR
Bands 1-3 4-9 10-14 Spatial Resolution 15m 60m 90m
Swath Width 60km 60km 60km Cross Track Pointing ±318km ±116km ±116km Quantization (bits) 8 8 12
Figure 3. Analysis Process
4.2 Classification of ASTER
In case of ASTER images, the factor, coefficient, that is suitable in the characteristics of wave bands by bands, is applied as a conversion factor of the existing TCT model.

Figure 4. TCT of ASTER
The supervised classification is a method of inputting a spectral reflection pattern of information representative of the class in question in each class that will have to, in advance, be classified in the image-analyzing software before classifying images (Hyoung-Sub Kim, 2009).
This study uses the study area’s maximum likelihood classification (MLC). The classes are defined as paddy field, field, water system, forest, and others to conduct the classification.
Figure 5. Supervised Classification of ASTER
This study draws up a classification map through
majority with the segmentation and the classified result. The classified classes are divided into paddy field, field,
water system, forest, and others, to conduct the classification, and calculate the area of each class.
Figure 6. Majority of ASTER
4.3 Comparison and Verification
This study conducts the evaluation of accuracy by using the Kappa analysis of the classified values and field survey values, which reveals that the accuracy of paddy
field producers is 96%; that of the users is 90%; that of field producers is 95%; that of the users is 87%; the whole accuracy is 88%; Khat is 79%.
Table 2. Comparison and Verification
5. CONCLUSIONS
This study chooses Changwon City, Gyengsangnam-do
as a study area. And it collects not only the satellite images of ASTER (spatial resolution 15m) and the forest type map of Changwon City, but also the data on the grown crops in 2009 for the purpose of an analysis of the correlation and verification.
Although the morphological features of farming use are various, the use of peculiar NIT showing the vegetation makes it possible to discern farmland.
Firstly, the sub-classified items by farmlands are divided into paddy field, field, water system, forest and others. And the ASTER images taken in September 2009, a season of autumn, are used for classifying farmland, based on a supervised classification.
Secondly, for the purpose of evaluating the efficiency of calculation of farmland areas, the false colour image-based maximum likelihood classification is applied to conduct the classification. For the purpose of evaluating classification accuracy, the error matrix evaluation method is used to calculate the user’s accuracy and the producer’s accuracy.
Thirdly, for the purpose of evaluating the efficiency of calculation of farmland areas, the TCT image-based maximum likelihood classification is applied to conduct the classification. For the purpose of evaluating the classification accuracy, the error matrix evaluation method is used to calculate the user’s accuracy and producer’s accuracy.
Fourthly, the comparison between the data by KOSIS and the real areas reveals that paddy field is 96% (KOSIS: 3799ha/classification value: 3959ha); field is 36% (KOSIS: 2588ha/ classification value: 918ha). It is judged that the reason that there is the low ratio in field is that the ASTER image includes the fields of persimmon trees in the forests.
And because it is uncertain to detect farming lanes in conducting the classification, it is necessary to do work of

additional correction in calculating the areas. As seen above, it is judged that if the accuracy of the ASTER image-based classification is finally conducted and the efficiency of the survey of farmland areas is examined and more complemented, it is possible to use satellite images to classify farmland.
In the future, this study will go forward to see whether it is possible to read and decipher by comparing the efficiencies by satellite images such as SPOT-5, Rapideye, Quickbird, Geoeye, and aerial photographs. REFERENCE
• Kyungpook National University, The Utilization of Remote Sening for agricural statistical, 2008.
• Hyoung-Sub Kim, A Study on Constructing Web GIS based FRIMS (Forest Resource Information Management System), Graduate School, Kyungil University, 2009.
• Mun-Hoi Heo, Eui-Seop Pi, Do-Han Lee, Seok-Hyeong Lee, Selection of agricultural income crops cultivation suit-land using GIS, The Journal of GIS Association of Korea, Vol.2, No.1, pp.75-83, April 1994.
• National Statistical Office, Establishment of Information Strategy Planning (ISP) for agricultural area survey system using remote sensing technology), 2009.