Embed Size (px)
DESCRIPTION
by Dan Haight
Citation preview
The Value of a Draft Pick
April, 2012
Using data, math, and reasoning to gain a competitive edge.
Bill James: “The search for objective knowledge about [hockey]”
What is analytics?
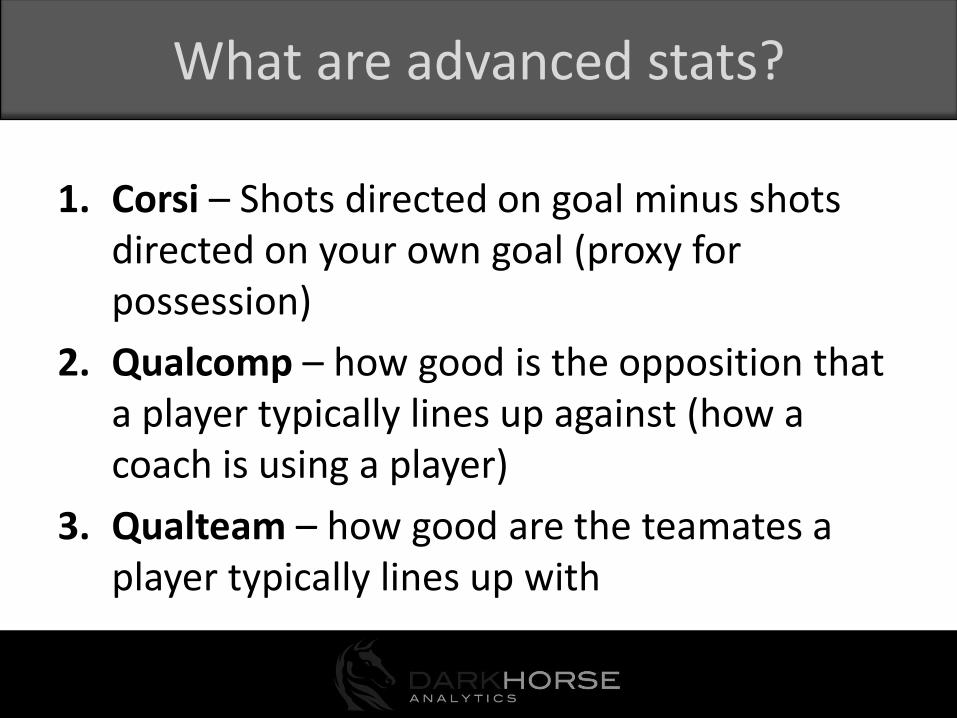
1. Corsi – Shots directed on goal minus shots directed on your own goal (proxy for possession)
2. Qualcomp – how good is the opposition that a player typically lines up against (how a coach is using a player)
3. Qualteam – how good are the teamates a player typically lines up with
What are advanced stats?
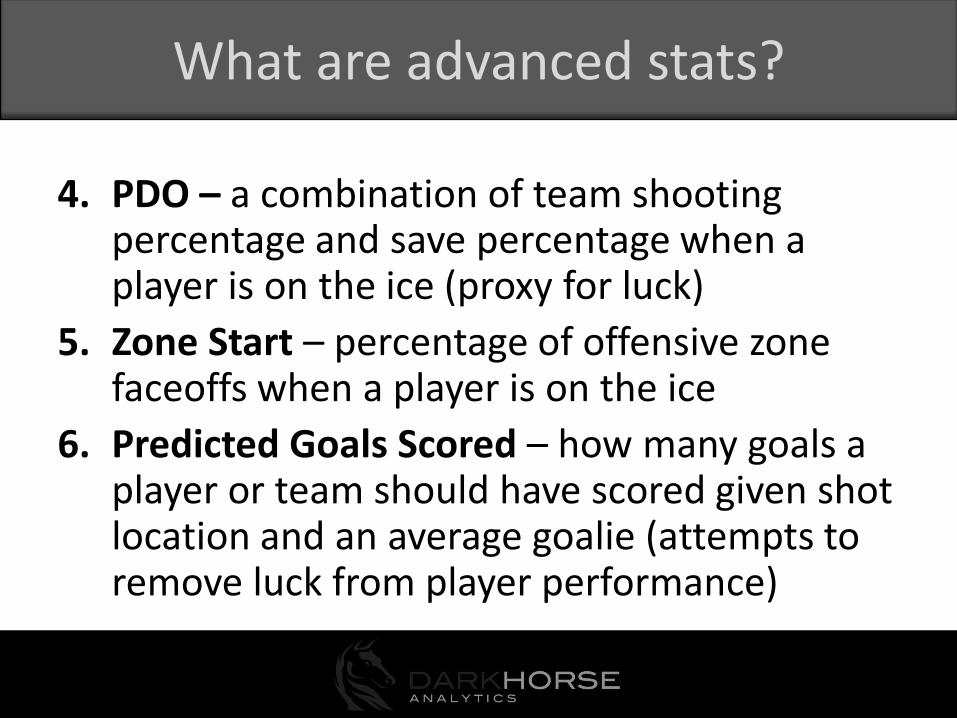
4. PDO – a combination of team shooting percentage and save percentage when a player is on the ice (proxy for luck)
5. Zone Start – percentage of offensive zone faceoffs when a player is on the ice
6. Predicted Goals Scored – how many goals a player or team should have scored given shot location and an average goalie (attempts to remove luck from player performance)
What are advanced stats?
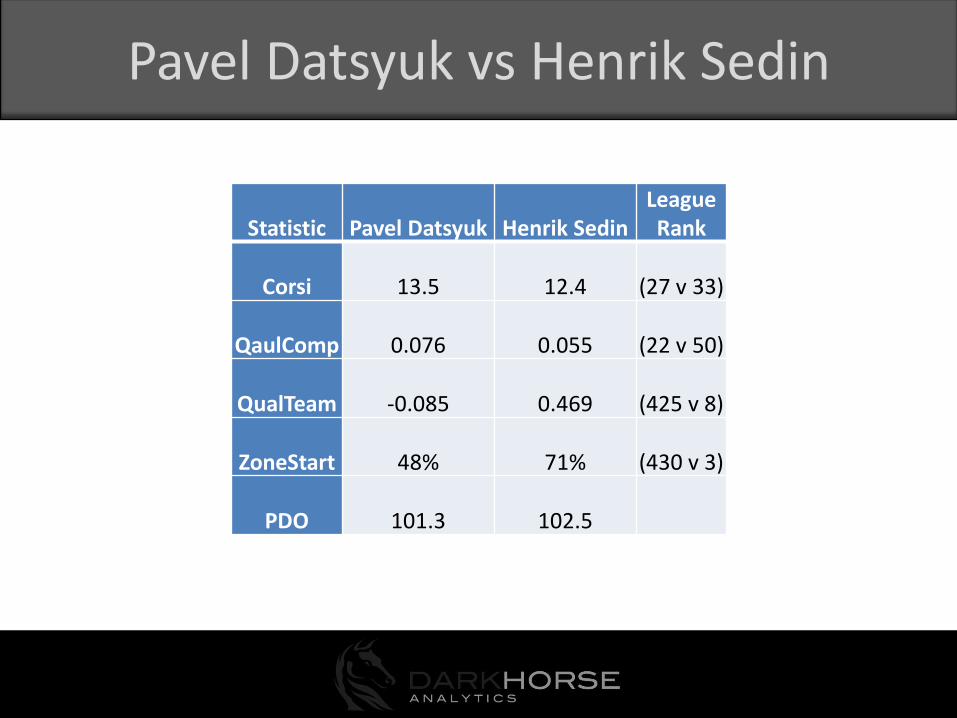
Pavel Datsyuk vs Henrik Sedin
Statistic Pavel Datsyuk Henrik SedinLeagueRank
Corsi 13.5 12.4 (27 v 33)
QaulComp 0.076 0.055 (22 v 50)
QualTeam -0.085 0.469 (425 v 8)
ZoneStart 48% 71% (430 v 3)
PDO 101.3 102.5
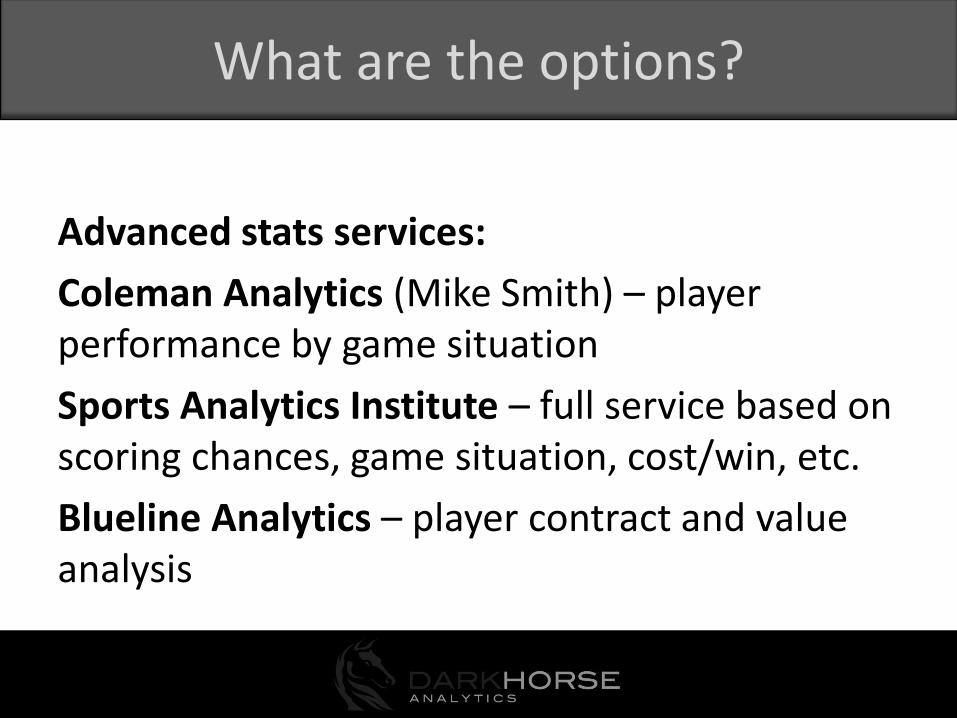
What are the options?
Advanced stats services:
Coleman Analytics (Mike Smith) – player performance by game situation
Sports Analytics Institute – full service based on scoring chances, game situation, cost/win, etc.
Blueline Analytics – player contract and value analysis
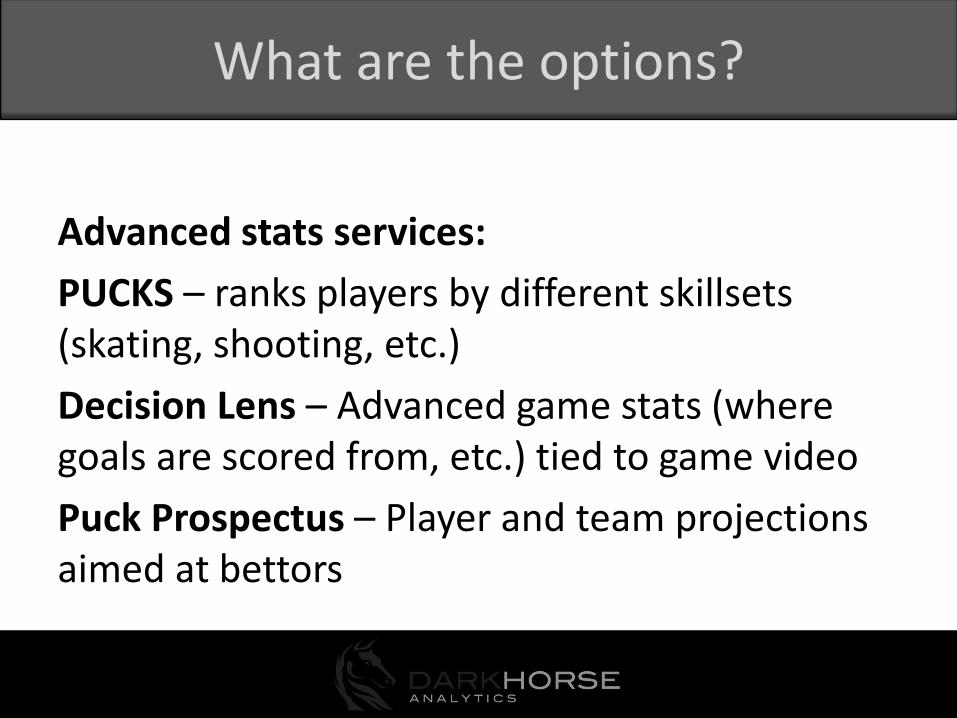
What are the options?
Advanced stats services:
PUCKS – ranks players by different skillsets (skating, shooting, etc.)
Decision Lens – Advanced game stats (where goals are scored from, etc.) tied to game video
Puck Prospectus – Player and team projections aimed at bettors
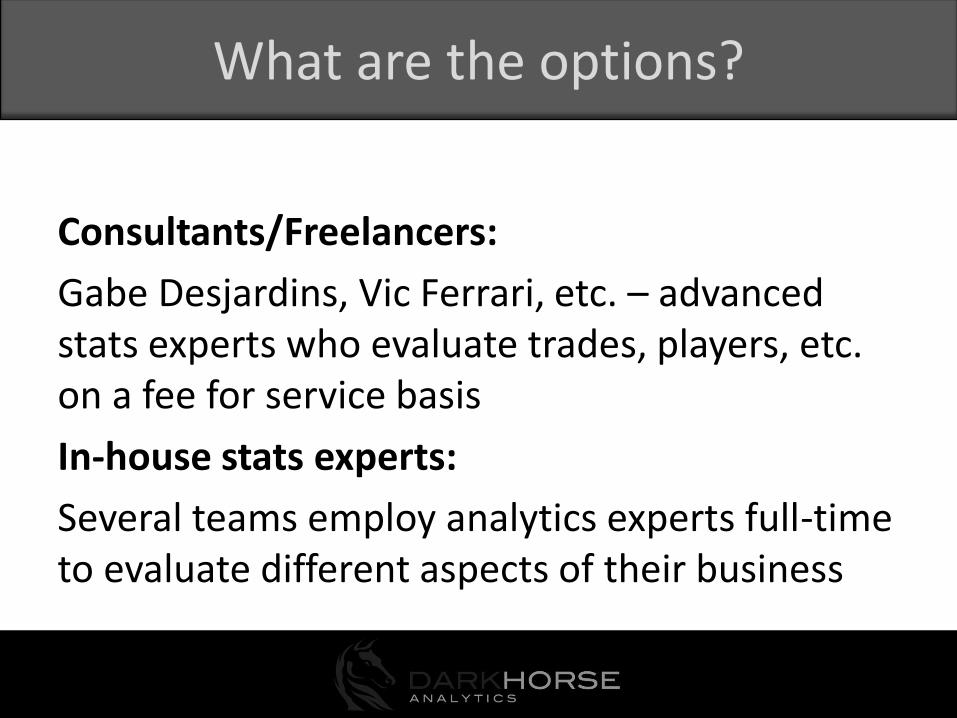
What are the options?
Consultants/Freelancers:
Gabe Desjardins, Vic Ferrari, etc. – advanced stats experts who evaluate trades, players, etc. on a fee for service basis
In-house stats experts:
Several teams employ analytics experts full-time to evaluate different aspects of their business
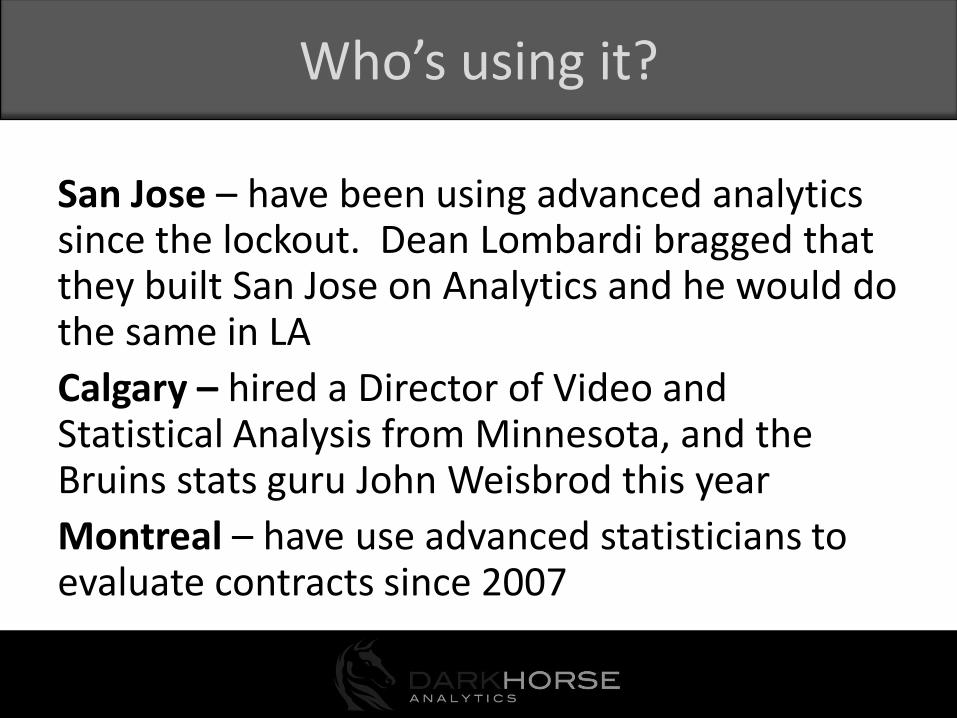
San Jose – have been using advanced analytics since the lockout. Dean Lombardi bragged that they built San Jose on Analytics and he would do the same in LA
Calgary – hired a Director of Video and Statistical Analysis from Minnesota, and the Bruins stats guru John Weisbrod this year
Montreal – have use advanced statisticians to evaluate contracts since 2007
Who’s using it?
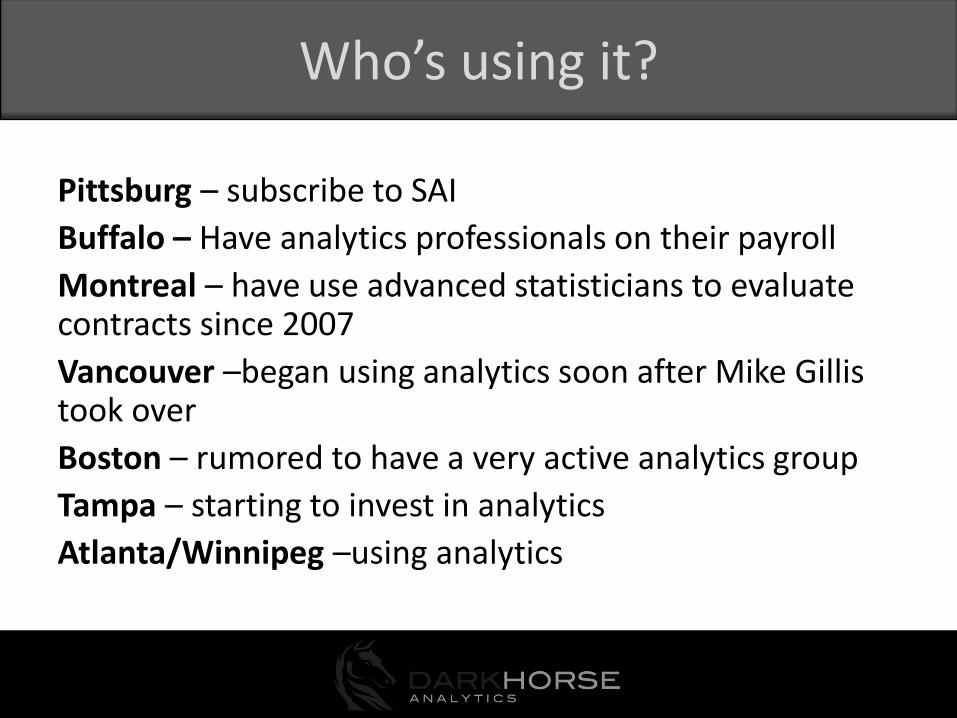
Pittsburg – subscribe to SAI
Buffalo – Have analytics professionals on their payroll
Montreal – have use advanced statisticians to evaluate contracts since 2007
Vancouver –began using analytics soon after Mike Gillis took over
Boston – rumored to have a very active analytics group
Tampa – starting to invest in analytics
Atlanta/Winnipeg –using analytics
Who’s using it?
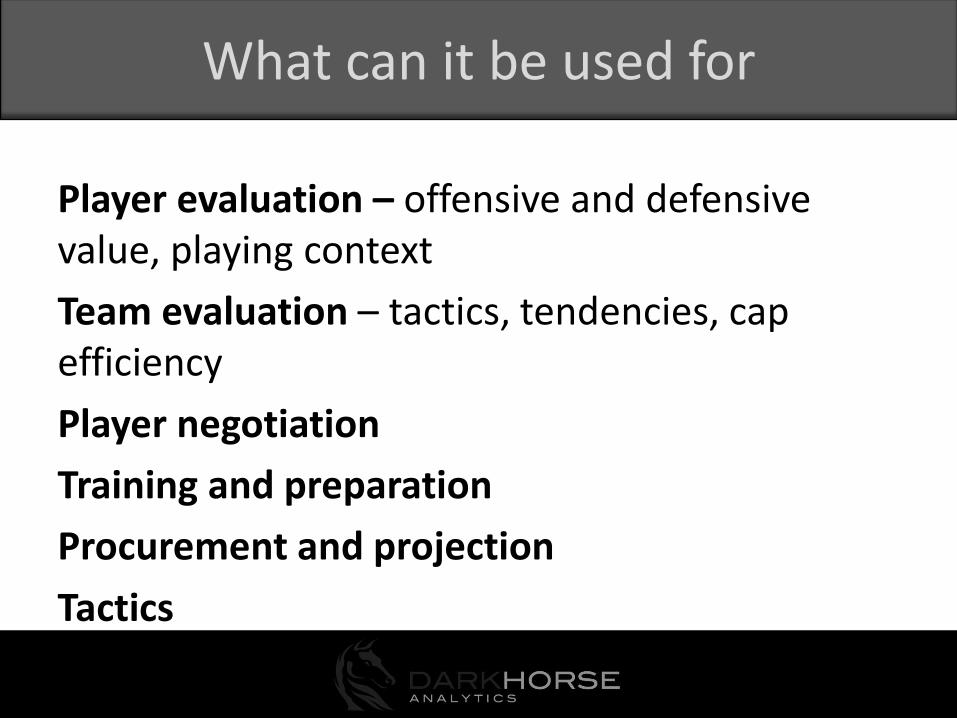
Player evaluation – offensive and defensive value, playing context
Team evaluation – tactics, tendencies, cap efficiency
Player negotiation
Training and preparation
Procurement and projection
Tactics
What can it be used for
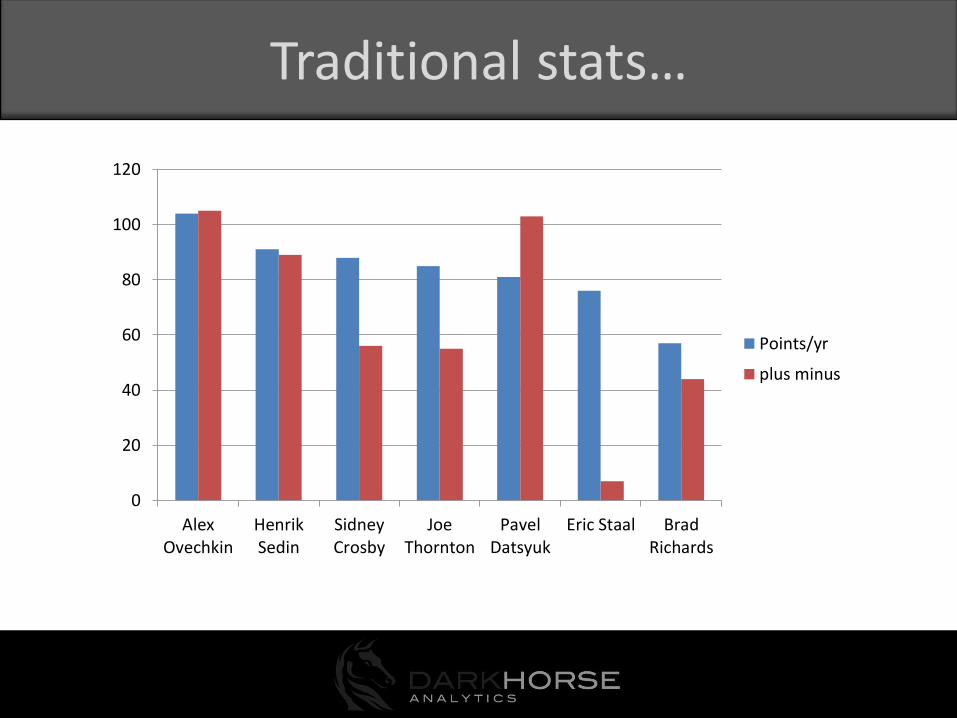
Traditional stats…
0
20
40
60
80
100
120
AlexOvechkin
HenrikSedin
SidneyCrosby
JoeThornton
PavelDatsyuk
Eric Staal BradRichards
Points/yr
plus minus
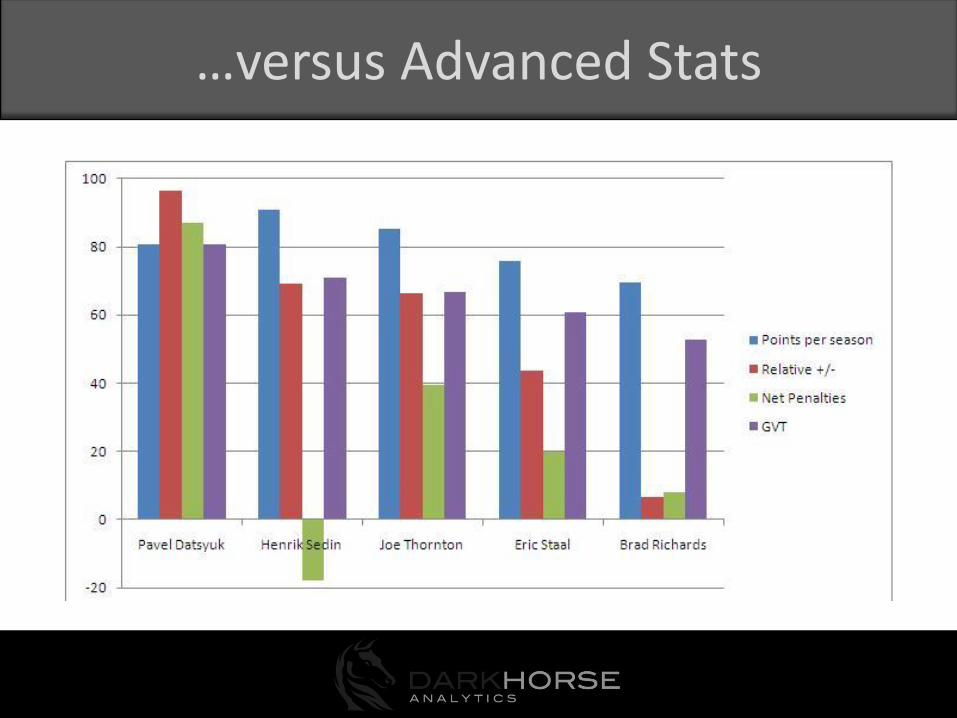
…versus Advanced Stats
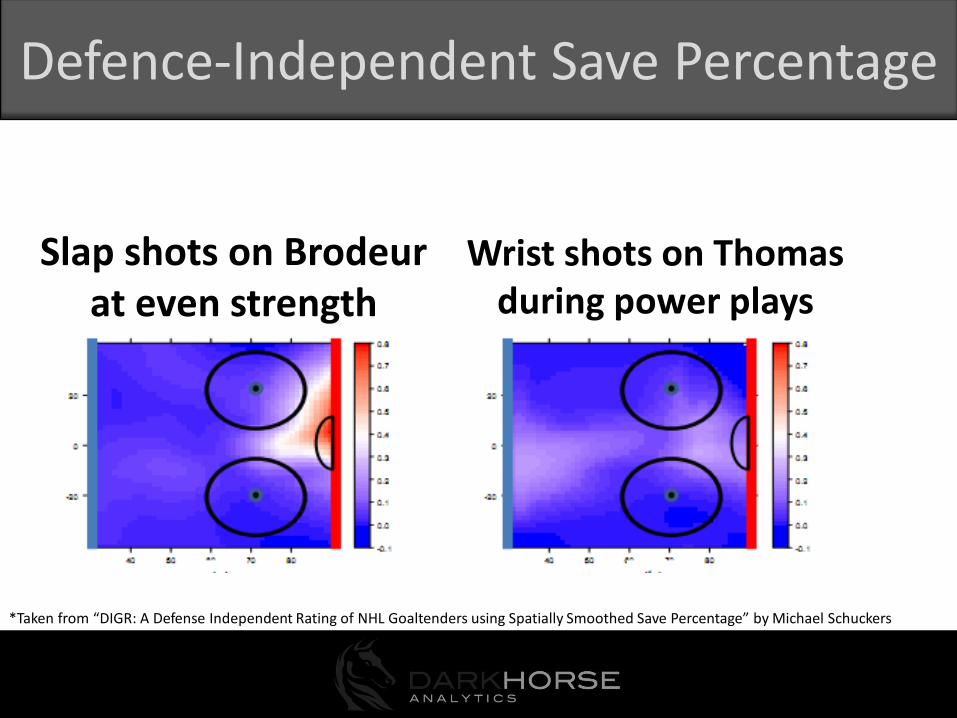
Defence-Independent Save Percentage
Slap shots on Brodeurat even strength
Wrist shots on Thomas during power plays
*Taken from “DIGR: A Defense Independent Rating of NHL Goaltenders using Spatially Smoothed Save Percentage” by Michael Schuckers
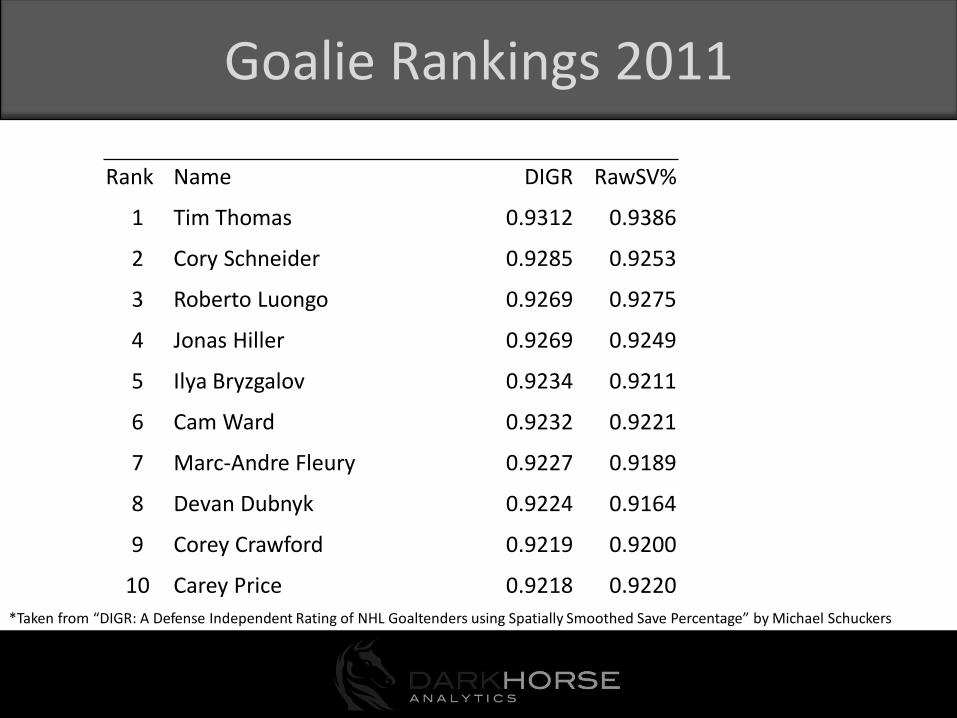
Goalie Rankings 2011
*Taken from “DIGR: A Defense Independent Rating of NHL Goaltenders using Spatially Smoothed Save Percentage” by Michael Schuckers
Rank Name DIGR RawSV%
1 Tim Thomas 0.9312 0.9386
2 Cory Schneider 0.9285 0.9253
3 Roberto Luongo 0.9269 0.9275
4 Jonas Hiller 0.9269 0.9249
5 Ilya Bryzgalov 0.9234 0.9211
6 Cam Ward 0.9232 0.9221
7 Marc-Andre Fleury 0.9227 0.9189
8 Devan Dubnyk 0.9224 0.9164
9 Corey Crawford 0.9219 0.9200
10 Carey Price 0.9218 0.9220
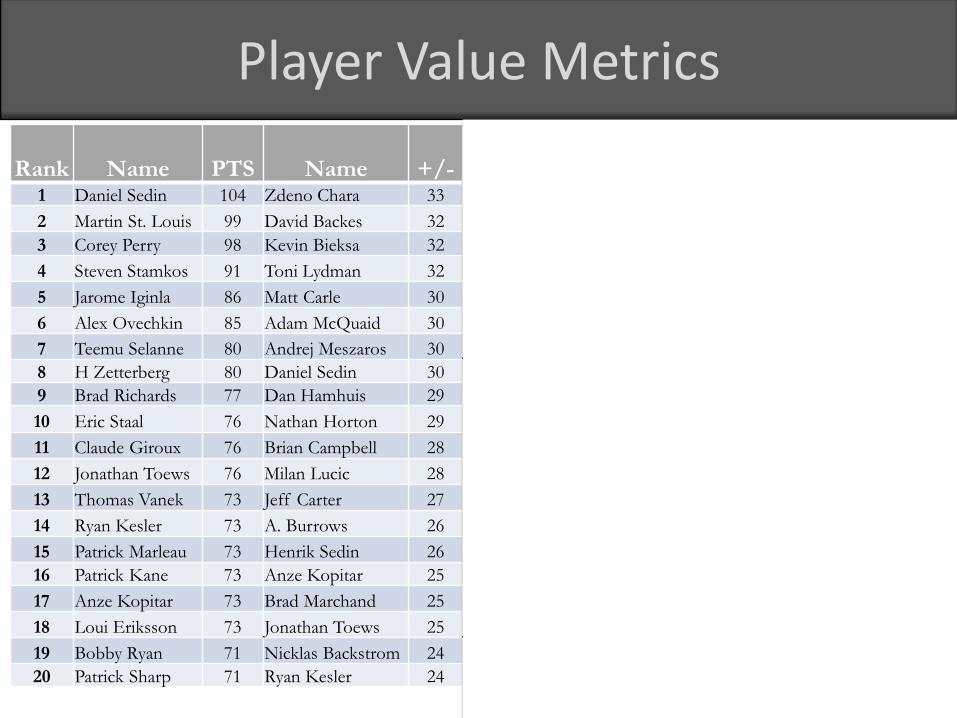
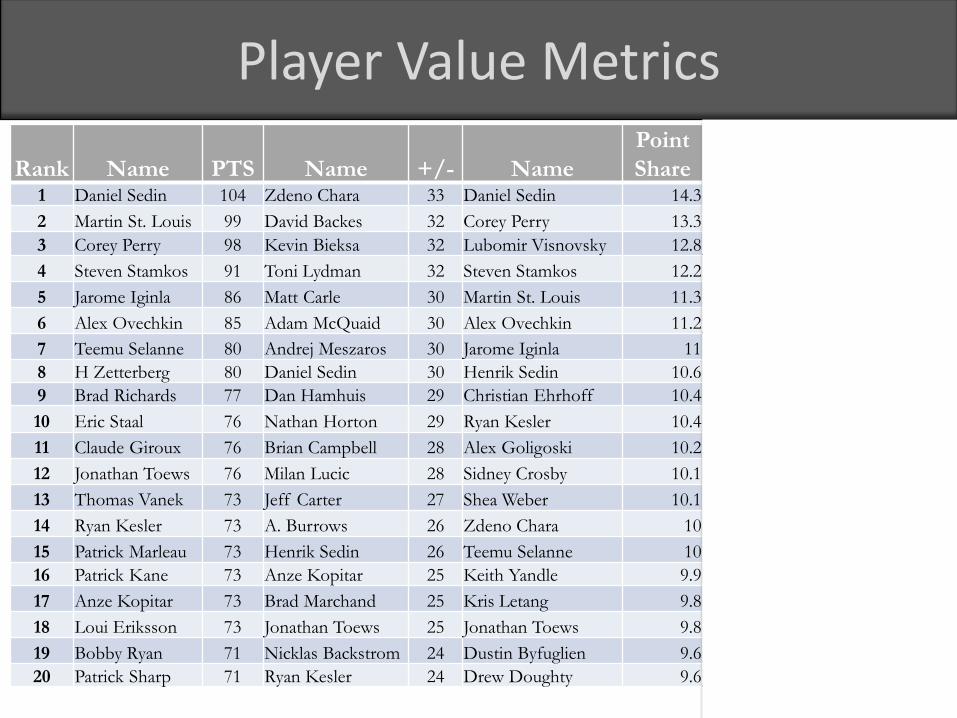
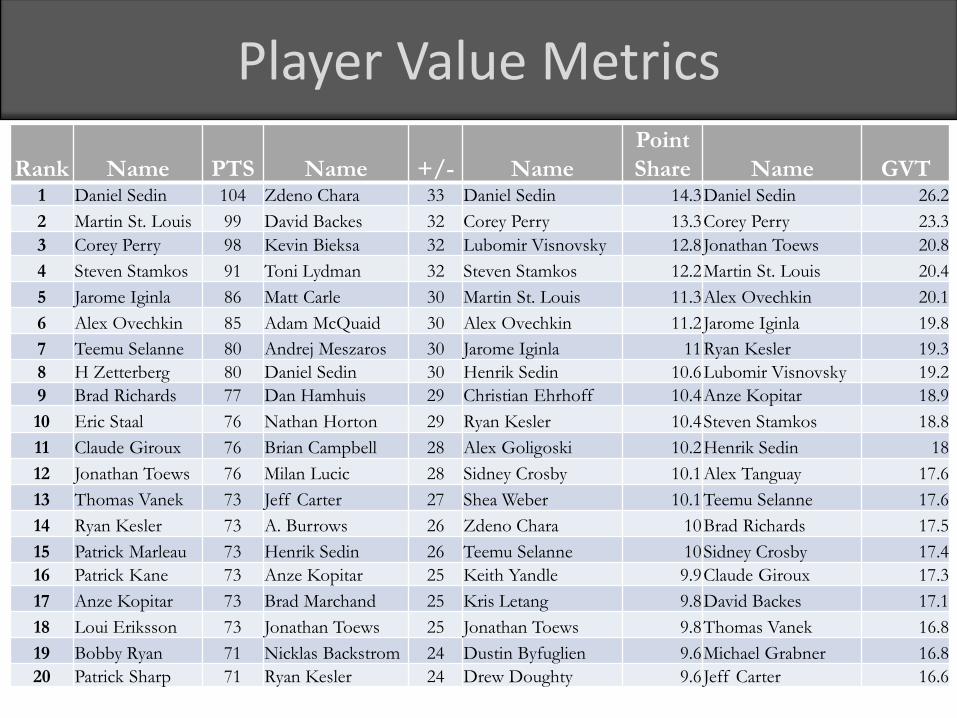
Player Value Metrics
Rank Name PTS Name +/- Name
Point
Share Name GVT1 Daniel Sedin 104 Zdeno Chara 33 Daniel Sedin 14.3Daniel Sedin 26.2
2 Martin St. Louis 99 David Backes 32 Corey Perry 13.3Corey Perry 23.3
3 Corey Perry 98 Kevin Bieksa 32 Lubomir Visnovsky 12.8Jonathan Toews 20.8
4 Steven Stamkos 91 Toni Lydman 32 Steven Stamkos 12.2Martin St. Louis 20.4
5 Jarome Iginla 86 Matt Carle 30 Martin St. Louis 11.3Alex Ovechkin 20.1
6 Alex Ovechkin 85 Adam McQuaid 30 Alex Ovechkin 11.2Jarome Iginla 19.8
7 Teemu Selanne 80 Andrej Meszaros 30 Jarome Iginla 11Ryan Kesler 19.3
8 H Zetterberg 80 Daniel Sedin 30 Henrik Sedin 10.6Lubomir Visnovsky 19.2
9 Brad Richards 77 Dan Hamhuis 29 Christian Ehrhoff 10.4Anze Kopitar 18.9
10 Eric Staal 76 Nathan Horton 29 Ryan Kesler 10.4Steven Stamkos 18.8
11 Claude Giroux 76 Brian Campbell 28 Alex Goligoski 10.2Henrik Sedin 18
12 Jonathan Toews 76 Milan Lucic 28 Sidney Crosby 10.1Alex Tanguay 17.6
13 Thomas Vanek 73 Jeff Carter 27 Shea Weber 10.1Teemu Selanne 17.6
14 Ryan Kesler 73 A. Burrows 26 Zdeno Chara 10Brad Richards 17.5
15 Patrick Marleau 73 Henrik Sedin 26 Teemu Selanne 10Sidney Crosby 17.4
16 Patrick Kane 73 Anze Kopitar 25 Keith Yandle 9.9Claude Giroux 17.3
17 Anze Kopitar 73 Brad Marchand 25 Kris Letang 9.8David Backes 17.1
18 Loui Eriksson 73 Jonathan Toews 25 Jonathan Toews 9.8Thomas Vanek 16.8
19 Bobby Ryan 71 Nicklas Backstrom 24 Dustin Byfuglien 9.6Michael Grabner 16.8
20 Patrick Sharp 71 Ryan Kesler 24 Drew Doughty 9.6Jeff Carter 16.6
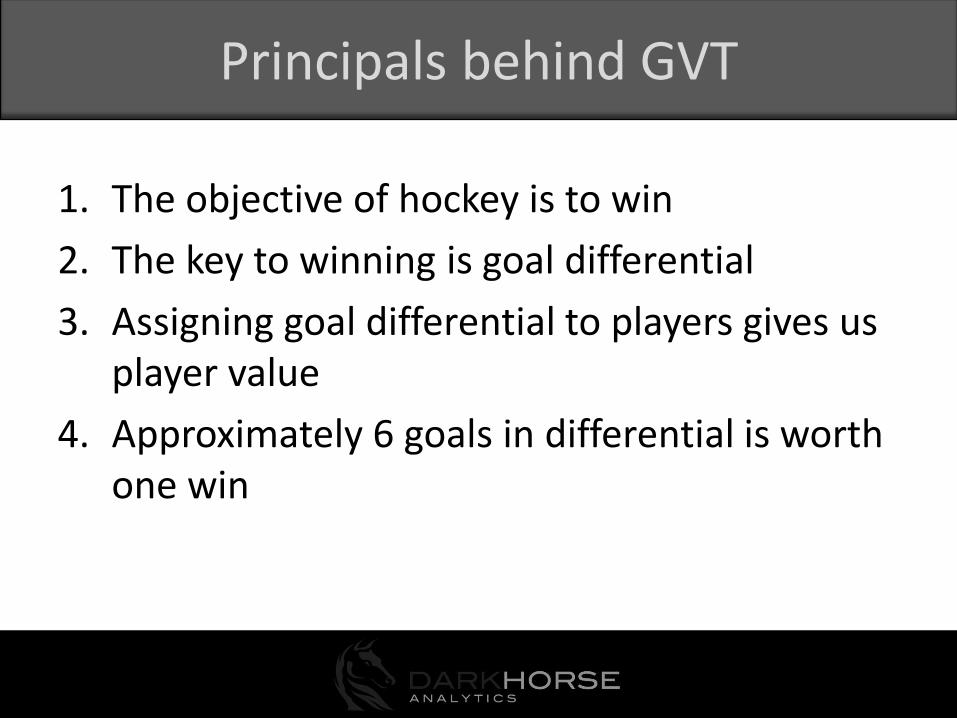
Principals behind GVT
1. The objective of hockey is to win
2. The key to winning is goal differential
3. Assigning goal differential to players gives us player value
4. Approximately 6 goals in differential is worth one win
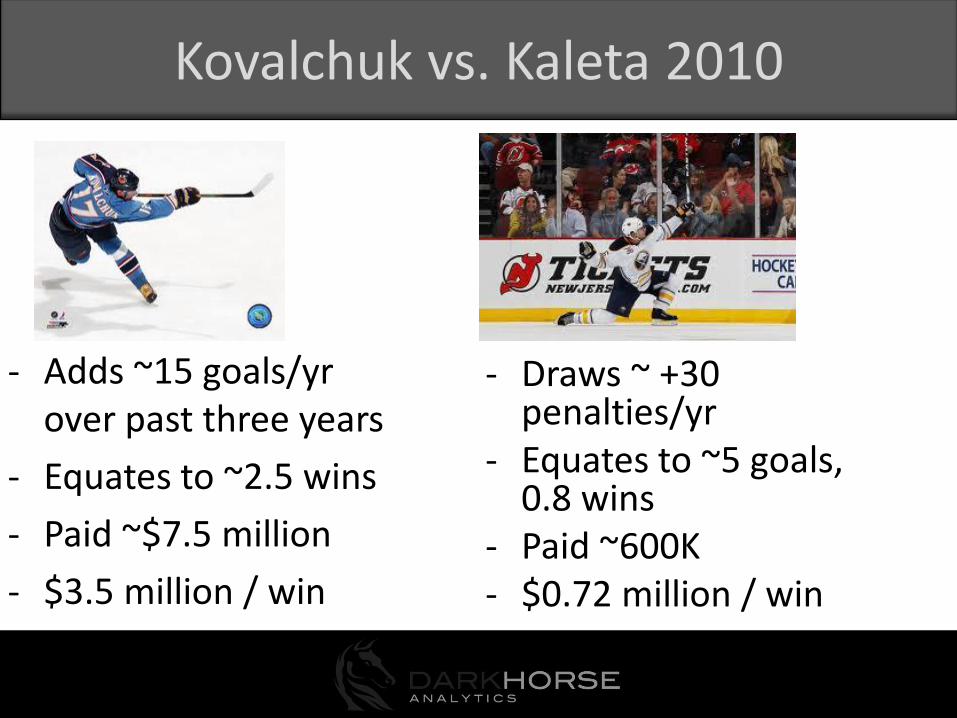
Kovalchuk vs. Kaleta 2010
- Adds ~15 goals/yrover past three years
- Equates to ~2.5 wins
- Paid ~$7.5 million
- $3.5 million / win
- Draws ~ +30 penalties/yr
- Equates to ~5 goals, 0.8 wins
- Paid ~600K- $0.72 million / win

Let’s talk about the draft
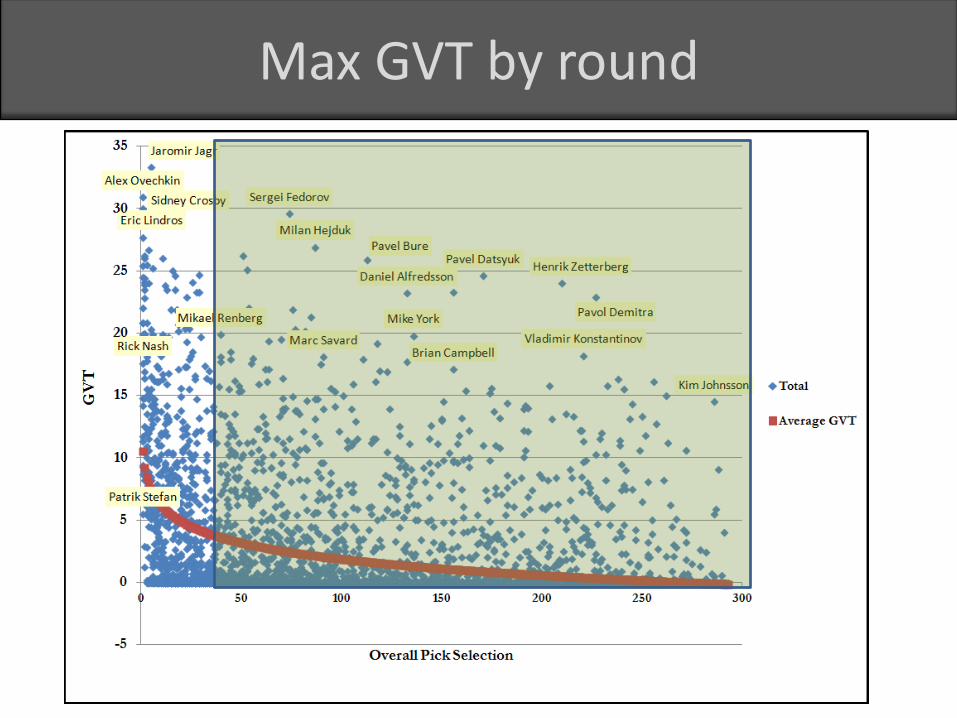
Detroit Red Wings GVTMax GVT by round
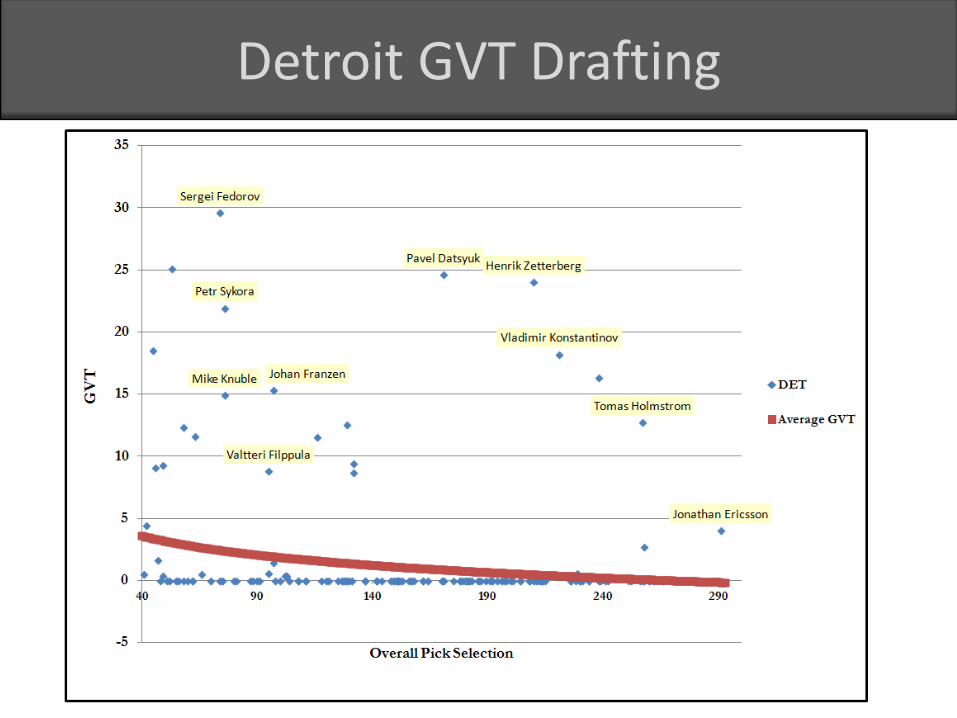
Detroit Red Wings GVTDetroit GVT Drafting
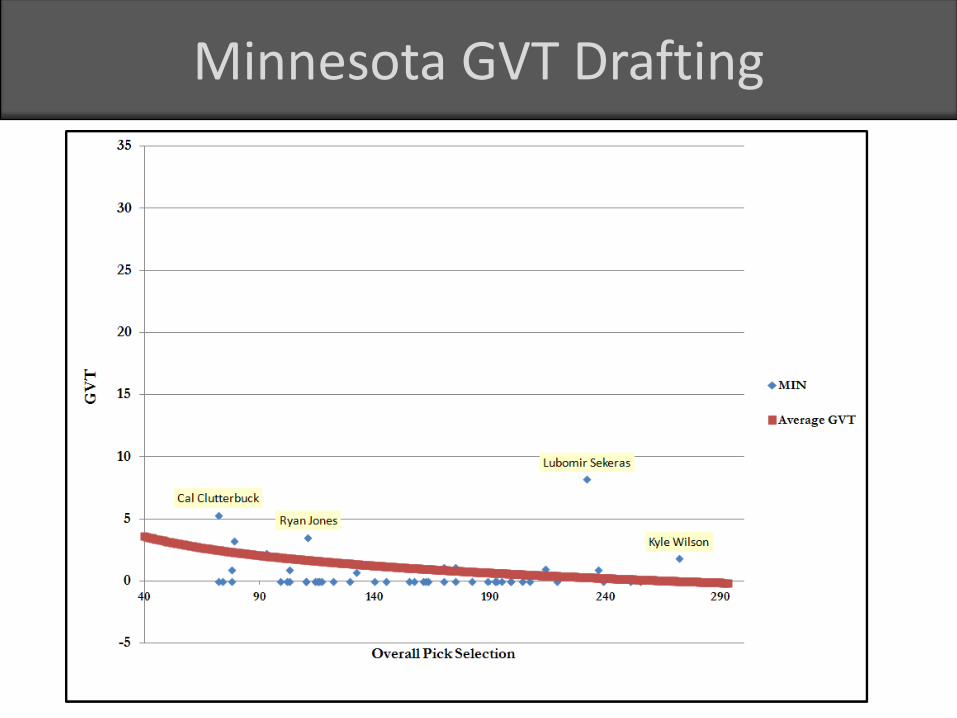
Minnesota Wild GVTMinnesota GVT Drafting
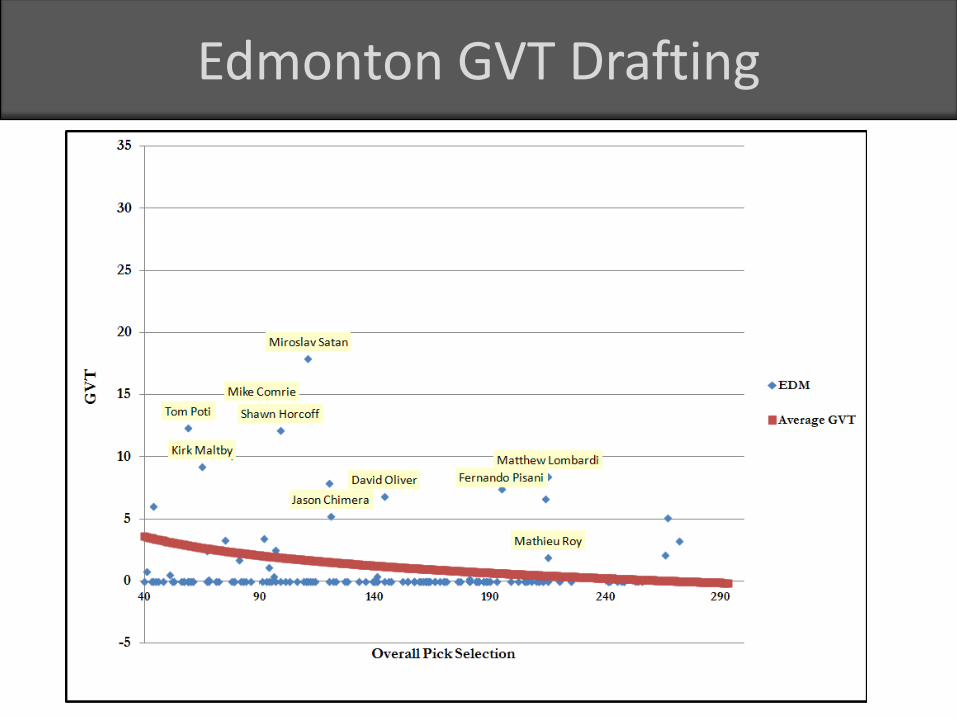
Edmonton Oilers GVTEdmonton GVT Drafting
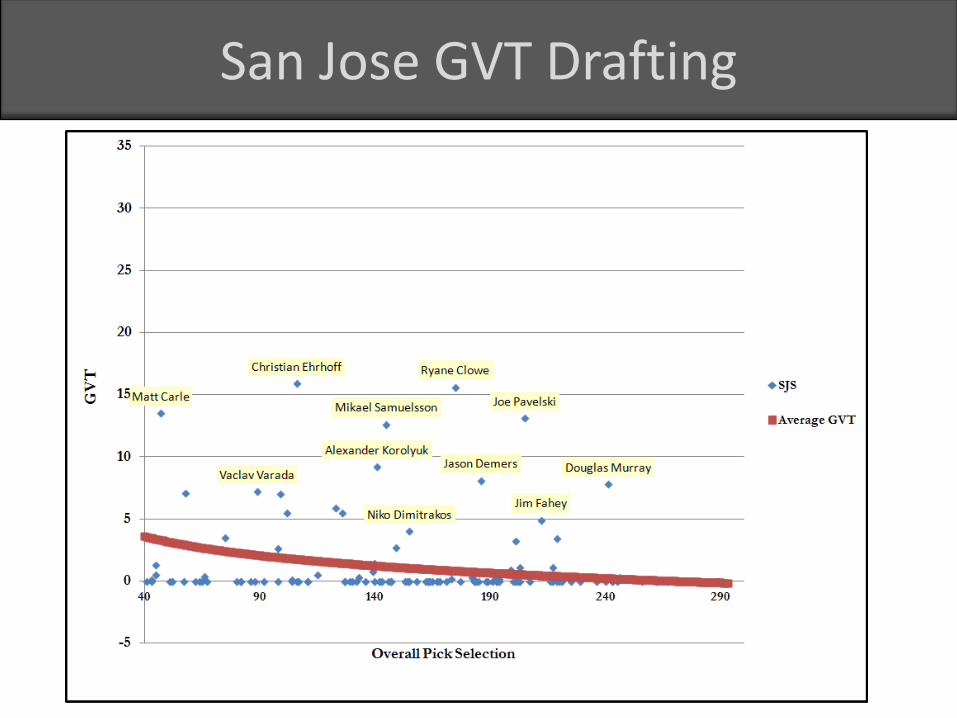
San Jose Sharks GVTSan Jose GVT Drafting
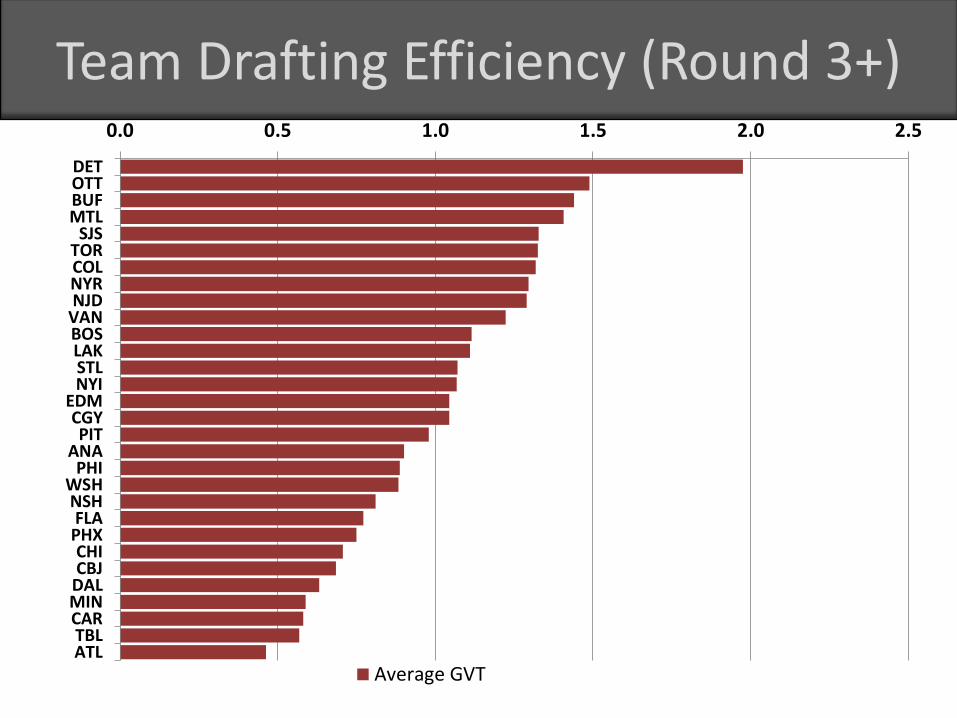
0.0 0.5 1.0 1.5 2.0 2.5
DETOTTBUFMTL
SJSTORCOLNYRNJD
VANBOSLAKSTLNYI
EDMCGYPIT
ANAPHI
WSHNSHFLA
PHXCHICBJ
DALMINCARTBLATL
Average GVT
Analysis of Point Share and GVTTeam Drafting Efficiency (Round 3+)
San Jose Draft GVT Distribution
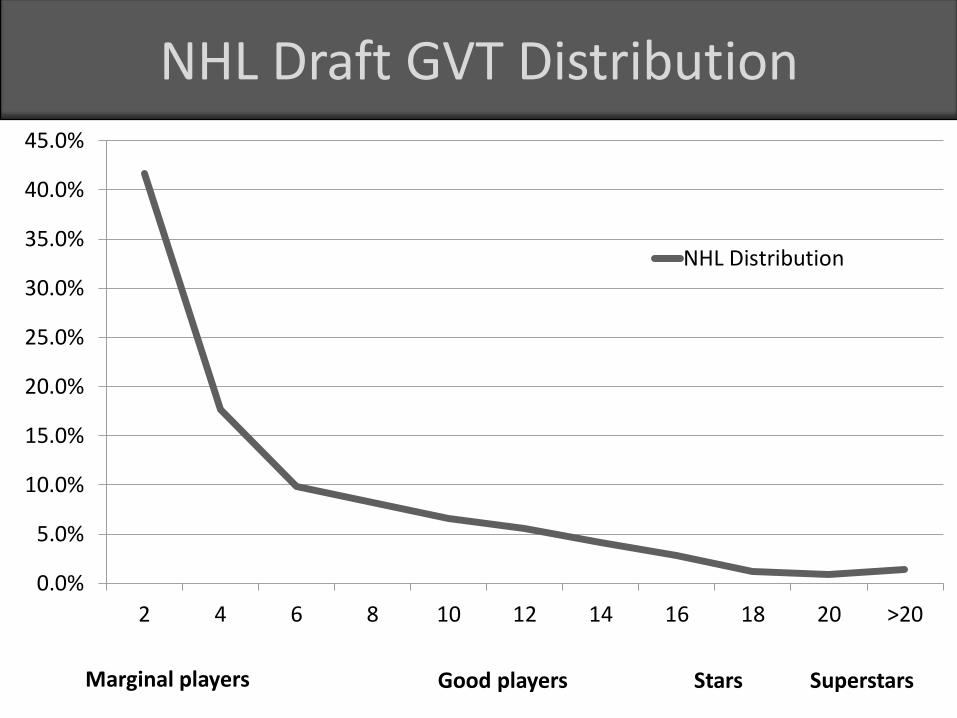
0.0%
5.0%
10.0%
15.0%
20.0%
25.0%
30.0%
35.0%
40.0%
45.0%
2 4 6 8 10 12 14 16 18 20 >20
NHL Distribution
NHL Draft GVT Distribution
Marginal players Good players Stars Superstars
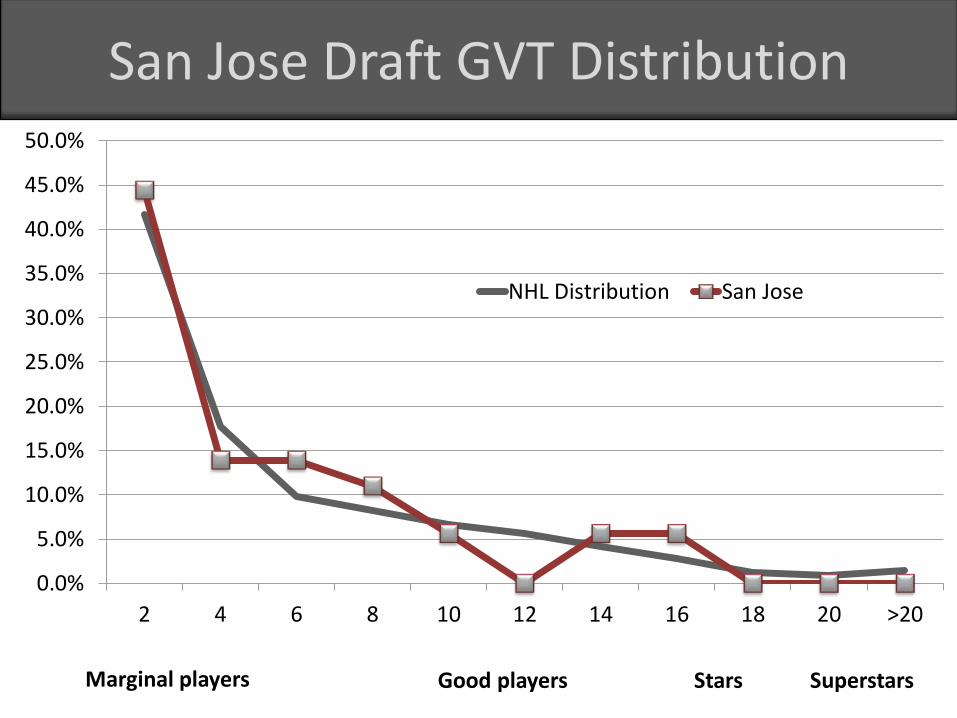
San Jose Draft GVT Distribution
0.0%
5.0%
10.0%
15.0%
20.0%
25.0%
30.0%
35.0%
40.0%
45.0%
50.0%
2 4 6 8 10 12 14 16 18 20 >20
NHL Distribution San Jose
San Jose Draft GVT Distribution
Marginal players Good players Stars Superstars
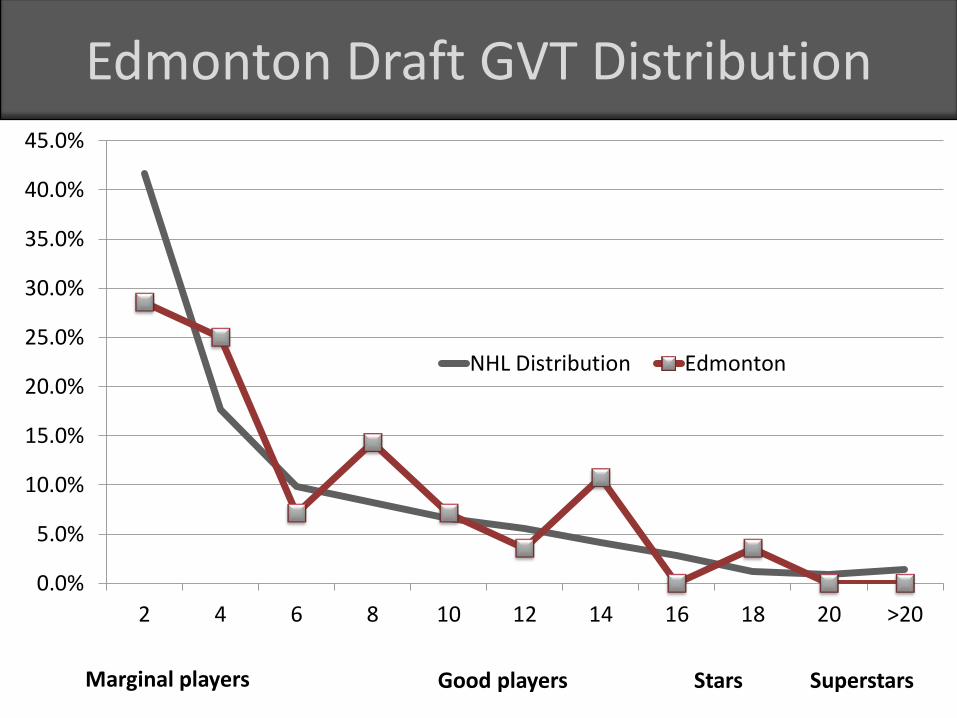
Edmonton GVT Distribution
0.0%
5.0%
10.0%
15.0%
20.0%
25.0%
30.0%
35.0%
40.0%
45.0%
2 4 6 8 10 12 14 16 18 20 >20
NHL Distribution Edmonton
Edmonton Draft GVT Distribution
Marginal players Good players Stars Superstars
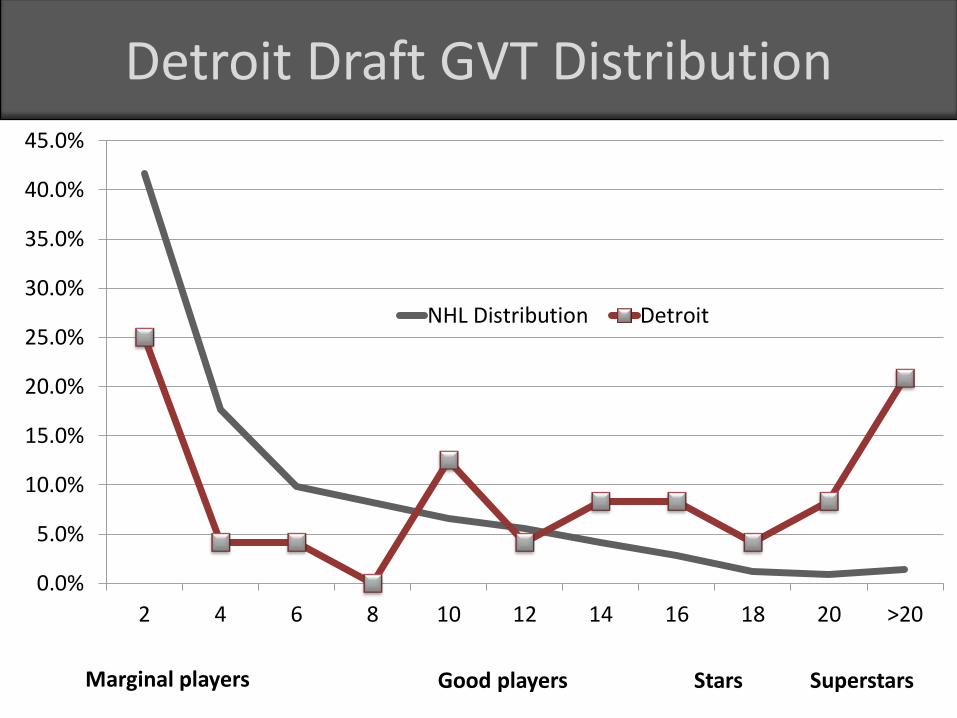
Detroit GVT Distribution
0.0%
5.0%
10.0%
15.0%
20.0%
25.0%
30.0%
35.0%
40.0%
45.0%
2 4 6 8 10 12 14 16 18 20 >20
NHL Distribution Detroit
Detroit Draft GVT Distribution
Marginal players Good players Stars Superstars
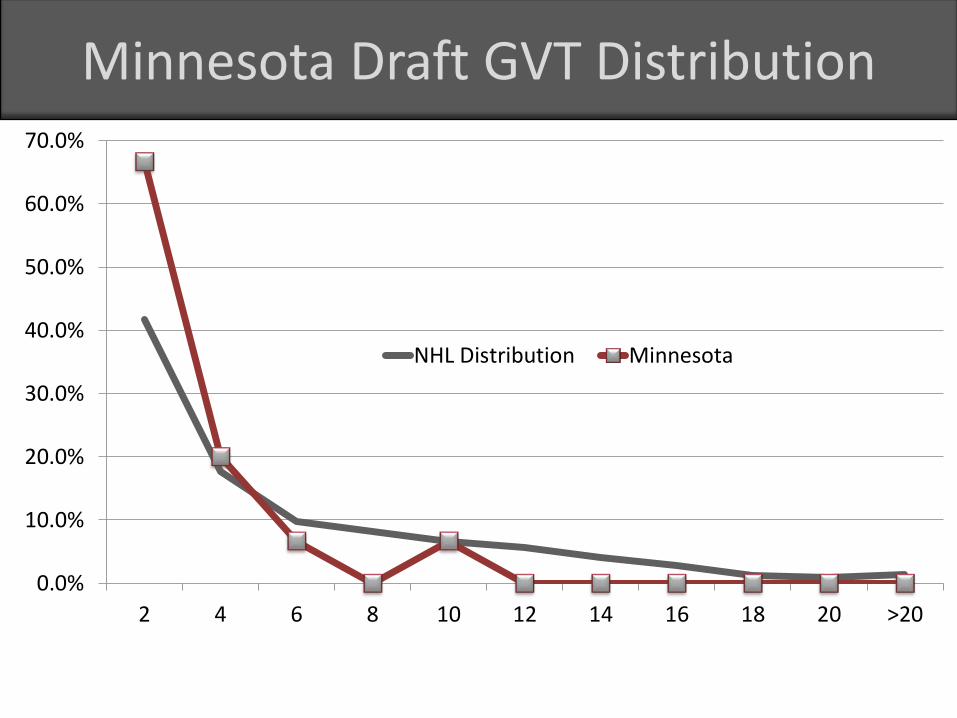
Minnesota GVT Distribution
0.0%
10.0%
20.0%
30.0%
40.0%
50.0%
60.0%
70.0%
2 4 6 8 10 12 14 16 18 20 >20
NHL Distribution Minnesota
Minnesota Draft GVT Distribution

What about player origin?
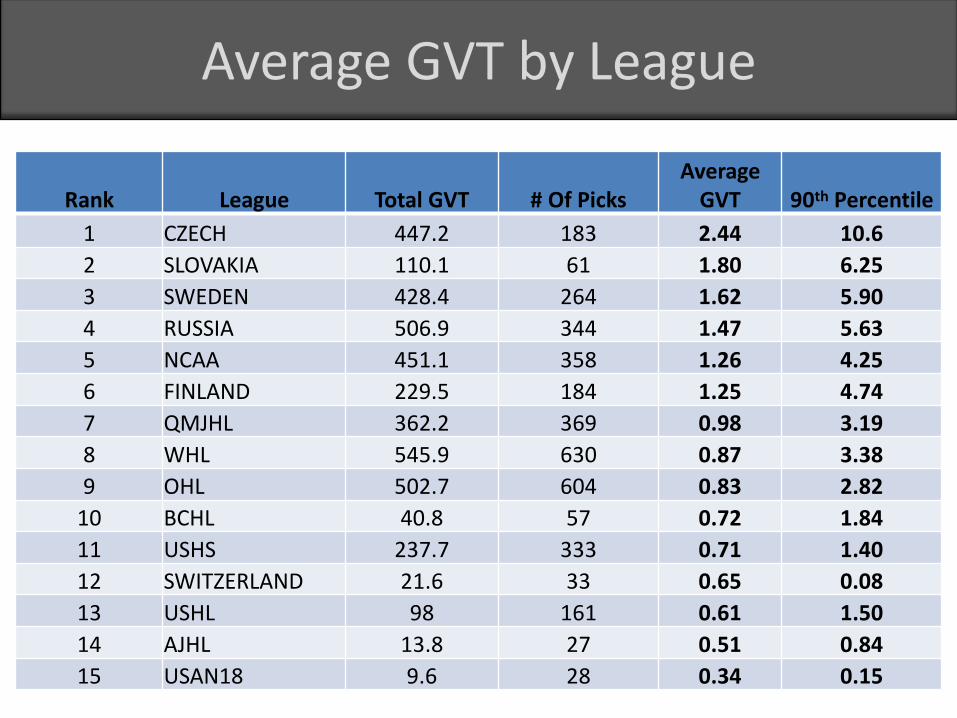
Minnesota GVT DistributionAverage GVT by League
Rank League Total GVT # Of PicksAverage
GVT 90th Percentile
1 CZECH 447.2 183 2.44 10.6
2 SLOVAKIA 110.1 61 1.80 6.25
3 SWEDEN 428.4 264 1.62 5.90
4 RUSSIA 506.9 344 1.47 5.63
5 NCAA 451.1 358 1.26 4.25
6 FINLAND 229.5 184 1.25 4.74
7 QMJHL 362.2 369 0.98 3.19
8 WHL 545.9 630 0.87 3.38
9 OHL 502.7 604 0.83 2.82
10 BCHL 40.8 57 0.72 1.84
11 USHS 237.7 333 0.71 1.40
12 SWITZERLAND 21.6 33 0.65 0.08
13 USHL 98 161 0.61 1.50
14 AJHL 13.8 27 0.51 0.84
15 USAN18 9.6 28 0.34 0.15

Who Should the Oilers Draft This Year?
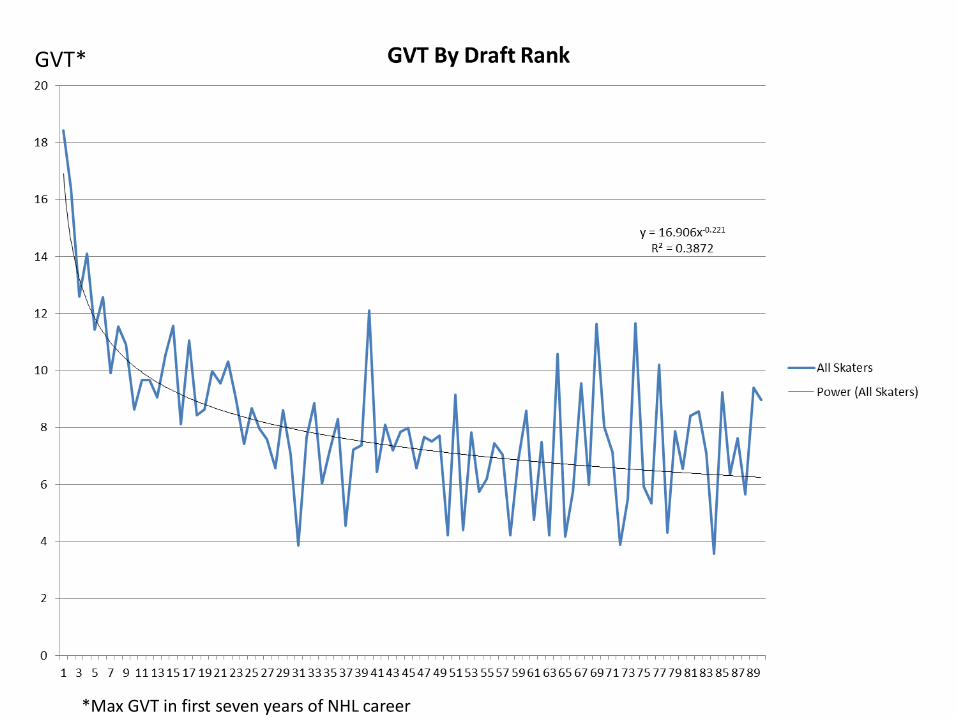
*Max GVT in first seven years of NHL career
GVT*
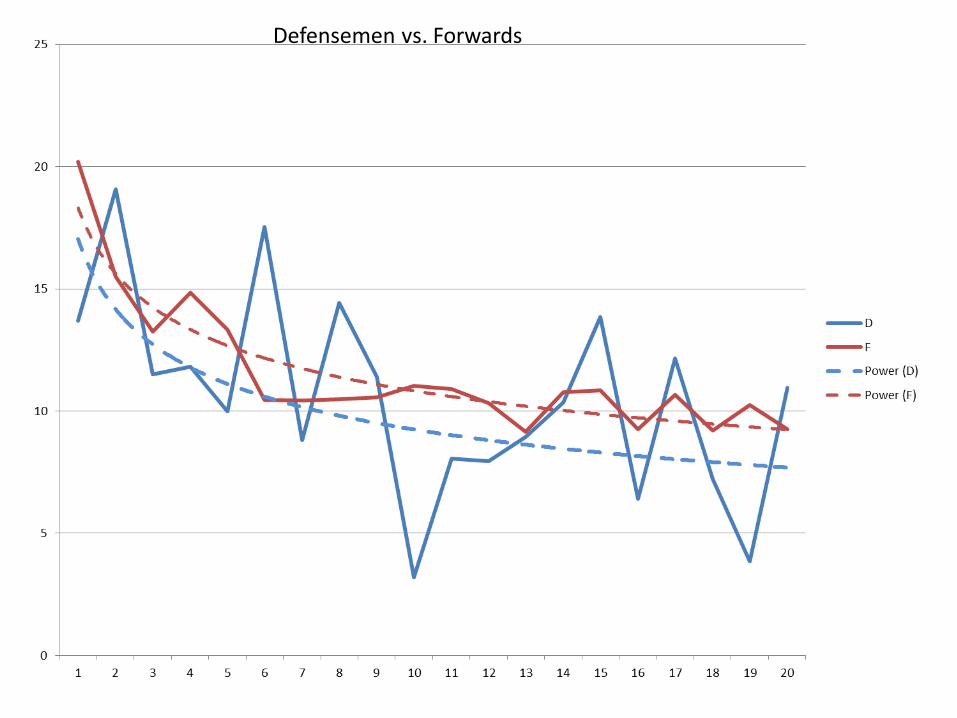
Defensemen vs. Forwards


![William I. Hegeman [Pick the date] DRAFT 2-20/2007 - 01/16 ...WITANWEYR MAGIC, MIND AND BODY, THE PRAXIS Magic, the why and how book. William I. Hegeman [Pick the date] DRAFT 2-20/2007](https://img.pdfslide.net/doc/110x75/5e674c1ef95e871485251905/william-i-hegeman-pick-the-date-draft-2-202007-0116-witanweyr-magic.jpg)