Embed Size (px)
Citation preview
Ecological Economics 70 (2011) 2145–2153
Contents lists available at ScienceDirect
Ecological Economics
j ourna l homepage: www.e lsev ie r.com/ locate /eco lecon
Analysis
The value of nonindigenous species risk assessment in international trade
Michael Springborn a,⁎, Christina M. Romagosa b, Reuben P. Keller c
a Department of Environmental Science and Policy, University of California, 2104 Wickson Hall, One Shields Ave. Davis, CA 95616, United Statesb Center for Forest Sustainability, School of Forestry and Wildlife Sciences, 602 Duncan Dr. Auburn University, Auburn, AL 36849, United Statesc Program on the Global Environment, University of Chicago, 5828 S. University Ave. Chicago, IL 60637, United States
⁎ Corresponding author. Tel.: +1 530 752 5244; fax:E-mail addresses: [email protected] (M. Spr
[email protected] (C.M. Romagosa), rpkeller@uchic
0921-8009/$ – see front matter © 2011 Elsevier B.V. Aldoi:10.1016/j.ecolecon.2011.06.016
a b s t r a c t
a r t i c l e i n f oArticle history:Received 29 October 2010Received in revised form 9 May 2011Accepted 14 June 2011Available online 23 July 2011
Keywords:Ecological–economic decision modelBioeconomicLive animal tradeImport policyReptilesAmphibiansBiological invasion
Managing the introduction of nonindigenous species is becoming a major goal of policy-makers at regional,national and international scales. Here we investigate, at the national level, the ideal design and expected netbenefits of a risk assessment program for evaluating the desirability of nonindigenous species imports. Weshow how to enhance the statistical rigor of such a system by correcting a common non-random samplingproblem encountered in the data. This correction enables model output to be interpreted in an economicallyrelevant way and facilitates a theoretically rigorous characterization of the balance between trade andnonindigenous species establishment risk. Using reptiles and amphibians imported to the U.S. as a case study,we characterize economic outcomes over a range of cases and demonstrate substantial expected returns tosuch a screening program, relative to the current effectively open-door policy. Our results are informative forthe current debate in the U.S. about whether to require federal agencies to apply risk assessment beforeallowing a species for import. The framework presented decomposes a complex argument about riskmanagement into component economic and statistical parts, allowing for debate and improvedunderstanding over each element to inform the overall program in a transparent fashion.
+1 530 752 3350.ingborn),ago.edu (R.P. Keller).
l rights reserved.
© 2011 Elsevier B.V. All rights reserved.
1. Introduction
The process of globalization is increasingly connecting humansocieties through trade and travel. As societies becomemore connected,the intentional and accidental transport of species also increases,effectively connecting ecosystems that have been isolated overevolutionary time (Hulme 2009). Although the majority of speciesmoved beyond their native range do not escape, some are released andestablish populations, reach high densities, and cause large harm toeconomies, agriculture, the environment, or animal and human health(Dehnen-Schmutz et al. 2007, Smith et al. 2009). Managing theintroduction and establishment of nonindigenous species is becominga major goal of policy-makers at regional, national and internationalscales (Lodge et al. 2006).
Despite growing recognition of the risks frommoving nonindigenousspecies there are large industries that transport these species interna-tionally, and consumers demand and derive benefits from the variety ofspecies available. The pet, aquarium, bait, water garden, ornamentalplant, live food and biological supplies trades are some of the majorindustries involved (Keller and Lodge 2007). The level of regulationapplied to these industries – for example to try to keep potentiallyproblematic species out of the trades – differs by jurisdiction and trade.At a federal level, under the authority of the Lacey Act of 1900, the U.S.
operates a prohibited list whereby species deemed to be injurious arebanned from importation and transport across state lines. Species areadded to this list if they are assessed as posing a large risk of causingharm. In practice, few assessments are conducted and the injurious listcurrently contains fewer than 20, meaning that most species can beimported and distributedwith no regard for the likelihood that theywillgo on to cause harm (Fowler et al. 2007, Lodge et al. 2006).
Elsewhere, programs to regulate species in trade are moreadvanced. Australia and New Zealand, for example, require all speciesto be assessed for the likelihood of invasion before they are allowedfor import. For several years it has been proposed that the U.S. shouldadopt similar procedures, and several versions of the “NonnativeWildlife Invasion Prevention Act” (H.R. 6311 and H.R. 669) bills havebeen introduced in U.S. Congress. These proposals have stalled, in partbecause of arguments that restricting the number of species availablewould pose an unacceptably high burden on the trades. For example,recent efforts by the U.S. Fish and Wildlife Service (USFWS) to bantrade in nine constrictor snake species by adding them to the LaceyAct's injurious species list (Senate bill S. 373, and House bill H.R. 2811)have met with a strong negative response from the reptile trade(USFWS, US Fish and Wildlife Service, 2010). Additionally, there areconcerns that the additional species assessments required would becostly for the responsible federal agencies to conduct (Smith et al.2009).
Here we investigate, at the national level, the ideal design andexpected net benefits of a risk assessment program for evaluatingnonindigenous species imports. While we apply the model to U.S.
2146 M. Springborn et al. / Ecological Economics 70 (2011) 2145–2153
imports of nonindigenous reptiles and amphibians (=herpetofauna) –using ecological data published in Bomford (2008) and variouseconomic data – the approach is readily adapted to other categories oflive imports, including other animal groups and live plants forhorticulture. Previous work on such screening systems has demon-strated the potential for using information from pre-existing in-troductions of nonindigenous species to create trait-based predictivemodels of the level of threat posed by species not yet introduced (e.g.Bomford et al. 2009; Caley et al. 2006; Keller et al. 2007a; Kolar andLodge 2002).
We contribute to this work in four ways. First, we add statisticalrigor to the establishment threat modeling component by demon-strating how to deal with sampling complications using analyticaltechniques from the rare events literature (e.g. King and Zeng, 2001).Data on rare events is often stratified in the sense that a rare outcomeis over-represented in the data relative to the true likelihood of itsoccurrence. For data sets of established and non-established speciesused to estimate establishment risk, the relatively rare event(establishment) is typically oversampled relative to the populationbase rate of establishment. This non-random, stratified samplingproblem is often either not treated (e.g. Bomford et al. 2009) oraddressedwith ad-hoc numerical techniques (e.g. Caley et al. 2006) inthe risk assessment program literature. If a correction for theunbalanced sample is not implemented, for the population of interestthreat estimates cannot be interpreted as probabilities, an importantstep in bridging statistical and decision-making models. Our secondcontribution involves the exploitation of a unique historical data set toestimate the population base rate of establishment for reptiles andamphibians, a crucial parameter for correcting the non-randomsampling problem.
A third contribution is the economically rigorous treatment of thedecision component, i.e. the highest level of threat the decision makeris willing to tolerate before a proposal is rejected. In setting thisstringency of the decision model, the central tradeoff (as the level ofexclusivity rises) is between the benefits of successfully avoidingestablishers (i.e. fewer “false negatives”) and costs of unnecessarilyrejecting benign species (i.e. more “false positives”). In the case ofnonindigenous species the costs of error are believed to be highlyasymmetric—mistakenly allowing access to an establisher is ingeneral thought to be much more costly than the forgone expectedbenefits of trade when a species is disallowed (e.g., Keller et al. 2007b;Lodge et al. 2006). While a common heuristic approach is to set equalthe true positive and true negative rates (e.g. Bomford et al. 2009;Keller et al. 2007b) we show that this can only be an ideal threshold bychance. We derive and estimate the elements of an optimal decisionrule using a generalizable approach.
Finally, we demonstrate the application of a consistent econometricand microeconomic approach to estimating the welfare benefits ofspecies trade.We estimate amicroeconomic demandmodelwith recentadvances in international trade econometrics using a rich panel data seton U.S. herpetofaunal imports differentiated by species. We highlight aconvenient closed form expression for estimating the welfare impact ofimport restrictions for the microeconomic model underlying theeconometric framework (commonly used in the trade literature).Overall, we demonstrate how to implement an economically andstatistically rigorous risk assessment system and characterize theexpected net benefits over a range of cases.
2. Methods
In this section, we first derive the optimal decision rule for theproblem before describing methodology for estimating key parame-ters and the core statistical model. The challenge in constructing therisk assessment tool is to take advantage of information on previousevents – for which both the outcome and predictive variables areknown – to make a decision to accept or reject a new proposal for
which only the predictive variables are known. Ideally, this is done ina way that maximizes the decision maker's objective, which couldtake various forms. Previous authors (e.g., Keller et al. 2007b) haveassumed that the decision maker will aim to maximize the number oftrue predictions. For species that become established, however, thecost of a false negative (i.e., mistakenly admit a species that becomesestablished) will generally be far greater than the cost of a falsepositive (i.e., mistakenly not admit a benign species). The modeldeveloped here acknowledges the asymmetric cost of predictionerror, and seeks to find the decision system that maximizes thepresent value of expected net benefits in monetary terms, whether ornot this maximizes the number of true predictions. Below, we firstmotivate a combined statistical-decision model before developingboth components in turn.
Let SN represent the available training data set over N species,including the observed outcome of binary variable y –which specifiesthe true nature of a particular species as either established (y=1) orbenign (y=0) – and a set of variables given by x that are predictive ofy. This data is thus given by SN={(y1, x1), (y2, x2), …, (yN, xN)} forspecies n=1, …, N. Let p(xn; θ) represent the probability that a givenspecies n is an establisher conditional on xn and a vector of modelparameters, θ: p(xn; θ)=Pr(yn=1|xn; θ). The net benefits of ascreening action, an, depend on whether the decision is to reject thespecies (an=1) or allow it to be imported (an=0). Let ua,y representthe net benefits of taking action a given the true nature y of a proposedspecies. Suppressing the species index n for simplicity, the decisionproblem is to select the binary choice a, an argument of the utilityfunction, to maximize the expected net benefits per species:
maxa
p x; θð Þua;1 + 1−p x; θð Þ½ �ua;0
n o: ð0:1Þ
Given this objective, it is optimal to reject a species (a=1) forimport when the expected net benefits of banning are greater thanthat of accepting (a=0):
p x; θð Þu1;1 + 1−p x; θð Þ½ �u1;0 N p x; θð Þu0;1 + 1−p x; θð Þ½ �u0;0: ð0:2Þ
Rearranging the terms in Eq. (0.2) generates a decision rule of thefollowing form. It is optimal to reject a species when the probability ofestablishment is greater than a cutoff defined as c:
p x; θð Þ Nu0;0−u1;0
� �u1;1−u0;1
� �+ u0;0−u1;0
� �≡ c: ð0:3Þ
Next we demonstrate an approach for characterizing the cutoff con the right-hand side of this expression before returning to thestatistical model for p(x; θ).
2.1. Identifying the Optimal Decision Threshold
The change in net benefits from implementing a risk assessmentsystem depend on the pre-existing status quo, that is, whetherbusiness-as-usual is an open-door policy where all species areallowed, or a closed-door policy where all speczies are banned.Roughly consistent with current practice in the U.S. (Fowler et al.2007; Lodge et al. 2006), we take an open-door policy as the pre-existing status quo. Relative to this baseline, risk assessment systembenefits result from true positives (excluding a true establisher) whilecosts arise from false positives (excluding a benign species).Regardless of whether or not a species is an establisher, exclusionresults in a loss of the long-run benefits of importing that species. LetVTN0 represent the present value of the expected stream of benefitsfrom trade. On the other hand, when a true establisher is excluded, thebenefit is given by VEN0, the present value of averted long-run
2147M. Springborn et al. / Ecological Economics 70 (2011) 2145–2153
expected losses due to the establishment of a nonindigenous species.The present value of expected net benefits of excluding a species(a=1) when the species is an establisher (y=1) is given by u1,1=VE
−VT. Alternatively, when the species is excluded (a=1) but benign(y=0), net benefits are simply the lost value of trade: u1,0=−VT.Since the net benefits are characterized with respect to an open-doorbaseline, then species for which the door is also open (a=0) afterscreening do not lead to a change in net benefits: u0,0=u0,1=0. Thusthe cutoff from Eq. (0.3) simplifies to
c ≡u0;0−u1;0
� �u1;1−u0;1
� �+ u0;0−u1;0
� � =VT
VE: ð0:4Þ
Making the alternative assumption of a closed-door baseline doesnot affect this optimal decision rule.1 We now describe an approachfor estimating the value VT.
2.2. Welfare Benefits of Species Trade
We estimate the welfare value of species trade in terms of theopportunity cost of banning imports to the U.S. Our goal is to describeand demonstrate a general framework for characterizing the expectedlost gains from trade when a species proposed for import is rejected.Following Feenstra (1994) and Blonigen and Soderbery (2010) wemodel import demand as follows. Consumer preferences over importszi,t of variety i∈ {1, …, I} in year t are given by a constant elasticity ofsubstitution utility function
U z1;t ;…; zI;t� �
= ∑i∈I
yizi;tσ−1σ
� � σσ−1
: ð0:5Þ
The parameters include the elasticity of substitution, σ, which isfixed, and the taste parameters, γi, which can vary by variety. Whilethe trade literature (e.g. Feenstra (1994) and Blonigen and Soderbery(2010)) is typically concerned only with relative changes in welfarefrom variety, our objective is to characterize the forgonewelfarewhena particular variety is rejected for importation. As summarized by Justet al. (2004), the appropriate measure for the welfare impact of aquantity restriction is compensating surplus, that is, the level ofcompensation needed when imports are restricted to restore the levelof utility enjoyed when imports are not restricted. To specifycompensating surplus, we characterize the indirect utility functionby way of Marshallian demand. Assuming that consumers of importsare choosing amongst available varieties to maximize their utility, thefirst order conditions provide the familiar tangency condition whichinvolves setting the marginal rate of substitution between variety iand j equal to the price ratio:
MRSZi;t Zj;t =yiz
−1 = σi;t
yjz−1 = σj;t
=qi;tqj;t
: ð0:6Þ
Using the utility function and total expenditures given byMt=∑ i∈ Iqi, tzi,t, Marshallian demand for variety j is
zi;t qt ;Mtð Þ = Mt qi;t + ∑j≠i
qj;tqi;tyjqj;tyi
!σ" #−1
; ð0:7Þ
1 Given a closed-door status quo, there is no change in outcome – and therefore nochange in net benefits – when a species is excluded: u1,0=u1,1=0. A true negativeresults in net benefits given by u0,0=VT , while a false negative returns u0,1=VT−VE.Substituting these expressions in Eq. (0.4) results in the same cutoff, VT/VE. While thisdecision rule is fixed, we show in Section 3 how the expected net benefits of thescreening system are sensitive to specification of an open- or closed-door status quo.
where qi,t is the observed unit import price of variety i and qt is thevector of prices for all i∈ I. To find the indirect utility function, wesubstitute demand (Eq. (0.7)) into the utility function (Eq. (0.5)):
W qt ;Mtð Þ = Mt ∑i∈I
yi qi;t + ∑j≠i
qi;tqi;tyjpj;tyi
!σ !1−σσ
24
35
σσ−1
: ð0:8Þ
Our target welfare measure, the compensating surplus associatedwith a complete ban on imports of a particular variety i, is given by thearea to the left of the Hicksian (compensated) demand function(associated with the unrestricted outcome) and above the price line,qi,t (see Just et al. 2004, p. 203–208). In the case of a complete ban, thisarea is equivalent to the compensating variation associated an infiniteupward shift in price. Using this equivalence and the definition ofcompensating variation, the welfare impact, or compensating surplusfor banning variety k in year t, CPSk,t, is given by the expression
W qt ;Mtð Þ = limqk;t→∞
W q1;t ;…qk−1;t ; qk;t ; qk + 1;t ;…qI;th i
;Mt−CPSk;t� �
:
ð0:9Þ
Using the expression forW(qt,Mt) in Eq. (0.8), andeliminatingγ-ratiosusing the tangency condition in Eq. (0.6), compensating surplus can beexpressed as
CPSk;t = Mt 1− Mt
Mt−qk;tzk;t
! 1σ−1
0@
1A: ð0:10Þ
The final form of this welfare measure is particularly convenientbecause the unknown taste parameters γi (e.g. for over 1000 varietiesin our application) are eliminated by substituting observed importmarket data (Mt, pt and xt) which are described further below.
The final component needed to estimate compensating surplus isan estimate of the elasticity of substitution amongst varieties in thereptile and amphibian market, σ. This parameter is estimated usingthe generalized method of moments (GMM) approach of Feenstra(1994) which corrects for simultaneous equation bias and potentialmeasurement error in the prices. This approach was originallydeveloped in the context of Armington-type varieties of a goodwhere products are differentiated solely by country of export. Herewefollow Blonigen and Soderbery (2010) who apply this approach tomore detailed product level data on automobiles where varieties aredetermined by attributes of the product (make and model) asopposed to country of origin. STATA code for estimating theelasticities of substitution in Blonigen and Soderbery (2010) isprinted in Feenstra (2010, p. 27–37).
This GMM elasticity estimation approach requires a panel of priceand quantity data for the import market of interest where the cross-sectional dimension is differentiated by variety. Live animal import datafrom theU.S. Department of Commerce (USDC, 2010), the typical sourcefor U.S. trade data, is only available for reptiles as a group whileamphibians as awhole are lumped togetherwith a larger set of animals.However, detailed import data on reptiles and amphibians by variety(species) for 1999–2009 is available from the U.S. Fish and WildlifeService (USFWS). This information is maintained in the Law Enforce-ment Management Information System (LEMIS) database and includesthe annual quantity and stated customs value of various animal imports.These data originate from the USFWS declaration form for the import orexport ofwildlife and their products (Form3-177) andwereobtainedbyFreedom of Information Act requests. The resulting estimate of theelasticity of substitution is σ = 5:34, with a 95% confidence interval of[4.90, 5.90].
Using the LEMIS data on overall expenditures and expenditureshares, we calculate the mean annual compensating surplus per
2148 M. Springborn et al. / Ecological Economics 70 (2011) 2145–2153
species,CPS, by taking the average of CPSk,t from Eq. (0.10) over all1269 species and all years in our sample (1999–2009), where allmonetary figures have been converted to 2008 dollars using theConsumer Price Index (BLS, 2010). To better reflect prices paid byimporters we augment the declared value by the ad-valorem freightrate for food and live animals of 7.64% as estimated by Hummels(1999). No tariffs are imposed on imports in this category. Our centralestimate for CPS is $4.5K. While this might seem small, the declaredvalue of total imports for many reptile and amphibian species is fairlylow: the annual median declared value from 1999 to 2009 rangesapproximately from $1K to 3K. Under the simplifying assumption thatexpected compensating surplus is constant, the present value of thisannual expected welfare impact per species, over an infinite horizondiscounted at the rate r, is given by VT = CPS = r.
Using a discount rate of r=5%, our central estimate of theexpected present opportunity cost of banning imports of a herpeto-faunal species is VT=$90K. In our sensitivity analysis we consideralternative high ($145K) and low ($45K) estimates of VT constructedas follows. We first calculate annual estimates of CPSgiven estimatesof σ at the bounds of the 95% interval (reported above) and then takethe maximum and minimum estimates over the years 1999–2009.While we express levels in present value terms here for completeness,note that the optimal decision in terms of where to set the cutoff asexpressed by Eq. (0.4) simplifies to a ratio of single period importbenefits to establishment losses and is independent of the timehorizon and discount rate considered.2
Our estimates of import welfare loss rest on several simplifyingassumptions. Functions describing import demand are treated as ifthey are fixed over time. We have assumed that if imports of a speciesbegin they are uninterrupted and do not grow or decline over time.Finally, we have conducted a partial equilibrium analysis andtherefore have not accounted for secondary effects such as shifts inthe labor market or impacts on other goods markets such as petsupplies. While such secondary effects are likely to be importantwhen policies impose large direct costs or affect highly integratedsegments of the economy (Kopp et al. 1997) in our setting weestimate that the proposed screening systemwould affect less than 1%of potential pet purchases. Thus, a partial equilibrium analysisarguably provides a useful approximation of the total effect.
2.3. Welfare Costs of Establishment
We have obtained coarse estimates of the expected welfare ofallowing the importation of a species (VT) but satisfactory estimates ofthe expected welfare loss given an establishment (VE) are notcurrently available. There do exist incomplete estimates of thedamages from some of the worst establishers. For example, Pimentelet al. (2005) estimate the cost of the brown treesnake (Boigairregularis) population in Guam, and efforts to prevent the species'spread to Hawaii, at $6M per year. The population of Burmese python(Python molurus) in Florida has resulted in management and researchefforts costing at least $1.5M since 2008. Additionally, a host of othernonindigenous reptiles and amphibians in the U.S., including theAfrican clawed frog (Xenopus laevis), spiny-tailed iguana (Ctenosaurasimilis) and Nile monitor (Varanus niloticus), have led to aggressiveand costly ongoing management responses. Although the costs ofspecies establishments are clearly large, there remains a lack ofcomprehensive data for reptiles or amphibians overall. Thus, instead
2 To see this note that the series of expected annual values is converted to a scalarpresent value by multiplying the expected annual value by some factor, 1/r in theinfinite horizon case and (1−(1+r)T) for a T-length time horizon. Because this factoroccurs in Eq. (0.4) for imports in the numerator and losses in the denominator, theratio of present values is equivalent to the ratio of expected annual values. Note thatthis result follows from treating estimates of expected annual costs and benefits asconstant. When that condition does not hold, optimal decisions will likely be sensitiveto the discount rate and time horizon selected (e.g. Leung et al. 2002).
of estimating VE directly we consider the implications of various levelsof VE as determined in proportion to the better understood parameterVT. First, let the population proportion of establishers be given by π,that is, the unconditional probability that a randomly chosen proposalwill in fact be an establisher: Pr(y=1)=π. We consider differentscenarios relating VT to πVE, the expected damage of a proposal beforethe true status of the species is known. The relationship betweenthese two values will be given by the parameter α:
α =VT
πVE: ð0:11Þ
We take this approach since it allows us to easily describe variouscases in relation to a benchmark scenario where α=1. In thisbenchmark case, since the expected costs and benefits of importing aproposed species are equal (in the absence of an informed screeningsystem), a social decision maker would be indifferent betweenbanning all imports and accepting all imports. Setting α=1 as areference case is further supported by the fact that (as will be shownlater) this is the singular point at which expected net benefits under aclosed-door baseline and an open door baseline are identical. TakingαBM=1 as our benchmark scenario, we also consider alternative low-,medium-, and high-α cases: αLO=0.25, αMD=0.5 and αHI=1.5,respectively. We include two cases in between the extremes (αMD andαMD) to avoid emphasizing either as a sole central estimate. Note thatif αb1 (e.g.αLO and αMD) imports are less valuable relative to expecteddamages than in the benchmark, and, in the absence of an informativescreening system it would be optimal to ban all imports. The inverseapplies to αN1 (e.g. αHI). The implied levels for VE are reported inTable 1 and range from $1.2M to $7.3M.
Combining the cutoff function described in Eq. (0.4) withEq. (0.11), the optimal cutoff is given by:
c =VT
VE=
VT
ðVT = παÞ= πα: ð0:12Þ
The population proportion of establishers, π, is important for boththis cutoff function and the statistical model for p(x; θ) to be describednext. While parameterization of this so-called “base-rate” has provento be particularly difficult (e.g. see Caley et al. 2006) we haveassembled a unique dataset of reptile and amphibian imports to theU.S. in 1970–1971 that allow for a particularly informed approach.These data were obtained from previous compilations and USFWSreports of information from Form 3-177 (Romagosa et al. 2009). Weestimate π as the proportion of species that were identified in U.S.imports from 1970 to 1971 and that are now established. We chosethis early subset to minimize downward bias in the estimate thatmight stem from either a lag in establishment or a delay in recordingestablishment. Our estimate for this baseline rate of establishment fora randomly chosen imported herpetofaunal species is π=0.049.3
At π=0.049 and our benchmark scenario of α=1, the ratio of VE toVT is approximately 20. Recall from the discussion following Eq. (0.6)above that this implies πVE=VT, that is, the expected costs andbenefits of accepting a randomly chosen species are equal and thus asocial decision maker would be indifferent to the choice of acceptversus reject. Based on the present costs of established reptiles andamphibians and the value of trade, and considering that establishedspecies are increasingly recognized to cause large harm to economiesand ecosystems, this benchmark is arguably conservative (i.e., thetrue value of VE is likely larger).
3 While examining the status of species imported decades ago arguably alleviates acritical source of potential bias, note that the rate may be upward biased if conditionshave become more suited for establishment (e.g. due to habitat disturbance) ordownward biased if the pool of potential establishers is limited and thereforebecoming exhausted over time.
5 One reason for this is that π is derived from a set of imported species (which mayor may not have been observed in the wild) while SN is comprised of species whichhave already been recorded beyond captivity. Since we are concerned with importsoverall, the baseline rate of establishment for a randomly chosen importedherpetofaunal species (π) is the appropriate population rate to consider for correctingthe imbalance.
6 This software also implements a further correction for finite sample bias which isincreasingly important as the balance between successes and failures in the data setdeviates from even (King and Zeng, 2001). Though this may be important in fittingother screening models, it is not a significant concern in the present analysis given therough balance between successes and failures.
7 While a fixed effects model for family is an obvious alternative to the randomeffects model it is not feasible in this setting because some families in the data setfeature all successes or all failures (including those for which only one species is
Table 1Implied optimal cutoff (c), true positive rate (TPR, “sensitivity”), true negative rate(TNR, “specificity”) and expected net benefits of risk analysis per species (2008$) fordifferent levels of α.
Sample correction Yes No
Random effects No Yes
α VT
($K)VE
($K)c TPR TNR ENBOD
($K)c TPR TNR ENBOD
($K)
αLO 0.25 90 7347 0.012 1.00 0.40 305 0.21 0.95 0.65 308αMD 0.5 90 3673 0.025 0.98 0.60 138 0.30 0.92 0.76 141αBM 1 90 1837 0.049 0.87 0.76 54 0.31 0.90 0.76 57αHI 1.5 90 1224 0.074 0.72 0.82 25 0.55 0.72 0.89 31
2149M. Springborn et al. / Ecological Economics 70 (2011) 2145–2153
2.4. Statistical Model
Thefinal component of the combined statistical-decision approach isthe estimation of the conditional parametricmodel for theprobability ofestablishment, p(x; θ), using the training data set SN. We take as ourstarting point the logistic regression framework developed by Bomfordet al. (2009). For a given observation n∈{1, 2, …, N}which belongs tofamily i∈{1, 2, …, I}, the probability p(xn; θ) is modeled as a logisticfunction of a linear combination of several predictive covariatesincluding a constant term:
logit p xn; θð Þð Þ = β0 + β1propestn + β2regCAn + β3regFLn
+ β4climaten + ζi:
ð0:13Þ
The first covariate propest is, from a global perspective, theproportion of jurisdictions to which a species has been introducedin which the species has successfully established. Since the data arepooled across three host regions, the next covariate is a fixed effectthat differs between regions. Britain is the base case, while regCA andregFL are dummy variables equal to one if the particular region ofintroduction is California or Florida, respectively. Additionally,Bomford et al. (2009) demonstrate the importance of a climatematch score, climate, which characterizes the degree to which thespecies' native climate is similar to that of the region to which it isintroduced.
The final predictive variable is the taxonomic family of the specieswhich is modeled as a random effectζi, that is, as a stochasticcomponent of the constant term. This stochastic component, whichdiffers across families, is assumed to be drawn from a normaldistribution with mean zero and variance τ2: ζi~N(0, τ2). Theparameter vector estimated, using a maximum likelihood approach,includes the standard regression coefficient vector β as well as thevariance of the random effects: θ={β, τ2}. When implementing therandom effects (REs) model, we use the so-called empirical Bayesestimates for the fitted probability, pn, to deal with the fact that theregression model returns only an estimate of the distribution for therandom effects and not a specific random effect for each family.4
While the volume of introductions of a species, or propagulepressure, is an additional variable found to be associated withestablishment success (Hayes and Barry, 2008) this predictivevariable is not included simply because the information is neitherconsistently available for model estimation nor for assessment of anewly proposed species for import.
4 For each family cluster i, this approach takes the estimated random effectsdistribution (N 0; τ2
� �) as a prior for ζiand updates it in a Bayesian way using a
likelihood function determined by the observations for family i. Using the resultingposterior distribution for ζi, the empirical Bayes estimate returns the expected value ofp(xn; θ) for each species n in family i, where the expectation involves integrating overp(xn; θ) with respect to the posterior distribution for ζi. See Rabe-Hesketh andSkrondal (2008, p. 269) for an overview.
We use a training dataset, SN, given in the report by Bomford(2008) which is comprised of the variables specified in Eq. (0.13) for144 herpetofaunal species that have been recorded beyond captivity.These species are clustered into 30 families with a range of 1 to 21species observed per family. Eight families are comprised of either allestablishers (y=1) or all non-establishers (y=0).
The statistical analysis is complicated by the fact that SN is not arandom sample but rather endogenously stratified in the sense that“successes” (y=1) are oversampled. The proportion of theseestablishments in the data set (0.42) is almost nine times greaterthan our estimated establishment rate for herpetofaunal imports inthe U.S. (π=0.049).5 Uncorrected, this type of non-random sampleleads to estimates of p(x; θ) that are significantly biased upward. Wefind that uncorrected fitted probabilities are on average over fivetimes greater than corrected estimates. As we will show in the results,uncorrected estimates for p can still function effectively as a classifierto order species by risk—however it is not appropriate to interpretthese measures as true probability estimates and therefore establish-ing an economically based decision threshold for decision-making isnot straightforward.
The stratified sampling problem and methods for correction havebeen widely discussed in the social science literature (Cosslett 1993;Imbens and Lancaster, 1996; King and Zeng 2001; Manski and Lerman1977) and recently in the nonindigenous species literature inparticular (Caley et al. 2006). While the weight-based correction forstratified samples suggested by Manski and Lerman (1977) is fairlysimple to apply manually, here we use ReLogit, a rare events logisticregression routine that implements the correction and is freelyavailable for STATA and Gauss (Tomz et al. 1999).6
Unfortunately a satisfactory methodology is not currently avail-able that allows for random family effects and the stratified samplingcorrection at the same time. This constraint arises because randomeffects requires integration in the maximum likelihood function foreach family cluster while the sampling correction involves weightsover a different clustering given by the dependent variable.7 Thus,while the corrected estimates are preferred in terms of minimizingbias and interpretability of fitted values, this comes at the cost ofeschewing information on taxonomic family. We therefore presentand compare results for (1) the uncorrected sample with randomeffects and (2) the corrected sample without random effects.
3. Results and Discussion
Below we illustrate the overall performance of the statisticalmodels over the entire range of possible decision thresholds and thenconsider the economic performance under our particular calculations
available). In such cases, the maximum likelihood estimate for the family fixed effect iseither infinity (in the case of all successes) or negative infinity (given all failures).Another option would be to handle the sample correction through bootstrapresampling – either undersampling successes (e.g. Caley et al. 2006) or oversamplingfailures – before estimating the model with random effects. However, undersamplingsuccesses would involve discarding 90% of the successes (and therefore muchinformation) in each iteration, while oversampling leads to problems of overfittingand poor “out of sample” performance, which was confirmed in our setting.
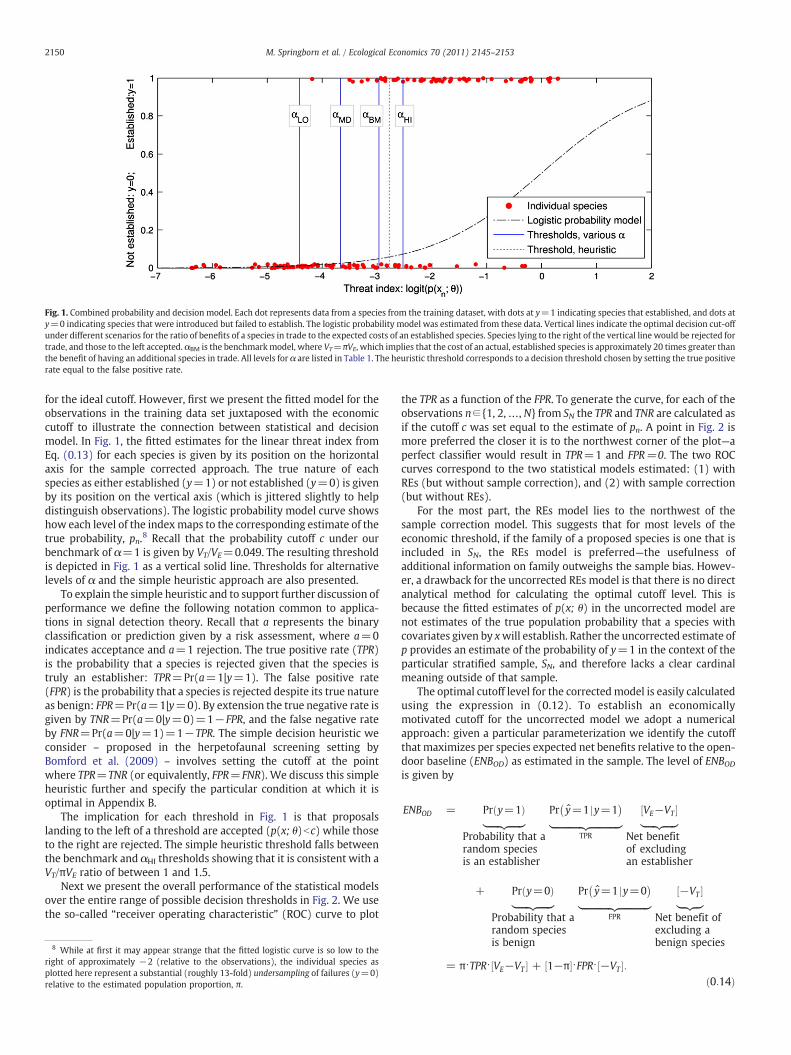
Fig. 1. Combined probability and decision model. Each dot represents data from a species from the training dataset, with dots at y=1 indicating species that established, and dots aty=0 indicating species that were introduced but failed to establish. The logistic probability model was estimated from these data. Vertical lines indicate the optimal decision cut-offunder different scenarios for the ratio of benefits of a species in trade to the expected costs of an established species. Species lying to the right of the vertical line would be rejected fortrade, and those to the left accepted. αBM is the benchmarkmodel, where VT=πVE, which implies that the cost of an actual, established species is approximately 20 times greater thanthe benefit of having an additional species in trade. All levels for α are listed in Table 1. The heuristic threshold corresponds to a decision threshold chosen by setting the true positiverate equal to the false positive rate.
2150 M. Springborn et al. / Ecological Economics 70 (2011) 2145–2153
for the ideal cutoff. However, first we present the fitted model for theobservations in the training data set juxtaposed with the economiccutoff to illustrate the connection between statistical and decisionmodel. In Fig. 1, the fitted estimates for the linear threat index fromEq. (0.13) for each species is given by its position on the horizontalaxis for the sample corrected approach. The true nature of eachspecies as either established (y=1) or not established (y=0) is givenby its position on the vertical axis (which is jittered slightly to helpdistinguish observations). The logistic probability model curve showshow each level of the indexmaps to the corresponding estimate of thetrue probability, pn.8 Recall that the probability cutoff c under ourbenchmark of α=1 is given by VT/VE=0.049. The resulting thresholdis depicted in Fig. 1 as a vertical solid line. Thresholds for alternativelevels of α and the simple heuristic approach are also presented.
To explain the simple heuristic and to support further discussion ofperformance we define the following notation common to applica-tions in signal detection theory. Recall that a represents the binaryclassification or prediction given by a risk assessment, where a=0indicates acceptance and a=1 rejection. The true positive rate (TPR)is the probability that a species is rejected given that the species istruly an establisher: TPR=Pr(a=1|y=1). The false positive rate(FPR) is the probability that a species is rejected despite its true natureas benign: FPR=Pr(a=1|y=0). By extension the true negative rate isgiven by TNR=Pr(a=0|y=0)=1−FPR, and the false negative rateby FNR=Pr(a=0|y=1)=1−TPR. The simple decision heuristic weconsider – proposed in the herpetofaunal screening setting byBomford et al. (2009) – involves setting the cutoff at the pointwhere TPR=TNR (or equivalently, FPR=FNR). We discuss this simpleheuristic further and specify the particular condition at which it isoptimal in Appendix B.
The implication for each threshold in Fig. 1 is that proposalslanding to the left of a threshold are accepted (p(x; θ)bc) while thoseto the right are rejected. The simple heuristic threshold falls betweenthe benchmark and αHI thresholds showing that it is consistent with aVT/πVE ratio of between 1 and 1.5.
Next we present the overall performance of the statistical modelsover the entire range of possible decision thresholds in Fig. 2. We usethe so-called “receiver operating characteristic” (ROC) curve to plot
8 While at first it may appear strange that the fitted logistic curve is so low to theright of approximately −2 (relative to the observations), the individual species asplotted here represent a substantial (roughly 13-fold) undersampling of failures (y=0)relative to the estimated population proportion, π.
the TPR as a function of the FPR. To generate the curve, for each of theobservations n∈{1, 2,…, N} from SN the TPR and TNR are calculated asif the cutoff c was set equal to the estimate of pn. A point in Fig. 2 ismore preferred the closer it is to the northwest corner of the plot—aperfect classifier would result in TPR=1 and FPR=0. The two ROCcurves correspond to the two statistical models estimated: (1) withREs (but without sample correction), and (2) with sample correction(but without REs).
For the most part, the REs model lies to the northwest of thesample correction model. This suggests that for most levels of theeconomic threshold, if the family of a proposed species is one that isincluded in SN, the REs model is preferred—the usefulness ofadditional information on family outweighs the sample bias. Howev-er, a drawback for the uncorrected REs model is that there is no directanalytical method for calculating the optimal cutoff level. This isbecause the fitted estimates of p(x; θ) in the uncorrected model arenot estimates of the true population probability that a species withcovariates given by xwill establish. Rather the uncorrected estimate ofp provides an estimate of the probability of y=1 in the context of theparticular stratified sample, SN, and therefore lacks a clear cardinalmeaning outside of that sample.
The optimal cutoff level for the correctedmodel is easily calculatedusing the expression in (0.12). To establish an economicallymotivated cutoff for the uncorrected model we adopt a numericalapproach: given a particular parameterization we identify the cutoffthat maximizes per species expected net benefits relative to the open-door baseline (ENBOD) as estimated in the sample. The level of ENBODis given by
ENBOD = Pr y=1ð Þ|fflfflfflfflfflffl{zfflfflfflfflfflffl}Probability that arandom speciesis an establisher
Pr y=1 jy=1� �
|fflfflfflfflfflfflfflfflfflfflfflfflffl{zfflfflfflfflfflfflfflfflfflfflfflfflffl}TPR
VE−VT½ �|fflfflfflfflffl{zfflfflfflfflffl}Net benefitof excludingan establisher
+ Pr y=0ð Þ|fflfflfflfflfflffl{zfflfflfflfflfflffl}Probability that arandom speciesis benign
Pr y=1 jy=0� �
|fflfflfflfflfflfflfflfflfflfflfflfflffl{zfflfflfflfflfflfflfflfflfflfflfflfflffl}FPR
−VT½ �|fflffl{zfflffl}Net benefit ofexcluding abenign species
= π⋅TPR⋅ VE−VT½ � + 1−π½ �⋅FPR⋅ −VT½ �:ð0:14Þ
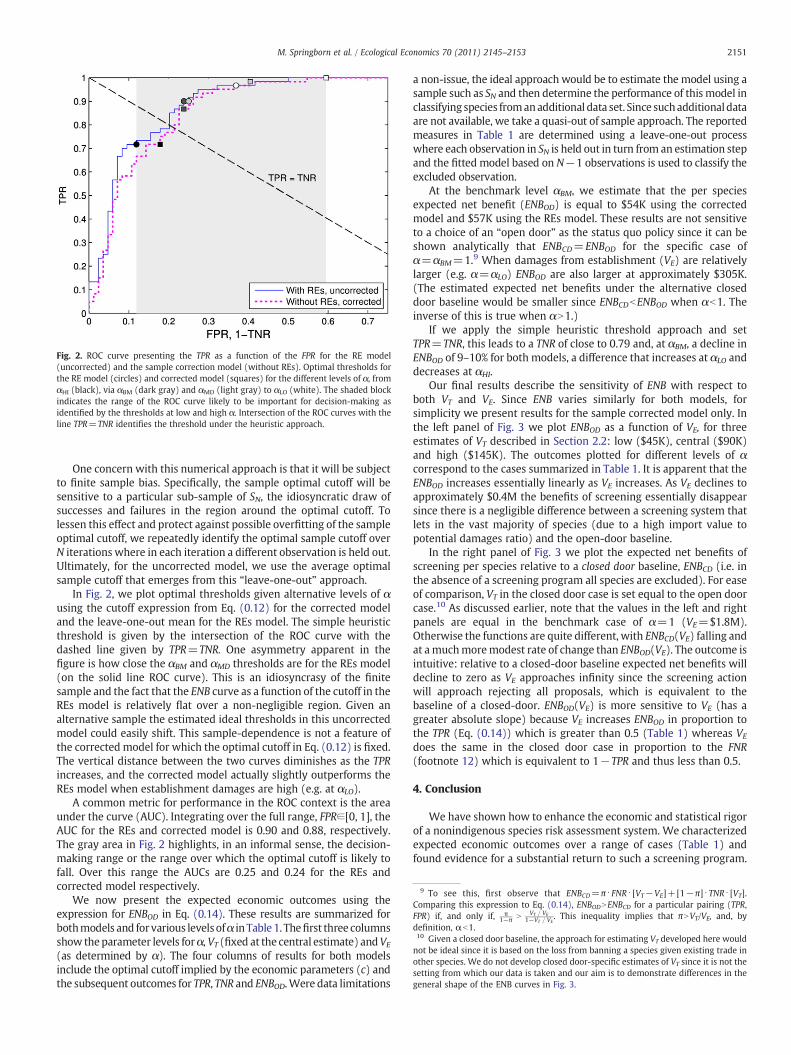
Fig. 2. ROC curve presenting the TPR as a function of the FPR for the RE model(uncorrected) and the sample correction model (without REs). Optimal thresholds forthe RE model (circles) and corrected model (squares) for the different levels of α, fromαHI (black), via αBM (dark gray) and αMD (light gray) to αLO (white). The shaded blockindicates the range of the ROC curve likely to be important for decision-making asidentified by the thresholds at low and high α. Intersection of the ROC curves with theline TPR=TNR identifies the threshold under the heuristic approach.
9 To see this, first observe that ENBCD=π ⋅FNR ⋅ [VT−VE]+[1−π] ⋅TNR ⋅ [VT].Comparing this expression to Eq. (0.14), ENBODNENBCD for a particular pairing (TPR,FPR) if, and only if, π
1−π N VT = VE1−VT = VE
. This inequality implies that πNVT/VE, and, bydefinition, αb1.10 Given a closed door baseline, the approach for estimating VT developed here wouldnot be ideal since it is based on the loss from banning a species given existing trade inother species. We do not develop closed door-specific estimates of VT since it is not thesetting from which our data is taken and our aim is to demonstrate differences in thegeneral shape of the ENB curves in Fig. 3.
2151M. Springborn et al. / Ecological Economics 70 (2011) 2145–2153
One concern with this numerical approach is that it will be subjectto finite sample bias. Specifically, the sample optimal cutoff will besensitive to a particular sub-sample of SN, the idiosyncratic draw ofsuccesses and failures in the region around the optimal cutoff. Tolessen this effect and protect against possible overfitting of the sampleoptimal cutoff, we repeatedly identify the optimal sample cutoff overN iterations where in each iteration a different observation is held out.Ultimately, for the uncorrected model, we use the average optimalsample cutoff that emerges from this “leave-one-out” approach.
In Fig. 2, we plot optimal thresholds given alternative levels of αusing the cutoff expression from Eq. (0.12) for the corrected modeland the leave-one-out mean for the REs model. The simple heuristicthreshold is given by the intersection of the ROC curve with thedashed line given by TPR=TNR. One asymmetry apparent in thefigure is how close the αBM and αMD thresholds are for the REs model(on the solid line ROC curve). This is an idiosyncrasy of the finitesample and the fact that the ENB curve as a function of the cutoff in theREs model is relatively flat over a non-negligible region. Given analternative sample the estimated ideal thresholds in this uncorrectedmodel could easily shift. This sample-dependence is not a feature ofthe corrected model for which the optimal cutoff in Eq. (0.12) is fixed.The vertical distance between the two curves diminishes as the TPRincreases, and the corrected model actually slightly outperforms theREs model when establishment damages are high (e.g. at αLO).
A common metric for performance in the ROC context is the areaunder the curve (AUC). Integrating over the full range, FPR∈[0, 1], theAUC for the REs and corrected model is 0.90 and 0.88, respectively.The gray area in Fig. 2 highlights, in an informal sense, the decision-making range or the range over which the optimal cutoff is likely tofall. Over this range the AUCs are 0.25 and 0.24 for the REs andcorrected model respectively.
We now present the expected economic outcomes using theexpression for ENBOD in Eq. (0.14). These results are summarized forbothmodels and forvarious levelsofα in Table 1. Thefirst three columnsshow theparameter levels forα, VT (fixed at the central estimate) andVE(as determined by α). The four columns of results for both modelsinclude the optimal cutoff implied by the economic parameters (c) andthe subsequent outcomes for TPR, TNR and ENBOD.Were data limitations
a non-issue, the ideal approach would be to estimate the model using asample such as SN and then determine the performance of this model inclassifying species fromanadditional data set. Since suchadditionaldataare not available, we take a quasi-out of sample approach. The reportedmeasures in Table 1 are determined using a leave-one-out processwhere each observation in SN is held out in turn from an estimation stepand the fitted model based on N−1 observations is used to classify theexcluded observation.
At the benchmark level αBM, we estimate that the per speciesexpected net benefit (ENBOD) is equal to $54K using the correctedmodel and $57K using the REs model. These results are not sensitiveto a choice of an “open door” as the status quo policy since it can beshown analytically that ENBCD=ENBOD for the specific case ofα=αBM=1.9 When damages from establishment (VE) are relativelylarger (e.g. α=αLO) ENBOD are also larger at approximately $305K.(The estimated expected net benefits under the alternative closeddoor baseline would be smaller since ENBCDbENBOD when αb1. Theinverse of this is true when αN1.)
If we apply the simple heuristic threshold approach and setTPR=TNR, this leads to a TNR of close to 0.79 and, at αBM, a decline inENBOD of 9–10% for both models, a difference that increases at αLO anddecreases at αHI.
Our final results describe the sensitivity of ENB with respect toboth VT and VE. Since ENB varies similarly for both models, forsimplicity we present results for the sample corrected model only. Inthe left panel of Fig. 3 we plot ENBOD as a function of VE, for threeestimates of VT described in Section 2.2: low ($45K), central ($90K)and high ($145K). The outcomes plotted for different levels of αcorrespond to the cases summarized in Table 1. It is apparent that theENBOD increases essentially linearly as VE increases. As VE declines toapproximately $0.4M the benefits of screening essentially disappearsince there is a negligible difference between a screening system thatlets in the vast majority of species (due to a high import value topotential damages ratio) and the open-door baseline.
In the right panel of Fig. 3 we plot the expected net benefits ofscreening per species relative to a closed door baseline, ENBCD (i.e. inthe absence of a screening program all species are excluded). For easeof comparison, VT in the closed door case is set equal to the open doorcase.10 As discussed earlier, note that the values in the left and rightpanels are equal in the benchmark case of α=1 (VE=$1.8M).Otherwise the functions are quite different, with ENBCD(VE) falling andat amuchmoremodest rate of change than ENBOD(VE). The outcome isintuitive: relative to a closed-door baseline expected net benefits willdecline to zero as VE approaches infinity since the screening actionwill approach rejecting all proposals, which is equivalent to thebaseline of a closed-door. ENBOD(VE) is more sensitive to VE (has agreater absolute slope) because VE increases ENBOD in proportion tothe TPR (Eq. (0.14)) which is greater than 0.5 (Table 1) whereas VE
does the same in the closed door case in proportion to the FNR(footnote 12) which is equivalent to 1−TPR and thus less than 0.5.
4. Conclusion
We have shown how to enhance the economic and statistical rigorof a nonindigenous species risk assessment system. We characterizedexpected economic outcomes over a range of cases (Table 1) andfound evidence for a substantial return to such a screening program.
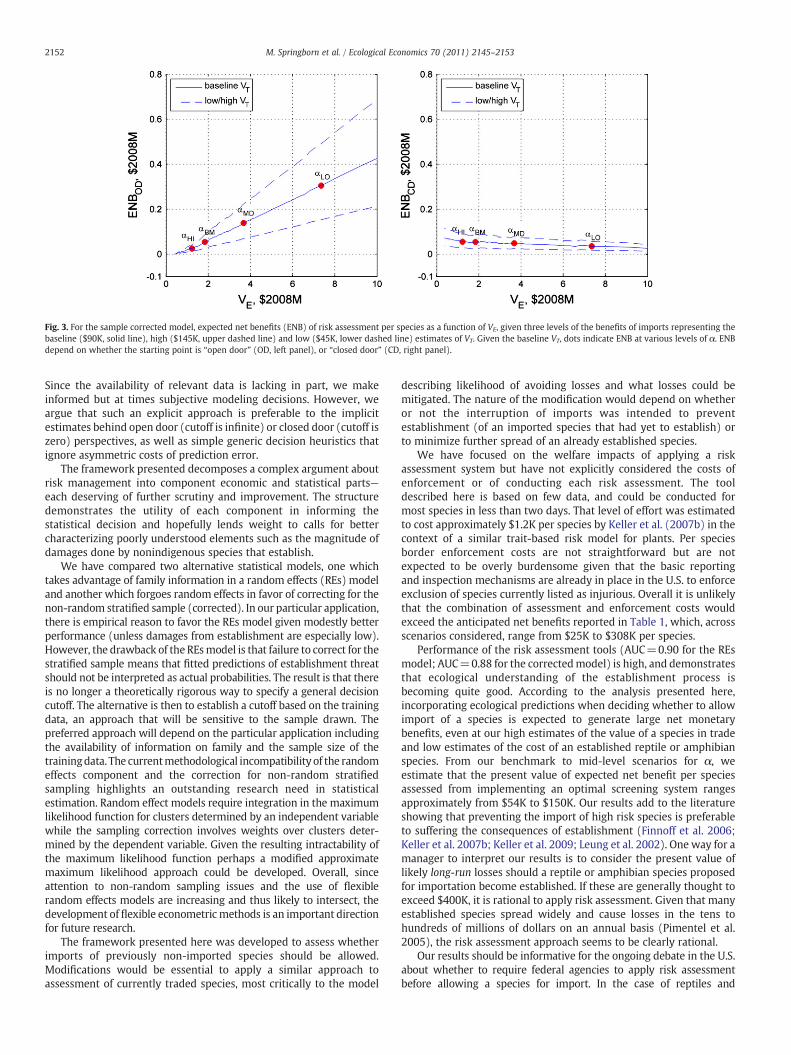
Fig. 3. For the sample corrected model, expected net benefits (ENB) of risk assessment per species as a function of VE, given three levels of the benefits of imports representing thebaseline ($90K, solid line), high ($145K, upper dashed line) and low ($45K, lower dashed line) estimates of VT. Given the baseline VT, dots indicate ENB at various levels of α. ENBdepend on whether the starting point is “open door” (OD, left panel), or “closed door” (CD, right panel).
2152 M. Springborn et al. / Ecological Economics 70 (2011) 2145–2153
Since the availability of relevant data is lacking in part, we makeinformed but at times subjective modeling decisions. However, weargue that such an explicit approach is preferable to the implicitestimates behind open door (cutoff is infinite) or closed door (cutoff iszero) perspectives, as well as simple generic decision heuristics thatignore asymmetric costs of prediction error.
The framework presented decomposes a complex argument aboutrisk management into component economic and statistical parts—each deserving of further scrutiny and improvement. The structuredemonstrates the utility of each component in informing thestatistical decision and hopefully lends weight to calls for bettercharacterizing poorly understood elements such as the magnitude ofdamages done by nonindigenous species that establish.
We have compared two alternative statistical models, one whichtakes advantage of family information in a random effects (REs) modeland another which forgoes random effects in favor of correcting for thenon-random stratified sample (corrected). In our particular application,there is empirical reason to favor the REs model given modestly betterperformance (unless damages from establishment are especially low).However, the drawback of the REsmodel is that failure to correct for thestratified sample means that fitted predictions of establishment threatshould not be interpreted as actual probabilities. The result is that thereis no longer a theoretically rigorous way to specify a general decisioncutoff. The alternative is then to establish a cutoff based on the trainingdata, an approach that will be sensitive to the sample drawn. Thepreferred approach will depend on the particular application includingthe availability of information on family and the sample size of thetrainingdata. The currentmethodological incompatibility of the randomeffects component and the correction for non-random stratifiedsampling highlights an outstanding research need in statisticalestimation. Random effect models require integration in the maximumlikelihood function for clusters determined by an independent variablewhile the sampling correction involves weights over clusters deter-mined by the dependent variable. Given the resulting intractability ofthe maximum likelihood function perhaps a modified approximatemaximum likelihood approach could be developed. Overall, sinceattention to non-random sampling issues and the use of flexiblerandom effects models are increasing and thus likely to intersect, thedevelopment of flexible econometric methods is an important directionfor future research.
The framework presented here was developed to assess whetherimports of previously non-imported species should be allowed.Modifications would be essential to apply a similar approach toassessment of currently traded species, most critically to the model
describing likelihood of avoiding losses and what losses could bemitigated. The nature of the modification would depend on whetheror not the interruption of imports was intended to preventestablishment (of an imported species that had yet to establish) orto minimize further spread of an already established species.
We have focused on the welfare impacts of applying a riskassessment system but have not explicitly considered the costs ofenforcement or of conducting each risk assessment. The tooldescribed here is based on few data, and could be conducted formost species in less than two days. That level of effort was estimatedto cost approximately $1.2K per species by Keller et al. (2007b) in thecontext of a similar trait-based risk model for plants. Per speciesborder enforcement costs are not straightforward but are notexpected to be overly burdensome given that the basic reportingand inspection mechanisms are already in place in the U.S. to enforceexclusion of species currently listed as injurious. Overall it is unlikelythat the combination of assessment and enforcement costs wouldexceed the anticipated net benefits reported in Table 1, which, acrossscenarios considered, range from $25K to $308K per species.
Performance of the risk assessment tools (AUC=0.90 for the REsmodel; AUC=0.88 for the correctedmodel) is high, and demonstratesthat ecological understanding of the establishment process isbecoming quite good. According to the analysis presented here,incorporating ecological predictions when deciding whether to allowimport of a species is expected to generate large net monetarybenefits, even at our high estimates of the value of a species in tradeand low estimates of the cost of an established reptile or amphibianspecies. From our benchmark to mid-level scenarios for α, weestimate that the present value of expected net benefit per speciesassessed from implementing an optimal screening system rangesapproximately from $54K to $150K. Our results add to the literatureshowing that preventing the import of high risk species is preferableto suffering the consequences of establishment (Finnoff et al. 2006;Keller et al. 2007b; Keller et al. 2009; Leung et al. 2002). One way for amanager to interpret our results is to consider the present value oflikely long-run losses should a reptile or amphibian species proposedfor importation become established. If these are generally thought toexceed $400K, it is rational to apply risk assessment. Given that manyestablished species spread widely and cause losses in the tens tohundreds of millions of dollars on an annual basis (Pimentel et al.2005), the risk assessment approach seems to be clearly rational.
Our results should be informative for the ongoing debate in the U.S.about whether to require federal agencies to apply risk assessmentbefore allowing a species for import. In the case of reptiles and
2153M. Springborn et al. / Ecological Economics 70 (2011) 2145–2153
amphibians, our results robustly suggest that such a policy is preferableto the effectively open-door policy that is currently maintained. Indeed,only one reptile species (brown treesnake), and no amphibians, arecurrently listed as injurious by the Lacey Act. This is consistent withprevious results that risk assessment for ornamental plant importsproduces net monetary benefits (Keller et al. 2007b). The extent towhich our quantitative results apply to other taxonomic groups is to bedetermined, but, given similarities in damages, the rates of establish-ment and progress in developing predictive threat models, there isreason to believe that such expected gains from risk assessment are notunique to reptiles and amphibians.
Acknowledgments
We are grateful to Anson Soderbery for knowledgeable assistancewith econometric estimates of the import model.
Appendix. Optimality and the Simple TNR=TPR Heuristic
The heuristic threshold, TNR=TPR, suggested by Bomford et al.(2009) is easily identifiedwhen TPR ismodeled as a function of the FPR, acommonrelationshipknownasa receiver operating characteristic (ROC)curve. Let the ROC curve for TPR as a function of FPR be represented byTPR= f(FPR). The sample realization of this curve is presented in Fig. 2along with a downward sloping straight line, TPR=TNR, where theheuristic is satisfied. The intersection of these two curves identifies thethreshold on the ROC curve that induces an outcome where TPR=TNR.We now consider when this is the optimal choice.
By construction, the ROC curve f(FPR) is always non-decreasing inFPR. For simple analytical intuition we assume that f(FPR) iscontinuous and concave. Given a finite sample these conditions willnot be strictly true but they are consistent with the typical overallshape of f(FPR) for our problem and in general (see the examples ofFawcett, 2006). Substituting f(FPR) into the objective function inEq. (0.14) and taking the derivative with respect to FPR, the first-ordercondition (FOC) for maximizing ENBOD is:
f ′ FPR�� �=
1−π½ �VT
π VE−VT½ � =1−π
α−1−π; ð0:14Þ
where FPR⁎ indicates the optimal level, and the second equalityfollows from the definition of α from Eq. (0.11). This conditionencodes the idea that it is optimal to keep making the threshold morestringent or exclusive until the incremental benefit from increasingthe TPR is equal to the incremental cost of increasing the FPR.
The heuristic of choosing a threshold to equate the TNR and TPR isoptimal onlywhen the slopeof theROCcurve is equal to (1−π)/(α−1−π)at the point where it intersects the line for which (TNR=TPR). If theslope f′ at this intersection is steeper, this implies that the incrementalcostof increasing the FPR (thenumerator of Eq. (0.14)) is relatively large,the FPR is inefficiently high, and the optimal threshold will be whereFPRbFNR. Conversely, if the slope is less than one, then the optimalthreshold will be where FPRbFNR. Under the benchmark case of α=1(i.e. when VT=πVE) then the FOC in Eq. (0.14) simplifies to f ' (FPR*)=1and the heuristic will be optimal when the ROC and TPR=1−FPRcurves are orthogonal.
References
Blonigen, B.A., Soderbery, A., 2010. Measuring the benefits of foreign product varietywith an accurate variety set. Journal of International Economics 82 (2), 168–180.
BLS, 2010. Updated CPI-U-RS, All Items and All items less food and energy, 1978–2009.Bureau of Labor and Statistics, U.S. Department of Labor. Retrieved from http://www.bls.gov/cpi/cpiurs1978_2009.pdf, 10 August 2010.
Bomford, M., 2008. Risk assessment Models for Establishment of Exotic Vertebrates inAustralia and New Zealand. Invasive Animals Cooperative Research Centre,Canberra.
Bomford, M., Kraus, F., Barry, S.C., Lawrence, E., 2009. Predicting establishment successfor alien reptiles and amphibians: a role for climate matching. Biological Invasions11 (3), 713–724.
Caley, P., Lonsdale, W.M., Pheloung, P.C., 2006. Quantifying uncertainty in predictions ofinvasiveness. Biological Invasions 8, 277–286.
Cosslett, S., 1993. Estimation from endogenously stratified samples. In: Maddala, G.S.,Rao, C.R., Vinod, H.D. (Eds.), Handbook of Statistics, Vol. 11.
Dehnen-Schmutz, K., Touza, J., Perrings, C., Williamson, M., 2007. The horticulturaltrade and ornamental plant invasions in Britain. Conservation Biology 21, 224–231.
Fawcett, T., 2006. An introduction to ROC analysis. Pattern Recognition Letters 27 (8),861–874.
Feenstra, R.C., 1994. New product varieties and the measurement of internationalprices. The American Economic Review 84 (1), 157–177.
Feenstra, R.C., 2010. Product Variety and the Gains from International Trade. MIT Press,Cambridge, MA.
Finnoff, D., Shogren, J.F., Leung, B., Lodge, D., 2006. Take a risk: preferring preventionover control of biological invaders. Ecological Economics 62, 216–222.
Fowler, A.J., Lodge, D.M., Hsia, J.F., 2007. Failure of the Lacey Act to protect U.S.ecosystems against animal invasions. Frontiers in Ecology and the Environment 5,353–359.
Imbens, G., Lancaster, T., 1996. Efficient estimation and stratified sampling. Journal ofEconometrics 74 (2), 289–318.
Just, R.E., Hueth, D.L., Schmitz, A., 2004. The Welfare Economics of Public Policy: APractical Approach to Project and Policy Evaluation. Edward Elgar Publishing,Cheltenham, UK.
Hayes, K.R., Barry, S.C., 2008. Are there any consistent predictors of invasion success?Biological Invasions 10, 483–506.
Hulme, P.E., 2009. Trade, transport and trouble: managing invasive species pathways inan era of globalization. Journal of Applied Ecology 46, 10–18.
Hummels, D., 1999. Have International Transportation Costs Declined? Mimeo,University of Chicago. Available at: https://www.gtap.agecon.purdue.edu/resources/download/1238.pdf
Keller, R.P., Drake, J.M., Lodge, D.M., 2007a. Fecundity as a basis for risk assessment ofnonindigenous freshwater molluscs. Conservation Biology 21, 191–200.
Keller, R.P., Lodge, D.M., Finnoff, D.C., 2007b. Risk assessment for invasive speciesproduces net bioeconomic benefits. Proceedings of the National Academy ofSciences of the United States of America 104, 203–207.
Keller, R.P., Lodge, D.M., Lewis, M.A., Shogren, J.F., 2009. Bioeconomics of InvasiveSpecies: Integrating Ecology, Economics, Policy and Management. Oxford Univer-sity Press, New York.
King, G., Zeng, L., 2001. Logistic regression in rare events data. Political Analysis 9,137–163.
Kolar, C.S., Lodge, D.M., 2002. Ecological predictions and risk assessment for alien fishesin North America. Science 298, 1233–1236.
Kopp, R., Krupnick, A., Toman, M., 1997. Cost–benefit analysis and regulatory reform.Human and Ecological Risk Assessment 3 (5), 787–852.
Leung, B., Lodge, D.M., Finnoff, D., Shogren, J.F., Lewis, M.A., Lamberti, G., 2002. An ounceof prevention or a pound of cure: bioeconomic risk analysis of invasive species.Proceedings of the Royal Society of London. Series B: Biological Sciences 269(1508), 2407–2413.
Lodge, D.M., Williams, S., MacIsaac, H.J., Hayes, K.R., Leung, B., Reichard, S., Mack, R.N.,Moyle, P.B., Smith, M., Andow, D.A., Carlton, J.T., McMichael, A., 2006. Biologicalinvasions: recommendations for U.S. policy and management. Ecological applica-tions 16, 2035–2054.
Manski, C.F., Lerman, S.R., 1977. The estimation of choice probabilities from choicebased samples. Econometrica 45 (8), 1977–1988.
Rabe-Hesketh, S., Skrondal, A., 2008. Multilevel and Longitudinal Modeling Using Stata.Stata Press, College Station, TX.
Romagosa, C.M., Guyer, C., Wooten, M.C., 2009. Contribution of the live-vertebrate tradetoward taxonomic homogenization. Conservation Biology 23, 1001–1007.
Smith, K., Behrens, M., Schloegel, L.M., Marano, N., Burgiel, S., Daszak, P., 2009. Reducingthe risks of the wildlife trade. Science 324, 594–595.
Tomz, M., King, G., Zeng, L., 1999. ReLogit: Rare Events Logistic Regression. Retrievedfrom http://gking.harvard.edu/stats.shtml, 22 August 2010.
USDOC, 2010. Foreign Trade Statistics, U.S. Department of Commerce, U.S. CensusBureau. Retrieved from http://www.fas.usda.gov/gats/default.aspx, 18 July 2010.
USFWS (US Fish and Wildlife Service), 2010. Injurious Wildlife Species; Listing theBoa Constrictor, Four Python Species, and Four Anaconda Species as InjuriousReptiles. Federal Register 75: 11808. Retrieved from www.regulations.gov,Docket No. FWS-R9-FHC-2008-0015, 18 October 2010.


![California Aquatic Invasive Species Management Plan1].pdfactivities other than the purposeful or intentional introduction of the species involved, such as the transport of nonindigenous](https://img.pdfslide.net/doc/110x75/5f92078b8c4d3e351e19d7e0/california-aquatic-invasive-species-management-1pdf-activities-other-than-the.jpg)