Embed Size (px)
Citation preview

JOTS U M M E R 2 0 1 4 V O L U M E 9 N U M B E R 3W W W . I I J O T . C O M
The Voices of Influence | iijournals.com
THE JOURNAL OF TRADING SUMMER 2014
Predicting Intraday Trading Volume and Volume PercentagesVENKATESH SATISH, ABHAY SAXENA, AND MAX PALMER
VENKATESH SATISH
is a vice president at FlexTrade Systems in Great Neck, [email protected]
ABHAY SAXENA
is a vice president at FlexTrade Systems in Great Neck, [email protected]
MAX PALMER
is head of trading analytics and algorithms at Flex-Trade Systems in Great Neck, [email protected]
This article discusses recent tech-niques and results in the area of forecasting intraday volume and intraday volume percentages. Why
predict volume? A major reason is to improve the performance of trading algorithms, many of which depend upon the volume that will trade while the order is active. Traditionally, algorithms used historical averages when they needed to predict volume over the lifetime on an order. Improving upon this base case boosts the performance of the algorithm. In our study, we have shown that to be the case, and present our results in this article.
Volume predictions are also useful in situations where an algorithm may not be involved. One example is where a trader receives a large order in an unknown (to the trader) symbol 10 minutes before the close, with instructions to participate at all points to the close. In this situation, knowing average daily trading volume is of no value, while an accurate volume prediction for those final 10 minutes of the trading day would be very helpful. Our example trader would like to know the number of shares that will trade during that 10-minute interval. We refer to this as a forecast of raw volume. Knowing upcoming raw volume is also of interest for a large group of algorithms, such as market participation models and portfolio trade scheduling tools, the latter of which gener-
ally use implicit volume forecasts within their cost models.
Improved volume forecasts aid alpha capture. Consider an alpha engine that continuously computes expected alpha tra-jectories for various stocks. Traders face an allocation problem in that they must maxi-mize alpha capture without creating price impact. Applying sophisticated optimization tools to this problem while incorporating accurate volume forecasts simultaneously increases trading strategy capacity (and alpha), controls trading risk, and manages slippage.
Certain other algorithms, volume-weighted average price (VWAP) in particular, benefit from an accurate forecast of how much volume will trade in a given time interval as a percentage of the full day’s trading volume. We call these volume percentage forecasts, and they represent a different type of prediction problem than forecasting raw volume. This is easily seen in the context of the constraint imposed on forecasting volume percentages. Forecasts made early in the day constrain sub-sequent forecasts, as the day’s forecasts must total to 100% to be meaningful. Hence, a volume percentage forecast model is less able than a raw volume model to adapt to intraday news and other events.
Our focus is the intraday forecasting of raw volume and volume percentages for fixed intervals of time from the present moment
JOT-SATISH.indd 15JOT-SATISH.indd 15 6/13/14 8:16:05 PM6/13/14 8:16:05 PM
PREDICTING INTRADAY TRADING VOLUME AND VOLUME PERCENTAGES SUMMER 2014
until market close. To measure and understand the per-formance of our models, we have developed a standard set of performance metrics for volume prediction and volume analysis studies.
When predicting volume, convention is to refer-ence historical averages as the base case. Relative to that base case, we show improvements in the prediction of raw volume of 29%. In the case of volume percentages, we improved over the base case by 7%. More importantly, we show that using our predictive volume percentages improves the performance of a VWAP algorithm, rela-tive to using historical averages, by 9%. These results are based on a larger set of symbols and a longer period of time than those used by prior published works.
The next section introduces terms we use throughout the article. We then define the metrics we used to measure our forecasts and argue that these—or equivalent measures—represent the best way to measure performance. From there, we discuss our models and results. A section on prior published work then follows and precedes our summary of results.
TERMS AND DEFINITIONS
VWAP Tracking Error
VWAP tracking error measures the performance of an order with a VWAP benchmark. Tracking error is measured in basis points or percentage deviation from VWAP, where the absolute value of the deviation is mea-sured. The VWAP tracking error is defined as follows:
VWAP
VWAP Executed_Order_AveAA rage_Price
VWAP
Tracking Error
obP served
obP served
=−
If the error is expressed in percentages, the quan-tity is multiplied by 100. If expressed in basis points, the quantity is multiplied by 10,000. In this expression and throughout the article, |a| indicates the absolute value of the quantity a.
Interval Selection
Forecasting volume requires answering the ques-tion: Over what interval of time is volume predicted? The shorter the interval of time, the greater will be the
variance in the forecast. This is expected, because pre-dicting volume over increasingly shorter intervals results in the capture of one or a few trades per time interval. One of those trades could either be a block or an odd lot. As the volume measured in such small intervals varies greatly, so will the variance of the estimate produced.
The interval of time over which volume is pre-dicted should be commensurate with the use of the prediction. Our goal is to improve the performance of volume-dependent trading algorithms. Most of these algorithms use time intervals from 5 to 15 minutes, with the exception of time periods close to the open and close. We conducted studies over this range of values for individual bins, obtaining results that were consistent across that range of values. The work in this article is based upon 15-minute bins, and there are 26 such bins in a trading day.
Throughout the article, we use the term “interval” and “bin” as synonyms.
Historical Window Average/Rolling Means
This term refers to the conventional method of constructing both volume forecasts and percentage volume traded forecasts. One chooses the number of days of historical data to use, a variable that we shall call N, and then uses the prior N days of volume data to construct an arithmetic average of the volume traded in a given bin over those N days. The same technique applies to constructing volume percentage bins. This is often called the classical approach.
In-Sample and Out-of-Sample Data
In modeling methodology, in-sample refers to the portion of the observed data used to derive parameters or estimates that are then applied to data outside of the range tested. In-sample data are used to suggest models, compare approaches, or train various model inputs. Out-of-sample refers to a distinct dataset over which trained models are validated.
VOLUME PREDICTION METRICS
In reviewing prior works on volume prediction (see later section), we noticed that there were multiple performance metrics used. In this section, we introduce the metrics we used in our analysis and discuss why
JOT-SATISH.indd 16JOT-SATISH.indd 16 6/13/14 8:16:05 PM6/13/14 8:16:05 PM
THE JOURNAL OF TRADING SUMMER 2014
we believe these metrics are good standards for volume forecasting.
Measuring Raw Volume Predictions—MAPE
Our measure for predicting raw volume is the mean absolute percentage error, or MAPE. Mathemati-cally, the measure is expressed as follows:
=
× Σ =
MAPE
100%1 Predicted_Volume R− aw Vw olume
Raw_Volume1iN i
N i iRaw_ Vw olume
where the index, i, runs over all bins and N is the total number of bins.
For each bin, MAPE calculates the absolute value of the error normalized by the raw trading volume and then takes the average of these quantities over all bins. Multiplying by 100 expresses the final result as a percentage.
We believe that MAPE is the appropriate bench-mark for measuring volume forecast error, provided that checks are made to ensure that performance improve-ments are consistent across symbols, time of day, and classifiers such as industry membership and beta decile. Additionally, we consider MAPE the best measure of VWAP tracking error.
Measuring Percentage Volume Predictions—Absolute Deviation
The measure we use to evaluate forecasts of volume percentage is similar to MAPE, save for one item. In MAPE, one normalizes the absolute deviation by dividing by the raw quantity traded in that bin. Per-centage predictions are, in effect, already normalized, since they sum to 100. Thus, we leave off the normaliza-tion factor and use the following function to measure percentage prediction error:
= Σ −=
Error
1Predicted_Percentage Actual Percentage1N i
Ni iActual_Percentage
where the index i runs over all bins and N is the total number of bins.
We choose our metric for volume percentage error to better relate volume percentage error to VWAP tracking error. In our view, a perfect volume percentage forecast should evaluate to zero VWAP tracking error. In turn, this property allows us to fit the relationship between percentage error and VWAP tracking error without an intercept. In other words, we can (and later, we do) conceptually consider a model including the origin when plotting volume percentage error versus VWAP tracking error. We use this to better under-stand how percentage forecasts reduce VWAP tracking error.
RAW VOLUME FORECAST METHODOLOGY
With metrics and terminology in hand, we now discuss the methodology and model used to forecast raw volume and volume percentages.
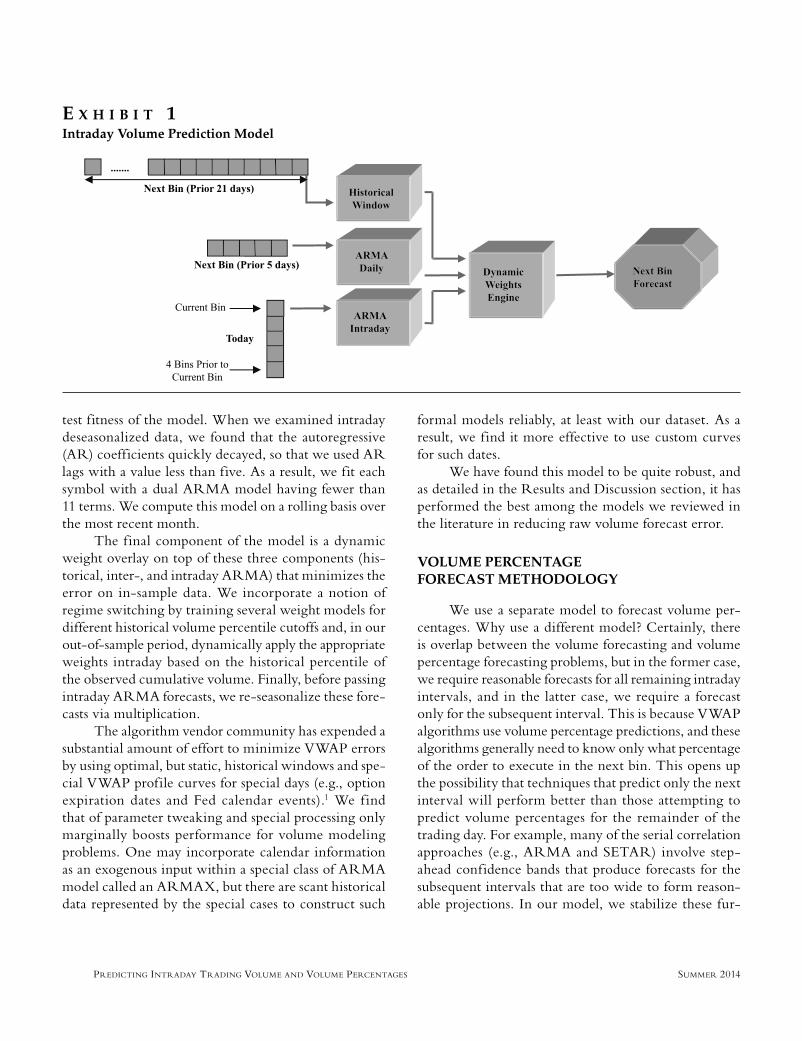
The raw volume forecast model consists of four components, see Exhibit 1, which shows the process of predicting the volume in the next 15-minute bin from the current 15-minute bin. The first component is a rolling historical average for the volume trading in a 15-minute bin. Remember that this is the classical model used to predict volume. We add to this a per-symbol, per-bin ARMA (autoregressive moving average) model ref lecting the serial correlation observable across daily volumes. We use nearly standard ARMA model-fitting techniques relying on maximum-likelihood estimation, which selects an ARMA (p, q) model minimizing an Akaike information criterion (AIC) as the test for the best model. In fitting the ARMA model, we consider all values of p and q lags through five, as well as a constant term. We depart from the standard technique in using the corrected AIC, symbolized by AIC
c, as detailed by
Hurvich and Tsai [1989, 1993]. AICc adds a penalty
term to AIC for extra AR and MA terms. This penalty term encourages model parsimony and averts overfitting when dealing with small sample sizes. This approach mirrors our own experience in trading, where we have not observed persistence of volume aberrations over a large number of days.
Next, we fit an additional ARMA (p, q) model over deseasonalized intraday bin volume data. The intraday data are deseasonalized by dividing by the intraday amount of volume traded in that bin over the trailing six months. We again follow the standard ARMA modeling approach with the exception of our use of the AIC
c to
JOT-SATISH.indd 17JOT-SATISH.indd 17 6/13/14 8:16:05 PM6/13/14 8:16:05 PM
PREDICTING INTRADAY TRADING VOLUME AND VOLUME PERCENTAGES SUMMER 2014
test fitness of the model. When we examined intraday deseasonalized data, we found that the autoregressive (AR) coefficients quickly decayed, so that we used AR lags with a value less than five. As a result, we fit each symbol with a dual ARMA model having fewer than 11 terms. We compute this model on a rolling basis over the most recent month.
The final component of the model is a dynamic weight overlay on top of these three components (his-torical, inter-, and intraday ARMA) that minimizes the error on in-sample data. We incorporate a notion of regime switching by training several weight models for different historical volume percentile cutoffs and, in our out-of-sample period, dynamically apply the appropriate weights intraday based on the historical percentile of the observed cumulative volume. Finally, before passing intraday ARMA forecasts, we re-seasonalize these fore-casts via multiplication.
The algorithm vendor community has expended a substantial amount of effort to minimize VWAP errors by using optimal, but static, historical windows and spe-cial VWAP profile curves for special days (e.g., option expiration dates and Fed calendar events).1 We f ind that of parameter tweaking and special processing only marginally boosts performance for volume modeling problems. One may incorporate calendar information as an exogenous input within a special class of ARMA model called an ARMAX, but there are scant historical data represented by the special cases to construct such
formal models reliably, at least with our dataset. As a result, we find it more effective to use custom curves for such dates.
We have found this model to be quite robust, and as detailed in the Results and Discussion section, it has performed the best among the models we reviewed in the literature in reducing raw volume forecast error.
VOLUME PERCENTAGE FORECAST METHODOLOGY
We use a separate model to forecast volume per-centages. Why use a different model? Certainly, there is overlap between the volume forecasting and volume percentage forecasting problems, but in the former case, we require reasonable forecasts for all remaining intraday intervals, and in the latter case, we require a forecast only for the subsequent interval. This is because VWAP algorithms use volume percentage predictions, and these algorithms generally need to know only what percentage of the order to execute in the next bin. This opens up the possibility that techniques that predict only the next interval will perform better than those attempting to predict volume percentages for the remainder of the trading day. For example, many of the serial correlation approaches (e.g., ARMA and SETAR) involve step-ahead confidence bands that produce forecasts for the subsequent intervals that are too wide to form reason-able projections. In our model, we stabilize these fur-
E X H I B I T 1Intraday Volume Prediction Model
JOT-SATISH.indd 18JOT-SATISH.indd 18 6/13/14 8:16:06 PM6/13/14 8:16:06 PM
THE JOURNAL OF TRADING SUMMER 2014
ther-out forecasts with the inclusion of the non-intraday ARMA components and the dynamic weighting model. After reviewing published literature on the subject, we focused on an approach developed by Humphery-Jenner [2011] that the author terms dynamic VWAP. We did so because it was validated on an extensive dataset (200 ASX names), achieved strong results, contained safety measures (self-updating deviation limits and switch-off parameters), and transparently substantiates its meth-odology. The idea behind this approach is that volume surprises based on a naïve volume forecast model can be used to train a rolling regression model that adjusts market participation.
We were able to successfully replicate Humphery-Jenner’s results on two years of NYSE TAQ data on the top 500 stocks by dollar volume. After identifying the key drivers of forecasting performance in our in-sample data, we were able to perform extensive model opti-mization over that first year of data. We extended his work in a number of ways: 1) we were able to identify the optimal number of model terms for U.S. stocks in our in-sample data; 2) we developed a separate method to compute the deviation bounds; and 3) we were able to test other models for the purpose of computing decomposed volumes (volume surprises). For example, we could apply our more extensive volume forecasting model described previously as the base model from which to compute volume surprises. We tested our volume percentage methodology in 5- and 30-minute intervals and present results of the final year of the sample in the next section.
RESULTS AND DISCUSSION
Following are the results we achieved in reducing raw volume and percentage volume forecasting errors. But f irst we demonstrate that reducing volume per-centage errors does in fact reduce VWAP tracking error.
Validating Volume Percentage Prediction Error
A key question at the outset of our investigation was whether reducing errors in volume percentage forecasts translated into a reduction in realized VWAP execution error. As experienced traders know, many
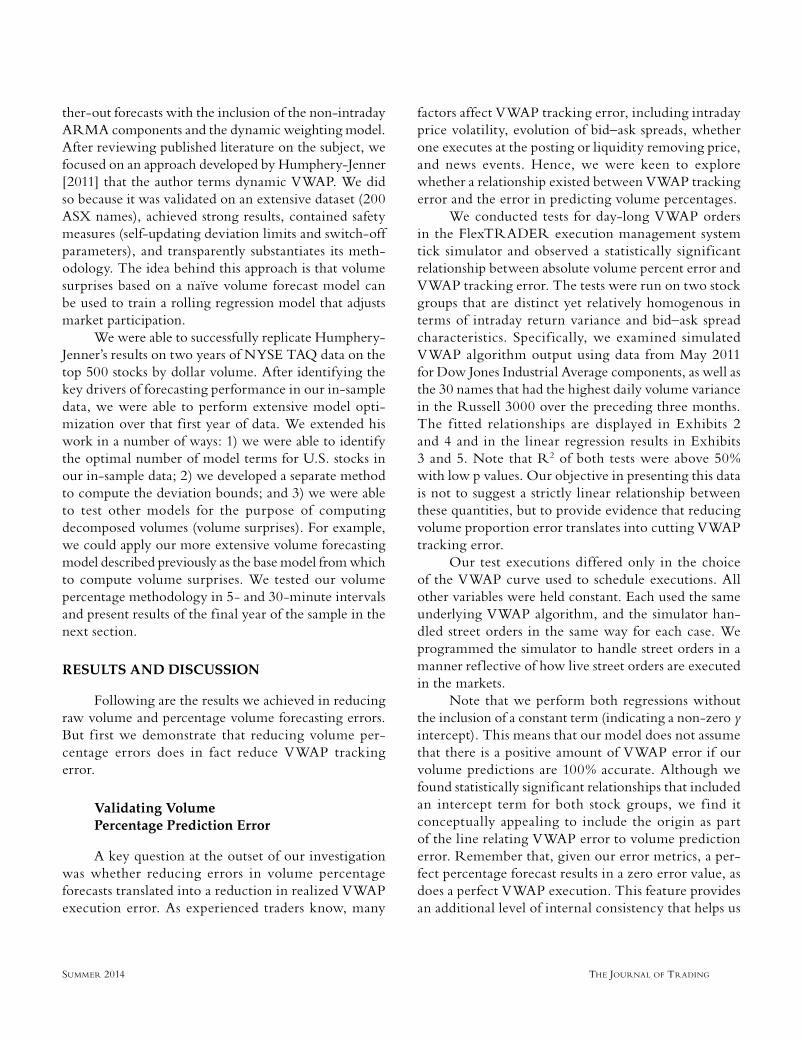
factors affect VWAP tracking error, including intraday price volatility, evolution of bid–ask spreads, whether one executes at the posting or liquidity removing price, and news events. Hence, we were keen to explore whether a relationship existed between VWAP tracking error and the error in predicting volume percentages.
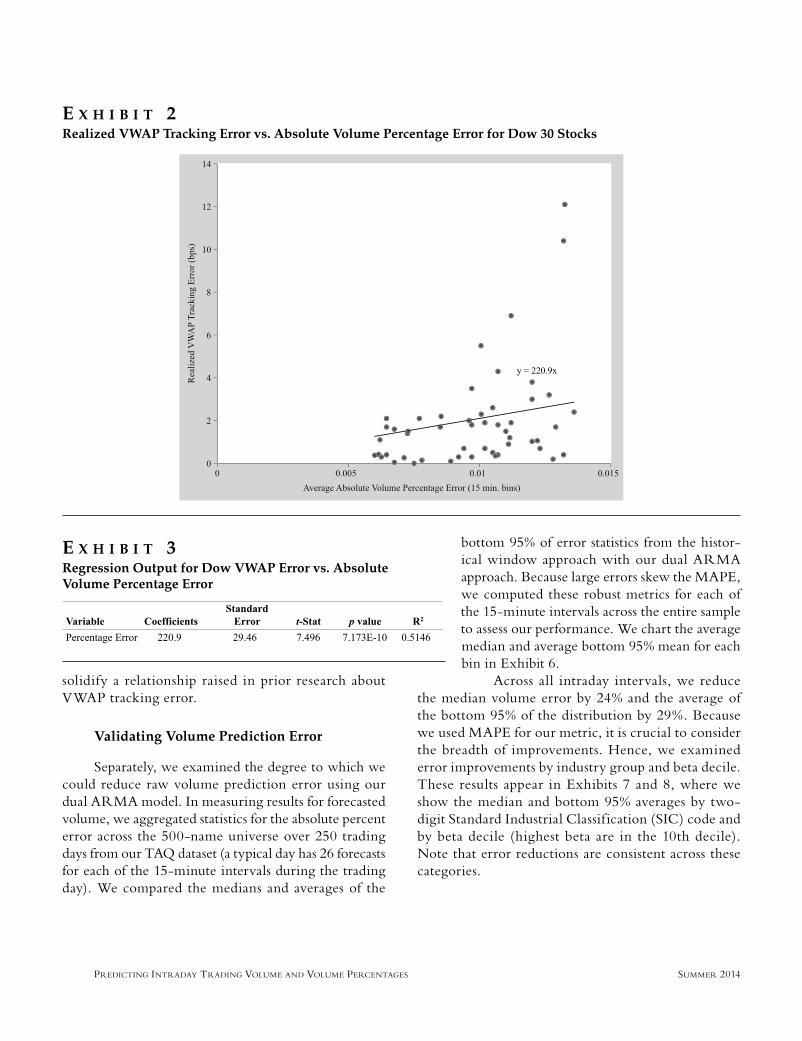
We conducted tests for day-long VWAP orders in the FlexTRADER execution management system tick simulator and observed a statistically signif icant relationship between absolute volume percent error and VWAP tracking error. The tests were run on two stock groups that are distinct yet relatively homogenous in terms of intraday return variance and bid–ask spread characteristics. Specif ically, we examined simulated VWAP algorithm output using data from May 2011 for Dow Jones Industrial Average components, as well as the 30 names that had the highest daily volume variance in the Russell 3000 over the preceding three months. The f itted relationships are displayed in Exhibits 2 and 4 and in the linear regression results in Exhibits 3 and 5. Note that R2 of both tests were above 50% with low p values. Our objective in presenting this data is not to suggest a strictly linear relationship between these quantities, but to provide evidence that reducing volume proportion error translates into cutting VWAP tracking error.
Our test executions differed only in the choice of the VWAP curve used to schedule executions. All other variables were held constant. Each used the same underlying VWAP algorithm, and the simulator han-dled street orders in the same way for each case. We programmed the simulator to handle street orders in a manner ref lective of how live street orders are executed in the markets.
Note that we perform both regressions without the inclusion of a constant term (indicating a non-zero y intercept). This means that our model does not assume that there is a positive amount of VWAP error if our volume predictions are 100% accurate. Although we found statistically significant relationships that included an intercept term for both stock groups, we f ind it conceptually appealing to include the origin as part of the line relating VWAP error to volume prediction error. Remember that, given our error metrics, a per-fect percentage forecast results in a zero error value, as does a perfect VWAP execution. This feature provides an additional level of internal consistency that helps us
JOT-SATISH.indd 19JOT-SATISH.indd 19 6/13/14 8:16:06 PM6/13/14 8:16:06 PM
PREDICTING INTRADAY TRADING VOLUME AND VOLUME PERCENTAGES SUMMER 2014
solidify a relationship raised in prior research about VWAP tracking error.
Validating Volume Prediction Error
Separately, we examined the degree to which we could reduce raw volume prediction error using our dual ARMA model. In measuring results for forecasted volume, we aggregated statistics for the absolute percent error across the 500-name universe over 250 trading days from our TAQ dataset (a typical day has 26 forecasts for each of the 15-minute intervals during the trading day). We compared the medians and averages of the
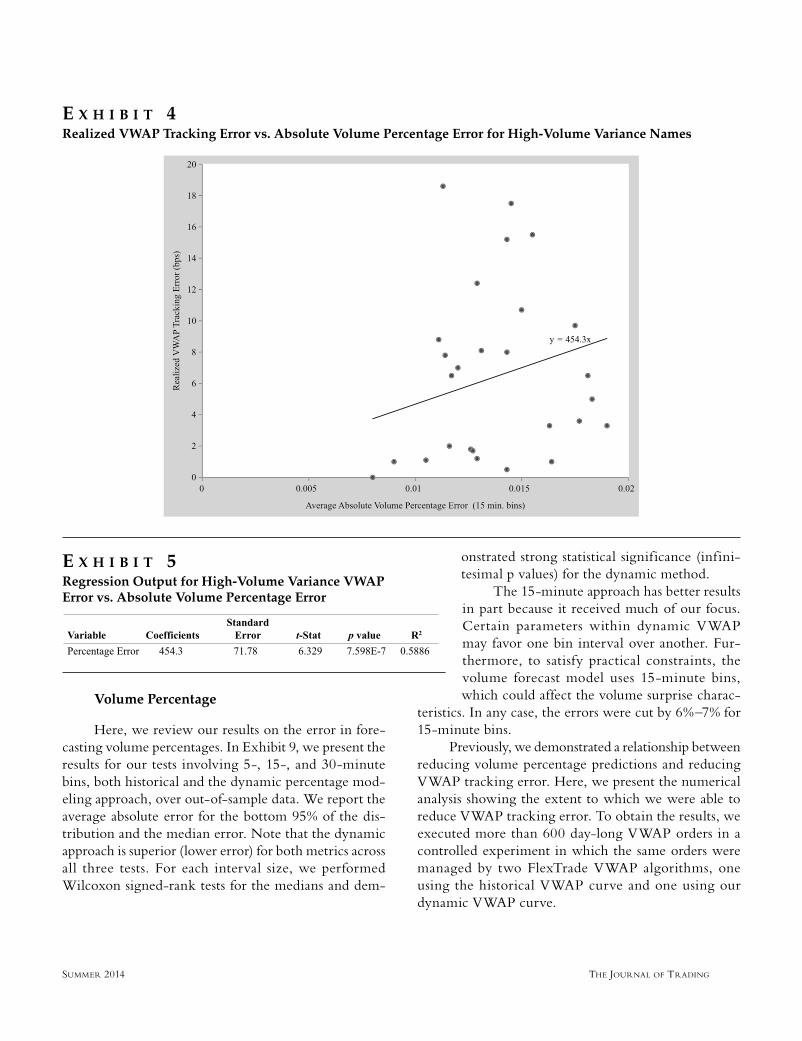
bottom 95% of error statistics from the histor-ical window approach with our dual ARMA approach. Because large errors skew the MAPE, we computed these robust metrics for each of the 15-minute intervals across the entire sample to assess our performance. We chart the average median and average bottom 95% mean for each bin in Exhibit 6.
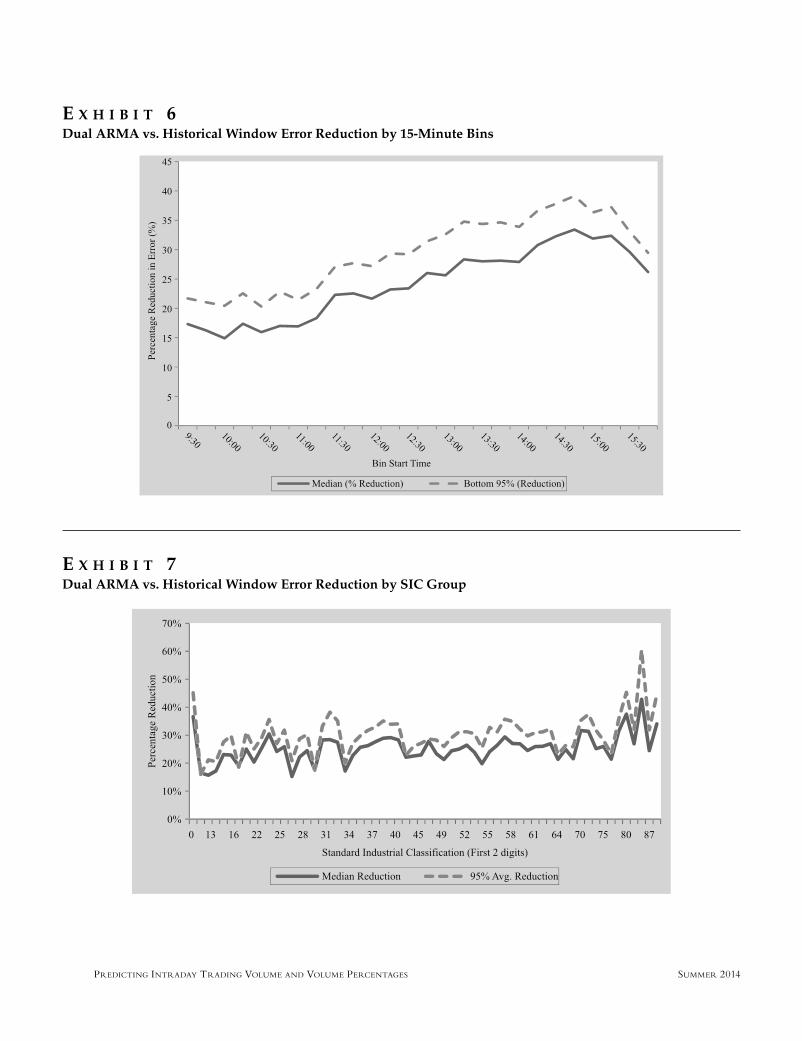
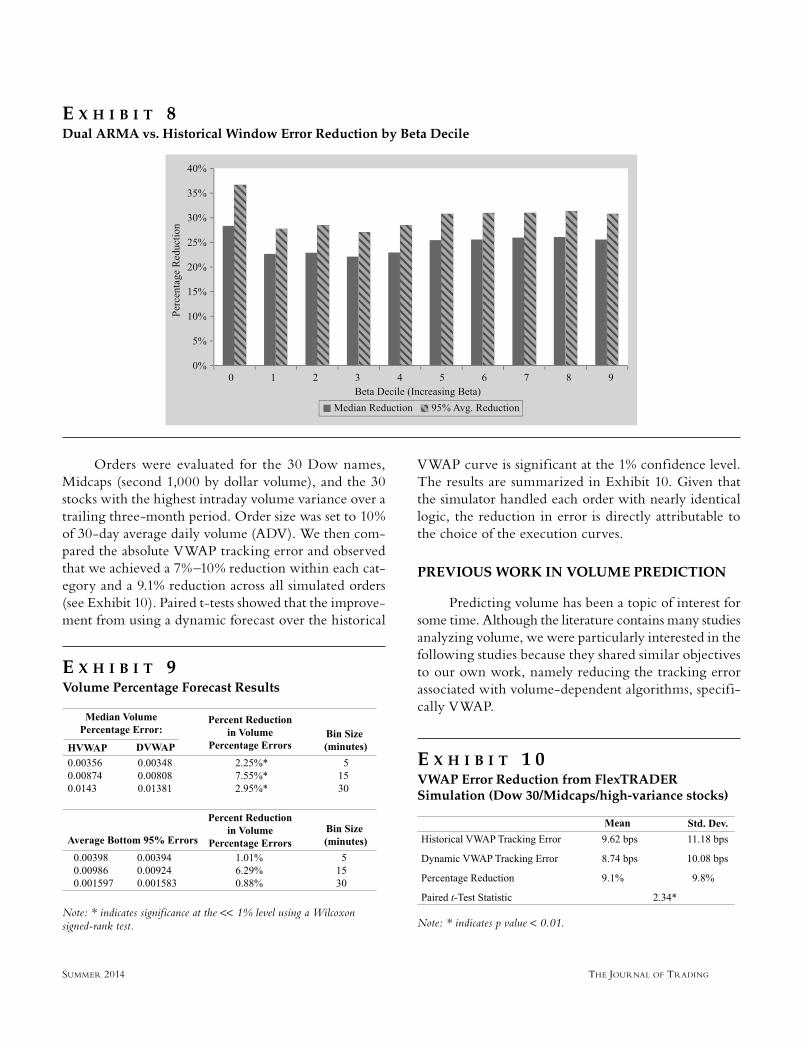
Across all intraday intervals, we reduce the median volume error by 24% and the average of the bottom 95% of the distribution by 29%. Because we used MAPE for our metric, it is crucial to consider the breadth of improvements. Hence, we examined error improvements by industry group and beta decile. These results appear in Exhibits 7 and 8, where we show the median and bottom 95% averages by two-digit Standard Industrial Classif ication (SIC) code and by beta decile (highest beta are in the 10th decile). Note that error reductions are consistent across these categories.
E X H I B I T 3Regression Output for Dow VWAP Error vs. Absolute Volume Percentage Error
E X H I B I T 2Realized VWAP Tracking Error vs. Absolute Volume Percentage Error for Dow 30 Stocks
JOT-SATISH.indd 20JOT-SATISH.indd 20 6/13/14 8:16:06 PM6/13/14 8:16:06 PM
THE JOURNAL OF TRADING SUMMER 2014
Volume Percentage
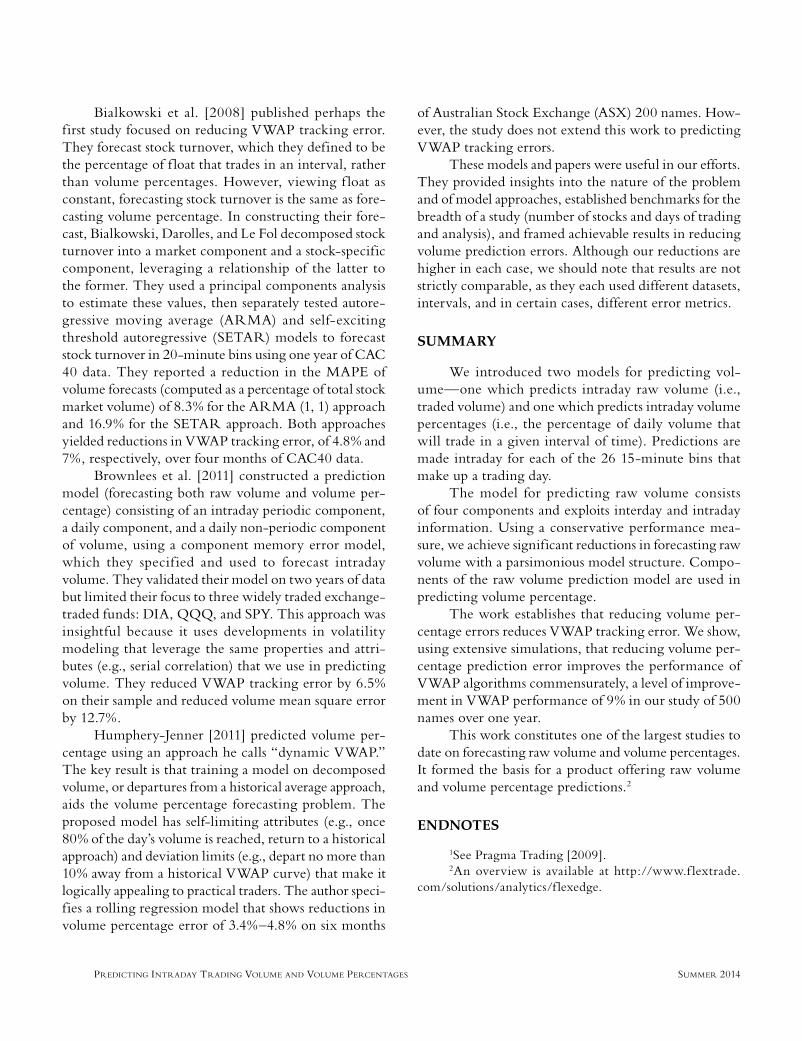
Here, we review our results on the error in fore-casting volume percentages. In Exhibit 9, we present the results for our tests involving 5-, 15-, and 30-minute bins, both historical and the dynamic percentage mod-eling approach, over out-of-sample data. We report the average absolute error for the bottom 95% of the dis-tribution and the median error. Note that the dynamic approach is superior (lower error) for both metrics across all three tests. For each interval size, we performed Wilcoxon signed-rank tests for the medians and dem-
onstrated strong statistical significance (infini-tesimal p values) for the dynamic method.
The 15-minute approach has better results in part because it received much of our focus. Certain parameters within dynamic VWAP may favor one bin interval over another. Fur-thermore, to satisfy practical constraints, the volume forecast model uses 15-minute bins, which could affect the volume surprise charac-
teristics. In any case, the errors were cut by 6%–7% for 15-minute bins.
Previously, we demonstrated a relationship between reducing volume percentage predictions and reducing VWAP tracking error. Here, we present the numerical analysis showing the extent to which we were able to reduce VWAP tracking error. To obtain the results, we executed more than 600 day-long VWAP orders in a controlled experiment in which the same orders were managed by two FlexTrade VWAP algorithms, one using the historical VWAP curve and one using our dynamic VWAP curve.
E X H I B I T 4Realized VWAP Tracking Error vs. Absolute Volume Percentage Error for High-Volume Variance Names
E X H I B I T 5Regression Output for High-Volume Variance VWAP Error vs. Absolute Volume Percentage Error
JOT-SATISH.indd 21JOT-SATISH.indd 21 6/13/14 8:16:07 PM6/13/14 8:16:07 PM
PREDICTING INTRADAY TRADING VOLUME AND VOLUME PERCENTAGES SUMMER 2014
E X H I B I T 6Dual ARMA vs. Historical Window Error Reduction by 15-Minute Bins
E X H I B I T 7Dual ARMA vs. Historical Window Error Reduction by SIC Group
JOT-SATISH.indd 22JOT-SATISH.indd 22 6/13/14 8:16:07 PM6/13/14 8:16:07 PM
THE JOURNAL OF TRADING SUMMER 2014
Orders were evaluated for the 30 Dow names, Midcaps (second 1,000 by dollar volume), and the 30 stocks with the highest intraday volume variance over a trailing three-month period. Order size was set to 10% of 30-day average daily volume (ADV). We then com-pared the absolute VWAP tracking error and observed that we achieved a 7%–10% reduction within each cat-egory and a 9.1% reduction across all simulated orders (see Exhibit 10). Paired t-tests showed that the improve-ment from using a dynamic forecast over the historical
VWAP curve is significant at the 1% confidence level. The results are summarized in Exhibit 10. Given that the simulator handled each order with nearly identical logic, the reduction in error is directly attributable to the choice of the execution curves.
PREVIOUS WORK IN VOLUME PREDICTION
Predicting volume has been a topic of interest for some time. Although the literature contains many studies analyzing volume, we were particularly interested in the following studies because they shared similar objectives to our own work, namely reducing the tracking error associated with volume-dependent algorithms, specifi-cally VWAP.
E X H I B I T 8Dual ARMA vs. Historical Window Error Reduction by Beta Decile
E X H I B I T 9Volume Percentage Forecast Results
Note: * indicates significance at the << 1% level using a Wilcoxon signed-rank test.
E X H I B I T 1 0VWAP Error Reduction from FlexTRADER Simulation (Dow 30/Midcaps/high-variance stocks)
Note: * indicates p value < 0.01.
JOT-SATISH.indd 23JOT-SATISH.indd 23 6/13/14 8:16:08 PM6/13/14 8:16:08 PM
PREDICTING INTRADAY TRADING VOLUME AND VOLUME PERCENTAGES SUMMER 2014
Bialkowski et al. [2008] published perhaps the first study focused on reducing VWAP tracking error. They forecast stock turnover, which they defined to be the percentage of f loat that trades in an interval, rather than volume percentages. However, viewing f loat as constant, forecasting stock turnover is the same as fore-casting volume percentage. In constructing their fore-cast, Bialkowski, Darolles, and Le Fol decomposed stock turnover into a market component and a stock-specific component, leveraging a relationship of the latter to the former. They used a principal components analysis to estimate these values, then separately tested autore-gressive moving average (ARMA) and self-exciting threshold autoregressive (SETAR) models to forecast stock turnover in 20-minute bins using one year of CAC 40 data. They reported a reduction in the MAPE of volume forecasts (computed as a percentage of total stock market volume) of 8.3% for the ARMA (1, 1) approach and 16.9% for the SETAR approach. Both approaches yielded reductions in VWAP tracking error, of 4.8% and 7%, respectively, over four months of CAC40 data.
Brownlees et al. [2011] constructed a prediction model (forecasting both raw volume and volume per-centage) consisting of an intraday periodic component, a daily component, and a daily non-periodic component of volume, using a component memory error model, which they specif ied and used to forecast intraday volume. They validated their model on two years of data but limited their focus to three widely traded exchange-traded funds: DIA, QQQ, and SPY. This approach was insightful because it uses developments in volatility modeling that leverage the same properties and attri-butes (e.g., serial correlation) that we use in predicting volume. They reduced VWAP tracking error by 6.5% on their sample and reduced volume mean square error by 12.7%.
Humphery-Jenner [2011] predicted volume per-centage using an approach he calls “dynamic VWAP.” The key result is that training a model on decomposed volume, or departures from a historical average approach, aids the volume percentage forecasting problem. The proposed model has self-limiting attributes (e.g., once 80% of the day’s volume is reached, return to a historical approach) and deviation limits (e.g., depart no more than 10% away from a historical VWAP curve) that make it logically appealing to practical traders. The author speci-fies a rolling regression model that shows reductions in volume percentage error of 3.4%–4.8% on six months
of Australian Stock Exchange (ASX) 200 names. How-ever, the study does not extend this work to predicting VWAP tracking errors.
These models and papers were useful in our efforts. They provided insights into the nature of the problem and of model approaches, established benchmarks for the breadth of a study (number of stocks and days of trading and analysis), and framed achievable results in reducing volume prediction errors. Although our reductions are higher in each case, we should note that results are not strictly comparable, as they each used different datasets, intervals, and in certain cases, different error metrics.
SUMMARY
We introduced two models for predicting vol-ume—one which predicts intraday raw volume (i.e., traded volume) and one which predicts intraday volume percentages (i.e., the percentage of daily volume that will trade in a given interval of time). Predictions are made intraday for each of the 26 15-minute bins that make up a trading day.
The model for predicting raw volume consists of four components and exploits interday and intraday information. Using a conservative performance mea-sure, we achieve significant reductions in forecasting raw volume with a parsimonious model structure. Compo-nents of the raw volume prediction model are used in predicting volume percentage.
The work establishes that reducing volume per-centage errors reduces VWAP tracking error. We show, using extensive simulations, that reducing volume per-centage prediction error improves the performance of VWAP algorithms commensurately, a level of improve-ment in VWAP performance of 9% in our study of 500 names over one year.
This work constitutes one of the largest studies to date on forecasting raw volume and volume percentages. It formed the basis for a product offering raw volume and volume percentage predictions.2
ENDNOTES
1See Pragma Trading [2009].2An overview is available at http://www.f lextrade.
com/solutions/analytics/f lexedge.
JOT-SATISH.indd 24JOT-SATISH.indd 24 6/13/14 8:16:09 PM6/13/14 8:16:09 PM
THE JOURNAL OF TRADING SUMMER 2014
REFERENCES
Bialkowski, J., S. Darolles, and G. Le Fol. “Improving VWAP Strategies: A Dynamical Volume Approach.” Journal of Banking and Finance, 32 (2008), pp. 1709-1722.
Brownlees, C.T., F. Cipollini, and G.M. Gallo. “Intra-Daily Volume Modeling and Prediction for Algorithmic Trading.” Journal of Financial Econometrics, 9 (2011), pp. 489-518.
Humphery-Jenner, M. “Optimal VWAP Trading under Noisy Conditions.” Journal of Banking and Finance, 35 (2011), pp. 2319-2329.
Hurvich, C.L., and C.M. Tsai. “Regression and Time Series Model Selection in Small Samples.” Biometrika, 76 (1989), pp. 297-307.
——. “A Corrected Akaike Information Criterion for Vector Autoregressive Model Selection.” Journal of Time Series Anal-ysis, Vol. 14, No. 3 (May 1993), pp. 271-279.
Pragma Trading. “Static VWAP: A Comparative Analysis.” Research, Pragma Trading. 2009. Available at http://www.pragmatrading.com/research/research-notes.
To order reprints of this article, please contact Dewey Palmieri at [email protected] or 212-224-3675.
JOT-SATISH.indd 25JOT-SATISH.indd 25 6/13/14 8:16:09 PM6/13/14 8:16:09 PM


![BBC VOICES RECORDINGS€¦ · BBC Voices Recordings) ) ) ) ‘’ -”) ” (‘)) ) ) *) , , , , ] , ,](https://img.pdfslide.net/doc/110x75/5f8978dc43c248099e03dd05/bbc-voices-recordings-bbc-voices-recordings-aa-a-a-a-.jpg)