Embed Size (px)
Citation preview
The Web-based ARTIST:
An Online Resource for the Assessmentof Instructional Outcomes
Robert delMas and Joan GarfieldUniversity of Minnesota
[email protected]@umn.edu
Beth ChanceCal Poly, San Luis Obispo
An Invited Paper presented in Session 224,“Rethinking Assessment in Statistics Education:
Realigning Goals and Updating Resources and Practices”Sponsored by the Section on Statistical Education
Joint Statistical MeetingsSan FranciscoAugust 2003

Resources for Assessing Instructional Outcomes
2
Overview
This paper reports on the Assessment Resource Tools for Improving Statistical Thinking
(ARTIST) project which is funded by a National Science Foundation Assessment grant.
Over a three-year period, ARTIST will develop a website that provides several resources:
an online collection of high quality assessment items and tasks, coded according to
content (e.g., normal distribution, measures of center, bivariate data), item type (e.g.,
calculation, forced-choice, open-ended, matching), and type of learning outcome (e.g.,
statistical literacy, reasoning, or thinking); research and evaluation of items in the
collection; an online facility to build tests that can be administered electronically or
downloaded for modification and printing; guidelines for using assessment items and
tasks in various ways; faculty development workshops and mini-courses on how to use
the assessment resources to improve student learning outcomes; a comprehensive test that
measures desired outcomes of a first course in statistics. This paper presents a summary
of the process that guided item selection, a first-year progress report, and a demonstration
of key features of the online test construction facility.
The Need for Assessment Resources
Inspired by the evaluation of calculus reform courses (Tucker & Leitzel, 1995), a study was
conducted by Garfield (2001) to evaluate how the reform movement in statistics education has
affected the teaching of introductory statistics courses and how distinctly statistics is taught in
different departments and institutions. The results of this study suggested that many statistics
instructors are aligning their courses with reform recommendations regarding technology, and to
some extent, with teaching methods. Most faculty reported positive outcomes regarding changes
made: more student satisfaction and increased faculty enjoyment, as well as more sharing of
ideas and methods with colleagues.
The weakest area of reform reported was assessment, where few instructors reported
anything other than traditional exams, used only to assign grades. Such assessments
mainly require students to recall or recognize definitions, perform calculations, and carry
Resources for Assessing Instructional Outcomes
3
out procedures correctly. This is problematic for two reasons. While some students may
earn a good grade in their first statistics course by having good study habits, completing
homework on time, and having a good memory and aptitude for mathematics
computations and formulas, these students may not be able to actually reason about
statistical information or to apply what they have learned in other courses or contexts.
Secondly, in addition to the positive findings of reform recommendations being
implemented, and instructors’ perceptions of positive outcomes, there is a need for high
quality assessments to determine how well the “new” courses actually prepare students to
do more than compute, use formulas, and identify correct definitions. For example, many
instructors appear to be using new technological resources or new textbooks that reflect
reform recommendations for course content. However, assessment materials are not
currently available that may be used by faculty to better evaluate important student
outcomes. Therefore, it is not known whether using technology and good textbooks is
enough, or if there are other important factors that affect student learning (e.g.,
instructional methods). If high quality assessment materials were available on a website
where customized quizzes and exams could be produced and guidelines and examples of
other alternative assessments could be accessed, more faculty could utilize appropriate
and informative assessment methods and gather more appropriate information across a
variety of courses to support research studies.
Current Assessment Challenges in Statistics Education
The identification of issues and challenges related to the assessment of student outcomes
in statistics courses is a recent development. In their article on assessment in statistics
education, Garfield and Gal (1999) identify many of the challenges that need to be
addressed. These include:
Resources for Assessing Instructional Outcomes
4
1. Assessment of “Statistical Literacy”
We need ways to assess the application or transfer of student learning to
interpretive or functional tasks such as those encountered in media and outside the
classroom.
2. Assessment of Students’ Intuitions and Reasoning about Probability and Statistics
We need ways to transfer and adapt promising assessment methods and
instruments used by researchers to formats that are reasonably acceptable and
accessible to teachers and that can be used for “routine” classroom use.
3. Assessment of Students’ Understanding of “Big Ideas” and Statistical Thinking
Assessment items or tasks are needed that can evaluate students’ understanding of
and sensitivity to the prevalence and importance of the “big ideas” of statistics in
different contexts. We also need to assess students’ statistical thinking about the
nature and process of statistical investigations.
4. Developing Models to Use in Evaluating and Comparing Curricula
As new curricula, innovative textbooks, and instructional software replace
traditional approaches to teaching statistics, there is an increasing need for
reliable, valid, practical, and accessible assessment instruments to use in
evaluating the relative utility of these materials and methods.
The Project
The Web ARTIST project is designed to address these challenges by producing four
types of outcomes.
1. A collection of high quality assessment items and tasks, coded according to
content and type of cognitive outcome (e.g., literacy, reasoning, or thinking).
This will include a variety of item formats including enhanced objective-format
questions (e.g., items that require students to match concepts or select responses
with appropriate explanations) and longer, written assignments such as
performance tasks, projects, portfolios, and journals. The items will be
Resources for Assessing Instructional Outcomes
5
administered to different student groups (e.g., AP statistics; two-year and four-
year institutions) in order to assign difficulty ratings to each item based on
percentages of students who get an item correct.
2. A website that contains the assessment items and tasks, provides guidelines for
using the assessment items/tasks in various ways (e.g., online quizzes, offline
exams, prototypes of written assignments and scoring guidelines), and allows for
the collection and compilation of data for research and evaluation purposes.
3. Faculty development workshops and mini-courses to encourage and assist
statistics instructors from various disciplines to use the assessment resources to
improve student learning, improve courses, and evaluate course outcomes.
4. A comprehensive test that measures desired outcomes of a first course in statistics
that may be used to evaluate a variety of first courses, and allows for comparisons
of outcomes across different types of courses (e.g., traditional, lecture-based
courses, on-line courses, small interactive classes, etc.).
1. Collection of assessment items/tests/guidelines/examples
We began the project by collecting items to enter in an item bank. These include items
developed by the three principal investigators and our advisory board, items from people
who volunteered to submit materials that they feel are useful and of a high quality, and
items used in relevant research studies. Before beginning the item collection, the project
advisors were asked to help generate a list of topics included in a first undergraduate
statistics course. After several email discussions we developed the list of topics in Table
1 to guide the collection and classification of assessment items. The list following each
general topic suggests some of the different categories within that topic, but not all.
Resources for Assessing Instructional Outcomes
6
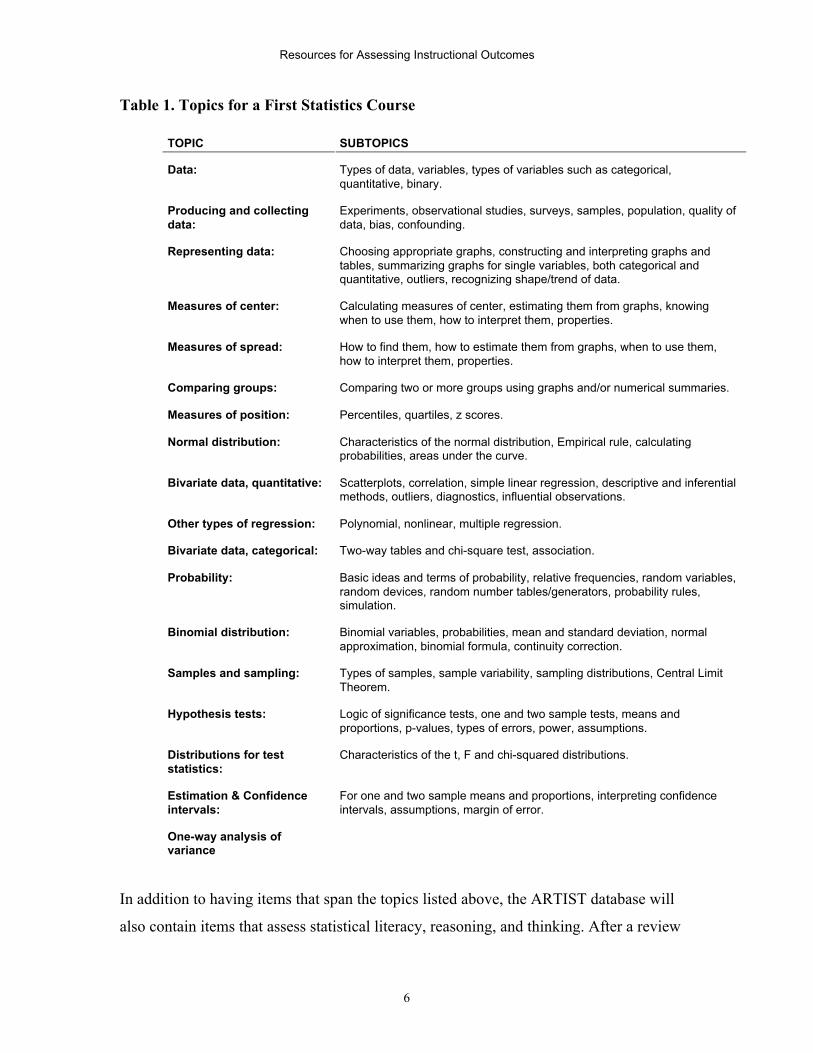
Table 1. Topics for a First Statistics Course
TOPIC SUBTOPICS
Data: Types of data, variables, types of variables such as categorical,quantitative, binary.
Producing and collectingdata:
Experiments, observational studies, surveys, samples, population, quality ofdata, bias, confounding.
Representing data: Choosing appropriate graphs, constructing and interpreting graphs andtables, summarizing graphs for single variables, both categorical andquantitative, outliers, recognizing shape/trend of data.
Measures of center: Calculating measures of center, estimating them from graphs, knowingwhen to use them, how to interpret them, properties.
Measures of spread: How to find them, how to estimate them from graphs, when to use them,how to interpret them, properties.
Comparing groups: Comparing two or more groups using graphs and/or numerical summaries.
Measures of position: Percentiles, quartiles, z scores.
Normal distribution: Characteristics of the normal distribution, Empirical rule, calculatingprobabilities, areas under the curve.
Bivariate data, quantitative: Scatterplots, correlation, simple linear regression, descriptive and inferentialmethods, outliers, diagnostics, influential observations.
Other types of regression: Polynomial, nonlinear, multiple regression.
Bivariate data, categorical: Two-way tables and chi-square test, association.
Probability: Basic ideas and terms of probability, relative frequencies, random variables,random devices, random number tables/generators, probability rules,simulation.
Binomial distribution: Binomial variables, probabilities, mean and standard deviation, normalapproximation, binomial formula, continuity correction.
Samples and sampling: Types of samples, sample variability, sampling distributions, Central LimitTheorem.
Hypothesis tests: Logic of significance tests, one and two sample tests, means andproportions, p-values, types of errors, power, assumptions.
Distributions for teststatistics:
Characteristics of the t, F and chi-squared distributions.
Estimation & Confidenceintervals:
For one and two sample means and proportions, interpreting confidenceintervals, assumptions, margin of error.
One-way analysis ofvariance
In addition to having items that span the topics listed above, the ARTIST database will
also contain items that assess statistical literacy, reasoning, and thinking. After a review
Resources for Assessing Instructional Outcomes
7
of the literature (e.g., Chance, 2002; Cobb, 1997; delMas, 2002; Gal, 2002; Garfield,
2002; Jones, Thornton, Langrall, Mooney, Perry, & Putt, 2000; Rumsey, 2002; Wild and
Pfannkuch, 1999) and many rounds of discussions, the following descriptions were
developed as an attempt to distinguish these three learning outcomes.
Statistical literacy
Statistical literacy includes basic and important skills that are used to understand
quantitative arguments based on data. These skills include being able to organize data,
construct and display tables, and work with different representations of data. Statistical
literacy also includes an understanding of concepts, vocabulary and symbols, and
includes an understanding of probability as a measure of uncertainty. (For papers on
statistical literacy see Gal, 2002; Rumsey, 2002.)
Statistical reasoning
Statistical reasoning may be defined as the way people reason with statistical ideas and
make sense of statistical information. This involves making interpretations based on sets
of data, representations of data, or statistical summaries of data. Statistical reasoning
may involve connecting one concept to another (e.g., center and spread) or may combine
ideas about data and chance. Reasoning means understanding and being able to explain
statistical processes and being able to fully interpret statistical results. (For papers on
statistical reasoning see Garfield, 2002; Ben-Zvi and Garfield, in press)
Statistical thinking
Statistical thinking involves an understanding of why and how statistical investigations
are conducted and the “big ideas” that underlie statistical investigations. These ideas
include the omnipresent nature of variation, and when and how to use appropriate
methods of data analysis such as numerical summaries and visual displays of data.
Statistical thinking involves an understanding of the nature of sampling, how we make
inferences from samples to populations, and why designed experiments are needed in
order to establish causation. It also includes an understanding of how models are used to
simulate random phenomena, how data are produced to estimate probabilities, and
recognition of how, when, and why existing inferential tools can be used to aid an
Resources for Assessing Instructional Outcomes
8
investigative process. Statistical thinking also includes being able to understand and
utilize the context of a problem in forming investigations and drawing conclusions, and
recognizing and understanding the entire process (from question posing to data collection
to choosing analyses to testing assumptions, etc.). Finally, statistical thinkers are able to
critique and evaluate results of a problem solved or a statistical study. (For more papers
on statistical thinking see Wild and Pfannkuch, 1999; Chance, 2002.)
The three types of outcomes described above are all considered goals of reform-based
first courses in statistics and stand in contrast to traditional courses that emphasize
computations, formulas, and proofs.
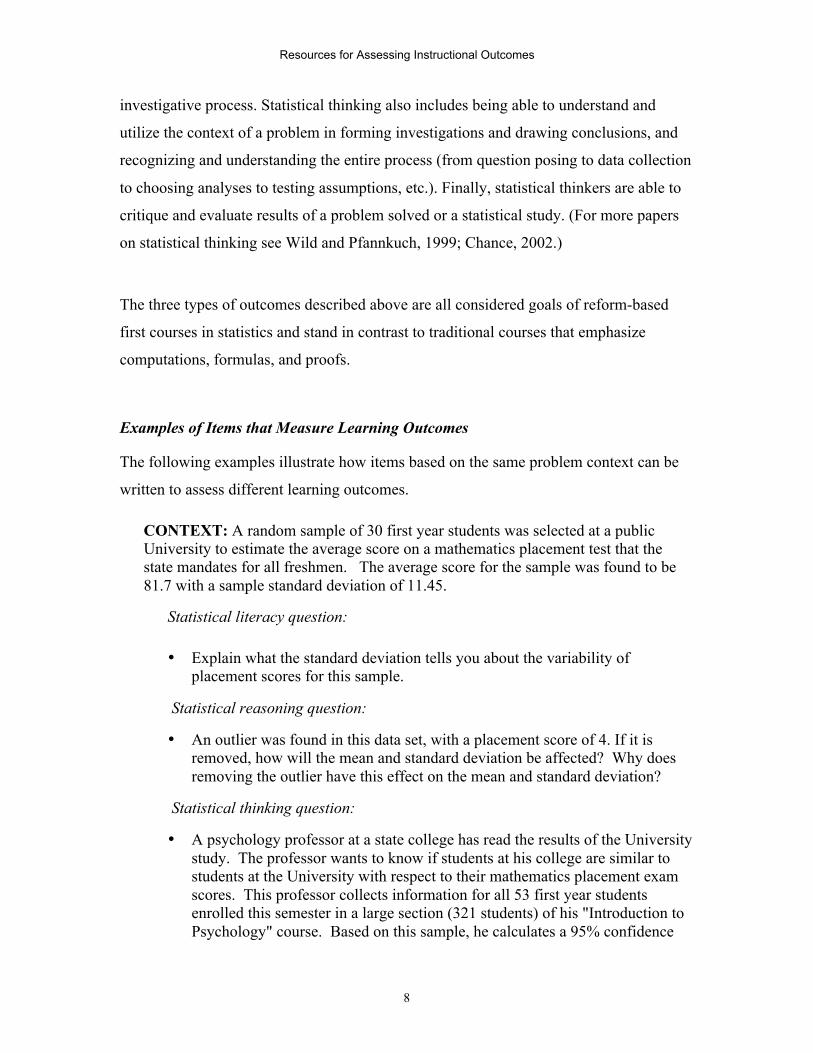
Examples of Items that Measure Learning Outcomes
The following examples illustrate how items based on the same problem context can be
written to assess different learning outcomes.
CONTEXT: A random sample of 30 first year students was selected at a publicUniversity to estimate the average score on a mathematics placement test that thestate mandates for all freshmen. The average score for the sample was found to be81.7 with a sample standard deviation of 11.45.
Statistical literacy question:
• Explain what the standard deviation tells you about the variability ofplacement scores for this sample.
Statistical reasoning question:
• An outlier was found in this data set, with a placement score of 4. If it isremoved, how will the mean and standard deviation be affected? Why doesremoving the outlier have this effect on the mean and standard deviation?
Statistical thinking question:
• A psychology professor at a state college has read the results of the Universitystudy. The professor wants to know if students at his college are similar tostudents at the University with respect to their mathematics placement examscores. This professor collects information for all 53 first year studentsenrolled this semester in a large section (321 students) of his "Introduction toPsychology" course. Based on this sample, he calculates a 95% confidence

Resources for Assessing Instructional Outcomes
9
interval for the average mathematics placement scores exam to be 69.47 to75.72. Below are two possible conclusions that the psychology professormight draw.
1. The average mathematics placement exam score for first year students atthe state college is lower than the average mathematics placement examscore of first year students at the University.
2. The average mathematics placement exam score for the 53 students in thissection is lower than the average mathematics placement exam score offirst year students at the University.
For each conclusion, state whether it is valid or invalid. Explain your choicefor both statements. Note that it is possible that neither conclusion is valid.
Here is an example using a different problem context:
CONTEXT: The following stemplot displays the average annual snowfallamounts (in inches, with the stems being tens and leaves being ones) for a randomsample of 25 American cities:
0 0000000241 0282 002283 84 22485 486 0
Statistical literacy question:
• Describe this distribution.
Statistical reasoning question:
• Without doing any calculations, would you expect the mean of the snowfallamounts to be larger, smaller, or about the same as the median? Why?
Statistical thinking question:
• A researcher has data on the average snowfall for these same cities from 20years ago. She wants to test whether snowfall amounts are higher now thenthey were 20 years ago. Describe an appropriate way to answer this question.
Resources for Assessing Instructional Outcomes
10
Criteria for ARTIST Items
All items submitted to the ARTIST project are reviewed before inclusion in the database.
The primary consideration is whether or not an item would provide useful information
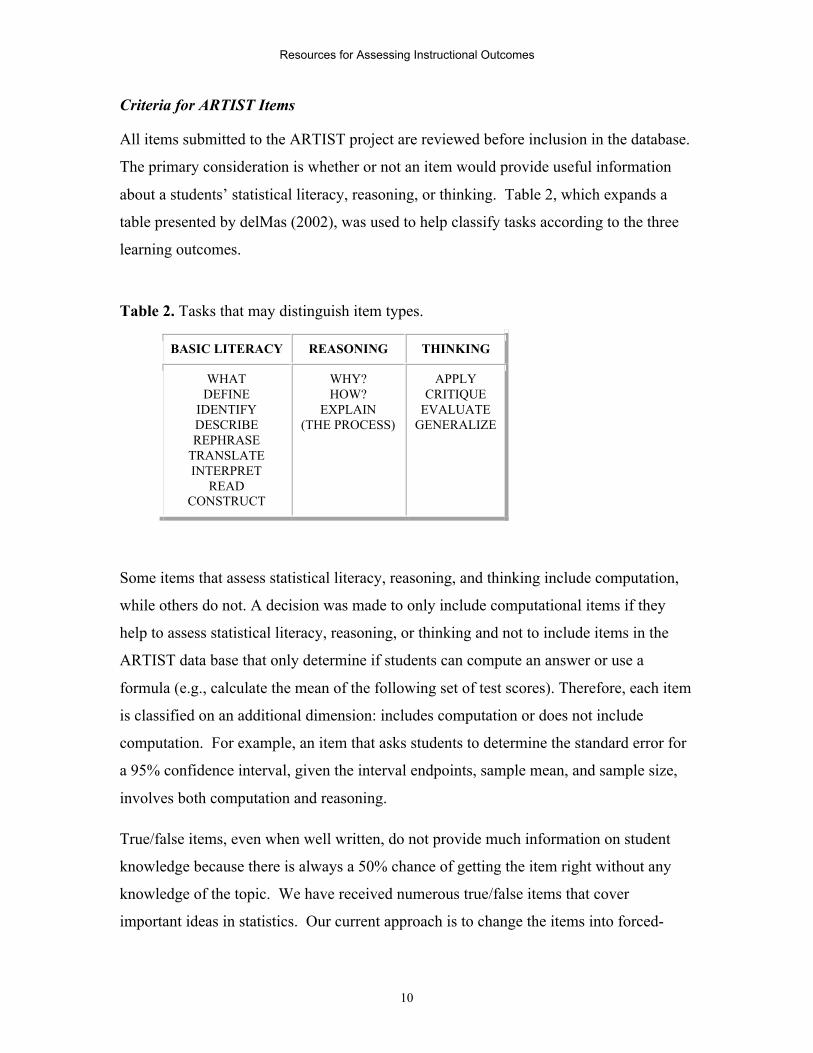
about a students’ statistical literacy, reasoning, or thinking. Table 2, which expands a
table presented by delMas (2002), was used to help classify tasks according to the three
learning outcomes.
Table 2. Tasks that may distinguish item types.
BASIC LITERACY REASONING THINKING
WHATDEFINE
IDENTIFYDESCRIBEREPHRASE
TRANSLATEINTERPRET
READCONSTRUCT
WHY?HOW?
EXPLAIN(THE PROCESS)
APPLYCRITIQUE
EVALUATEGENERALIZE
Some items that assess statistical literacy, reasoning, and thinking include computation,
while others do not. A decision was made to only include computational items if they
help to assess statistical literacy, reasoning, or thinking and not to include items in the
ARTIST data base that only determine if students can compute an answer or use a
formula (e.g., calculate the mean of the following set of test scores). Therefore, each item
is classified on an additional dimension: includes computation or does not include
computation. For example, an item that asks students to determine the standard error for
a 95% confidence interval, given the interval endpoints, sample mean, and sample size,
involves both computation and reasoning.
True/false items, even when well written, do not provide much information on student
knowledge because there is always a 50% chance of getting the item right without any
knowledge of the topic. We have received numerous true/false items that cover
important ideas in statistics. Our current approach is to change the items into forced-
Resources for Assessing Instructional Outcomes
11
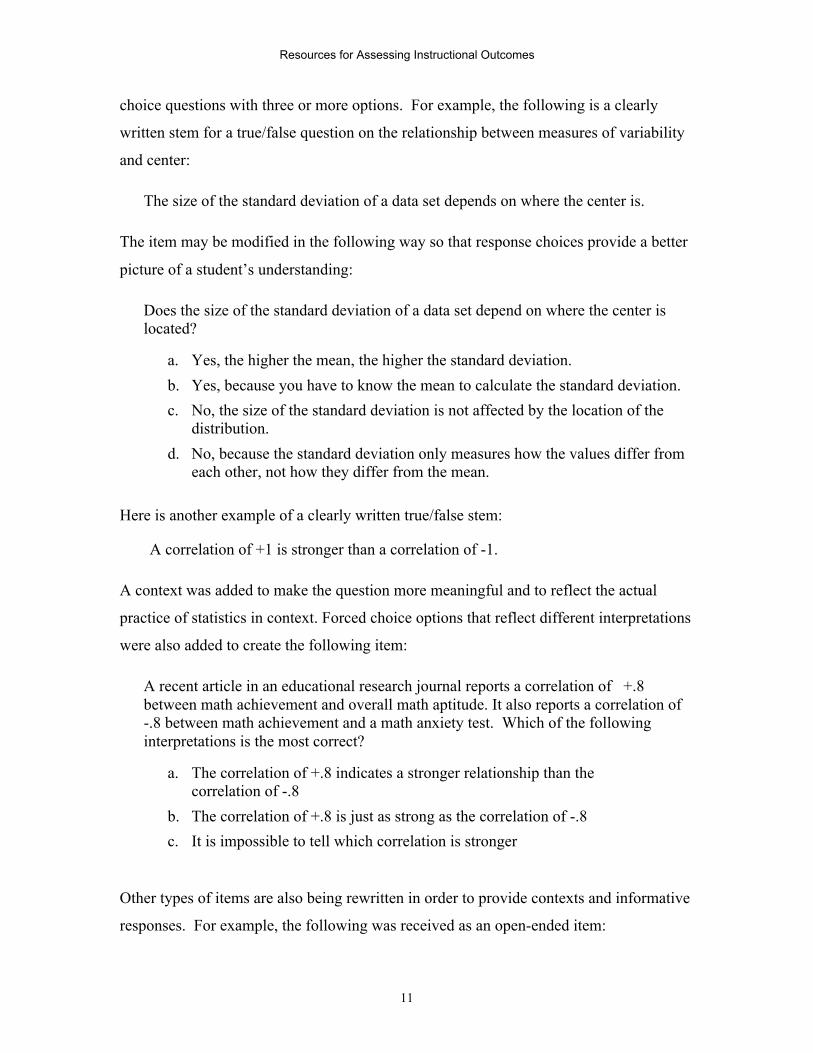
choice questions with three or more options. For example, the following is a clearly
written stem for a true/false question on the relationship between measures of variability
and center:
The size of the standard deviation of a data set depends on where the center is.
The item may be modified in the following way so that response choices provide a better
picture of a student’s understanding:
Does the size of the standard deviation of a data set depend on where the center islocated?
a. Yes, the higher the mean, the higher the standard deviation.
b. Yes, because you have to know the mean to calculate the standard deviation.
c. No, the size of the standard deviation is not affected by the location of thedistribution.
d. No, because the standard deviation only measures how the values differ fromeach other, not how they differ from the mean.
Here is another example of a clearly written true/false stem:
A correlation of +1 is stronger than a correlation of -1.
A context was added to make the question more meaningful and to reflect the actual
practice of statistics in context. Forced choice options that reflect different interpretations
were also added to create the following item:
A recent article in an educational research journal reports a correlation of +.8between math achievement and overall math aptitude. It also reports a correlation of-.8 between math achievement and a math anxiety test. Which of the followinginterpretations is the most correct?
a. The correlation of +.8 indicates a stronger relationship than thecorrelation of -.8
b. The correlation of +.8 is just as strong as the correlation of -.8
c. It is impossible to tell which correlation is stronger
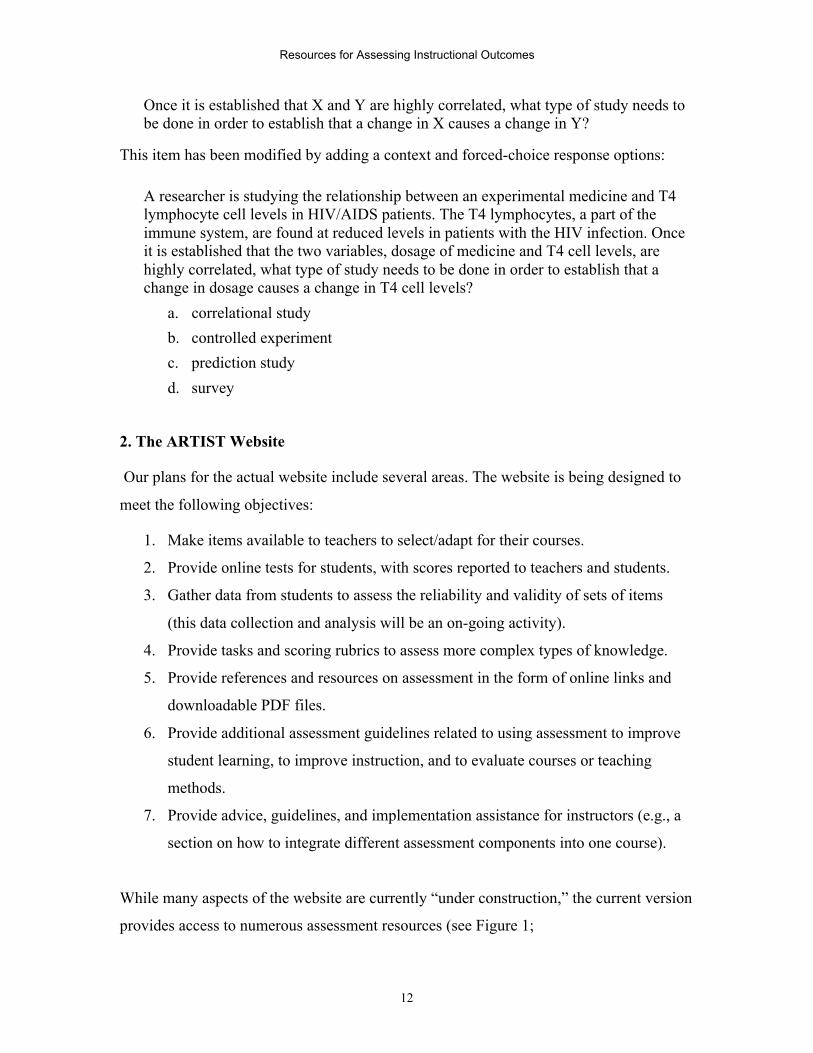
Other types of items are also being rewritten in order to provide contexts and informative
responses. For example, the following was received as an open-ended item:
Resources for Assessing Instructional Outcomes
12
Once it is established that X and Y are highly correlated, what type of study needs tobe done in order to establish that a change in X causes a change in Y?
This item has been modified by adding a context and forced-choice response options:
A researcher is studying the relationship between an experimental medicine and T4lymphocyte cell levels in HIV/AIDS patients. The T4 lymphocytes, a part of theimmune system, are found at reduced levels in patients with the HIV infection. Onceit is established that the two variables, dosage of medicine and T4 cell levels, arehighly correlated, what type of study needs to be done in order to establish that achange in dosage causes a change in T4 cell levels?
a. correlational study
b. controlled experiment
c. prediction study
d. survey
2. The ARTIST Website
Our plans for the actual website include several areas. The website is being designed to
meet the following objectives:
1. Make items available to teachers to select/adapt for their courses.
2. Provide online tests for students, with scores reported to teachers and students.
3. Gather data from students to assess the reliability and validity of sets of items
(this data collection and analysis will be an on-going activity).
4. Provide tasks and scoring rubrics to assess more complex types of knowledge.
5. Provide references and resources on assessment in the form of online links and
downloadable PDF files.
6. Provide additional assessment guidelines related to using assessment to improve
student learning, to improve instruction, and to evaluate courses or teaching
methods.
7. Provide advice, guidelines, and implementation assistance for instructors (e.g., a
section on how to integrate different assessment components into one course).
While many aspects of the website are currently “under construction,” the current version
provides access to numerous assessment resources (see Figure 1;

Resources for Assessing Instructional Outcomes
13
http://www.gen.umn.edu/artist/). PDF files of many articles and chapters on assessment,
and links to online articles and related websites can be found at the ARTIST website.
The following provides a brief overview of the current website contents.
Figure 1. The ARTIST homepage.
The ARTIST Assessment Builder
A primary goal of the project is to develop a useable and flexible interface that allows
instructors and researchers to access items, assemble an assessment instrument, and
download a file in rich text format (RTF) that can be opened in a word processor (e.g.,
Microsoft Word) for test construction. This interface is provided by the ARTIST
Assessment Builder, which is currently under construction and in the testing phase. What
follows is an illustration of the Assessment Builder components that have been developed
so far.
The functionality of the Assessment Builder is achieved through a combination of
HTML, JavaScript, VBScript, and Active Server Pages (ASP) programming. The website
currently consists of several pages that serve as interfaces to the various functions of the
site. The Assessment Builder allows the user to search, view, and select items in the

Resources for Assessing Instructional Outcomes
14
ARTIST. An Assessment Builder session starts by either registering with ARTIST or
logging on if the user is already registered (see Figure 2).
Figure 2. Log in page for the ARTIST Assessment Builder
The user is taken to an assessment management page and is presented with the option of
creating a new assessment or working with assessments that were previously assembled
(see Figure 3). Figure 3 shows a user entering information for a third exam in an
introductory statistics course. Clicking the SUBMIT button directs the browser to a
search page where items can be found according to content topic, type of learning
outcome, and item format (see Figure 4).
Figure 3. The ARTIST assessment management page.
Resources for Assessing Instructional Outcomes
15
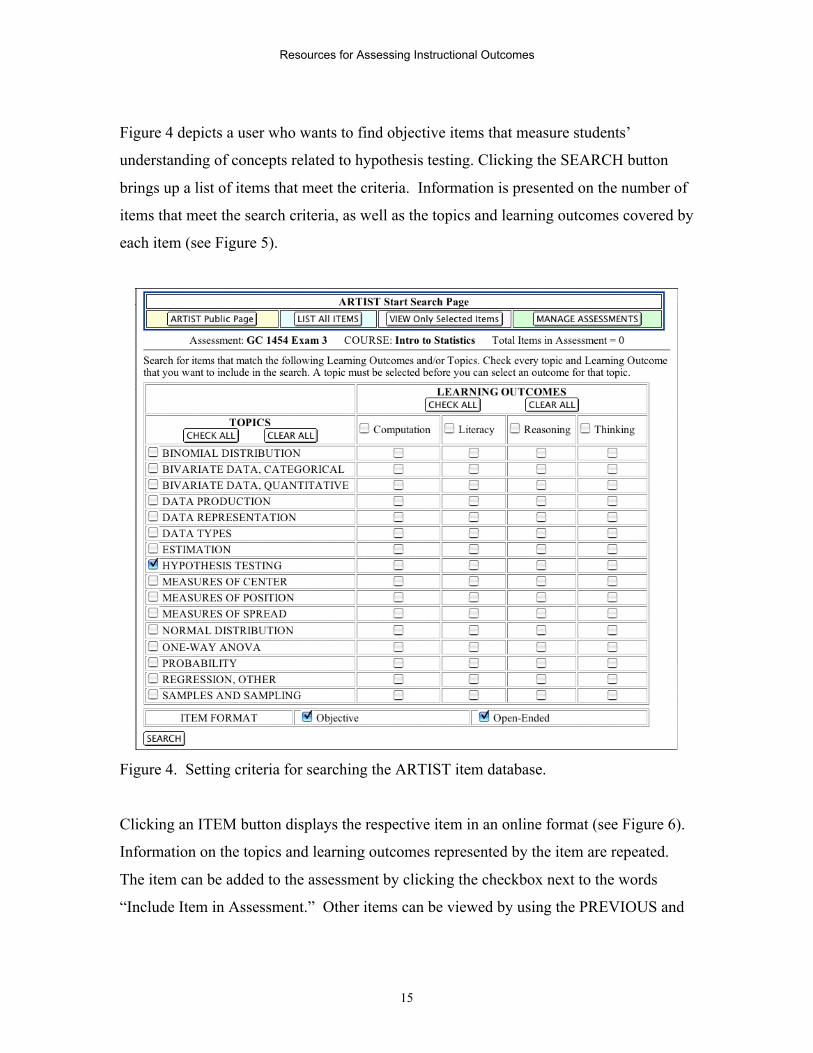
Figure 4 depicts a user who wants to find objective items that measure students’
understanding of concepts related to hypothesis testing. Clicking the SEARCH button
brings up a list of items that meet the criteria. Information is presented on the number of
items that meet the search criteria, as well as the topics and learning outcomes covered by
each item (see Figure 5).
Figure 4. Setting criteria for searching the ARTIST item database.
Clicking an ITEM button displays the respective item in an online format (see Figure 6).
Information on the topics and learning outcomes represented by the item are repeated.
The item can be added to the assessment by clicking the checkbox next to the words
“Include Item in Assessment.” Other items can be viewed by using the PREVIOUS and

Resources for Assessing Instructional Outcomes
16
NEXT buttons, or the user can navigate to other pages in the Assessment Builder, such as
navigating back to the search page to find more items under different criteria.
Figure 5. Search results.
Figure 6. Viewing an ARTIST item online.
Resources for Assessing Instructional Outcomes
17
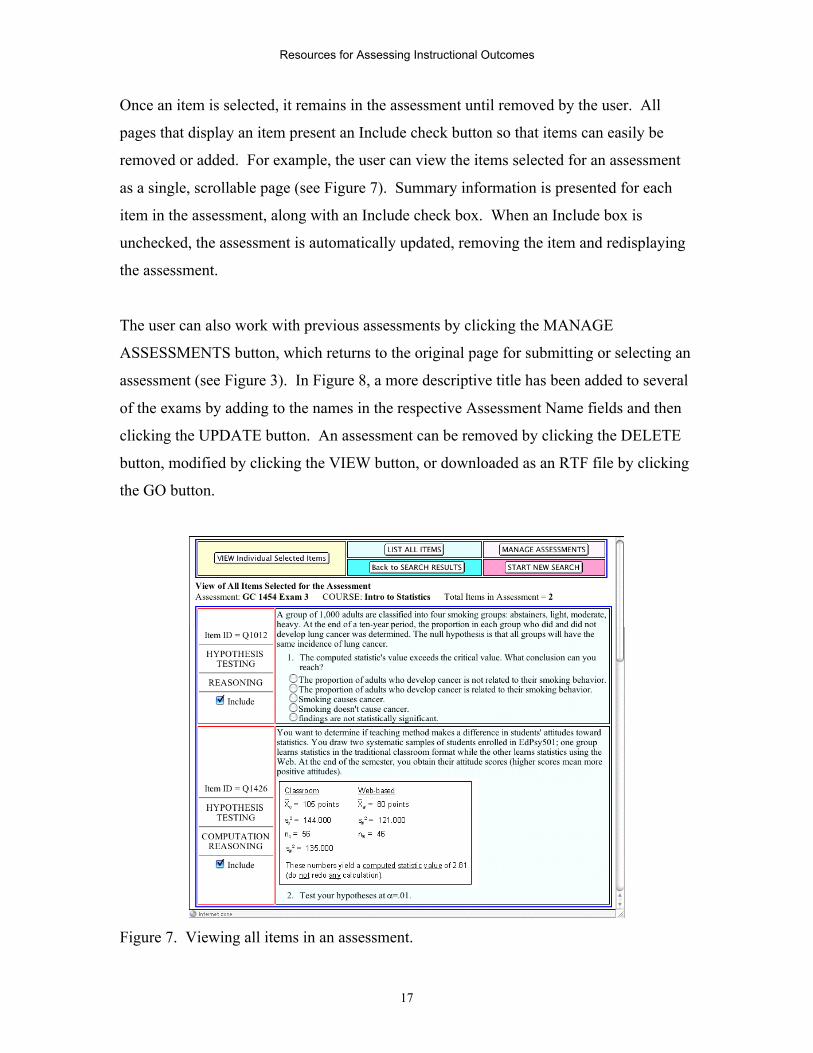
Once an item is selected, it remains in the assessment until removed by the user. All
pages that display an item present an Include check button so that items can easily be
removed or added. For example, the user can view the items selected for an assessment
as a single, scrollable page (see Figure 7). Summary information is presented for each
item in the assessment, along with an Include check box. When an Include box is
unchecked, the assessment is automatically updated, removing the item and redisplaying
the assessment.
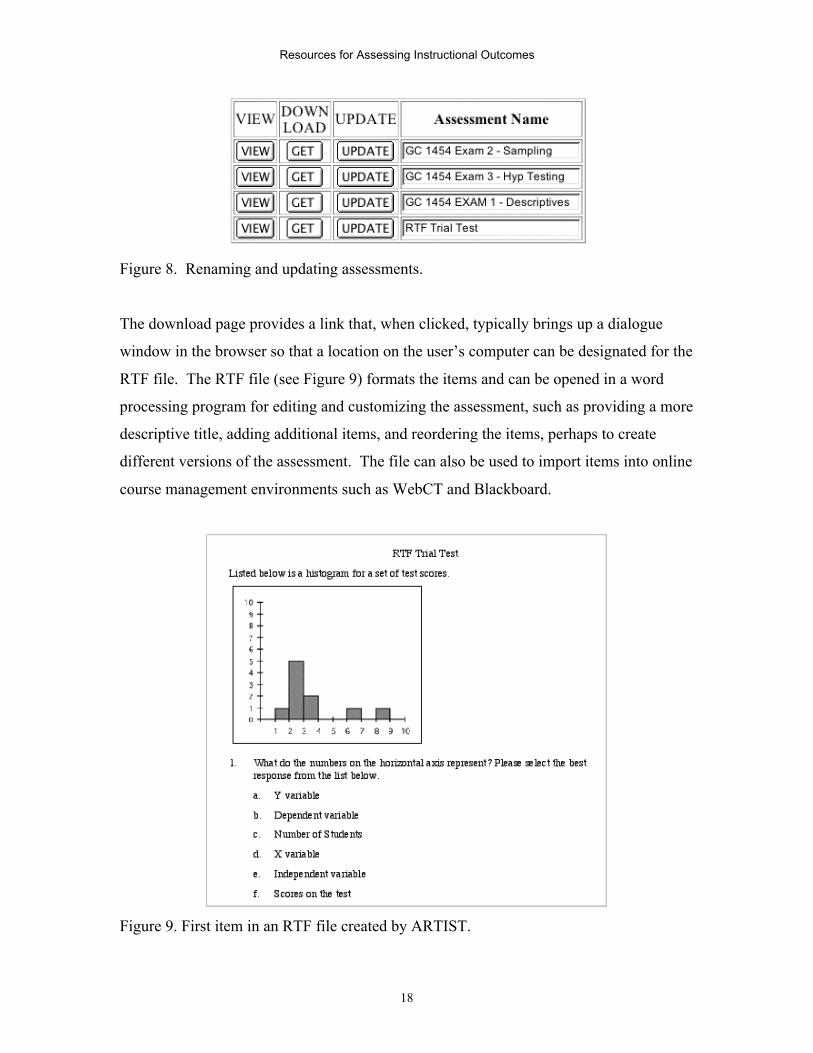
The user can also work with previous assessments by clicking the MANAGE
ASSESSMENTS button, which returns to the original page for submitting or selecting an
assessment (see Figure 3). In Figure 8, a more descriptive title has been added to several
of the exams by adding to the names in the respective Assessment Name fields and then
clicking the UPDATE button. An assessment can be removed by clicking the DELETE
button, modified by clicking the VIEW button, or downloaded as an RTF file by clicking
the GO button.
Figure 7. Viewing all items in an assessment.
Resources for Assessing Instructional Outcomes
18
Figure 8. Renaming and updating assessments.
The download page provides a link that, when clicked, typically brings up a dialogue
window in the browser so that a location on the user’s computer can be designated for the
RTF file. The RTF file (see Figure 9) formats the items and can be opened in a word
processing program for editing and customizing the assessment, such as providing a more
descriptive title, adding additional items, and reordering the items, perhaps to create
different versions of the assessment. The file can also be used to import items into online
course management environments such as WebCT and Blackboard.
Figure 9. First item in an RTF file created by ARTIST.
Resources for Assessing Instructional Outcomes
19
Assessment Resources
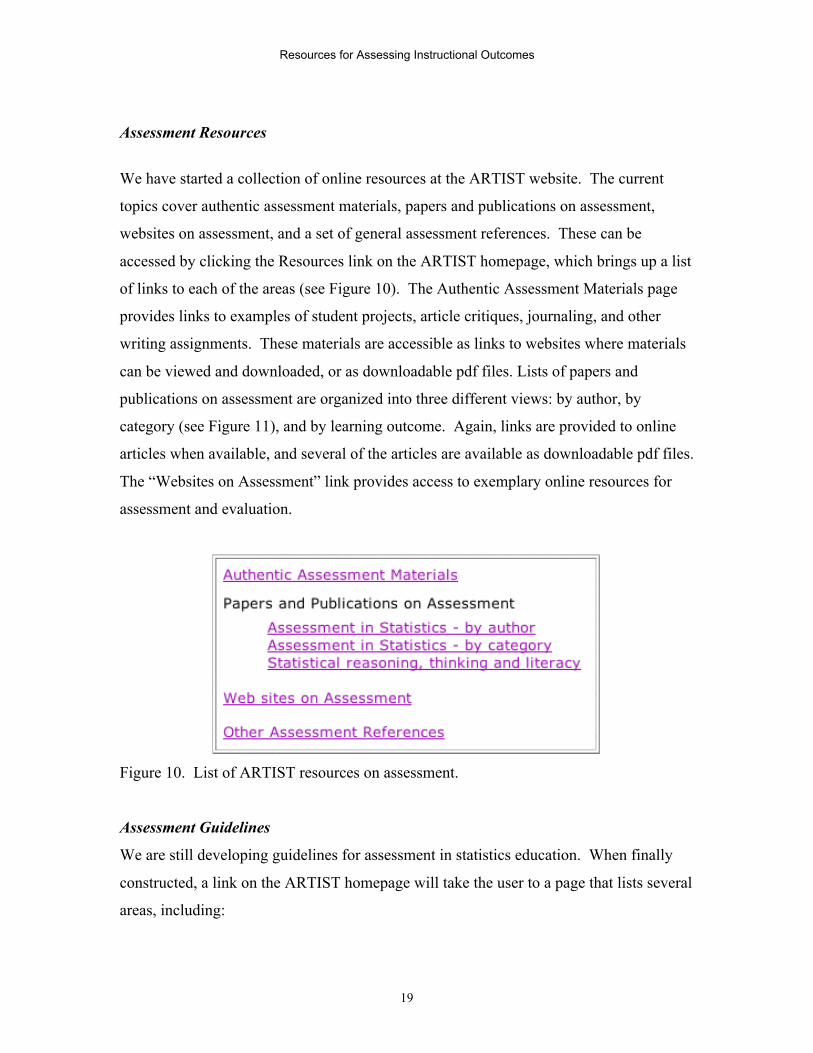
We have started a collection of online resources at the ARTIST website. The current
topics cover authentic assessment materials, papers and publications on assessment,
websites on assessment, and a set of general assessment references. These can be
accessed by clicking the Resources link on the ARTIST homepage, which brings up a list
of links to each of the areas (see Figure 10). The Authentic Assessment Materials page
provides links to examples of student projects, article critiques, journaling, and other
writing assignments. These materials are accessible as links to websites where materials
can be viewed and downloaded, or as downloadable pdf files. Lists of papers and
publications on assessment are organized into three different views: by author, by
category (see Figure 11), and by learning outcome. Again, links are provided to online
articles when available, and several of the articles are available as downloadable pdf files.
The “Websites on Assessment” link provides access to exemplary online resources for
assessment and evaluation.
Figure 10. List of ARTIST resources on assessment.
Assessment Guidelines
We are still developing guidelines for assessment in statistics education. When finally
constructed, a link on the ARTIST homepage will take the user to a page that lists several
areas, including:

Resources for Assessing Instructional Outcomes
20
• Using assessment to evaluate student learning (ways to combine assessment
information to provide grades, feedback to students, etc.).
• Using assessment to improve instruction (how to identify areas where students
are not achieving the desired learning outcomes).
• Using assessment to evaluate courses or teaching methods (how to analyze
student data and compare it to data from other types of courses).
• Using existing scoring rubrics for performance assessments or projects.
• Developing customized scoring rubrics for performance tasks or project.
Materials for each of these areas will be developed from materials already written by the
three principal investigators and revised with feedback from the advisory group.
Figure 11. Organizational categories for papers and publications on assessment.
Implementation Issues
We realize that using assessment information involves more than creating a test or
choosing an instrument. Several practical issues have arisen as we discussed our project
with our advisory group. We now plan to incorporate some questions and answers
Resources for Assessing Instructional Outcomes
21
dealing with these issues in our website as well as include discussions of implementation
issues in our faculty development workshops. These issues include:
• Open or closed book exams, and use of notes or sheets of formulas
• Use of technology on assessments
• Use of real data on assessments
• Reviewing before exams
• Going over exams in class or providing correct answers
• In class and take-home exams, and time restrictions
Security Issues
In constructing an item bank for instructors to use to construct tests, and an online testing
system, we realize that there are important security issues to deal with. For example, will
the database of questions be large enough so that we do not worry about whether students
can access potential test items? One possibility is to make the answers difficult to access,
such as locating them in a separate location on the data base. We considered having
instructors access the database with a password but realize students could easily obtain
passwords as well. We are still working on these issues.
3. Faculty Development Opportunities
An important consideration in developing new tools for statistics instructors is how to
encourage instructors to use these tools in appropriate and productive ways. Working
with faculty at all stages of the product development is an important part of this project.
We have statistics instructors on the advisory group who will advise us on
implementation issues and help us make the Web ARTIST appealing and easy to use.
Making the assessment tools straightforward to implement and illustrating the utility of
the information gained will help more faculty to enhance their own assessment plans.
Mini-courses and workshops will be offered beginning in 2004 to small groups of faculty
as they learn how to use our assessment resources in their courses for various purposes.
One the most effective ways to encourage faculty use of these tools is through workshops
where they can develop, revise, test, and receive feedback on integrating these items for
Resources for Assessing Instructional Outcomes
22
their own formative and summative evaluation purposes. The workshops will include
discussion on designing exams, incorporating alternative assessment methods, using the
assessments to inform curriculum development and research on student learning, and
developing individual assessment plans. The workshops will also be used to gather
formative evaluation for our own use in improving the overall project. A main purpose of
these workshops will be to expand awareness of assessment issues among a broader
group of faculty.
4. A Common Test for First Year Courses: Comprehensive Assessment of
Outcomes in Statistics (CAOS)
Many final exams and standardized tests contain examples of poor statistics and
probability questions, which are a misleading reflection of what we want our students to
know. For example, multiple-choice items can focus too much on calculation in an
artificial setting, with no explanation or interpretation required of the students. A notable
exception is the Advanced Placement (AP) Statistics exam for high school students,
which serves as a recent example of an assessment tool administered in large groups that
attempts to focus on reasoning as well as calculation.
An important outcome of this project is the development of a set of items to be
administered in an online test that can be used in many first year courses to evaluate the
attainment of desired student outcomes. Working with our advisory group and other
colleagues teaching statistics, we will develop a common set of items to be used across
different courses and institutions. These items will represent the big ideas, the
dispositions, and the types of reasoning, thinking and literacy skills deemed important for
students across first courses in statistics. Early versions of the instrument will be piloted
in the second year of the project and data will be gathered on a wide scale during the third
year of the project. Information will be collected on the type of textbook, teaching
methods, and technology used at each institution to examine relationships between
outcomes and instructional variables.

Resources for Assessing Instructional Outcomes
23
Measurement Issues
We plan to accumulate a large set of student responses to all ARTIST items in a database
archived on the web. This collection of classroom-level data from a variety of educational
institutions will allow researchers to begin to address some of the most interesting and
challenging questions in statistics education. We have two intended purposes for our
materials and these purposes lead directly to selection of appropriate methods for
calibrating and determining the quality of items.
One purpose is for use by teachers for assessing their students’ learning in a course. This
would be a criterion-referenced setting where teachers are interested in determining
students’ mastery of material and achievement of desired learning outcomes. In this case,
traditional estimates of reliability are not appropriate because it applies to a norm
referenced group and is also sample specific (i.e., dependent on the ability range in the
sample). Determining measurement precision and accuracy of classifying students
(mastery vs. non-mastery) is relevant to criterion-referenced testing. In general, precision
is more affected by the number of items used in an assessment. Therefore, we will need
to identify the number of items needed to achieve a certain level of accuracy for assessing
a particular topic or learning outcome. We will also try to gather inter-rater reliability for
scoring rubrics for performance assessment tasks.
For forced choice questions, Rasch models can estimate measurement error for estimating
various ability levels and can be determined with samples of size 30 or more. The Rasch
model estimates item difficulty (e.g., ability level at which a student has a 50% chance of
getting an item correct) and, as such, are mathematically sample independent. Rasch
ability estimates are logits in the range of –3 to +3 that can be rescaled. We plan to use
the Rasch model to determine item difficulties (for more on Rasch measurement, see
Wright and Stone, 1979). This information will be used to set up a matrix that presents
topics on one dimension, type of learning outcome (Literacy, Calculation, Reasoning and
Thinking) as a second dimension, and then, for items in each cell, have the item difficulty
as a third dimension.
Resources for Assessing Instructional Outcomes
24
Eventually, we plan to suggest ways for instructors to build tests utilizing these three
dimensions to create tests that reduce measurement error to an acceptable level. For
example, to build criterion-referenced tests that are keyed to a course, the selected items
need to match the course content and desired cognitive outcomes, and represent the range
of abilities of students (item difficulty).
The other purpose of the assessment materials is for use in research and evaluation
studies. For these purposes, subsets of items will be constructed for particular topics or
outcomes and offered as scales, in addition to the CAOS test. These scales will be tested
for reliability and modified to have high internal consistency reliability coefficients.
Reliability is sample specific, so identification of meaningful samples of students in
which to gather data will be a key issue.
For analysis of validity, we plan to use expert judges. Our advisory board will be asked to
rate items in terms of content and outcome in order to calculate percent agreement
between raters. We believe that this type of content validity is appropriate for classroom
testing use. For research use, construct validity analyses may be used to demonstrate that
test performance is related to independent measures of constructs. For example, we
might try to examine correlations with AP Statistics test performance or grades in a
statistics course. The sensitivity of ARTIST test to instruction will be investigated by
determining if test performance discriminates between students who have and have not
had instruction on a topic. Sensitivity to type of instruction might also be demonstrated.
Finally, we plan to use some think-aloud protocols with small groups of students to
determine construct validity.
Class Testing of Assessment Items
There will be two levels of class testing. The first set of class testing will be more
informal and begin in fall 2003. This will involve people who have signed up via our
website to be class testers. They will be instructed to select whatever items they want to
Resources for Assessing Instructional Outcomes
25
use. The class testers will provide feedback on wording, student perceptions, and their
own reactions to the items or materials.
A second level of class testing planned for spring 2004 will be more structured. Selected
instructors will be invited to test particular collections of items or the entire CAOS test.
We will try to control the testing conditions and will try to gather some additional
information to use in our analyses of validity.
Advisory Board
We are fortunate to have an excellent and helpful set of advisors that have been helping
us work toward achieving these goals. The advisory group consists of a variety of faculty
who represent different educational settings (departments and institutions) as well as
areas of expertise (e.g., measurement, evaluation, attitudes, statistics instruction), and
have experience working with diverse populations of students. The advisory group
includes:
Julia Clark – Mathematics, Hollins University
George W. Cobb – Mathematics, Mount Holyoke College
John P. Holcomb, Jr. – Mathematics, Cleveland State University
Frances Lawrenz – Educational Psychology, University of Minnesota
Carl Lee – Mathematics, Central Michigan University
Anthony Onwuegbuzie –Educational Leadership, Howard University
Roxy Peck – Statistics, California Polytechnic State University
Michael Rodriguez – Educational Psychology, University of Minnesota
Allan Rossman – Statistics, California Polytechnic State University
Deborah J. Rumsey – Statistics, Ohio State University
Candace Schau – Educational Psychology, CS Consultants

Resources for Assessing Instructional Outcomes
26
Future Plans
The first year of the project is nearing completion and it is already clear that many more
things could be done beyond the scope of the proposed project. A short list includes
having self-assessment capabilities on our website, developing a diagnostic pretest for
first courses in statistics, creating a bulletin board on our website for discussions of
assessment issues, and developing an electronic newsletter for users of the site. We also
have ideas for future work on using assessment to improve instruction by establishing
collaborative groups of faculty to build lessons designed to achieve assessment outcomes.
Therefore, we are considering a future proposal to build on and extend our current work.
We invite interested participants to contact us.
References
Ben-Zvi, D. & Garfield, J. (Eds.). (in press). The Challenge of Developing Statistical
Literacy, Reasoning, and Thinking. Dordrecht, The Netherlands: Kluwer Academic
Publishers.
Chance, B. L. (2002). Components of Statistical Thinking and Implications for
Instruction and Assessment. Journal of Statistics Education [Online], 10(3).
delMas, R. C. (2002). Statistical Literacy, Reasoning, and Learning: A Commentary.
Journal of Statistics Education [Online], 10(3).
Cobb, G. W. (1997). Mere Literacy is Not Enough. In L. A. Steen (Ed.), Why numbers
count: Quantitative literacy for tomorrow’s America (pp. 75-90). New York: College
Entrance Examination Board.
Gal, I. (2002). Adults’ Statistical Literacy: Meanings, Components, Responsibilities.
International Statistical Review, 70, 1-51.

Resources for Assessing Instructional Outcomes
27
Garfield, J. (2002). The Challenge of Developing Statistical Reasoning. Journal of
Statistics Education [Online], 10(3).
Garfield, J. (2001). Evaluating the Impact of Educational Reform in Statistics: A Survey
of Introductory Statistics Courses. Final Report for NSF Grant REC-9732404.
Garfield, J. and Gal, I. (1999). Assessment and Statistics Education: Current Challenges
and Directions. International Statistical Review, 67, 1-12.
Jones, G. A., Thornton, C. A., Langrall, C. W., Mooney, E. S., Perry, B., & Putt,
I. J. (2000). A Framework for Characterizing Children’s Statistical Thinking,
Mathematical Thinking and Learning, 2, 269-307.
Rumsey, D. J. (2002). Statistical Literacy as a Goal for Introductory Statistics Courses.
Journal of Statistics Education [Online], 10(3).
Tucker, A. and Leitzel, J. (Eds.) (1995). Assessing Calculus Reform Efforts. Washington,
D.C.: Mathematical Association of America.
Wild, C. J., and Pfannkuch, M. (1999). Statistical Thinking in Empirical Enquiry.
International Statistical Review, 67, 223-265.
Wright, B. D., and Stone, M. H. (1979). Best test design: Rasch measurement. Chicago,
IL: MESA Press, University of Chicago.