Embed Size (px)
Citation preview

The Welland River Eutrophication Study in the
Niagara River Area of Concern in Support of the Beneficial
Use Impairment: Eutrophication and Undesirable Algae
March 2011
Niagara River RAP Welland River
Eutrophication Study
Technical Working Group


The Welland River Eutrophication Study in the
Niagara River Area of Concern in Support of the Beneficial
Use Impairment: Eutrophication and Undesirable Algae
March 2011
Written by: Joshua Diamond Niagara Peninsula Conservation Authority
On behalf of:
Welland River Eutrophication Technical Working Group

The Welland River Eutrophication Study in the Niagara River Area of Concern in Support of the Beneficial Use Impairment: Eutrophication and Undesirable Algae Written By: Joshua Diamond Niagara Peninsula Conservation Authority On Behalf: Welland River Eutrophication Technical Working Group Niagara River Remedial Action Plan
For more information contact: Niagara Peninsula Conservation Authority
Valerie Cromie, Coordinator Niagara River Remedial Action Plan Niagara Peninsula Conservation Authority 905-788-3135 [email protected]

The Welland River Eutrophication Study in the Niagara River Area of Concern
_____________________________________________________________________________________________ Niagara River Remedial Action Plan
| i
Welland River Eutrophication Study Technical Working Group
Ilze Andzans Region Municipality of Niagara
Valerie Cromie Niagara Peninsula Conservation Authority
Sarah Day Ontario Ministry of the Environment
Joshua Diamond Niagara Peninsula Conservation Authority
Martha Guy Environment Canada
Veronique Hiriart-Baer Environment Canada
Tanya Labencki Ontario Ministry of the Environment
Dan McDonell Environment Canada
Annie Michaud Niagara College (formerly Niagara Peninsula Conservation Authority)
Mary Ellen Scanlon Ontario Ministry of the Environment
Michael Spencer Ontario Ministry of the Environment
Lara Widdifield City of Welland
Anne Yagi Ontario Ministry of Natural Resources
Acknowledgements
Work by several staff at the Niagara Peninsula Conservation Authority (NPCA) was instrumental
to the completion of this study and their efforts are gratefully acknowledged:
Ryan Kitchen, Andrea Larsen (formerly NPCA) and Lisa Moreira who assisted with
collection of water samples and flow monitoring.
Jayme Campbell, Jeff Lee (formerly NPCA), and Geoff Verkade for contributing
watershed land use data and mapping for this study
Water sampling and flow monitoring by Brian Thornburn of the Ontario Ministry of the
Environment (MOE) was very valuable during this study and is recognized.
The technical advice regarding nutrients export coefficients from Dr. Jenny Winter at the MOE
and Sandra Cooke at the Grand River Conservation Authority (GRCA) was appreciated.
In addition, discussions with Katherine Beehler of St. Lawrence River Restoration Council and
Andrew Morley (MOE) were also helpful.
Administrative support from Debbie Gullett (NPCA) is recognized.

The Welland River Eutrophication Study in the Niagara River Area of Concern
_____________________________________________________________________________________________ Niagara River Remedial Action Plan
| ii
Table of Acronyms
AOC Area of Concern
BMPs Best Management Practices
BOD Bio-chemical (or biological) oxygen demand
BUI Beneficial Use Impairment
CCME Canadian Council of Ministers of the Environment
chla Chlorophyll-a
COD Chemical Oxygen Demand
CSO Combined Sewer Overflow
DO Dissolved Oxygen
EC Environment Canada
GRCA Grand River Conservation Authority
HEC-HMS Hydrologic Engineering Centre-Hydrologic Modeling System
MISA Municipal-Industrial Strategy for Abatement
MNR (Ontario) Ministry of Natural Resources
MOE (Ontario) Ministry of the Environment
NAESI National Agricultural Environmental Standards Initiative
NH3 Total Ammonia
NOD Nitrogenous Oxygen Demand
NPCA Niagara Peninsula Conservation Authority
PWQMN Provincial Water Quality Monitoring Network
PWQO Provincial Water Quality Objectives
RAP Remedial Action Plan
RMN Regional Municipality of Niagara
SEL Severe Effect Level (of provincial sediment quality guideline)
SOD Sediment Oxygen Demand
SOLRIS Southern Ontario Land Resource Information System
SW Storm Water
TKN Total Kjeldahl Nitrogen
TOC Total Organic Carbon
TP Total Phosphorus
TSS Total Suspended Solids
TWG Technical Working Group
WWTP Waste Water Treatment Plant

The Welland River Eutrophication Study in the Niagara River Area of Concern
_____________________________________________________________________________________________ Niagara River Remedial Action Plan
| iii
Table of Contents
Welland River Eutrophication Study Technical Working Group .................................................... i
Acknowledgements ...................................................................................................................... i
Table of Acronyms ...................................................................................................................... ii
Table of Contents ....................................................................................................................... iii
List of Figures ............................................................................................................................ iv
List of Tables ............................................................................................................................. vi
Appendices ............................................................................................................................... vii
1.0 Introduction .......................................................................................................................... 1
1.1 Study Context ................................................................................................................... 1
1.2 Welland River Background ............................................................................................... 1
1.3 Historic Welland River Water Quality ................................................................................ 4
1.4 Water Quality Improvement Programs.............................................................................11
1.5 Welland River Eutrophication Study Objectives ...............................................................12
2.0 Welland River Eutrophication Study ....................................................................................13
2.1 Study Design ...................................................................................................................13
2.2 Study Results ..................................................................................................................16
2.3 Data Summary ................................................................................................................40
3.0 Delisting Criteria ..................................................................................................................42
3.1 Background .....................................................................................................................42
3.2 Delisting Criteria Definition ..............................................................................................42
3.3 Rationale for New Delisting Total Phosphorus Criteria ....................................................43
3.4 Development of New TP Delisting Criteria .......................................................................45
3.5 Consideration for Use of the Revised TP Delisting Criteria ..............................................55
4.0. Recommendations to RAP Coordinating Committee ..........................................................58
4.1 Dissolved Oxygen Study .................................................................................................58
4.2 Target Specific Subwatersheds for Restoration ...............................................................58
4.3 TP Delisting Criteria ........................................................................................................59
4.4 Continued Water Quality Monitoring in Niagara River AOC ............................................62
5.0 Conclusions ........................................................................................................................63
6.0 References..........................................................................................................................65


The Welland River Eutrophication Study in the Niagara River Area of Concern
_____________________________________________________________________________________________ Niagara River Remedial Action Plan
| iv
List of Figures
Figure 1: Extent of the Niagara River Remedial Action Plan and Welland River Watershed
Figure 2: Historic PWQMN Total Phosphorus Concentrations (mg/L) in the Welland River from 1966 to
1996.
Figure 3: Historic PWQMN Phosphate Concentrations (mg/L) in the Welland River from 1966 to 1996.
Figure 4: Combined Sewer Overflows in the City of Welland
Figure 5: Welland River Eutrophication Study (2008-2010) water quality monitoring station locations Figure 6: Box and Whisker Plot of total phosphorus concentrations (mg/L) of Welland River watershed monitoring stations for 2008-2010 (n=24 for each station). The box length of the box-and-whisker plots represents the inter-quartile range that contains the median value shown as a horizontal line. The whiskers represent the minimum and maximum values. Red line represents PWQO (1994) for total phosphorus. Figure 7: Box and Whisker Plot of phosphate concentrations (mg/L) of Welland River watershed monitoring stations for 2008-2010 (n=24 for each station). The box length of the box-and-whisker plots represents the inter-quartile range that contains the median value shown as a horizontal line. The whiskers represent the minimum and maximum values. Figure 8: Box and Whisker Plot of Total Phosphorus (mg/L) of Welland River watershed monitoring stations for 2008-2010 accounting for dry vs. wet weather sampling events (n=16 for dry and n=8 for wet at each station). The box length of the box-and-whisker plots represents the inter-quartile range that contains the median value shown as a horizontal line. The whiskers represent the minimum and maximum values. Star symbols of the same colour denote significant differences (Mann Whitney U-Test, p<0.05) between dry and wet sampling at a water quality station. Figure 9: Box and Whisker Plot of Total Phosphorus (mg/L) of Welland River subwatershed monitoring stations for 2008-2010 accounting for dry vs. wet weather sampling events (n=16 for dry and n=8 for wet at each station). The box length of the box-and-whisker plots represents the inter-quartile range that contains the median value shown as a horizontal line. The whiskers represent the minimum and maximum values. Star symbols of the same colour denote significant differences (Mann Whitney U-Test, p<0.05) between dry and wet sampling at a water quality station.
Figure 10: Weekly Total Phosphorus (TP) Concentrations for Oswego (OS001), Beaver (BV001) and Big Forks (BF001) Creek Stations from March to November 2010 (n=34 for each station). Red line represents PWQO (1994) for total phosphorus. Figure 11: Weekly Phosphate Concentrations for Oswego (OS001), Beaver (BV001) and Big Forks (BF001) Creek Stations from March to November 2010 (n=34 for each station).
Figure 12: Total Phosphorus Loads (kg/ha/yr) for Welland River subwatersheds, City of Welland CSOs, Non-Niagara River AOC stations Twenty Mile Creek and Grand River (Fairchilds Creek, Boston Creek and McKenzie Creek) using actual water quality data (2003-2010) and modelled runoff.
Figure 13: Box and Whisker Plot of Nitrate/Nitrogen concentrations (mg/L) of Welland River watershed monitoring stations for 2008-2010 (n=69 for each station). The box length of the box-and-whisker plots represents the inter-quartile range that contains the median value shown as a horizontal line. The whiskers represent the minimum and maximum values. Red line represents CCME water quality guideline (2007) of 2.9 mg/L for nitrate-nitrogen.

The Welland River Eutrophication Study in the Niagara River Area of Concern
_____________________________________________________________________________________________ Niagara River Remedial Action Plan
| v
Figure 14: Box and Whisker Plot of Un-ionized Ammonia concentrations (mg/L) of Welland River watershed monitoring stations for 2008-2010 (n=69 for each station). The box length of the box-and-whisker plots represents the inter-quartile range that contains the median value shown as a horizontal line. The whiskers represent the minimum and maximum values. Red line represents PWQO (1994) of 0.02 mg/L for Un-ionized Ammonia. Figure 15: Box and Whisker Plot of Total Nitrogen concentrations (mg/L) of Welland River watershed monitoring stations for 2008-2010 (n=69 for each station). The box length of the box-and-whisker plots represents the inter-quartile range that contains the median value shown as a horizontal line. The whiskers represent the minimum and maximum values. Red line represents published concentration for eutrophic water quality conditions for streams (Dodds et al. 1998) of 1.5mg/L for total nitrogen. Figure 16: Box and Whisker Plot of uncorrected Chlorophyll-a concentrations (µg/L) of the Welland River watershed monitoring stations for 2008-2010 (n=69 for each station). The box length of the box-and-whisker plots represents the inter-quartile range that contains the median value shown as a horizontal line. The whiskers represent the minimum and maximum values. Red line represents NASEI (2008) sestonic chla target of 5 µg/L. Figure 17: Box and Whisker Plot of monthly uncorrected Chlorophyll-a concentrations (µg/L) of pooled watershed monitoring stations for 2008-2010 (n=69 for each month except April n=46, July n=46). The box length of the box-and-whisker plots represents the inter-quartile range that contains the median value shown as a horizontal line. The whiskers represent the minimum and maximum values. Red line represents NASEI (2008) sestonic chla target of 5 µg/L. Figure 18: Dissolved Oxygen Data Logger Locations 2008-2010. Figure 19: Scatter plot of mean surface water TP concentrations (µg/L) 2008-2009 and Sediment TP concentrations (µg/g dry) 2008-2009 for select monitoring stations in the Welland River watershed. Figure 20: Nomogram of Actual and Target (urban – green line; crops – blue line; pasture – red line) Annual Average Phosphorus Concentrations at Tributary Mouths for a Given Percentage of Disturbance in the Watershed, Based on Export Coefficients for Crops and Pasture from Winter and Duthie (2000).

The Welland River Eutrophication Study in the Niagara River Area of Concern
_____________________________________________________________________________________________ Niagara River Remedial Action Plan
| vi
List of Tables
Table 1: Total phosphorus, ammonia, and total Kjeldahl nitrogen loadings and proportions of loadings
from different land-uses within the Welland River watershed. Source - RMN, 2003 and MOE, 2005
Table 2: Phosphorus, ammonia, and total Kjeldahl nitrogen loadings to the Welland River from different
land-use types, normalized by area (km2) of that land-use type within the watershed. Source - RMN, 2003
and MOE, 2005
Table 3: Summary of monitoring stations sampled during the 2008-2010 field seasons
Table 4: Mean TP, mean phosphate and mean percent phosphate for Welland River watershed stations
(2008-2010)
Table 5: Summary of calculated TP export coefficients calculated using two different conditions: 1)
modeled runoff and mean TP for 2003-2010, and 2) empirical flow data and mean TP for 2008-2010
Table 6: Summary of ranked TP export coefficients (highest to lowest) calculated using two different
conditions (as described in Table 5)
Table 7: Provincial Water Quality Objectives for Dissolved Oxygen (1994).
Table 8. Pearson Correlation Coefficient Summary (n=573 for all other combinations) for pooled 2008-
2010 data. Yellow highlighted cells represent significant relationship to 0.05 level.
Table 9. Station Specific Pearson Correlation Coefficient Summary (n=24 for all other combinations) for
2008-2010 data. Yellow highlighted cells represent significant relationship to 0.05 level. Green highlighted
cells represent significant relationship to 0.01 level.
Table 10: MOE sediment sampling results for 2008 and 2009. Yellow cells indicate that MOE Lowest
Effect Level has been exceeded and Red cells indicate Severe Effect Level has been exceeded.
Table 11: Published Stream Total Phosphorus Criteria for riverine Systems in Canada.
Table 12: Total phosphorus export Coefficients (kg/ha/yr) in well managed systems for Urban, Crops,
Pasture, and Woodland Land Uses (Winter and Duthie 2000) and mean TP concentration for a fictitious
watershed with runoff of 0.30 m/yr.
Table 13: Percentage of Land Disturbance for Each Subwatershed based on SOLRIS (2006 & 2007)
Table 14: Total Phosphorus Delisting Criteria derived from Export Coefficient Approach #1 using TP
Export Coefficients from Winter and Duthie (2000) and runoff values from Natural Resources Canada
mapping (2009).
Table 15: Welland River Subwatershed Delisting Criteria and Loading Target using Export Coefficient
Approach #1.

The Welland River Eutrophication Study in the Niagara River Area of Concern
_____________________________________________________________________________________________ Niagara River Remedial Action Plan
| vii
Table 16: Subwatershed Run-off Values from Niagara Peninsula Conservation Authority and
AquaResources Inc. 2010.
Table 17: Welland River Subwatershed Delisting Criteria and Loading Target using Export Coefficient
Approach #2.
Table 18: Welland River Subwatershed Delisting Criteria and Loading Target using Export Coefficient
Approach #3.
Table 19: Welland River Subwatershed Delisting Criteria and Loading Target using 25th Percentile of
Long-Term water quality monitoring data (2003-2010) for each subwatershed
Table 20: Welland River Subwatershed Delisting Criteria using Reference Watersheds (Twenty Mile
Creek and Grand River) of Long-Term water quality monitoring data (2003-2010) for each subwatershed
Appendices
Appendix A: Terms of Reference Appendix B: Technical Working Group Meeting Minutes Appendix C: Monitoring Stations Appendix D: Area of Concern Water Quality Data Summary Tables Appendix E: Total Phosphorus & Phosphate Charts Appendix F: Precipitation 2008 – 2010 Appendix G: Total Phosphorus Loads Appendix H: Chlorophyll 2008 – 2010 Appendix I: Dissolved Oxygen Profiles Appendix J: Correlations Appendix K: Regression Equations

The Welland River Eutrophication Study in the Niagara River Area of Concern
Niagara River Remedial Action Plan
1
1.0 Introduction
1.1 Study Context
The Welland River Eutrophication Study was conducted in response to an Environment Canada
(EC) Technical Review (2007) of the Beneficial Use Impairments (BUIs) and delisting criteria
identified in the Niagara River Area of Concern (AOC) Stage 2 Report (1995). This review
recognized that the existing delisting criteria for the BUI: Eutrophication and Undesirable Algae
required updating, but also recognized the need for further study to fill data gaps. These
recommendations are summarized in Appendix H of the Technical Review (2007). The Terms of
Reference and subsequent Workplan for the Welland Eutrophication Study were written and
implemented in late 2007 to address these data gaps and to outline the various monitoring
requirements and study deliverables. These documents are found in Appendix A.
The Welland River Eutrophication Study was a three year study (2008-2010) led by the Niagara
Peninsula Conservation Authority (NPCA) in partnership with the City of Welland, EC, Ontario
Ministry of the Environment (MOE), Ontario Ministry of Natural Resources (MNR), and the
Regional Municipality of Niagara (RMN). The Study was overseen by a Technical Working
Group (TWG) comprising of study partners with relevant expertise in Eutrophication and Algae
ecology. The TWG approved the Study Work Plan and met annually to discuss yearly results
compiled by the NPCA in Technical Reports. The Minutes for all TWG meetings are found in
Appendix B.
1.2 Welland River Background
The Welland River is the largest river tributary to the Niagara River Area of Concern (AOC).
Located above the Niagara Escarpment, the Welland River watershed is a dense network of
smaller tributaries with similar characteristics to the main river. It flows in an easterly direction,
from its headwaters south-west of Hamilton in the Mount Hope area, and meanders over a
course of 132 km until it reaches the Queenston-Chippawa Power Canal into which it presently
discharges. It drains lands in Haldimand, Norfolk and Niagara over an area of approximately
880 km2 and its watershed encompasses over 80% of the Canadian portion of the AOC (Figure
1). The Welland River watershed is in the Haldimand Clay Plain. The basin is very flat with an
average gradient of 0.58 metres/kilometres and, due to the clay soils, it is imperfectly drained.
In 1792, the river was described as “a dull muddy river running through a flat swampy country”
by Mrs. Simcoe, wife of the first Lieutenant Governor of Upper Canada. Within the watershed,
the major economic activity is agriculture and there are no major industries located upstream of
the City of Welland.

The Welland River Eutrophication Study in the Niagara River Area of Concern
Niagara River Remedial Action Plan
2
Figure 1: Extent of the Niagara River Remedial Action Plan and Welland River Watershed

The Welland River Eutrophication Study in the Niagara River Area of Concern
Niagara River Remedial Action Plan
3
Historically, the Welland River drained into the Niagara River at the Town of Chippawa. Along
its entire route, the Welland River has been greatly altered by humans. In 1971, the NPCA
constructed a dam on the river near Binbrook in the upper reaches of the watershed which
created Lake Niapenco, also known as the Binbrook Reservoir. The dam was created for the
purpose of low flow augmentation as the river often experienced periods of zero flow during
drought conditions. Continuing eastward the river also flows through the City of Welland where it
is siphoned under the Old and New Welland Ship Canals. The final outlet of Welland River
water is via the Power Canal to the lower Niagara River at Sir Adam Beck generating stations.
Considerable alterations made to the Welland River since European settlements have created
an extremely complex system. The river has been channelized, relocated, dredged and diverted
for both shipping and hydroelectric production. It has been described as one of the most
complex river systems in Ontario, with seven physically different sections (Upper Welland River,
Lake Niapenco (Binbrook Reservoir), Welland River upstream of Port Davidson Weir, Welland
River West of Welland to the Port Davidson Weir, Between the Two Canals (Lake Erie
Diversion), Downstream of the New Canal to Power Canal and the Power Canal to Niagara
River (Chippawa Channel, Niagara River Diversion). The net result of these activities causes
flow barriers to the Welland River which, in turn, creates water dilution, sediment and pollutant
trapping, and flow reversal patterns in the river. This situation makes it difficult to determine
both the source and fate of sediment, phosphorous, bacteria and other pollutants entering the
Welland River. The river exhibits all of the qualities of a degraded system (i.e. impaired water
quality, and impaired fish & wildlife habitat and their communities).
In summary, the significant changes since European settlement include:
Significant reduction of forest cover from urban development and agricultural practices;
Draining of the land for agriculture;
Increased erosion related to construction, agriculture and cattle access;
Nutrient loading from Waste Water Treatment Plant and Combined Sewer Overflows;
Impacts from the development and management of Binbrook Reservoir;
Installation of weirs along various creeks and tributaries to the River;
Changes associated with the construction of the Welland shipping canals;
Historical dredging of the river channel from Port Davidson to the Niagara section of the
River;
Changes in flow regimes arising from diversions of water into and out of the Welland
River and the flow reversal in the lower portion of the River due to hydroelectric
operations; and
Daily fluctuations in levels and flows from the control of the Chippawa-Grass Island Pool
levels.

The Welland River Eutrophication Study in the Niagara River Area of Concern
Niagara River Remedial Action Plan
4
1.3 Historic Welland River Water Quality
Ambient water quality monitoring of the Welland River dates back to 1966 and continues to
1991 with water samples collected through the Provincial Water Quality Monitoring Network
(PWQMN). The MOE continued monitoring at the Montrose Road station until 2003. In 1994 to
1996 the NPCA received a sampling allotment for continued water quality monitoring in the
Welland River watershed.
The greatest problem identified in the historic water quality dataset of the Welland River
upstream of the City of Welland is the chronically high phosphorus concentrations and its
related effects throughout the watershed (RAP 1995). Total phosphorus (TP) concentrations
(Figure 2) during this historic data set regularly exceeded the Provincial Water Quality Objective
(PWQO) of 0.03 mg/L (MOE 1994). Generally, TP concentrations increase in the Welland River
watershed from the headwater sections to the lower reaches near the City of Welland. It is at
this point where the redirection of Niagara River water down the Welland River in Chippawa for
Ontario Power Generation causes a dilution effect on water quality parameters. Historic
phosphate concentrations (Figure 3) in the Welland River follow a similar trend to TP
concentrations.

The Welland River Eutrophication Study in the Niagara River Area of Concern
Niagara River Remedial Action Plan
5
Figure 2: Historic PWQMN Total Phosphorus Concentrations (mg/L) in the Welland River from 1966 to 1996.

The Welland River Eutrophication Study in the Niagara River Area of Concern
Niagara River Remedial Action Plan
6
Figure 3: Historic PWQMN Phosphate Concentrations (mg/L) in the Welland River from 1966 to 1996.

The Welland River Eutrophication Study in the Niagara River Area of Concern
Niagara River Remedial Action Plan
7
The Welland River is the largest tributary of the Canadian portion of the Niagara River AOC and
was identified through the RAP Stage 1 (Remedial Action Plan 1993) and RAP Stage 2
(Remedial Action Plan 1995) reports as a potential source for various contaminants to the
Niagara River. The RAP evaluated the impairment status of several BUIs in the Niagara River
RAP including the BUI: Eutrophication and Undesirable Algae. This evaluation designated the
BUI: Eutrophication and Undesirable Algae in the Niagara River AOC as impaired.
In 2001, the NPCA initiated a Water Quality Monitoring Program with the purpose of gathering
long-term surface water quality data. The funding for this program is supported through multiple
partnerships. Within the Niagara River AOC, the MOE has reactivated two dormant PWQMN
stations. The City of Hamilton and RMN provide funding for staff and lab analysis. EC has
provided funding for this program for lab analysis through the Great Lakes Sustainability Fund.
The current network of 73 water quality monitoring stations represents the largest and most
comprehensive water quality monitoring program in the Niagara Peninsula. Water quality data
collected through this program has been summarized in NPCA Annual Water Quality Reports
(NPCA 2006-2010) and other Niagara River RAP reporting requirements (NPCA 2003, NPCA
2004). Water quality monitoring of the Welland River through this program continues to
regularly find total phosphorus concentrations in the Welland River in exceedence of the PWQO
(MOE 1994).
Between 2005 and 2007, a 10-year review of the framework for implementation of remedial
actions was undertaken as part of the Niagara River (Ontario) RAP. This included review and,
where applicable, revision of the status of BUIs. The EC (2007) Technical Review of
Impairments and Delisting Criteria. Niagara River (Ontario) RAP reported anecdotal evidence of
persistent and reoccurring algal blooms in the Welland River from the mid-1990s until 2007.
This anecdotal evidence was mainly based on comments made by residents living in the
Welland River watershed often in the summer. However, there is very little scientific data to
verify that algae blooms are regularly occurring in the Welland River as a consequence of high
nutrient concentrations. A water quality study of Binbrook Reservoir by the MOE staff (Gemza
1993) included an algae assessment and this study concluded the occurrences of algae blooms
were very infrequent. But there were some blue-green algae blooms noted in mid to late
summer. This generally agrees with NPCA field and technical staff observations over the years.
The EC Technical Review (2007) reported dissolved oxygen (DO) conditions were found in
several sections of the Welland River were below PWQO (MOE 2004). This was mainly based
on DO monitoring the NPCA conducted in the night-time of August 1994 to determine if low DO
conditions were occurring. The NPCA determined that 86% of the night-time results were below
the PWQO (MOE 2004). The EC Technical Review (2007) also used daytime supersaturation
of DO as an indicator of the risk of oxygen depletion due to algal or macrophyte respiration. At
NPCA Welland River water quality stations in 2003 and 2004, percent saturation of DO
exceeded 100% in 19% of (25 of 129) samples. The EC Technical Review suggested DO
impairments are likely caused by algae blooms and decomposition, macrophyte overgrowth and
bio-chemical oxygen demand (BOD) from the City of Welland Combined Sewer Overflows
(CSOs) and Waste Water Treatment Plant (WWTP). In 2007, NPCA deployed a DO logger in

The Welland River Eutrophication Study in the Niagara River Area of Concern
Niagara River Remedial Action Plan
8
the Welland River at E.C. Brown Conservation Area and observed sustained DO conditions that
were below the PWQO for parts of the summer. This supports EC Technical Review of the
existing data that concentrations of DO are below the PWQO in some sections of the Welland
River. Further data was still needed to determine the spatial range of these DO impairments.
In 2003, the RMN retained consultants as part of the Niagara Water Quality Protection Strategy
(RMN 2003). These consultants carried out a simple mass balance modeling of contaminant
loads in watersheds across the Niagara Peninsula and the Welland River. This analysis was
incorporated into the EC Technical Review (2007) of the BUI for Eutrophication and Undesirable
Algae. Modeling was conducted for TP, total Kjeldahl nitrogen (TKN), and total ammonia (NH3),
as well as other contaminants (E. coli, copper, Total Suspended Solids (TSS). Results were
categorized by land area or effluent source including, CSO, urban storm water (SW), urban
WWTP, agricultural lands, and parks/open space/forest (classed as “other”). Additional nutrient
loading data was supplied by the MOE (2005) through Municipal-Industrial Strategy for
Abatement (MISA) contaminant load calculations based on recent (2000-2002) effluent
monitoring at WWTPs within the Welland watershed. Results of this work are shown in Table 1
and Table 2 below.
Table 1: Total phosphorus, ammonia, and total Kjeldahl nitrogen loadings and proportions of loadings from different land-uses within the Welland River watershed. Source - RMN, 2003 and MOE, 2005
Land-Use TP (kg/yr) % NH3 (kg/yr) % TKN (kg/yr) %
Urban SW 2192.00 3.03 2192.00 0.78 1461.40 0.36
Urban CSO 867.00 1.20 N/A 0.00 N/A 0.00
Urban WWTP 7442.83 10.30 131813.43 46.68 156670.87 38.65
Agriculture 58993.63 81.67 145610.65 51.56 226823.84 55.95
Other 2738.54 3.79 2786.06 0.99 20417.65 5.04
Total 72234.00 100.00 282402.14 100.00 405373.76 100.00
Table 2: Phosphorus, ammonia, and total Kjeldahl nitrogen loadings to the Welland River from different land-use types, normalized by area (km
2) of that land-use type within the watershed. Source - RMN, 2003
and MOE, 2005
Land-Use Area (km2) TP (kg/km
2/yr) NH3 (kg/km
2/yr) TKN (kg/km
2/yr)
Urban 20.50 512.18 6535.57 7712.26
Agriculture 760.37 77.59 191.50 298.31
Other 417.03 6.57 6.68 48.96

The Welland River Eutrophication Study in the Niagara River Area of Concern
Niagara River Remedial Action Plan
9
A summary of RMN 2003 study results are as follows:
Phosphorus loading from urban stormwater, agricultural land, and other lands was
determined by mass balance modeling (RMN 2003). Loadings from CSOs were
estimated using the XP-SWMM model and 1980 rainfall data (RMN 2003). Loadings
from the City of Welland and Port Robinson Lagoon WWTPs were provided by MOE
(MOE 2005);
Agricultural land uses are the greatest source of phosphorus to the Welland River;
Urban areas contribute a much greater load of nutrients per unit area based on the data
shown above;
Modeling results have not been calibrated with observed water quality.
The City of Welland is serviced by a complex collection system that includes a total of 18 CSO
locations, a deep interceptor sewer, a storage facility, and two major pumping stations (RV
Anderson and Associates and XCG Consultants LTD 2003). Figure 4 shows the location of the
CSOs in the City of Welland. A review conducted by RV Anderson and Associates and XCG
Consultants LTD. (2003) found surcharge data along the interceptor sewer indicated
surcharging conditions frequently occurred in the interceptor sewer during wet weather events.
They also reported that during these wet weather events the hydraulic grade line in the
interceptor sewer would exceed the overflow elevations at a number of CSO locations.
Overflows at other locations were occurring due to the limited capacity of the diversion
structures.
CSOs continue to affect the water quality of the Welland River. In 2009, the City of Welland and
the RMN initiated a project to complete major sewer separation works in various areas of the
City and to become compliant with the Ontario Ministry of the Environment Procedure F-5-5
(MOE 2001). It is anticipated that through this project 100% of the remaining CSOs will be
separated within the next 8-10 years and 75% of wet weather flows will be captured upon
completion of this separation.

The Welland River Eutrophication Study in the Niagara River Area of Concern
Niagara River Remedial Action Plan
10
Figure 4: Combined Sewer Overflows in the City of Welland
The Welland River Eutrophication Study in the Niagara River Area of Concern
Niagara River Remedial Action Plan
11
1.4 Water Quality Improvement Programs
Since the establishment of the Niagara River AOC there have been many efforts to improve
water quality in the Welland River watershed. The following items highlight the progress towards
Implementing Priority RAP Actions to improve Welland River water quality. These include:
The NPCA’s Water Quality and Habitat Improvement Program received over $2.6M from
Environment Canada’s Great Lakes Sustainability Fund over 15 years (1994-2009) and
restored wetland (147 ha), riparian (54 km) and forest (338 ha) habitats. It has also
funded the containment of 81,776 m3/yr of manure and fenced 2,515 livestock;
Completion of the detailed assessment for the 14 potentially contaminated sediment
areas identified in the Stage 1 and Stage 2 documents;
Completion of the Welland River Reef Cleanup Project to address Recommendation #16
in the RAP Stage 2 report (1995);
The City of Welland’s new Official Plan incorporates RAP supported policies for
contaminated sediments in Lyon’s Creek East; Natural Heritage; urban stormwater,
reduction of CSOs, etc;
Stormwater Management, Erosion and Sediment Policies completed through the
Niagara Water Strategy for implementation by municipalities;
Removal and mitigation of barriers to fish migration completed by the Niagara
Restoration Council;
Establishment of the Niagara Peninsula Conservation Authority’s (NPCA) GIS
restoration database;
Natural Heritage Inventory of the Niagara River AOC report and mapping completed;
Development of Natural Heritage Strategy for entire Niagara Region underway in
collaboration with stakeholders;
Ongoing implementation of the agreement between NPCA and Ontario Power
Generation to mitigate the effects of Welland River flow reversal through restoration
strategies such as wetland securement, riparian plantings, fish spawning improvements,
etc;
Ongoing sanitary/storm sewer separation in the City of Welland to reduce bypasses at
the Water Pollution Control Plant;
Regional and municipal infrastructure upgrades;
Fisheries Community Monitoring and Implementation of the Walleye restoration project
in the Welland River West and habitat enhancement projects planned (with some
already implemented);
Completion of the Niagara River Watershed Fish Community Assessment (2003 to
2007) by the MNR. This draft report indicates that the Welland River Fish Community
has begun moving along the path to recovery from the severe pollution in the 1960s
(partially due to uncontrolled sewage discharge) and implementation of MOE policy
F-5-5.

The Welland River Eutrophication Study in the Niagara River Area of Concern
Niagara River Remedial Action Plan
12
1.5 Welland River Eutrophication Study Objectives
The purpose of the Welland River Eutrophication Study is to refine and implement the
Recommendations for Monitoring and Assessment as formulated by the 2007 Technical Review
Committee in Appendix H Eutrophication and Undesirable Algae. This is accomplished by
addressing the following study objectives:
1) Characterize the biological response of the Welland River to high phosphorus inputs
including the type, frequency, location and timing of algal blooms, and whether oxygen
depletion (anoxia) is occurring in relation to aquatic plant and algae overgrowth;
2) Characterize concentrations of plant-available phosphorus versus sediment-bound
phosphorus along the length of the Welland River;
3) Develop delisting criteria for the Welland River upstream of the Old Welland Canal which
identify the desired conditions in the river with regard to dissolved oxygen and
abundance of algae/aquatic plants;
4) Develop phosphorus loading targets for different subwatersheds of the Welland River
upstream of the Old Welland Canal to meet delisting criteria, and;
5) Monitor success in meeting ambient targets for the Welland River through alterations to
the existing AOC Tributary Monitoring Program.
The information found within this report is intended to assist the Niagara River RAP
Coordinating Committee in determining the current Welland River watershed conditions relative
to what the TWG believes are desirable and achievable goals for the BUI: Eutrophication and
Undesirable Algae. Recommendations and conclusions are provided at the end of this report
based on the data examined by the TWG.

The Welland River Eutrophication Study in the Niagara River Area of Concern
Niagara River Remedial Action Plan
13
2.0 Welland River Eutrophication Study
2.1 Study Design
In January 2008, the Technical Working Groups (TWG) approved the Study Work Plan found in
Appendix A. As part of this Work Plan the results of each field season were reviewed by the
TWG at the end of each field season. The Niagara Peninsula Conservation Authority (NPCA)
produced annual Technical Reports (2008, 2009, and 2010) to summarize each field season’s
results. This allowed the TWG group an opportunity to adjust the next field season’s monitoring
to address any identified data gaps.
As part of the Work Plan, the NPCA continued to collect surface water quality grab samples at
23 monitoring stations in the Welland River watershed (Figure 5). Photos of the sample
stations can be found in Appendix C. Samples were collected monthly from April to November
each year of 2008, 2009 and 2010, and a mix of both dry and wet weather sampling was
conducted. All samples were analyzed for nutrients, metals, bacteria, suspended solids, and
general chemistry. These samples were sent for analysis at one or in some cases multiple
laboratories, including the City of Hamilton Environmental Laboratory, Exova Accutest
Laboratory in Ottawa, and the Ontario Ministry of the Environment (MOE) laboratory in Toronto.
All three labs are accredited and the location where each sample was sent for analysis can be
found in Table 3. The use of multiple labs for analysis reflects the funding arrangements and in-
kind contributions that the NPCA has with its partners. To account for any potential differences
in lab analysis for key study parameters, the TWG required duplicate samples be collected at all
23 stations and sent to the MOE lab for nutrient analysis as a quality assurance/quality control
measure.

The Welland River Eutrophication Study in the Niagara River Area of Concern
Niagara River Remedial Action Plan
14
Figure 5: Welland River Eutrophication Study (2008-2010) water quality monitoring station locations

The Welland River Eutrophication Study in the Niagara River Area of Concern
Niagara River Remedial Action Plan
15
Table 3: Summary of monitoring stations sampled during the 2008-2010 field seasons
Station Watershed Laboratory Municipality Sample Location
WR00A Welland River Hamilton City of Hamilton Book Street
WR000 Welland River Hamilton City of Hamilton Butter Road
WR001 Welland River Hamilton City of Hamilton Airport Road
WR002 Welland River Hamilton City of Hamilton Airport Road
WR003 Welland River Hamilton City of Hamilton Tyneside Road
WR004 Welland River Hamilton City of Hamilton Harrison Road
WR005 Welland River Exova West Lincoln Church Road
WR006 Welland River Exova Township of West Lincoln Port Davidson Weir
WR007 Welland River MOE City of Welland O'Reilly's Bridge
WR010 Welland River MOE City of Welland Bigger Road
BF001 Big Forks Creek Exova Township of Wainfleet Gents Road
BU000 Buckhorn Creek Hamilton City of Hamilton Trimble Road
BU001 Buckhorn Creek Hamilton City of Hamilton Haldibrook Road
BV001 Beaver Creek Exova Township of West Lincoln Canborough Road
CO001 Coyle Creek Exova City of Welland Pelham Road
DR001 Drapers Creek Exova City of Welland Colbeck Road
EL001 Elsie Creek Exova Township of West Lincoln Regional Road #9
GR001 Grassy Brook Exova City of Niagara Falls Montrose Road
LY003 Lyons Creek Exova City of Niagara Falls Stanley Avenue
MI001 Mill Creek Exova Township of West Lincoln Regional Road #14
OS001 Oswego Creek Exova Haldimand County Diltz Road
OS002 Oswego Creek Exova Haldimand County Canborough Road
TE001 Tee Creek Exova City of Niagara Falls Schisler Road
The TWG identified the need to collect sestonic chlorophyll-a (chla) samples to provide an
estimate of algae concentrations in the Welland River. To do this, supplementary grab samples
were collected monthly from April to November 2008, from May to November 2009 and from
April to November 2010 (no results from July 2010) at all 23 stations. All samples collected were
sent to the Canada Centre for Inland Waters laboratory for analysis. Chla samples were
corrected when pheophytin, a degradation product of chlorophyll, had become high enough to
show up at the same absorption peak as chla. The correction involves acidifying the sample and
re-running the analysis. However, to be conservative for this analysis only the uncorrected
concentrations are reported in this section. The TWG also identified the need to collect
Dissolved Oxygen (DO) in the Welland River watershed as part of this study. The NPCA and
MOE deployed DO loggers in the main Welland River channel and in various subwatersheds
each field season. Specific details regarding sample location will be discussed later in the
report. For the 2010 field season, weekly water samples at three tributaries (BV001, BF001 and
OS001) were collected to capture a larger number of wet weather events.
The NPCA and MOE recorded flow measurements during grab sampling where conditions
permitted safe access. Depth and velocity measurements were recorded along a single transect
at each station. Where watercourse conditions were too deep for access, a stage measurement
was recorded and a discharge was determined using NPCA rating curves where available.

The Welland River Eutrophication Study in the Niagara River Area of Concern
Niagara River Remedial Action Plan
16
2.2 Study Results
Sections 2.2.1 to 2.2.7 summarize the water quality data collected by the TWG during the 2008
to 2010 field seasons. Water quality parameters that are examined in this study include total
phosphorus, phosphate, total nitrogen, nitrate, un-ionized ammonia, sestonic chlorophyll-a, and
DO in the Welland River and its tributaries. Concentrations of nutrients in stream sediment are
also summarized for select locations. All water quality data for each station is found in
Appendix D.
2.2.1 Phosphorus
Phosphorus is a natural element found in rocks, soils and organic material and is an essential
nutrient for plant growth (Smith 1992). Phosphorus clings tightly to soil particles and is often
associated with suspended sediment. In natural and minimally impacted aquatic ecosystems
phosphorus is generally in short supply and limits biological growth. However, in human
impacted aquatic ecosystems excessive phosphorus concentrations can stimulate overgrowth
of algae and other aquatic plants. The decomposition of this organic matter in turn depletes DO
concentrations and stresses aquatic organisms such as fish and benthic invertebrates.
Anthropogenic sources of phosphorus include fertilizers, and sewage discharges.
Total phosphorus is a measure of all forms of phosphorus in a water sample, and includes
biologically available forms. This section will report on total phosphorus and phosphate. The
interim Ontario Provincial Water Quality Objective (PWQO) for total phosphorus in streams and
rivers is 30 µg/L (MOE 1994). This interim guideline represents the concentration of total
phosphorus required to eliminate excessive plant growth in rivers and streams. There is no
PWQO for phosphate, but the relative proportion of phosphate to total phosphorus can provide
some understanding of potential biological response of the aquatic ecosystem system to this
nutrient.
Both total phosphorus (TP) and phosphate were analyzed in samples collected from April to
November in 2008-2010 for all stations. To achieve appropriate detection limits for this study
total phosphorus samples were sent to Exova Laboratories and phosphate samples were
analyzed at the MOE lab as filtered reactive phosphate (PO43).
Ninety-nine percent of the grab samples collected in the 2008-2010 study failed to meet the
interim PWQO of 30 µg/L for total phosphorus. Box and whisker plots of total phosphorus and
phosphate concentrations are illustrated in Figure 6 and Figure 7 for each station. Monthly
concentrations for total phosphorus and phosphate were plotted together to illustrate seasonal
phosphorus variation at each station and are provided in Appendix E. The Welland River
watershed has a significant phosphorus problem with mean TP concentrations for each station
ranging from 200% to 1500% greater than the PWQO. The highest total phosphorus
concentrations were observed at Big Forks Creek (BF001), Buckhorn Creek (BU000 & BU001),
Beaver Creek (BV001), Oswego Creek (OS001 & OS002) and Tee Creek (TE001). Generally,

The Welland River Eutrophication Study in the Niagara River Area of Concern
Niagara River Remedial Action Plan
17
TP concentrations in the main Welland River channel were similar except for station WR010
where a decline in TP concentration was observed. This is likely due to mixing and dilution from
the Niagara River. The agricultural watersheds of Coyle Creek (CO001), Lyons Creek (LY003)
and Mill Creek (MI001) as well as the urbanized watershed of Drapers Creek (DR001) had the
lowest observed TP concentrations.
Figure 6: Box and Whisker Plot of total phosphorus concentrations (mg/L) of Welland River watershed monitoring stations for 2008-2010 (n=24 for each station). The box length of the box-and-whisker plots represents the inter-quartile range that contains the median value shown as a horizontal line. The whiskers represent the minimum and maximum values. Red line represents PWQO (1994) for total phosphorus.

The Welland River Eutrophication Study in the Niagara River Area of Concern
Niagara River Remedial Action Plan
18
The proportion of mean phosphate of mean total phosphorus concentrations for samples
collected in the main Welland River channel ranged from 4% - 58% (Table 4). Phosphate
concentrations increased sharply in the Welland River between stations WR004 and WR005
(Figure 7). This increase in phosphate concentrations continues downstream and peaks at
station WR007 before decreasing at station WR010 likely due to mixing with the Niagara River
(Figure 6). The proportion of phosphate observed in the Welland River tributaries ranged from
24% to 68% with most of these stations exceeding 50% (Table 4). The highest concentrations
of phosphate were observed in Big Forks (BF001), Beaver Creek (BV001), Oswego Creek
(OS001), and Tee Creek (TE001).
Figure 7: Box and Whisker Plot of phosphate concentrations (mg/L) of Welland River watershed monitoring stations for 2008-2010 (n=24 for each station). The box length of the box-and-whisker plots represents the inter-quartile range that contains the median value shown as a horizontal line. The whiskers represent the minimum and maximum values.

The Welland River Eutrophication Study in the Niagara River Area of Concern
Niagara River Remedial Action Plan
19
Table 4: Mean TP, mean phosphate and mean percent phosphate for Welland River watershed stations (2008-2010)
Station Mean TP (mg/L) Mean Phosphate (mg/L) % Phosphate
WR00A 0.35 0.05 15
WR000 0.24 0.03 12
WR001 0.21 0.01 5
WR002 0.21 0.01 4
WR003 0.27 0.04 16
WR004 0.22 0.01 6
WR005 0.21 0.08 38
WR006 0.25 0.10 40
WR007 0.24 0.14 58
WR010 0.08 0.05 58
BF001 0.36 0.24 68
BU000 0.39 0.11 27
BU001 0.45 0.11 24
BV001 0.44 0.31 69
CO001 0.16 0.08 46
DR001 0.15 0.07 49
EL001 0.21 0.11 52
GR001 0.26 0.15 56
LY003 0.16 0.09 54
MI001 0.17 0.09 55
OS001 0.39 0.23 58
OS002 0.28 0.13 46
TE001 0.38 0.26 67
Based on field staff observations and precipitation data (Appendix F), water quality sampling
dates were identified as dry or wet weather events. Dry and wet-weather TP concentrations for
the Welland River and subwatershed tributaries are shown in Figures 8 and 9. Based on these
data, it was found only the mid-sections of the Welland River (WR005, WR006, and WR007)
and four subwatershed tributaries (BU001, CO001, MI001 and OS002) had significantly greater
TP concentrations (p<0.05, Mann Whitney U-Test) during wet weather events. This may
suggest that these stations are more responsive to wet weather events than other stations.
Surprisingly, Draper’s Creek station (DR001) was observed to be the least responsive to wet
weather events despite being the most urbanized tributary in the Welland River watershed.
However, the TWG agreed that these data are limited and only provide a coarse examination of
wet weather sampling because wet weather events were not directly targeted in 2008 and 2009.
In 2010, the TWG deployed an ISCO automatic sampler on Beaver Creek (BV001) to target wet
weather events, but lack of precipitation during the sample period only allowed for one
composite sample to be collected.

The Welland River Eutrophication Study in the Niagara River Area of Concern
Niagara River Remedial Action Plan
20
Figure 8: Box and Whisker Plot of Total Phosphorus (mg/L) of Welland River watershed monitoring stations for 2008-2010 accounting for dry vs. wet weather sampling events (n=16 for dry and n=8 for wet at each station). The box length of the box-and-whisker plots represents the inter-quartile range that contains the median value shown as a horizontal line. The whiskers represent the minimum and maximum values. Star symbols of the same colour denote significant differences (Mann Whitney U-Test, p<0.05) between dry and wet sampling at a water quality station.

The Welland River Eutrophication Study in the Niagara River Area of Concern
Niagara River Remedial Action Plan
21
Figure 9: Box and Whisker Plot of Total Phosphorus (mg/L) of Welland River subwatershed monitoring stations for 2008-2010 accounting for dry vs. wet weather sampling events (n=16 for dry and n=8 for wet at each station). The box length of the box-and-whisker plots represents the inter-quartile range that contains the median value shown as a horizontal line. The whiskers represent the minimum and maximum values. Star symbols of the same colour denote significant differences (Mann Whitney U-Test, p<0.05) between dry and wet sampling at a water quality station.

The Welland River Eutrophication Study in the Niagara River Area of Concern
Niagara River Remedial Action Plan
22
In 2010, additional weekly sampling was initiated by MOE and NPCA staff in the three most
nutrient enriched tributaries (BV001, BF001 & OS001) to better characterize their TP and
phosphate concentrations in terms of potential seasonal differences. Weekly TP concentrations
are shown in Figure 10. Generally, like the less frequent monitoring conducted at the other
stations, TP concentrations were substantially greater than the PWQO (1994) for all three
watersheds. There was a summertime increase in TP at all three stations with Big Forks
(BF001) having the highest single concentration of 2.5 mg/L. Phosphate concentrations (Figure
10) in all three tributaries were highly variable with greater summertime concentrations
observed at stations BF001 and OS001.
Figure 10: Weekly Total Phosphorus (TP) Concentrations for Oswego (OS001), Beaver (BV001) and Big Forks (BF001) Creek Stations from March to November 2010 (n=34 for each station). Red line represents PWQO (1994) for total phosphorus.

The Welland River Eutrophication Study in the Niagara River Area of Concern
Niagara River Remedial Action Plan
23
Figure 11: Weekly Phosphate Concentrations for Oswego (OS001), Beaver (BV001) and Big Forks (BF001) Creek Stations from March to November 2010 (n=34 for each station).
2.2.2 Phosphorus Loads
TP loads were calculated for each tributary station using two methods. The first method was the
empirical flow measurements obtained at the time of sampling and the second method was
using modeled runoff estimates from the computer program Hydrologic Engineering Centre -
Hydrologic Modeling System (HEC-HMS). HEC-HMS is the U.S Army Corps of Engineers’
Hydrologic Engineering Center Hydrologic Modeling System and a standard modelling program
for water resource practitioners. HEC-HMS is a numerical simulation model designed to
simulate the precipitation-runoff process of a watershed. The HEC-HMS surface water models
were run in continuous mode at hourly intervals and calibrated to stream gauges where
available.

The Welland River Eutrophication Study in the Niagara River Area of Concern
Niagara River Remedial Action Plan
24
For the first method, median annual TP loads from the 2008-2010 were used to calculate a
mean TP load for each tributary station. The mean annual TP load was then divided by the
tributary catchment area to obtain a unit area load or export coefficient for each tributary in
kg/ha/yr. The TP loads for 2008-2010 using this method are summarized in Appendix G. A
similar exercise was repeated using second method but with modeled runoff estimates. The
modeled data was prepared by the NPCA and AquaResource Inc. (2010) as part of the NPCA
Source Protection Area Tier 1 Water Budget. For each NPCA tributary stations, modeled runoff
values from NPCA and AquaResources (2010) and annual TP concentrations were used to
calculate annual TP loads. The calculated export coefficients using empirical and modelled flow
methods are summarized in Table 5 and ranked in Table 6.
The TP export coefficients calculated using the empirical flows were found to differ considerably
from those determined using the modeled flows, differing by two to three orders of magnitude at
some stations (i.e. BF001). The high degree of variability observed in the export coefficients
calculated using the empirical flows is likely attributed to the skewed nature of the flow data. The
empirical flow data contains a combination of zero and extreme flows at most stations, and
many stations have a very limited number of data points (n<10) due to accessibility issues. As a
result, the empirical flow data collected in 2008-2010 may not be representative of the range
and duration of typical flow conditions at these stations.
Table 5: Summary of calculated TP export coefficients calculated using two different conditions: 1) modeled runoff and mean TP for 2003-2010, and 2) empirical flow data and mean TP for 2008-2010
Modeled Runoff Empirical
Flow
Station TP (kg/ha/yr) TP (kg/ha/yr)
BF001 1.016223 0.023081
BU001 0.584550 0.046877
BV001 1.229904 0.103004
CO001 0.352576 0.084354
DR001 0.707525 0.139506
EL001 0.399798 0.010618
GR001 0.670758 0.069613
LY003 0.453525 n/a
MI001 0.412879 0.013662
OS001 0.733742 0.131231
TE001 1.021530 0.103239

The Welland River Eutrophication Study in the Niagara River Area of Concern
Niagara River Remedial Action Plan
25
Table 6: Summary of ranked TP export coefficients (highest to lowest) calculated using two different conditions (as described in Table 5)
Rank Modeled Runoff Empirical
Flow
1 BV001 DR001
2 TE001 OS001
3 BF001 TE001
4 OS001 BV001
5 DR001 CO001
6 GR001 GR001
7 BU001 BU001
8 LY003 BF001
9 MI001 MI001
10 EL001 EL001
11 CO001 N/A (LY003)
Phosphorus loads (kg/ha/yr) of the Welland River subwatersheds were compared to the loads of
Combined Sewer Overflows (CSOs) found in the City of Welland as well as the loads of other
Non-Area of Concern (AOC) watersheds such as Twenty Mile Creek (NPCA unpublished data)
and the Grand River (Cooke 2004). Generally three tiers (greater than non-AOCs, equal to non-
AOCs, less than non-AOCs) of phosphorus export coefficients for the Welland River
subwatersheds were apparent and these are summarized in Figure 12. As shown in Figure 12,
Big Forks Creek (BF001), Beaver Creek (BV001), and Tee Creek (TE001) subwatersheds had
substantially greater phosphorus loads than the non-AOC watershed. Phosphorus loadings in
Buckhorn Creek (BU001), Drapers Creek (DR001), Grassy Brook (GR001) and Oswego Creek
(OS001) subwatersheds were approximately equal to non-AOC watersheds. The Welland River
also receives a significant load of phosphorus from CSOs in urban areas of the City of Welland.
Coyle Creek (CO001), Elsie Creek (EL001), Lyons Creek (LY003) and Mill Creek (MI001) had
phosphorus loads less than non-AOCs (Figure 12). These data suggest that although all
Welland River subwatersheds contribute a significant phosphorus load, there is a subgroup of
subwatersheds that can be identified as the greatest phosphorus contributors in terms of their
watershed size and these warrant special priority.

The Welland River Eutrophication Study in the Niagara River Area of Concern
Niagara River Remedial Action Plan
26
Figure 12: Total Phosphorus Loads (kg/ha/yr) for Welland River subwatersheds, City of Welland CSOs, Non-Niagara River AOC stations Twenty Mile Creek and Grand River (Fairchilds Creek, Boston Creek and McKenzie Creek) using actual water quality data (2003-2010) and modelled runoff.
2.2.3 Nitrogen
Nitrogen is one of the most abundant elements. About 80 % of the air we breathe is nitrogen. It
is found in the cells of all living things and is a major component of proteins. The importance of
nitrogen in the aquatic environment varies according to the relative amounts of the forms of
nitrogen present such as ammonia, ammonium, nitrite, nitrate, or organic nitrogen. Nitrate is the
most common form of nitrogen that occurs in surface water. In aerobic or oxygen-rich water,
bacteria convert ammonium and nitrite to nitrate through a process known as nitrification. In
anaerobic or oxygen-depleted water, these forms of nitrogen are converted to molecular
nitrogen through denitrification, and this gas is released to the atmosphere. At elevated
concentrations, nitrate, nitrite and un-ionized ammonia can be toxic to aquatic organisms and
can contribute to excessive plant and algae growth in surface water. Anthropogenic sources of
nitrogen include sewage discharges, animal waste, fertilizers and pesticides. This section will
report on monthly nitrate-nitrogen, un-ionized ammonia (based on total ammonia) and total

The Welland River Eutrophication Study in the Niagara River Area of Concern
Niagara River Remedial Action Plan
27
nitrogen (total dissolved inorganic and organic nitrogen) which were collected from April to
November 2008 to 2010.
The interim Canadian Water Quality Guidelines for the Protection of Aquatic Life recommend
that nitrate-nitrogen concentrations should not exceed 2.9 mg/L in surface water Canadian
Council of Ministers of the Environment (CCME 2006). The Ontario Provincial Water Quality
Objective (PWQO) for un-ionized ammonia in streams and rivers is 0.02 mg/L (MOE 1994). The
CCME nitrate guideline and PWQO for un-ionized ammonia are based on chronic potential
toxicity and are not threshold values for eutrophication. Dodds et al. (1998) published a range
of stream trophic state values for total nitrogen with a eutrophic threshold concentration of 1.5
mg/L. This value will be used to assess the trophic state of the Welland River in relation to
nitrogen.
The results of the nitrate-nitrogen data are presented in Figure 13. Approximately 3% of the
grab samples collected from 2008-2010 exceeded the Canadian Environmental Quality
Guideline of 2.9 mg/L for nitrate-nitrogen (2007). The highest median concentrations of nitrate-
nitrogen were observed from the Big Forks subwatershed (BF001), the upper Welland River
tributaries (WR001 & WR002), and Oswego Creek subwatershed (OS001 & OS002). The
lowest median concentrations were observed at Mill Creek subwatershed (MI001), Lyons Creek
subwatershed (LY003) and the main Welland River channel (WR003 & WR004) near Binbrook
Conservation Area. The upper Welland River tributaries (WR001 & WR002) are small first order
watercourses and likely represent a point source impact from the Hamilton airport deicing and
anti-icing activities. The rest of the sampling stations, with the exception of Drapers Creek
subwatershed which is mainly urbanized, represent agricultural watersheds with non-point
sources.

The Welland River Eutrophication Study in the Niagara River Area of Concern
Niagara River Remedial Action Plan
28
Figure 13: Box and Whisker Plot of Nitrate/Nitrogen concentrations (mg/L) of Welland River watershed monitoring stations for 2008-2010 (n=69 for each station). The box length of the box-and-whisker plots represents the inter-quartile range that contains the median value shown as a horizontal line. The whiskers represent the minimum and maximum values. Red line represents CCME water quality guideline (2007) of 2.9 mg/L for nitrate-nitrogen.
Un-ionized ammonia was converted from total ammonia using the conversion provided in the
Ontario Ministry of Environment: Policies, Guidelines and Provincial Water Quality Objectives
(1994).
ƒ = 1/(10pKa-pH +1), where ƒ is the fraction of NH3
pKa = 0.09018 + 2729.92/T, where T = ambient water temperature in Kelvin (K = (C + 273.16)
The results of the un-ionized ammonia are presented in Figure 14 and were based on total
ammonia adjusted for measured temperature and pH at the time of sampling. Un-ionized
ammonia in the Welland River watershed is very low with less than 1% of the samples collected
in 2008-2010 exceeding the Provincial Water Quality Objective (1994) of 0.02 mg/L for
ammonia (un-ionized). The highest median concentrations observed were at stations WR010,
WR004 and OS002 but these concentrations did not approach exceedance levels. Interestingly
these higher un-ionized concentrations appear associated with sections of the watershed that

The Welland River Eutrophication Study in the Niagara River Area of Concern
Niagara River Remedial Action Plan
29
are significantly affected by water flow structures such as WR004 (outlet of Binbrook Reservoir),
WR007/ WR010 which are near the Welland Canal siphons, and OS002 which is near the
Oswego Weir.
Figure 14: Box and Whisker Plot of Un-ionized Ammonia concentrations (mg/L) of Welland River watershed monitoring stations for 2008-2010 (n=69 for each station). The box length of the box-and-whisker plots represents the inter-quartile range that contains the median value shown as a horizontal line. The whiskers represent the minimum and maximum values. Red line represents PWQO (1994) of 0.02 mg/L for Un-ionized Ammonia.
The results of the total nitrogen data are presented in Figure 15. Approximately 42% of the
grab samples collected from 2008-2010 exceeded the threshold of 1.5 mg/L of total nitrogen
concentrations for eutrophic water (Dodds et al. 1998). The highest median concentrations of
total nitrogen were observed at the Big Forks subwatershed (BF001), Beaver Creek (BV001),
Buckhorn Creek, the upper Welland River tributary (WR001), and Oswego Creek subwatershed
(OS001 & OS002). Generally the lowest median concentrations were in the upper Welland
River tributaries (WR00A, WR000, WR001 and WR003) and subwatersheds Coyle Creek
(CO001), Drapers Creek (DR001), and Lyons Creek (LY001).

The Welland River Eutrophication Study in the Niagara River Area of Concern
Niagara River Remedial Action Plan
30
Figure 15: Box and Whisker Plot of Total Nitrogen concentrations (mg/L) of Welland River watershed monitoring stations for 2008-2010 (n=69 for each station). The box length of the box-and-whisker plots represents the inter-quartile range that contains the median value shown as a horizontal line. The whiskers represent the minimum and maximum values. Red line represents published concentration for eutrophic water quality conditions for streams (Dodds et al. 1998) of 1.5mg/L for total nitrogen.
2.2.4 Sestonic Chlorophyll-a (chla)
Chlorophyll-a (chla) is the green pigment molecule found in all green plants including algae
which carries out the bulk of energy fixation through the process of photosynthesis. Chla is
probably the most-often used estimator of algal biomass in lakes and streams. The amount of
chla found in a water sample is used as a surrogate measure of the concentration of
phytoplankton. Sestonic chla is the concentration of chla extracted from algae in the water
column. Benthic chla is the concentration of chlorophyll-a extracted from the periphyton algae
community that that lives on the submerged strata on photic zone of most aquatic ecosystems.
Monitoring (sestonic and/or benthic chla) for chla concentrations in surface water is a long-
accepted method used to assess the general biological status of an aquatic ecosystem, such as

The Welland River Eutrophication Study in the Niagara River Area of Concern
Niagara River Remedial Action Plan
31
its trophic status or rates of primary production. High concentrations of chla in surface waters
can be an indicator of nutrient pollution, phosphorus in particular, because excess nutrients fuel
the growth of algae. The senescence and decomposition of these organisms as well as their
nocturnal consumption of oxygen can produce conditions that impair fish populations. Algae
blooms which can occur in nutrient rich water contribute to a variety of water quality issues such
as summer fish kills, foul odours and unfit drinking water.
Although there has been extensive work on defining ecologically and aesthetically acceptable
concentrations of sestonic algae in lentic systems (e.g. lakes, reservoirs), there have been very
few targets developed for lotic (e.g. riverine) ecosystems. This is because lentic and lotic
systems differ in the way their food webs respond to nutrient enrichment and applying a lentic
derived chla target may not be appropriate (Chambers et al. 2008). There is also some
controversy whether sestonic chlorophyll-a targets should be developed for streams and rivers
because some or all of the sestonic chla may be benthic chla that has migrated from the stream
bottom (Chambers et al. 2008). Chambers et al. (2008) selected 5 µg/L for sestonic chla to
assess nutrient status which is intermediate to the US EPA (2000) guideline of 8 µg/L for
streams and the 3 to 5 µg/L ANZECC guideline for Australian lowland rivers (2000). Chambers
et al. (2008) value of 5 µg/L is consistent with other studies and therefore appropriate to assess
eutrophication conditions in the Welland River.
Only the uncorrected concentrations are reported in this section and all raw chla data can be
found in Appendix H. Results shown in Figure 16 from the 2008-2010 field seasons were
compared to the NASEI (Chambers et al. 2008) sestonic chla target of 5 µg/L. During the 2008-
2010 field seasons 495 sestonic chla samples were collected and 148 samples or 30% of the
samples exceeded the NASEI sestonic chla target of 5 µg/L (Chambers et al. 2008). Sample
stations along the main Welland River channel from WR005-WR007, Oswego Creek (OS001-
OS002), and Buckhorn Creek (BU000) had the highest median concentrations of sestonic chla.
The highest sestonic chla concentration for 2008-2010 was found to be 154.0 µg/L at Oswego
Creek station (OS001). Sestonic chla concentrations increased along the main Welland River
channel from upstream to downstream but abruptly decreased at WR010 likely due to the
mixing with the redirected Niagara River water. The lowest observed sestonic chla
concentrations were found at the headwater tributaries (WR00A & WR002) and end station
(WR010) of the Welland River, Drapers Creek (DR001) and Beaver Creek (BV001). Generally
chla concentrations increased in 2010 when compared to 2008-2009 concentrations and this is
likely the result of the hot and dry summer of 2010. Median sestonic chla concentrations were
also highest in the spring (Figure 17).

The Welland River Eutrophication Study in the Niagara River Area of Concern
Niagara River Remedial Action Plan
32
Figure 16: Box and Whisker Plot of uncorrected Chlorophyll-a concentrations (µg/L) of the Welland River watershed monitoring stations for 2008-2010 (n=69 for each station). The box length of the box-and-whisker plots represents the inter-quartile range that contains the median value shown as a horizontal line. The whiskers represent the minimum and maximum values. Red line represents NASEI (2008) sestonic chla target of 5 µg/L.

The Welland River Eutrophication Study in the Niagara River Area of Concern
Niagara River Remedial Action Plan
33
Figure 17: Box and Whisker Plot of monthly uncorrected Chlorophyll-a concentrations (µg/L) of pooled watershed monitoring stations for 2008-2010 (n=69 for each month except April n=46, July n=46). The box length of the box-and-whisker plots represents the inter-quartile range that contains the median value shown as a horizontal line. The whiskers represent the minimum and maximum values. Red line represents NASEI (2008) sestonic chla target of 5 µg/L.
The TWG suggest that duckweed (Lemna spp.) blooms that occur in the central portions of the
Welland River watersheds have likely been mistaken for algal blooms by the public. Although
water conditions may be ideal for algae blooms, it is likely that duckweed is able to outcompete
algae for sunlight. The TWG notes that these duckweed blooms do provide evidence that the
nutrient levels in the river are high as duckweed thrives on elevated phosphorus and nitrogen
levels. Duckweed in itself is not harmful and in some cases beneficial because it extracts
nutrients from the water. The problem with overgrowth of duckweed is the DO it consumes
through respiration and when it dies off and decays in the watercourse.

The Welland River Eutrophication Study in the Niagara River Area of Concern
Niagara River Remedial Action Plan
34
2.2.5 Dissolved Oxygen
Oxygen is the most abundant element of the earth's crust and waters combined. It is the single
most important component of surface water for self-purification processes and the maintenance
of aquatic organisms (such as fish and macroinvertebrates) which utilize aerobic respiration. Air
contains approximately 20.9% oxygen gas by volume; however, the proportion of DO in water is
about 35%. Oxygen is considered to be moderately soluble in water and this solubility is
maintained by a complex set of conditions that include atmospheric/hydrostatic pressure,
turbulence, temperature and salinity. Pollution affects DO concentrations by contributing
oxygen-demanding organic matter such as sewage and manure. Agricultural runoff contains
nutrients (phosphorus and nitrogen) that stimulate the growth of algae and aquatic plants.
Although algae and aquatic plants contribute oxygen through photosynthesis, their overgrowth
results in a net oxygen loss through the processes of respiration and decomposition. The
Ontario MOE has developed a Provincial Water Quality Objective (PWQO) for DO in streams
and this is shown in Table 7. The Welland River has been classified as a warm water fishery
and therefore the PWQO for DO for Warm Water Biota will be applied for the Welland River
Eutrophication Study.
Table 7: Provincial Water Quality Objectives for Dissolved Oxygen (1994).
Dissolved Oxygen Concentrations
Temperature Warm Water Biota
C % Saturation mg/L
0 5
10 15 20 25
47 47 47 47 47 48
7 6 5 5 4 4
As part of the Welland River Eutrophication Study, the NPCA and the MOE deployed DO
sensors at a number of stations along the Welland River (WR004, WR005, WR007, Welland
River at Chippawa Conservation Area and Welland River at the City of Welland) and in three
subwatersheds Beaver Creek (BV001), Oswego Creek (OS001 and OS002), and Big Forks
Creek (BF001). These stations are shown in Figure 18. There were 4 DO loggers available in
2008 and 2009 and 6 DO loggers available in 2010. DO loggers were rotated among the sites
each year. The purpose of these loggers was to capture summertime DO concentrations. DO
loggers were programmed to record hourly DO concentrations from late spring (May or June)
until early fall (late September or October). DO logger data is provided in Appendix I.

The Welland River Eutrophication Study in the Niagara River Area of Concern
Niagara River Remedial Action Plan
35
Figure 18: Dissolved Oxygen Data Logger Locations 2008-2010.
The Welland River Eutrophication Study in the Niagara River Area of Concern
Niagara River Remedial Action Plan
36
Over the study period (2008-2010) the majority of DO loggers deployed in the main Welland
River channel reported DO concentrations below the PWQO (Appendix D). Stations WR004,
WR007, and Welland River at Chippawa Conservation Area had sustained DO concentrations
below the PWQO. DO concentrations at WR005 in 2009 were above the PWQO as were DO
conditions in the Welland River at the City of Welland station in 2009; daily back-flow of Niagara
River water at this site may have improved DO concentrations. Although the majority of DO
concentrations in the Welland River at the City of Welland station were above the PWQO they
were highly variable and a significant reduction of DO was noted during a major rain event on
August 8th, 2009. A similar response to this rain event was also found at Welland River at
Chippawa Conservation Area. Abundant duckweed (Lemna spp.) growth was noted in the late
summer of 2008 and 2009 at WR007 and the Welland River at the City of Welland station but
this could not be directly linked to the DO concentrations.
As shown in Appendix D the majority of summer DO concentrations in the subwatershed
stations BF001, BV001, OS001, and OS002 were found to be below the PWQO. In 2008,
BF001 and BV001 experienced sustained low summertime DO conditions. In early summer of
2010 the BV001 station experienced large diurnal fluctuations (greater than 8 mg/L) in DO
concentrations. Similarly, BF001 and OS001 loggers in 2010 reported some large fluctuations
in daily DO concentrations throughout the season. Abundant macrophyte growth was noted at
BV001 and OS001 in 2008 and 2010. Duckweed (Lemma spp.) overgrowth was noted at
BF001 for 2008 and 2010. In addition, these subwatersheds often have water conditions that
are stagnant which likely aggravate the DO conditions at these sites. Less impaired DO
concentrations were observed at OS001 in 2008 and OS002 in 2009. The differences in DO
profile between years at BV001, BF001, and OS001 highlight the yearly variation at each
station.
2.2.6 Correlation Analysis
Scatter plots were used to investigate the possible relationships between several combinations
of water quality parameters that are of concern in the Welland River Eutrophication Study.
These parameters include Total Phosphorus (TP), Phosphate, Chlorophyll-a, and Total
Suspended Solids (TSS) from the 2008-2010 field seasons. Pearson Correlation Coefficients
were calculated to assess the strength of the relationship on the pooled data set (all stations)
and site specific data (individual stations) and these are summarized in Table 8 and Table 9.
Scatter plots are provided in Appendix J. To investigate the relationship of nutrients
(phosphorus and nitrogen) with sesontic algae (chla) Regression Analysis was conducted on
the pooled data.
With the pooled dataset the strongest correlation that was found was between TSS and TP
(Table 8). This relationship is not surprising as phosphorus is associated with soil particles
found suspended in the water. This relationship occurs in part because of sediment runoff from
agricultural lands and increased water flow that has scoured sediment from the stream bottom
and banks increasing the amount of solids in the water column. When site specific TSS and TP
correlations were examined, the majority of the central Welland River monitoring stations had

The Welland River Eutrophication Study in the Niagara River Area of Concern
Niagara River Remedial Action Plan
37
significant (p<0.05) positive relationships (Table 9). Monitoring stations on the main Welland
River channel near Binbrook Reservoir and some subwatershed tributaries did not show
significant relationships between TP and TSS. The TWG could not determine why these
stations have different TP and TSS relationships.
The link between phosphorus and sestonic Chla was not clear as there were no significant
relationship between these parameters for the pooled data (F=2.327, r2=0.01, p>0.05). Similarly,
no significant relationship (F=0.9699, r2=-0.00014, p>0.05) could be found between pooled TN
and sesontic chla. The lack of correlation with Chla to phosphorus and nitrogen may be the
result of measuring sesontic Chla and not benthic Chla. The TWG has noted that benthic Chla
may be a better measure of primary production in river systems. Therefore, the link from
phosphorus (and nitrogen) to primary production should not be disregarded because not all
sources of primary production have been measured. Only station WR010 found in the lower
Welland River was found to have a strong positive relationship with phosphorus. This may be
the result of the backwater effect of the Niagara River at this station which is potentially causing
lentic conditions where phosphorus and sestonic chla relationships are stronger.
Table 8. Pearson Correlation Coefficient Summary (n=573 for all other combinations) for pooled 2008-2010 data. Yellow highlighted cells represent significant relationship to 0.05 level.
Parameter Pearson R Correlation
TP & Chla 0.04
TP & TSS 0.43
Phosphate & Chla 0.01
Phosphate & TSS 0.2
TN & Chla 0.01
Significant to 0.05 level

The Welland River Eutrophication Study in the Niagara River Area of Concern
Niagara River Remedial Action Plan
38
Table 9. Station Specific Pearson Correlation Coefficient Summary (n=24 for all other combinations) for
2008-2010 data. Yellow highlighted cells represent significant relationship to 0.05 level. Green highlighted
cells represent significant relationship to 0.01 level.
Parameters
Station TP & Chla Phosphate &
Chla TP & TSS
WR00A -0.29 0.13 0.45
WR000 0.08 0.01 -0.12
WR001 0.1 -0.44 0.44
WR002 -0.03 -0.17 -0.16
WR003 0.08 -0.21 0.36
WR004 -0.09 -0.25 -0.25
WR005 -0.12 -0.26 0.81
WR006 -0.29 -0.43 0.93
WR007 0.34 0.05 0.44
WR010 0.81 0.69 0.89
BF001 0.15 0.34 0.28
BU000 0.26 -0.06 0.19
BU001 -0.07 0.16 -0.15
BV001 0.23 0.19 0.75
CO001 -0.13 -0.21 0.75
DR001 -0.24 -0.6 0.86
EL001 -0.06 0.04 0.67
GR001 -0.05 -0.31 0.82
LY003 -0.01 -0.19 0.79
MI001 -0.14 -0.11 0.71
OS001 -0.1 0.15 0.18
OS002 -0.11 -0.08 0.75
TE001 -0.16 -0.09 0.4
2.2.7 Sediment Samples
MOE staff collected surface sediment samples at WR007, WR006, WR005, BF001, BV001,
OS001, and OS002 on October 10, 2008 and OS001, CO001 and OS002 were collected on Oct
30, 2009 to determine sediment quality. Sediment samples were taken at all sites except
WR005 using a sediment Ponar dredge with 1 to 2 sediment grabs taken while sediment
samples at WR005 was collected using a stainless steel mixing spoon and pan. All samples
were homogenized in a stainless steel pan and placed in a 250 mL amber glass jar. Sampling
equipment was cleaned and triple-rinsed with hexane between sampling stations. Sediment
samples were analyzed for nutrients, moisture and particle size. The results from both the 2008
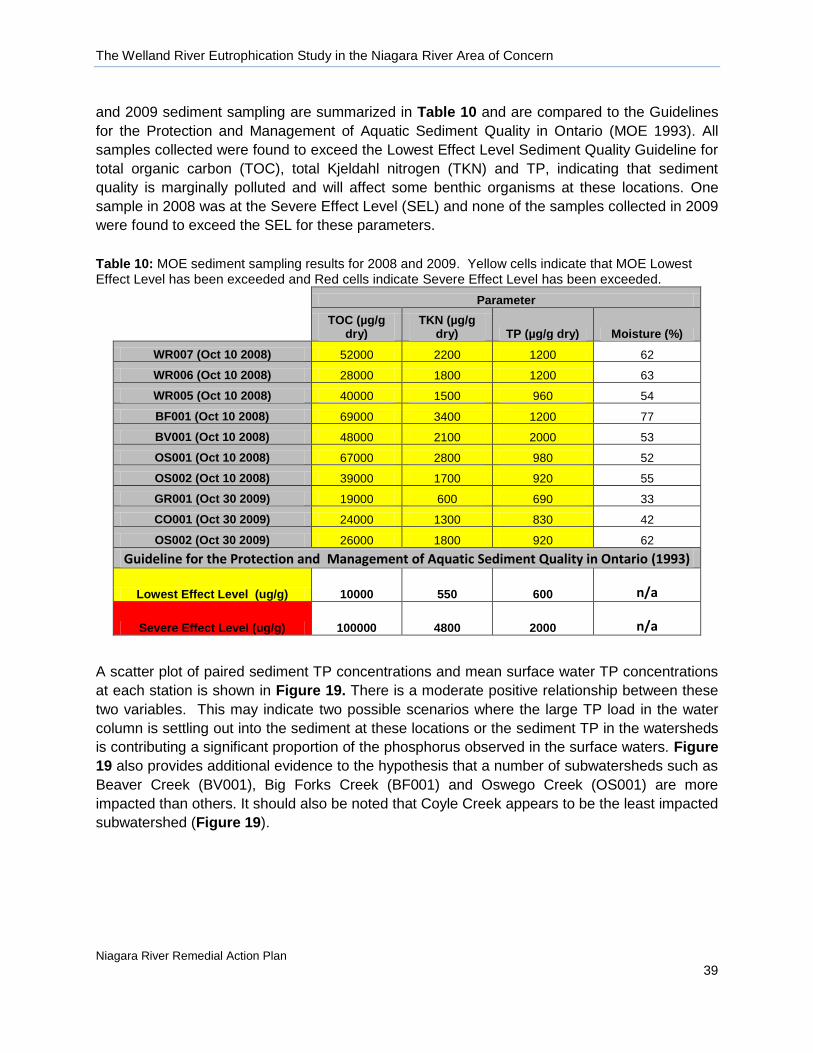
The Welland River Eutrophication Study in the Niagara River Area of Concern
Niagara River Remedial Action Plan
39
and 2009 sediment sampling are summarized in Table 10 and are compared to the Guidelines
for the Protection and Management of Aquatic Sediment Quality in Ontario (MOE 1993). All
samples collected were found to exceed the Lowest Effect Level Sediment Quality Guideline for
total organic carbon (TOC), total Kjeldahl nitrogen (TKN) and TP, indicating that sediment
quality is marginally polluted and will affect some benthic organisms at these locations. One
sample in 2008 was at the Severe Effect Level (SEL) and none of the samples collected in 2009
were found to exceed the SEL for these parameters.
Table 10: MOE sediment sampling results for 2008 and 2009. Yellow cells indicate that MOE Lowest Effect Level has been exceeded and Red cells indicate Severe Effect Level has been exceeded.
Parameter
TOC (µg/g
dry) TKN (µg/g
dry) TP (µg/g dry) Moisture (%)
WR007 (Oct 10 2008) 52000 2200 1200 62
WR006 (Oct 10 2008) 28000 1800 1200 63
WR005 (Oct 10 2008) 40000 1500 960 54
BF001 (Oct 10 2008) 69000 3400 1200 77
BV001 (Oct 10 2008) 48000 2100 2000 53
OS001 (Oct 10 2008) 67000 2800 980 52
OS002 (Oct 10 2008) 39000 1700 920 55
GR001 (Oct 30 2009) 19000 600 690 33
CO001 (Oct 30 2009) 24000 1300 830 42
OS002 (Oct 30 2009) 26000 1800 920 62
Guideline for the Protection and Management of Aquatic Sediment Quality in Ontario (1993)
Lowest Effect Level (ug/g) 10000 550 600 n/a
Severe Effect Level (ug/g) 100000 4800 2000 n/a
A scatter plot of paired sediment TP concentrations and mean surface water TP concentrations
at each station is shown in Figure 19. There is a moderate positive relationship between these
two variables. This may indicate two possible scenarios where the large TP load in the water
column is settling out into the sediment at these locations or the sediment TP in the watersheds
is contributing a significant proportion of the phosphorus observed in the surface waters. Figure
19 also provides additional evidence to the hypothesis that a number of subwatersheds such as
Beaver Creek (BV001), Big Forks Creek (BF001) and Oswego Creek (OS001) are more
impacted than others. It should also be noted that Coyle Creek appears to be the least impacted
subwatershed (Figure 19).

The Welland River Eutrophication Study in the Niagara River Area of Concern
Niagara River Remedial Action Plan
40
Figure 19: Scatter plot of mean surface water TP concentrations (µg/L) 2008-2009 and Sediment TP concentrations (µg/g dry) 2008-2009 for select monitoring stations in the Welland River watershed.
2.3 Data Summary
The Welland River is a eutrophic watershed characterized by very high phosphorus
concentrations. Ninety-nine percent of the grab samples collected in the 2008-2010
study failed to meet the interim PWQO of 30 µg/L for total phosphorus. The central
portions of Welland River (WR005, WR006 and WR007) and the subwatersheds Big
Forks Creek (BF001), Buckhorn Creek (BU000 & BU001), Beaver Creek (BV001),
Oswego Creek (OS001) and Tee Creek (TE001) have the highest phosphorus
concentrations in Niagara River AOC.
Downstream of the Binbrook Reservoir, the portion of total phosphorus consisting of
phosphate is greater than 50% in the samples. The highest concentrations of phosphate
was observed in Big Forks Creek (BF001), Beaver Creek (BV001), Oswego Creek
(OS001), and Tee Creek (TE001).
The Welland River watershed is nitrogen enriched with approximately 42% of the grab
samples collected in the study period exceeding the total nitrogen concentration for
eutrophic water described by Dodds et al. (1998). The highest mean concentrations of
total nitrogen were observed at the Big Forks subwatershed (BF001), Beaver Creek
(BV001), Buckhorn Creek, and the upper and lower Oswego Creek subwatershed
(OS001 & OS002). From 2008 to 2010, 3% of the samples exceeded the CCME for

The Welland River Eutrophication Study in the Niagara River Area of Concern
Niagara River Remedial Action Plan
41
nitrate-nitrogen (2006) and 1% of samples exceeded the PWQO (1994) for un-ionized
ammonia (1994).
The central portion of the Welland River watershed was found to have summertime DO
concentrations below the PWQO for warm water biotic. Monitoring stations with
observed DO impairments include Big Forks Creek (BF001), Beaver Creek (BV001),
Oswego Creek (OS001 and OS002) and the Welland River (WR007, Prince Charles
Drive Station, and Chippawa Conservation Area). Stations that were not monitored due
to lack of resources include: Coyle Creek (CO001), Drapers Creek (DR001), Elsie
Creek (EL001), Mill Creek (MI001), Lyons Creek (LY003), Tee Creek (TE001) and
Welland River (WR00A, WR000, WR001, WR002, WR003, WR006 and WR011).
Although a primary stressor could not be determined, it is likely that a number of
stressors are impairing DO concentrations in the Welland and they may include
respiration by plants and algae partially related to the overgrowth of macrophyte
vegetation (e.g. duckweed), flow impairments, Nitrogenous Oxygen Demand (NOD),
Biological Oxygen Demand (BOD), Sediment Oxygen Demand (SOD) and Chemical
Oxygen Demand (COD).
The correlation analysis found a significant relationship between TP and TSS. This
relationship is not surprising as phosphorus is associated with soil particles found
suspended in the water. There was no relationship between TP and sestonic Chla and
TN and sestonic Chla. This may suggest that the bulk of the primary productivity may be
associated with the periphyton and duckweed.
All samples collected in 2008 and 2009 were found to exceed the Lowest Effect Level
Sediment Quality Guideline for TOC, TKN and TP, indicating that sediment quality is
marginally polluted and will affect some benthic organisms at the sample locations.


The Welland River Eutrophication Study in the Niagara River Area of Concern
Niagara River Remedial Action Plan
42
3.0 Delisting Criteria
3.1 Background
In 1987, the governments of Canada and the United States identified or (listed) 43 Areas of
Concern (AOC) along the Great Lakes shorelines in which the aquatic environment was
particularly degraded. As a response, Remedial Action Plans (RAPs) were developed and
implemented to address the water quality issues that led to the listing of within these AOCs,
each issue of concern is known as a Beneficial Use Impairments (BUI). The Great Lakes Water
Quality Agreement identified a common suite of 14 BUIs to be considered and potentially
identified for each AOC. Any BUI identified for an AOC must be addressed before it can be
delisted which would allow for removal of an area from the list of AOCs. In the Niagara River
RAP Stage 2 Update Report (2009), the Niagara River AOC had nine of fourteen BUIs
identified. The Eutrophication/Undesirable Algae Beneficial Use Impairment was listed as
“impaired” partially based on the total phosphorus (TP) concentrations in the Welland River
which exceeded the RAP Stage 2 delisting criteria and Provincial Water Quality Objectives
(PWQO) of 30 µg/L (Remedial Action Plan 1995). Other reasons for this designation include
depletion of dissolved oxygen (DO), observed impairment to fish and benthos communities, and
anecdotal evidence of algae blooms (Environment Canada 2007). The main stressors identified
were excessive nutrients from municipal Combined Sewer Overflows (CSOs) and Waste Water
Treatment Plants (WWTPs), as well as non-point sources from tributaries draining agricultural
lands. The Eutrophication/Undesirable Algae BUI continues to be a key focus of the Niagara
River RAP.
3.2 Delisting Criteria Definition
Delisting criteria are endpoints for remedial action. Delisting criteria define the desired state of
the Great Lakes at some future point of recovery following the implementation of remedial
actions. These remedial actions need to be informed by monitoring program results or collective
lines of evidence in such a way that those who implement RAPs can adapt remedial actions and
priorities based on new information about the state of recovery of the ecosystem. Ideally,
monitoring programs, delisting criteria, remedial actions and priorities are complementary and
interrelated. To realize this ideal, the following conditions need to be met:
Delisting criteria should contain targets for which achievement can be shown using
existing or plausible future monitoring program results. This way, monitoring data can
answer the question “Has recovery been achieved?”
Many times it is not a single monitoring program or set of data that is being used to
make the decision if the delisting criterion has been met. Rather numerous lines of
evidence are all being pulled together to try and get a complete picture of the status of
the BUI against the delisting criteria.
Delisting criteria should also suggest indicators to evaluate the state of ecosystem
impairment. This would allow the status of the impairment to be evaluated using existing

The Welland River Eutrophication Study in the Niagara River Area of Concern
Niagara River Remedial Action Plan
43
or novel monitoring program results. This way, monitoring data can answer the question
“How close are we to achieving recovery?”
When reporting on progress of ecosystem recovery using indicators and targets,
indicators should provide information that can be used to adapt or reinforce remedial
actions, helping to answer the question “If recovery has/has not been achieved, what are
the next steps?”.
Delisting criteria, indicators, and targets should all relate directly back to Impairments
BUIs, which form the basis for problem definition in RAP.
The BUI must be linked directly to the ecological health of the Great Lakes. If an
identified impairment is found not to be linked to the ecological health of the Great Lakes
than it is not an impairment of interest to the RAP.
3.3 Rationale for New Delisting Total Phosphorus Criteria
There are several existing criteria calibrated to riverine systems in Canada for TP that could be
used as possible delisting criteria (Table 11). The TP concentrations identified in these criteria
generally represent minimally impacted conditions. The Niagara River RAP Stage 2 delisting
criteria is the current MOE Provincial Water Quality Objective (PWQO) of 30 µg/L for streams
and rivers which was established to eliminate excessive algae growth (MOE, 1994). The PWQO
is commonly used by governmental agencies in the province to access watershed health.
A second delisting criteria approach based on defined Ecoregion criteria (Gartner Lee Ltd 2006)
investigated background concentrations of TP in streams by accounting for regional variability of
soils, climate, and vegetation found throughout Ontario. This approach used the 25th percentile
of baseline concentrations for TP for each specific Ecoregion. The Welland River watershed
falls within the Lake Erie Lowland Ecoregion which has a corresponding TP concentration
criterion of 32 µg/L.
Next, the 2008 National Agricultural Environmental Standards Initiative (NAESI) was an
agreement between Environment Canada and Agriculture and Agri-Food Canada to develop
new environmental standards for key theme areas such as air, water, pesticides and
biodiversity. Within the water theme, the NAESI approach determined that the Ideal
Performance Standard for surface water quality in agricultural watersheds could be achieved
with a TP concentration of 24 µg/L. This concentration was deemed necessary for achieving
good biological conditions in surface water for 3 of 4 biological attributes such sestonic algal
biomass, benthic algal biomass, benthic diatom composition and benthic macroinvertebrate
composition.
Outside of Canada, there are some TP guidelines and standards for minimally impacted
conditions but generally these concentrations are not substantially different from the
concentrations found in Table 11.

The Welland River Eutrophication Study in the Niagara River Area of Concern
Niagara River Remedial Action Plan
44
Table 11: Published Stream Total Phosphorus Criteria for riverine Systems in Canada.
Method Total Phosphorus µg/L Provincial Water Quality Objective (MOE, 1994)
30
Ecoregion (Gartner Lee Ltd., 2006)
32
NAESI (Environment Canada, 2008)
24
A technical review of impairments and delisting criteria led by Environment Canada (2007)
concluded that the selection of the PWQO or another similar criterion for TP may be too
arbitrary. The PWQO, Ecoregion and NAESI criteria represent minimally impacted or completely
forested watershed conditions and do not account for the permanent irreversible land use of
watersheds both within and AOCs and other urbanized or agricultural areas around the Great
Lakes. Based on this constraint it was recommended that a more realistic TP delisting criterion
be developed for the Niagara River AOC tributaries that is scientifically-based and achievable
through Best Management Practices (BMPs).
3.3.1 Delisting Criteria Focus
The Welland River is a slow moving, low gradient watercourse that has a very unique hydrology.
The headwaters of the Welland River are tightly controlled by the Binbrook Dam in Hamilton. In
the lower reaches, the Hydro Control Dam diverts vast quantities of water from the Niagara
River into the Welland River. The water levels within the Welland River are completely
controlled by the operating range of the Hydro Control Dam and as such the Welland River acts
like a linear 60 km long reservoir. In addition, the Welland River is diverted through siphons
under the old and new Welland Canals. This has lead to water stagnation, reversed flows and
limited flushing of particles from the Welland River system. The Niagara River RAP Technical
Working Group (TWG) noted that due to the unique hydrology of the Welland River, it wasn’t
realistic to expect ideal river conditions in the Welland River main channel. Based on this the
TWG recommends that loading targets and delisting criteria determined through the Welland
River Eutrophication Study should be applied to the subwatersheds of the Welland River. The
TWG decided to focus on the subwatersheds because potential improvements to water quality
could be quantified, which in theory should cascade down to water quality improvements in the
Welland River channel. This generally agrees with the study objectives #4 and #5 of the Welland
River Eutrophication Study.

The Welland River Eutrophication Study in the Niagara River Area of Concern
Niagara River Remedial Action Plan
45
3.4 Development of New TP Delisting Criteria
At the commencement of this study, the TWG conducted a literature review and identified that
the agencies managing the St. Lawrence River, Cornwall, AOC had adopted new delisting
criteria for TP based on an export coefficient approach (AECOM 2009). With this approach,
specific TP criteria can be determined for each subwatershed based on its land use. After an
initial review, the TWG decided to proceed with an expanded version of this approach for the
Welland River Eutrophication Study. The expanded version of this export coefficient approach
included the calculation of three new sets of TP delisting criteria through three different
methods, as summarized as approaches #1- #3 below.
In addition to the Export Coefficient Approaches, the TWG also considered a 25th Percentile
Approach that is also summarized below.
3.4.1 Export Coefficient Approach #1
The first export coefficient delisting criteria option follows the approach proposed by AECOM
(2009) that was eventually adopted for use for the St. Lawrence River, Cornwall, AOC. The
delisting criteria determined in the AECOM report (2009) were based on export coefficients
published by Winter and Duthie (2000) for the Laurel Creek watershed in the Grand River for
various land use activities (Table 12). Despite the large number of published export coefficients
in the literature (Mitch and Trew 1982, Dodd et al. 1992, USEPA 2002, Jeje 2006), the values
(Table 12) used by Winter and Duthie (2000) were deemed appropriate for the Cornwall study
area because: (1) Soils (loam, silt-loam, clay, and sand) in both study areas were reasonably
similar; (2) Both watersheds had similar agricultural land uses; (3) The study area was located
in southern Ontario with comparable climate and geology; (4) The research of Winter and
Duthie (2000) is recent and based on the best available science to date. For the Welland River
Eutrophication Study, the TWG also agreed that these same reasons were valid enough to
consider Winter and Duthie (2000) export coefficients for use as a starting point.
Like the AECOM study (2009) a run-off value from Natural Resources Canada (2009) was used
to gauge the volume of water that is contributed to the streams as a result of precipitation. In
the case of Niagara, the runoff value was 0.30 m/yr. Based on the product of export coefficients
and run-off values, a TP concentration was calculated for each land use type assuming 100%
coverage of that type in each fictitious watershed (Table 12). The TP concentration calculated
for woodland land use was 33 µg/L, a concentration consistent with the PWQO, Ecoregion and
NAESI values that represent minimally impacted or completely forested watershed conditions.

The Welland River Eutrophication Study in the Niagara River Area of Concern
Niagara River Remedial Action Plan
46
Table 12: Total phosphorus export Coefficients (kg/ha/yr) in well managed systems for Urban, Crops, Pasture, and Woodland Land Uses (Winter and Duthie 2000) and mean TP concentration for a fictitious watershed with runoff of 0.30 m/yr.
Land use
P export (kg/ha/yr)
Mean TP in Fictitious Watershed (µg/L) (Runoff= 0.30 m/yr)
Urban 0.50 166
Crops 0.25 83
Pasture 0.20 67
Woodland 0.10 33
To calculate delisting criteria using these export coefficients and corresponding TP
concentrations for use in the Welland River watershed, the percentage of land disturbance in
each subwatershed was determined with information provided by the Ministry of Natural
Resources as part of the Southern Ontario Land Resource Information System (SOLRIS) (2006
and 2007). Based on the SOLRIS data and with the assistance of the NPCA GIS staff
interpretation, the land use was designated undisturbed if it was classified as Bog, Coniferous
Forest, Deciduous Forest, Forest, Hedge Rows, Idle Land, Marsh, Mixed Forest, Open
Shoreline, Open Water, Plantations, Shoreline, Swamp, and Vineyards. Based on these same
data, land use was designated as disturbed if it was classified as: Annual Crop, Built-Up
Impervious, Built-Up Pervious, Extraction, Mixed Agriculture, Mixed Crop, Monoculture,
Orchards, Perennial Crop, Rural Land Use, and Transportation. From the SOLRIS mapping the
percentage of land disturbance was determined for each subwatershed (Table 1).
Table 13: Percentage of Land Disturbance for Each Subwatershed based on SOLRIS (2006 & 2007)
Subwatershed Station ID % Disturbed
Elsie Creek
Buckhorn Creek
Big Fork Creek
Beaver Creek
Drapers Creek
Oswego Creek
Grassy Brook
Mill Creek
Tee Creek
Lyons Creek
Coyle Creek
EL001
BU001
BF001
BV001
DR001
OS001
GR001
MI001
TE001
LY003
CO001
87
87
82
79
77
77
74
74
70
69
65

The Welland River Eutrophication Study in the Niagara River Area of Concern
Niagara River Remedial Action Plan
47
Regression equations (Appendix K) were calculated for urban, crop and pasture export
coefficients based on zero to one hundred percent watershed disturbance. A nomogram
(Figure 20) was created showing the actual and target annual average total phosphorus
concentrations of each watershed based on its percentage of disturbance in the watershed
using the Winter and Duthie (2000) export coefficients for urban, crops and pasture. Like the
AECOM study (2009) a range of TP concentrations for crop and pasture land uses for each
watershed percent disturbance zones (80%-100%, 60%-80%, 40%-60%, 20%-40%, and 0%-
20%) were complied and summarized in Table 14. In addition, a range of TP concentrations
were complied for urban and crop land uses to accommodate the Drapers Creek
subwatershed’s predominantly urban land use (Table 14).
Following the AECOM study’s approach, the mean TP concentrations between crop and
pasture were calculated for five disturbance levels (80%-100%, 60%-80%, 40%-60%, 20%-
40%, and 0%-20%). Mean TP concentrations were also calculated for the urban and crop land
uses at the five disturbance levels (Table 14). The mean TP concentrations for crop/pasture
were designated for rural land uses and the mean TP concentration for crop/urban were
designated for urban land use and these values are the delisting criteria for the corresponding
level of disturbance.
Figure 20: Nomogram of Actual and Target (urban – green line; crops – blue line; pasture – red line) Annual Average Phosphorus Concentrations at Tributary Mouths for a Given Percentage of Disturbance in the Watershed, Based on Export Coefficients for Crops and Pasture from Winter and Duthie (2000).

The Welland River Eutrophication Study in the Niagara River Area of Concern
Niagara River Remedial Action Plan
48
Table 14: Total Phosphorus Delisting Criteria derived from Export Coefficient Approach #1 using TP
Export Coefficients from Winter and Duthie (2000) and runoff values from Natural Resources Canada mapping (2009).
% Disturbance
Range (µg/L) Pasture &
Crop
Mean TP Concentrations to be
used as Delisting Criteria (µg/L) for
predominantly rural land uses
Range (µg/L) Crop & Urban
Mean TP Concentrations to
be used as Delisting Criteria (µg/L) for
predominantly urban land uses
80%-100% 64-72 68 72-152 115
60%-80% 55-64 60 64-126 97
40%-60% 47-55 53 55-100 79
20%-40% 39-47 44 47-73 60
0%-20% <35 <35 <35 42
Table 15: Welland River Subwatershed Delisting Criteria and Loading Target using Export Coefficient Approach
#1.
% Disturbance Watershed TP Concentration
Delisting Criteria (µg/l)
TP Loading Target
(kg/ha/yr)
Current Mean TP
Concentration (µg/l)
% Reduction to Reach Delisting Criteria
80%-100% Rural Delisting
Criteria
Elsie Creek (EL001) Buckhorn Creek (BU001) Big Forks Creek (BF001)
71
0.20
190 270 390
63 74 82
60%-80%
Rural Delisting Criteria
Beaver Creek (BV001) Oswego Creek (OS001) Grassy Brook (GR001)
Mill Creek (MI001) Tee Creek (TE001)
Lyons Creek (LY003) Coyle Creek (CO001)
62
0.18
540 380 220 170 340 150 140
89 84 72 64 82 59 56
60%-80% Urban
Delisting Criteria
Drapers Creek (DR001)
97
0.29
130
25
The TWG identified some limitations to the export coefficients used in Approach #1. The first
limitation is that AECOM assumes all agricultural and urban practices have the same
environmental management issues and solutions. As an example, Approach #1 assumes
similar TP loadings from a parcel of land developed and managed for livestock agriculture is the
same as a parcel of land developed and managed for tender fruit. Export Coefficient Approach #1 may also be over-simplifying a very complex process and may not be representative of all
agricultural land uses. These export coefficients have been derived from literature values based
on a small number of studied watersheds and may not account for the system variability.

The Welland River Eutrophication Study in the Niagara River Area of Concern
Niagara River Remedial Action Plan
49
Another limitation is the assumption that achieving the targeted nutrient loads by using
Approach #1 will have a significant improvement to the BUI. Achieving the delisting criteria in
Export Coefficient Approach #1 may not change the impairment status of this BUI as it is the
biological response to phosphorus which is the issue, rather than phosphorus concentrations in
itself.
3.4.2 Export Coefficient Approach #2
The second export coefficient delisting criteria approach is similar to Approach #1 by using the
TP export coefficients provided by Winter and Duthie (2000), but differs by using local estimates
of run-off (Table 16) from Niagara Peninsula Conservation Authority (NPCA) Source Water
Protection Water Budget Final Report (NPCA and AquaResources Inc. 2010). These run-off
values replace the Natural Resources Canada (2009) run-off estimates used in Approach #1.
The methodology of deriving these run-off values is described in Section 2.1.2 The NPCA and
Aqua Resources (2010) run-off values can be seen as an improvement to the AECOM
approach described in Section 3.4.1 because of the use of local Niagara data in the derivation
of TP concentration criteria.
Table 16: Subwatershed Run-off Values from Niagara Peninsula Conservation Authority and AquaResources Inc. 2010.
Subwatershed Runoff m/yr
Beaver Creek (BV001)
Big Forks Creek (BF001)
Buckhorn Creek (BU001)
Coyle Creek (CO001)
Drapers Creek (DR001)
Elsie Creek (EL001)
Grassy Brook (GR001)
Lyons Creek (LY003)
Mill Creek (MI001)
Oswego Creek (OS001)
Tee Creek (TE001)
0.23
0.26
0.22
0.25
0.54
0.21
0.30
0.30
0.24
0.19
0.30
Like Approach #1, regression equations were generated for each subwatershed using the NPCA
and AquaResources Inc. (2010) run-off values and Winter and Duthie (2000) urban, crop and
pasture TP export coefficients based on zero to one hundred percent watershed disturbance.
The TP delisting criteria for each subwatershed were calculated with the regression equations
(Appendix K) by using the percentage of land disturbance corresponding to each

The Welland River Eutrophication Study in the Niagara River Area of Concern
Niagara River Remedial Action Plan
50
subwatershed (Table 13) and the mean TP concentration of the Urban, Crop and Pasture
export coefficient (Winter and Duthie 2000) for these land uses. Table 17 shows the TP
delisting criteria and the loading targets for the Welland River subwatersheds using the Export
Coefficient Approach #2. Similar to Approach #1 the delisting criteria for rural land uses were
applied to Beaver Creek, Big Forks Creek, Buckhorn Creek, Coyle Creek, Elsie Creek, Grassy
Brook, Lyons Creek, Mill Creek and Tee Creek because these subwatersheds are
predominantly rural with a variety of active and passive agriculture. The delisting criterion for
urban land use was applied to Drapers Creek subwatershed as it is predominately urban with
some rural areas.
Table 17: Welland River Subwatershed Delisting Criteria and Loading Target using Export Coefficient Approach
#2.
Watershed TP Concentration Delisting Criteria
(µg/l)
TP Loading Target
(kg/ha/yr)
Current Mean TP
Concentration (µg/l)
% Reduction to Reach Delisting
Criteria
Beaver Creek (BV001) Big Forks Creek (BF001) Buckhorn Creek (BU001)
Coyle Creek (CO001) Elsie Creek (EL001)
Grassy Brook (GR001) Lyons Creek (LY003)
Mill Creek (MI001) Oswego Creek (OS001)
Tee Creek (TE001)
85 76 94 70 97 63 61 77 97 62
0.19 0.20 0.20 0.17 0.20 0.19 0.18 0.19 0.19 0.18
540 390 270 140 190 220 150 170 380 340
84 81 35 50 49 71 59 55 74 82
Drapers Creek (DR001) 61 0.33 130 53
The case of Grassy Brook, Lyons Creek and Tee Creek delisting criteria are virtually the same
as those in Approach #1 because of similar run-off values. In most cases, the delisting criteria
for each subwatershed are slightly higher than those values proposed in Approach #1. This is
due to two reasons: 1) the delisting criteria in Export Coefficient Approach #1 provides a coarse
delisting criteria value because it incorporates a large disturbance zone range of approximately
20% and that is not the case in Approach #2; 2) although runoff values are lower for some
watersheds and theoretically less TP is entering the watercourse, the TP delisting criteria is set
to control for a desired export coefficient on the flow of water that is believed to be entering the
watercourse. Conversely, the delisting criteria of Drapers Creek decreased from Approach #1
because of the larger runoff value used in Approach #2. This means in this watershed that more
TP is entering the watercourse through runoff but the TP export coefficients (Table 12) remain
unchanged and therefore a lower TP concentration is permitted in the watercourse in order to
meet the export coefficient.

The Welland River Eutrophication Study in the Niagara River Area of Concern
Niagara River Remedial Action Plan
51
The added benefit of Approach #2 compared to Approach #1 is the use of watershed specific
run-off values (NPCA and AquaResources Inc. 2010) that have been used to calculate TP
delisting criteria for each subwatershed. However, like Approach #1, applying this approach to
each subwatershed will still require approximately a 50% to 90% reduction in ambient TP
concentrations in the creeks in order to reach the proposed delisting criteria. Depending on the
subwatershed, Approach #2 generally represents a doubling or tripling of the current delisting
criteria of 30 µg/L.
The same limitation identified for Export Coefficient Approach #1 can be applied for Approach #2
because again Winter and Duthie (2000) export coefficients were used, which are literature
values and do not account for variability in TP export even when all BMPs are in place. Another
limitation is the assumption that achieving the targeted nutrient loads by using Approach #2 will
have a significant improvement to the BUI. Achieving the delisting criteria in Export Coefficient
Approach #2 may not change the impairment status of this BUI.
3.4.3 Export Coefficient Approach #3
The TWG members had several discussions with Dr. Jenny Winter (per. comm. 2009) regarding
the TP export coefficients used by AECOM (2007) for the St. Lawrence River, Cornwall, AOC.
Dr. Winter suggested another variation to determine delisting criteria by using an export
coefficient calculated for the least disturbed watershed in the Niagara River AOC as in this case
site-specific conditions are considered.
This third export coefficient delisting criteria option entails using the local estimates of run-off
taken from NPCA Source Water Protection Water Budget Final Report (NPCA and
AquaResources Inc. 2010) and with observed TP concentrations (2003-2010) of the least
disturbed watershed in the Niagara River AOC to back-calculate an export coefficient. The least
disturbed watershed in the Niagara River AOC based on SOLRIS mapping (Table 13) was
Coyle Creek. The export coefficient of 0.3526 kg/ha/yr for Coyle Creek was then applied to the
other subwatersheds to calculate specific subwatershed TP concentration delisting criteria.
Appendix K contains the values used to calculate the Approach #3 delisting criteria shown in
Table 18.

The Welland River Eutrophication Study in the Niagara River Area of Concern
Niagara River Remedial Action Plan
52
Table 18: Welland River Subwatershed Delisting Criteria and Loading Target using Export Coefficient Approach
#3.
Watershed TP Concentration Delisting Criteria
(µg/l)
TP Loading Target
(kg/ha/yr)
Current Mean TP
Concentration (µg/l)
% Reduction to Reach Delisting
Criteria
Beaver Creek (BV001) Big Forks Creek (BF001) Buckhorn Creek (BU001)
Coyle Creek (CO001) Elsie Creek (EL001)
Grassy Brook (GR001) Lyons Creek (LY003)
Mill Creek (MI001) Oswego Creek (OS001)
Tee Creek (TE001)
155 135 163 140 168 116 117 145 183 117
0.35 0.35 0.35 0.35 0.35 0.35 0.35 0.35 0.35 0.35
540 390 270 140 190 220 150 170 380 340
71 65 40
Criteria Achieved 12 47 22 15 52 66
Approach #3 delisting criteria represents a two to six times increase in the existing delisting
criteria of 30 µg/L. In order to achieve delisting criteria with this option, TP reductions ranging
from 0% (Coyle Creek) to 70% (Beaver Creek) are required. The advantage of this option is the
use of watershed-specific modelled run-off values (NPCA and AquaResources Inc. 2010) and
the actual TP concentrations observed in the Coyle Creek watershed, which is likely close to the
best-case scenario for the Niagara Region, and therefore the most realistic of the approaches
considered thus far. In some cases the mean TP of several subwatersheds are very near to the
Approach #3 delisting criteria. However with some subwatersheds, there are substantial
reductions in TP concentrations required in order to achieve the delisting criteria, and as such,
the focus of remedial actions would be on the more “anomalous” watersheds.
A limitation to using Approach #3 is the assumption that achieving the targeted nutrient loads
found in Coyle Creek watershed will have a significant improvement to the BUI. Water quality
found in the Coyle Creek subwatershed is impaired with observed TP concentrations 4 times
greater that the PWQO. The land disturbance within the watershed is also quite significant at
65%. It is possible that this level of disturbance may not have the desired improvement to the
Niagara River AOC but it may translate to the best case “achievable” improvement to the
Niagara River AOC.
3.4.4 The 25th Percentile Approach
The TWG discussed a percentile approach where the 25th percentile of TP concentrations of
NPCA long-term (2003-2010) monitoring data could be used as potential delisting criteria. The
25th percentiles and loading targets were calculated for each watershed and these are shown in
Table 19.

The Welland River Eutrophication Study in the Niagara River Area of Concern
Niagara River Remedial Action Plan
53
Table 19: Welland River Subwatershed Delisting Criteria and Loading Target using 25th Percentile of
Long-Term water quality monitoring data (2003-2010) for each subwatershed
Subwatershed TP 25th
Percentile (µg/l) TP Loading
Target (kg/ha/yr)
Current Mean TP
Concentration (µg/l)
% Reduction to Reach Delisting Criteria
Beaver Creek (BV001) 268 0.6093 540 50
Big Forks (BF001) 215 0.5602 390 45
Buckhorn Creek (BU001) 114 0.2457 270 58
Coyle Creek (C0001) 95 0.2392 140 32
Drapers Creek (DR001) 100 0.5443 130 23
Elsie Creek (EL001) 100 0.2104 190 47
Grassy Brook (GR001) 143 0.4345 220 35
Lyons Creek (LY003) 100 0.3024 150 33
Mill Creek (MI001) 93 0.2247 170 46
Oswego Creek (OS001) 270 0.5213 380 29
Tee Creek (TE001) 180 0.5408 340 47
In order to achieve delisting criteria with this approach, TP reductions ranging from 23%
(Drapers Creek) to 58% (Buckhorn Creek) are required. The advantage of this approach is the
use of actual subwatershed water quality data for determining the delisting criteria. These data
represent the natural variation that is observed in each subwatershed. This approach may be
more achievable for some subwatersheds as the reductions of phosphorus are not as
substantial as the export coefficient approaches. But in some subwatersheds (BU001, CO001,
LY003, MI001) delisting criteria were lower than the delisting criteria of Export Coefficient
Approach #3. Even if the delisting criteria of the 25th Percentile approach were achieved
phosphorus concentrations are still high and it may not have the desired improvements to the
BUI. In addition, a disadvantage of this approach is that it assumes similar efforts to reduce TP
are required across all subwatersheds, when clearly there are watersheds that require more
intense nutrient reduction focus.
3.4.5. Reference Watershed Approach
The TWG also considered a reference condition approach as an option for delisting. By
identifying and selecting a non-AOC watershed with similar conditions (landuse, soils,
topography, etc) it may provide a suitable target for delisting. The Environment Canada (EC)
Technical Review (2007) identified several candidate watersheds and these include:
20-Mile Creek (Lake Ontario)
Fairchild Creek (Lake Erie-Grand River watershed)
McKenzie Creek (Lake Erie- Grand River watershed)
Nanticoke Creek (Lake Erie)
Big Otter Creek (Lake Erie)
Big Creek (Lake Erie)

The Welland River Eutrophication Study in the Niagara River Area of Concern
Niagara River Remedial Action Plan
54
Sydenham River (Lake St. Clair)
Ausable River (Lake Huron)
From this group of candidate watersheds the TWG considered Twenty Mile Creek and the
Grand River.
Twenty Mile Creek watershed is located in the NPCA jurisdiction and originates from the same
headwater areas as the Welland River. Watershed conditions such as landuse and soils are
very similar, although there are variations in stream geomorphology such as exposed bedrock in
several sections of the stream channel. The NPCA does regularly monitor Twenty Mile Creek
(2002-2010) and based on these data a median concentration of 116 µg/L could be considered
as a target concentration.
The Grand River watershed is located just west of the Welland River watershed and like Twenty
Mile Creek has similar watershed conditions such landuse and soil types (Haldimand Clay
Plain). The Grand River Conservation Authority has informally adopted 78 µg/L as a TP target
concentration for its water resource program. This value represents the median TP
concentration of the entire Grand River long-term monitoring dataset. This concentration could
also be considered as a possible target concentration for the Niagara River AOC.
Table 20: Welland River Subwatershed Delisting Criteria using Reference Watersheds (Twenty Mile Creek and Grand River) of Long-Term water quality monitoring data (2003-2010) for each subwatershed
Subwatershed Current Mean TP
Concentration (µg/l)
% Reduction to Reach Twenty Mile Creek
Reference Condition Target
% Reduction to Reach Grand River
Reference Condition Target
Beaver Creek (BV001) 540 79 86
Big Forks (BF001) 390 70 80
Buckhorn Creek (BU001) 270 57 71
Coyle Creek (C0001) 140 17 44
Drapers Creek (DR001) 130 11 40
Elsie Creek (EL001) 190 39 59
Grassy Brook (GR001) 220 47 65
Lyons Creek (LY003) 150 23 48
Mill Creek (MI001) 170 32 54
Oswego Creek (OS001) 380 69 79
Tee Creek (TE001) 340 66 77

The Welland River Eutrophication Study in the Niagara River Area of Concern
Niagara River Remedial Action Plan
55
The Reference Condition Watershed Approach may be a suitable option because it provides
some non-AOC watershed TP targets. If the intention of the Niagara River RAP is restore to
watershed conditions representative of what is currently found in southwestern Ontario then
Twenty Mile Creek or the Grand River could be considered. Again, like other delisting criteria
options a substantial reduction in TP would be required in a majority of subwatersheds in order
to achieve of TP targets. In addition, a limitation to using the Reference Condition Approach is
the assumption that achieving the nutrient targets will have a significant improvement to the
BUI.
3.5 Consideration for Use of the Revised TP Delisting Criteria
The purpose of the Welland Eutrophication Study was to develop new total phosphorus delisting
criteria that are scientifically-based, biologically meaningful, and achievable to bring about
restoration of the Eutrophication and Undesirable Algae BUI for the Niagara River AOC. The
several approaches developed by the TWG provide alternatives to the existing criteria of 30µg/L
found in the Niagara River RAP Stage 2 report. However, there are several important items that
the TWG identified that need to be considered before adopting new Delisting Criteria and
Loading Targets.
1. It was not possible through this study to determine what the consequences of the new
delisting criteria would be for the tributaries. It is not known whether achieving any of the
devised TP targets would restore this BUI. This is because this study in part did not
explicitly identify a strong link between phosphorus and the major BUI issues like
degraded aesthetics (through algae/macrophyte overgrowth) and low DO conditions.
The TWG noted that elevated TP concentrations are not an impaired beneficial use, but
instead have the potential to bring about undesirable conditions, such as unsightly algae
blooms or low DO concentrations that negatively impact the local fish community.
Ideally, there needs to be some kind of a demonstration that the hard-to-achieve,
massive reductions in TP loadings will address the larger issues of impaired oxygen
concentrations and aesthetics.
2. The TWG suggested that it may be possible for a parcel of land to have all best
management practices already implemented and still not meet the theoretical export
coefficient delisting criteria noted in this report. If there are no additional management
actions that can be implemented to reduce TP concentrations to the pre-defined targets,
then the targets are unachievable, and thus, not consistent with the spirit and intention of
the RAP.
3. The TWG noted that the effect on water quality due to the permanent flow alterations to
the Welland River has been underestimated and it was not examined in the Welland
River Eutrophication Study. Binbrook Reservoir and the redirection of the Niagara River
down the Welland River for hydroelectric operations may be significant contributors to
the Eutrophication and Undesirable Algae BUI. With the Binbrook Reservoir, water is
released from the bottom of the dam (i.e. the hypolimnion) where water is presumably

The Welland River Eutrophication Study in the Niagara River Area of Concern
Niagara River Remedial Action Plan
56
lower in DO and likely to cause a plume of low DO conditions downstream of the
reservoir. Additionally, when water is not released from the reservoir because of needs
pertaining to recreational uses of the reservoir, the resulting low flow in the headwaters
exacerbates drought conditions in the river, and negatively impacts water quality. The
other major flow alteration is the daily water level fluctuation to downstream portions of
the Welland River due to control of flow for the production of hydroelectric power. The
water level fluctuation does not allow for efficient flushing of an already low-gradient
stream, resulting in flow reversal/stagnation/backwater effects and likely low DO
conditions. Control of chemical inputs may improve water quality conditions, but it
remains possible that no amount of loading reductions may bring about the desired
change due to the physical alterations to the Welland River.
4. The TWG noted that there must be some consideration given to the receiving water
(Niagara River) into which the Welland River drains. Discharge from the Ontario portion
of the AOC contributes less than one percent to the total flow in the Niagara River
(Environment Canada 1993). TP data from Environment Canada It is necessary to
determine whether or not water quality conditions and phosphorus loads from the
Welland River are significantly impacting the nearshore or main channel of the Niagara
River. The Niagara River RAP Stage 1 Report (1993) states “plumes of water discharge
from the Sir Adam Beck power generating station are visible in the Niagara River and
likely the result of higher suspended sediment levels associated with the Welland River”.
However, Environment Canada’s water quality monitoring stations in Niagara-on-the-
Lake indicate there is no increase of phosphorus in Niagara River downstream of
Queenston (1993). If the Welland River is not contributing to eutrophication or
algae/macrophyte overgrowth in the Niagara River there may be sufficient reason to
designate the nutrient problem as a regional issue rather than a RAP issue.
5. A number of concerns were raised by some TWG members regarding how to achieve
the desired TP delisting criteria given the massive TP loading reductions needed to
achieve any of the alternative delisting approaches explored above. This concern is valid
but some TWG members suggest that this should not hinder the process of setting the
delisting targets as targets will provide the impetus to improve water quality conditions in
the Niagara River AOC.
6. TWG members suggested changing the delisting criteria of the Eutrophication and
Undesirable Algae BUI from an ambient in-river TP concentration to generic criteria.
These generic criteria could include ensuring that a certain percentage of landowners
have BMPs implemented in the Niagara River AOC, or ensuring that a certain
percentage of septic systems have been inspected and are thus performing as intended.
These generic criteria lists would need to be investigated further but may provide an
alternate to a strict TP concentration value that may not be achievable for reasons
outlined above. The use of generic criteria focuses on management actions, thus
ensuring that everything that can be done to improve eutrophication in the River, has
been done.

The Welland River Eutrophication Study in the Niagara River Area of Concern
Niagara River Remedial Action Plan
57
7. The TWG believes it is important to begin linking water quality datasets collected
through the Welland River Eutrophication Study with other Niagara River AOC BUIs.
Other BUIs have collected data on fish communities and other habitat variables such as
water flow, buffers and aquatic habitat. These linkages must be studied in order to
develop meaningful delisting criteria.

The Welland River Eutrophication Study in the Niagara River Area of Concern
Niagara River Remedial Action Plan
58
4.0. Recommendations to RAP Coordinating Committee
Based on the results of the Welland River Eutrophication Study, the Technical Working Group
(TWG) has several recommendations for the Remedial Action Plan (RAP) Coordinating
Committee regarding the results of the Study.
4.1 Dissolved Oxygen Study
The TWG affirmed the need for minimum dissolved oxygen (DO) concentrations in the Welland
River to be at or above the target concentration of 4 mg/L which is the current warm water biota
Provincial Water Quality Objectives (PWQO) for ambient water temperatures of 20 – 25 °C
(MOE, 1994). This DO concentration has been identified as factor required to attain the
desirable fish community in the Niagara River Area of Concern (AOC), and due to its
importance in the biological restoration of the AOC, the TWG identified the need to further
examine the role of DO drivers in the Welland River. If a dominant DO driver can be identified,
it would allow for a more focused management plan for the Welland River.
The main focus of the Welland River Eutrophication Study has been on phosphorus, but over
the course of this study it has become clear that there are a number of items potentially
impacting DO concentrations in the Welland River. These items include the potential impacts to
DO by Nitrogenous Oxygen Demand (NOD), Biological Oxygen Demand (BOD), Sediment
Oxygen Demand (SOD) and Chemical Oxygen Demand (COD). There is also a need to
determine the effects of altered flow regimes on DO concentrations, such as the role of the
Binbrook Reservoir and the flow reversal of the Welland at its output to the Niagara River. The
role of benthic or periphyton algae (benthic chlorophyll-a), macrophytes and duckweed on DO
concentrations in Welland River needs to be examined further with surveys of the
periphyton/macrophytes to provide information on density and species composition. Finally,
additional DO data collected during the winter season would be important to understanding the
seasonal trends of DO in the Welland River. The TWG recommends a comprehensive DO study
for the Welland River and its tributaries.
4.2 Target Specific Subwatersheds for Restoration
The Welland River Eutrophication Study identified several subwatersheds (Beaver Creek, Big
Forks Creek, and Oswego Creek) that can be classified as extremely enriched with phosphorus.
The TWG recommends intensively implementing Best Management Practices (BMP) works in
these subwatersheds and ensuring the results are monitored. By targeting the subwatersheds
that can be considered the “worst offenders” for phosphorus, it may be possible to evaluate the
strength of BMPs in restoring these watersheds to a less impaired state. This is especially
important since it has been suggested that using BMPs to restore non-point source stressors
can be very challenging and often many of the RAPs have focused on point sources to control
nutrient inputs.

The Welland River Eutrophication Study in the Niagara River Area of Concern
Niagara River Remedial Action Plan
59
4.3 TP Delisting Criteria
Combined Sewer Overflows
The TWG recommends that as a surrogate total phosphorus delisting criteria for CSOs in the
City of Welland, that Ontario Ministry of the Environment Procedure F-5-5 be adopted. The key
requirements of Procedure F-5-5:
During a seven-month period commencing within 15 days of April 1, capture and treat for
an average year all dry weather flow plus 90% of the volume resulting from wet weather
flow that is above the dry weather flow;
30% carbonaceous biochemical oxygen demand removal;
50% total suspended solids removal;
Total suspended solids should not exceed 90 mg/L for more than 50% of the time during
the seven month period; and,
The interim effluent quality criterion for disinfection of combined sewage during wet
weather is a monthly geometric mean density of E. coli not exceeding 100 cfu per 100ml
There are two separate issues that cause Combined Sewer Overflows (CSOs) into the Welland
River: (1) Overflows from the Regional Interceptor sewers (flow backing up and spilling out the
bypass structures) and; (2) direct bypasses from our system (the water never gets into the
Interceptor and just outlets directly through the outfall). The City of Welland and the Region of
Niagara are currently working on a CSO project that will separate 100% of the remaining
combined sewers within the next 8-10 years resulting in the capture of 75% of wet weather
flows. The City of Welland staff suspects that the 75% capture rate in the CSO report (XCG
Consultants LTD. 2004) was underestimated. The City of Welland recently hired AMEC to
create a model of the Regional Interceptor system and based on 2010 precipitation rate, the
City of Welland has met F-5-5 requirements. However, it should be noted that these are
preliminary results based on assumptions of direct bypasses from the system where a direct
bypass value was used from the CSO report (XCG Consultants LTD. 2004). In 2012, the City of
Welland has planned more detailed flow metering of the direct bypasses and continue with
sewer separation. If the City of Welland removes all of its combined sewers and still have not
met the 90% capture rate, there are several courses of action that could be followed: (1)
Increase the capacity of the treatment plant and add a high rate treatment facility to the plant;
(2) Focus on removing “partially separated” neighbourhood which continue to have foundation
drains which are still connected to the sanitary sewer. Once the requirements for met F-5-5
(90% capture) are met by the City of Welland, their intention is to pursue 100% capture as per
F-5-1.

The Welland River Eutrophication Study in the Niagara River Area of Concern
Niagara River Remedial Action Plan
60
Waste Water Treatment Plant
Although the City of Welland Waste Water Treatment Plant (WWTP) does contribute nutrient
loads to the Welland River, the WTTP is outside the study area of the Welland River
Eutrophication Study as the final effluent is discharged downstream of the old Welland Canal.
Effluent discharged from the WTTP is regulated by a Ministry of the Environment (MOE)
Certificate of Approval. The Welland WWTP has primary through tertiary treatment. The
primary treatment consists of mechanically-raked bar screens and aerated grit channels to
initially remove bulky solids, and silt/sand. The secondary treatment consists of mechanical
aeration cells, phosphorus removal using ferric chloride and settling tanks that remove settling
and floating solids. The solids removed are then treated in anaerobic digesters, where bacteria
digest the organics into methane and CO2. The stabilized biosolids produced by the digestion
process are removed from the facility and transported to the Garner Road Biosolids Storage
Facility for further treatment in lagoons. The tertiary treatment consists of sand and anthracite
filter cells. The TWG agrees that no further action is required.
Tributary Delisting Criteria
Over the course of the three-year Welland River Eutrophication Study, the TWG has carefully
evaluated several delisting criteria options for total phosphorus (TP). The TWG notes that this
study did not identify a strong link between phosphorus and the major BUI issues like degraded
aesthetics (through algae/macrophyte overgrowth) and low DO conditions. This result makes it
difficult to strongly advocate for a specific TP delisting criteria. But the consensus of the TWG
was that the Welland River watershed does have very high TP concentrations and these TP
concentrations have the potential to cause undesirable conditions in the watershed. Based on
this the TWG has provided TP Delisting Criteria Options developed through this study below in
no particular order and recommends that that RAP Coordinating Committee consider the items
identified in section 3.5 before finalizing TP Delisting Criteria.
Delisting Criteria Option #1
Continue to use the current MOE Provincial Water Quality Objective (1994) of 30
µg/L for streams and rivers as the Niagara River RAP TP delisting criteria.
There is evidence that this concentration when reached will eliminate excessive
algae growth in stream and river ecosystems. This concentration is commonly
used by governmental agencies in the province to assess watershed health.
30 µg/L is not an achievable target for a stream in southern Ontario as it
represents minimally impacted or completely forested watershed conditions and
does not account for the permanent irreversible land use in southern Ontario
including the Niagara River AOC.
Delisting Criteria Option #2
Use TP Delisting Criteria and Loading Targets determined through Export
Coefficient Approach #1 in section 3.4.1 as the Niagara River RAP TP delisting
criteria.

The Welland River Eutrophication Study in the Niagara River Area of Concern
Niagara River Remedial Action Plan
61
Limitations for this approach are discussed in section 3.4.1.
Delisting Criteria Option #3
Use TP Delisting Criteria and Loading Targets determined through Export
Coefficient Approach #2 in section 3.4.2 as the Niagara River RAP TP delisting
criteria.
Limitations for this approach are discussed in section 3.4.2.
Delisting Criteria Option #4
Use TP Delisting Criteria and Loading Targets determined through Export
Coefficient Approach #3 in section 3.4.3 as the Niagara River RAP TP delisting
criteria.
Limitations for this approach are discussed in section 3.4.3.
Delisting Criteria Option #5
A phased approach using all three of the Export Coefficient Approaches found in
sections 3.4.1, 3.4.2 and 3.4.3. The TWG suggested Approach #3 can serve as 5
year, Approach #2 as a 15 year and Approach #1 as a 30 year target.
A phased approach may be inconsistent with the structure and function of the
RAP.
Delisting Criteria Option #6
Use TP Delisting Criteria and Loading Targets determined through the 25th
Percentile Approach in section 3.4.4.
Limitations for this approach are discussed in section 3.4.4.
Delisting Criteria Option #7
Use a TP concentration from a reference non-AOC area such as Twenty Mile
Creek in Niagara Peninsula or the Grand River as a delisting criteria.
It should be noted that these watersheds are not a perfect match for reference
conditions as there are slight differences in watershed soil types and stream
geomorphology.
The Grand River Conservation Authority has informally adopted 78 µg/L for a TP
target concentration for its water resource programs. This value represents the
median TP concentration of the entire Grand River long-term monitoring dataset.
Twenty Mile watershed has a median TP concentration of 116 µg/L that could be
considered a target concentration.
Limitations for this approach are discussed in section 3.4.5.
Delisting Criteria Option #8
Do not set TP concentration Delisting Criteria and Loading Targets for the
Niagara River AOC.

The Welland River Eutrophication Study in the Niagara River Area of Concern
Niagara River Remedial Action Plan
62
Use as a Delisting Criteria an ideal percentage of landowners implementing Best
Management Practices (BMPs) within each sub-watershed.
It may be difficult to quantify the percentage of BMPs within a subwatershed as
there is limited data available to determine the existing percentage.
BMPs represent a large number of activities that may or may not have
phosphorus limiting benefits. Phosphorus limiting BMPs will need to be clearly
defined if this option is selected.
Delisting Criteria Option #9
Do not set TP Delisting Criteria and Loading Targets for the Niagara River AOC.
It may not be possible to fully restore the BUI: Eutrophication and Undesirable
Algae because of permanent man-made impacts (Welland Canals, Binbrook
Reservoir, OPG and flow fluctuations).
Additional studies on dissolved oxygen and benthic algae may be required before
this option can be selected.
In this case, there may be very logical and practical reasons why the impaired
BUI: Eutrophication and Undesirable Algae cannot be fully restored and these
reasons and rationales should be provided in a Stage 3 RAP.
The intent here is to explicitly recognize that this BUI may not be fully restored for
justifiable reasons and that this should not prohibit the possible delisting of an
Area of Concern.
4.4 Continued Water Quality Monitoring in Niagara River AOC
The TWG believes it is imperative that objective #5 of the Welland River Eutrophication Study be
implemented. This objective will allow the Niagara River AOC partners to track water quality
improvements that have been initiated through the RAP. Water quality monitoring in the Niagara
River AOC has been conducted through the NPCA Water Quality Monitoring Program since
2001. The NPCA monitors twenty-three stations in the Niagara River AOC with twelve along the
main channel of the Welland River and eleven at the mouths of major subwatersheds. Currently
there is no lab load and equipment to characterize wet weather events within the NPCA
monitoring program. The TWG recommends that wet weather/event-based sampling be
incorporated into any future water quality monitoring in the Niagara River AOC. However,
without continued funding for laboratory analysis there is limited capacity by the NPCA for
implementing objective #5. In the past, funding for water quality analysis has been provided
through the Environment Canada’s Great Lake Sustainability Fund, the MOE, the Region of
Niagara, and the City of Hamilton. This funding agreement has been highly effective in
providing complete water quality data for the Niagara River AOC. To maintain the existing
water quality network, the TWG recommends that funding for lab analysis and sampling
equipment be continued for this program.


The Welland River Eutrophication Study in the Niagara River Area of Concern
Niagara River Remedial Action Plan
63
5.0 Conclusions
The Welland River Eutrophication Study was a three-year project overseen by a TWG whose
purpose was to refine and implement the Recommendations for Monitoring and Assessment
which were formulated by the 2007 Technical Review Committee outlined in Appendix H
Eutrophication and Undesirable Algae. The following summarizes the main conclusions for the
Welland River Eutrophication Study based on the five study objectives.
1. The TWG was unable to fully characterize the biological response of the Welland River
to high phosphorus inputs and thus solely implicate TP concentrations as the primary
reason for the degraded aesthetics (through algae/macrophyte overgrowth) and low DO
conditions in the Niagara River AOC. Nonetheless, the TWG affirmed that the Welland
River has a significant TP problem with 99% of grab samples collected in the 2008-2010
study failing to meet the interim PWQO of 30 µg/L for TP (MOEE, 1994). Mean TP
concentrations ranged from 200% to 1500% greater than the PWQO depending on the
subwatershed. Although TP is likely a contributor to the status of BUI’s impairment, it is
not the only contributor. The TWG identified benthic algae, water flow patterns, and an
expanded number of oxygen demanding substances (COD, NOD, SOD) as likely
stressors to this Eutrophication and Undesirable Algae BUI. The TWG recommends
additional studies that examine the role of these stressors to fully understand the
biological responses of the Welland River.
2. The TWG was able to characterize concentrations of phosphate versus sediment-bound
phosphorus along the length of the Welland River. The proportion of phosphate in the
main Welland River channel ranged from 4% - 58% and concentrations generally
increased as water moved downstream through the Welland River watershed; however
a decrease was noted in the lower reaches where mixing occurs with the Niagara River.
The proportion of phosphate observed in the Welland River tributaries ranged from 24%
to 68% with most of these stations exceeding 50%. These tributaries have been
identified as contributing significant amounts of potentially biologically available
phosphorus to the Welland River watershed. The highest concentrations observed were
found in Big Forks (BF001), Beaver Creek (BV001), Oswego Creek (OS001), and Tee
Creek (TE001).
3. The TWG evaluated a number of methods for determining nutrient delisting criteria in
streams. Through this process the TWG found it difficult to strongly advocate for a
specific delisting criteria. The TWG agreed that achieving the current TP delisting criteria
of 30 µg/L would be very difficult considering the permanent irreversible land use of the
watershed. In addition there were several data gaps identified (benthic algae, water flow
patterns, and DO stressors) that need to be studied. Based on these constraints the
TWG developed three new sets of TP delisting criteria and loading targets based on the
Export Coefficient Approach for the different subwatersheds of the Welland River
upstream of the Old Welland Canal. The TWG has provided the RAP Coordinating

The Welland River Eutrophication Study in the Niagara River Area of Concern
Niagara River Remedial Action Plan
64
Committee with these three plus six additional TP Delisting Criteria Options based on
the results of the Welland River Eutrophication Study. Before adopting any of the
proposed Delisting Criteria and Loading Targets the RAP Coordinating Committee must
consider the important items that TWG identified in Section 3.5. In addition, each of the
TP Delisting Criteria Options required varying magnitudes of TP reduction and the TWG
recommends that no matter which delisting criteria is selected that it be reviewed every
five years.
4. The TWG found that Niagara River AOC tributaries carry significant phosphorus
concentrations that have the potential to impair the BUI: Eutrophication and Undesirable
Algae. The TWG recommends that water quality monitoring in the Niagara River AOC
continue to ensure that evaluation of conditions against the delisting criteria can be
achieved. Phosphorus must be carefully managed and the TWG identified several
subwatersheds with especially high TP concentrations (Beaver Creek, Big Fork and
Oswego Creek). The TWG agrees that these are likely to be the most responsive to best
management practices.

The Welland River Eutrophication Study in the Niagara River Area of Concern
Niagara River Remedial Action Plan
65
6.0 References
AECOM. 2009. Evaluation of Remedial Action Plan Tributary Nutrient Delisting Criteria for the
St. Lawrence River. Prepared for Ontario Ministry of the Environment.
ANZECC: Australian and New Zealand Environmental and Conservation Council, Agricultural
and Resource Management Council of Australia and New Zealand ANZECC and ARMCANZ.
2000. Australian and New Zealand Guidelines for Fresh and Marine Water Quality. Volume 1,
The Guidelines. Chapters 1-7.
Canadian Council of Ministers of the Environment. 2006. Canadian Water Quality Guidelines for
the Protection of Aquatic Life. Canadian Environmental Quality Guidelines.
Chambers, P.A., R.B. Brua, D.J.McGoldrick. B.L. Upsdell, C. Vis, J.M. Culp and G. A. Benoy.
2008. Nitrogen and Phosphorus Standards to Protect Ecological Conditions of Canadian
Streams in Agricultural Watersheds. National Agri-Environmental Standards Initiative Technical
Series Report No. 4-45. 103 pp.
Cooke. S. 2004. Southern Grand River Rehabilitation Initiative: Water Quality Characterization.
Grand River Conservation Authority. Cambridge. Ontario.
Dodd, R.C., G. McMahon, and S. Stichter. 1992. Watershed planning in the Albemarlo-Pamlico
Estuaries System. Report 1- Annual Average Nutrient Budgets. Report No.92-10. Albermarle-
Pamlico Study. NC. Dept. of Environment, Health and Natural Resources, Raleigh, NC.
Dodds, W.K., J.R. Jones and E. Welch. 1998. Suggested Classification of Stream Trophic State:
Distributions of Temperate Stream Types By Chlorophyll, Total Nitrogen, and Phosphorus.
Water Research 32: 1455-1462.
Environment Canada. 2007. Technical Review of Impairments and Delisting Criteria
Niagara River (Ontario) Remedial Action Plan.
Gemza, A. 1993. Binbrook Reservoir (Glanbrook Township) Water Quality Assessment and
Management Implementations. Ontario Ministry of the Environment.
Jeje, Y. 2006. Export Coefficients for Total Phosphorus, Total Nitrogen and Total Suspended
Solids in the Southern Alberta Region: A Review of Literature. Alberta Environment.
Johnston and Cornelisse. June 1997. Proceedings of the Options for Restoring the Physical
and Ecological Stability of the Welland River Workshop (November 20 – 21, 1996). Welland,
Ontario).
Kilborn. 1984. Flood Plain Mapping Welland River. Hydrology Report. Prepared for the
Niagara Peninsula Conservation Authority.

The Welland River Eutrophication Study in the Niagara River Area of Concern
Niagara River Remedial Action Plan
66
Miller. S. 2009. Personal Communication.
Mitch. D. and O. Trew. 1982. Agricultural Runoff and Lake Water Quality IN Agricultural Impacts
on Surface and Groundwater Quality. Lethbridge. September 16-17 1992. pp.73-79.
Ministry of Natural Resources. 2006. Southern Ontario Land Resources Information System
(SOLRIS), Data Specifications. Science and Information Branch.
Ministry of Natural Resources. 2007. Southern Ontario Land Resources Information System
(SOLRIS), Data Specifications. Science and Information Branch.
Natural Resources Canada. 2009. The Altas of Canada. Fourth Edition 1974. Runoff 1973.
Map. http://atlasnrcan.gc.ca/site/english/maps/archives/4thedition.
Niagara Peninsula Conservation Authority. March 1998. Biological Assessment for the Welland
River and the Niagara Peninsula Watershed 1995-1997.
Niagara Peninsula Conservation Authority. November 1999. Welland River Watershed Strategy.
Niagara Peninsula Conservation Authority. 2005. Niagara River AOC Tributary Monitoring
Program 2004 Annual Report.
Niagara Peninsula Conservation Authority and AquaResources Inc. 2010. Niagara Peninsula
Tier 1 Water Budget and Water Quantity Stress Assessment Final Report Niagara Peninsula
Source Protection Area. Welland.
Ontario Ministry of Environment. 1993. Guideline for the Protection and Management of Aquatic
Sediment Quality in Ontario. Queen’s Printer for Ontario.
Ontario Ministry of Environment. 1994. Provincial Water Quality Objectives. Queen’s Printer for
Ontario. Queen’s Printer for Ontario.
Ontario Ministry of Environment. 2001. Procedure F-5-5: Determination of Treatment
Requirements for Municipal and Private Combined and Partially Separated Sewer Systems.
http://www.ene.gov.on.ca/environment/en/resources/STD01_076048.html
Remedial Action Plan 1993. Niagara River Remedial Action Plan Stage 1 Report: Environmental
Conditions and Problem Defined.
Remedial Action Plan 1995. Niagara River Remedial Action Plan Stage 2 Report: The Cleanup
Connection.
Remedial Action Plan 2009. Niagara River Remedial Action Plan Stage 2 Update Report.

The Welland River Eutrophication Study in the Niagara River Area of Concern
Niagara River Remedial Action Plan
67
Regional Municipality of Niagara. 2003. Niagara Water Quality Protection Strategy- Technical
Report Phase 2. Regional Municipality of Niagara and partners. October, 2003.
RV Anderson and Associates and XCG Consultants LTD. 2003. City of Welland Combined
Service Overflow Study: Environmental Study Report. City of Welland and Oakville, Ontario.
Prepared for: The Corporation of the City of Welland.
Smith, R. 1992. Elements of Ecology. Third Edition. HarperCollins Publisher Inc NY.
United States Environmental Protection Agency (USEPA). 2000. Ambient water quality criteria
recommendations: information supporting the development of state and tribal nutrient criteria
for rivers and streams in nutrient ecoregion I-XIV. United States Environmental Protection
Agency, Office of Water, Office of Science and Technology, Health and Ecological Criteria
Division. Washington, D.C.
United States Environmental Protection Agency (USEPA). 2002. National Management
Measures to Control Non-Point Source Pollution from Agriculture 314pp.
http://www.epa.gov/owow/nps/agmm.
Welland River Fisheries Study 1997. Completed Through Partnership by Environment Canada
Great Lakes 2000 Clean Up Fund, Ontario Ministry of Natural Resources, Ontario Ministry of
Environment and the Niagara Peninsula Conservation Authority.
Welland Riverkeepers web site: www.wellandriverkeepers.ca
Wetzel, R.G. 1983. Limnology. Second Edition. Saunders College Publishing. 860 pp.
Winters, Jennifer. 2000. Personal Communication.
XCG Consultants LTD. 2004. CSO Treatability Evaluation for the City of Welland: August 2004
Final Report. Oakville, Ontario. Prepared for: The Corporation of the City of Welland, Regional
Municipality of Niagara, Great Lakes Sustainability Fund and Ontario Ministry of Environment.