Embed Size (px)
Citation preview
© 2012 Towers Watson. All rights reserved.
The World’s 500 Largest Asset ManagersThe P&I/Towers Watson global 500 ranking is prepared using joint research by Pensions & Investments and Towers Watson
Year end 2011
towerswatson.com© 2012 Towers Watson. All rights reserved. Proprietary and Confidential. For Towers Watson and Towers Watson client use only.
2
Contents
l Executive Summary 3
l Analysis
– Section 1: Total value of assets and growth rates 6
– Section 2: Analysis of the largest 20 asset managers 10
– Section 3: Passive management 17
l Contact details and limitations of reliance 21
l Appendix – Complete ranking 22
Page
towerswatson.com© 2012 Towers Watson. All rights reserved. Proprietary and Confidential. For Towers Watson and Towers Watson client use only.
3
Executive Summary
towerswatson.com© 2012 Towers Watson. All rights reserved. Proprietary and Confidential. For Towers Watson and Towers Watson client use only.
4
Executive summary
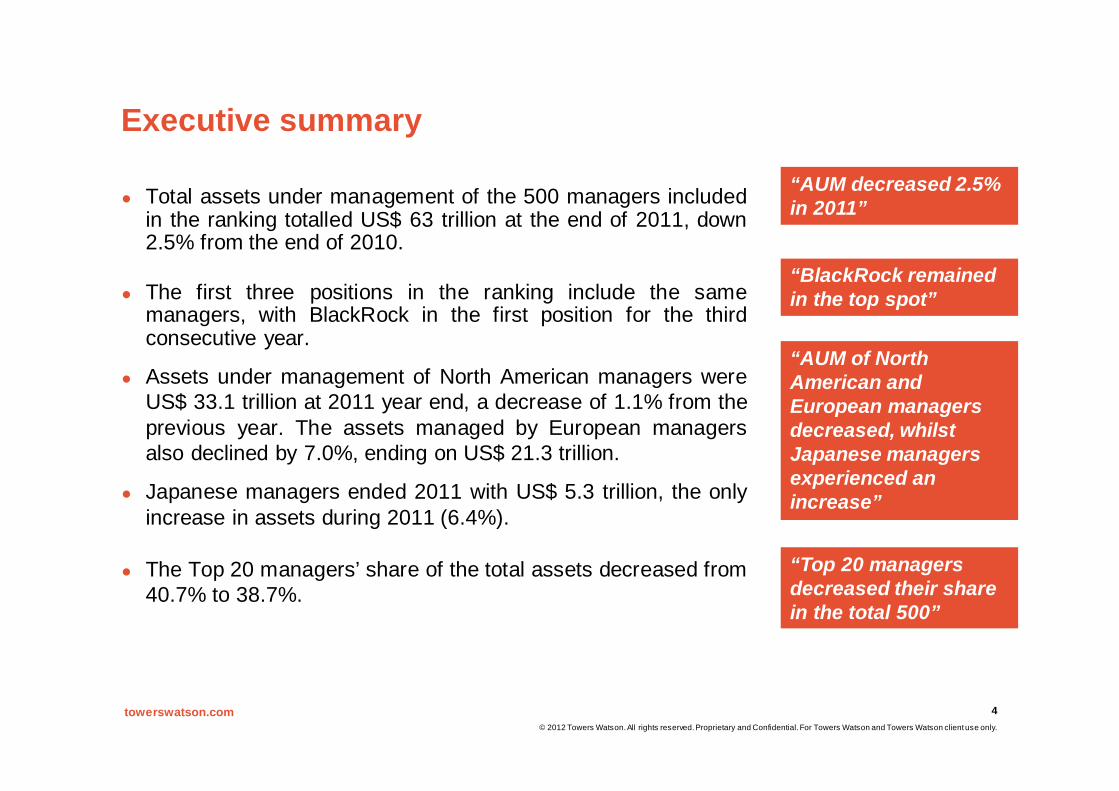
l Total assets under management of the 500 managers includedin the ranking totalled US$ 63 trillion at the end of 2011, down2.5% from the end of 2010.
l The first three positions in the ranking include the samemanagers, with BlackRock in the first position for the thirdconsecutive year.
l Assets under management of North American managers wereUS$ 33.1 trillion at 2011 year end, a decrease of 1.1% from theprevious year. The assets managed by European managersalso declined by 7.0%, ending on US$ 21.3 trillion.
l Japanese managers ended 2011 with US$ 5.3 trillion, the onlyincrease in assets during 2011 (6.4%).
l The Top 20 managers’ share of the total assets decreased from40.7% to 38.7%.
“AUM decreased 2.5% in 2011”
“BlackRock remained in the top spot”
“AUM of North American and European managers decreased, whilst Japanese managers experienced an increase”
“Top 20 managers decreased their share in the total 500”
towerswatson.com© 2012 Towers Watson. All rights reserved. Proprietary and Confidential. For Towers Watson and Towers Watson client use only.
5
Executive summary
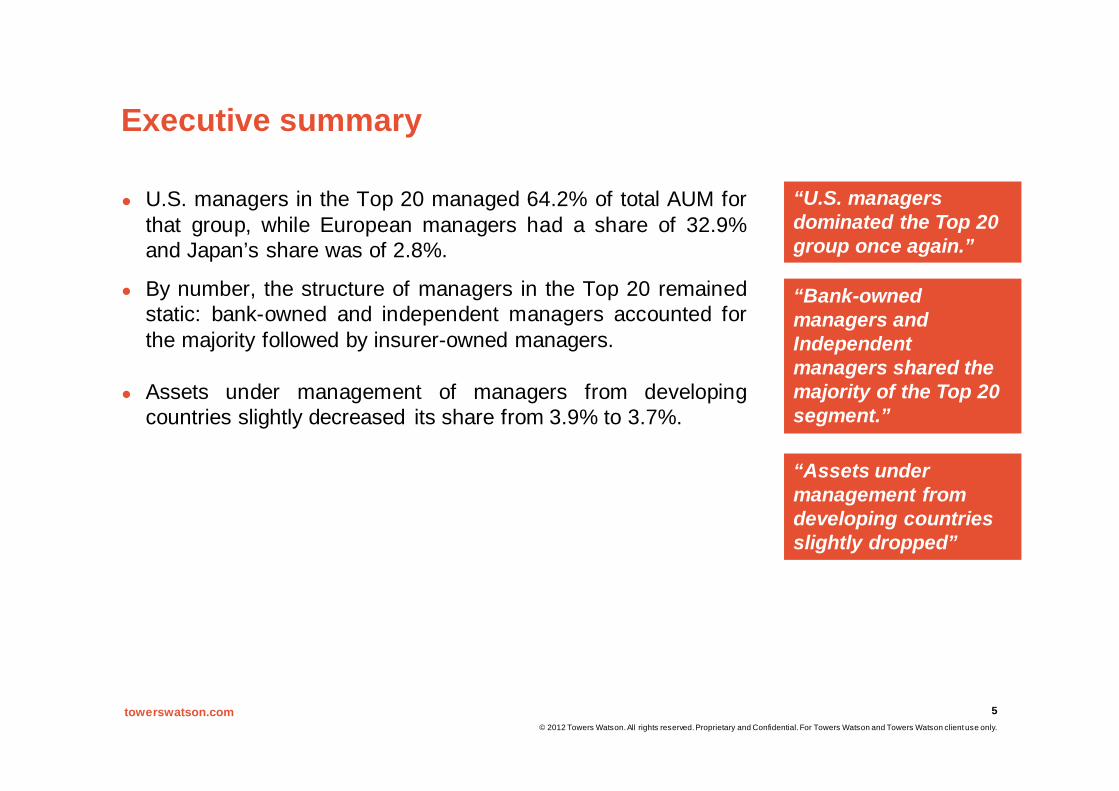
l U.S. managers in the Top 20 managed 64.2% of total AUM forthat group, while European managers had a share of 32.9%and Japan’s share was of 2.8%.
l By number, the structure of managers in the Top 20 remainedstatic: bank-owned and independent managers accounted forthe majority followed by insurer-owned managers.
l Assets under management of managers from developingcountries slightly decreased its share from 3.9% to 3.7%.
“Bank-owned managers and Independent managers shared the majority of the Top 20 segment.”
“Assets under management from developing countries slightly dropped”
“U.S. managers dominated the Top 20 group once again.”

towerswatson.com© 2012 Towers Watson. All rights reserved. Proprietary and Confidential. For Towers Watson and Towers Watson client use only.
6
AnalysisSection 1: Total value of assets and growth rates
towerswatson.com© 2012 Towers Watson. All rights reserved. Proprietary and Confidential. For Towers Watson and Towers Watson client use only.
7
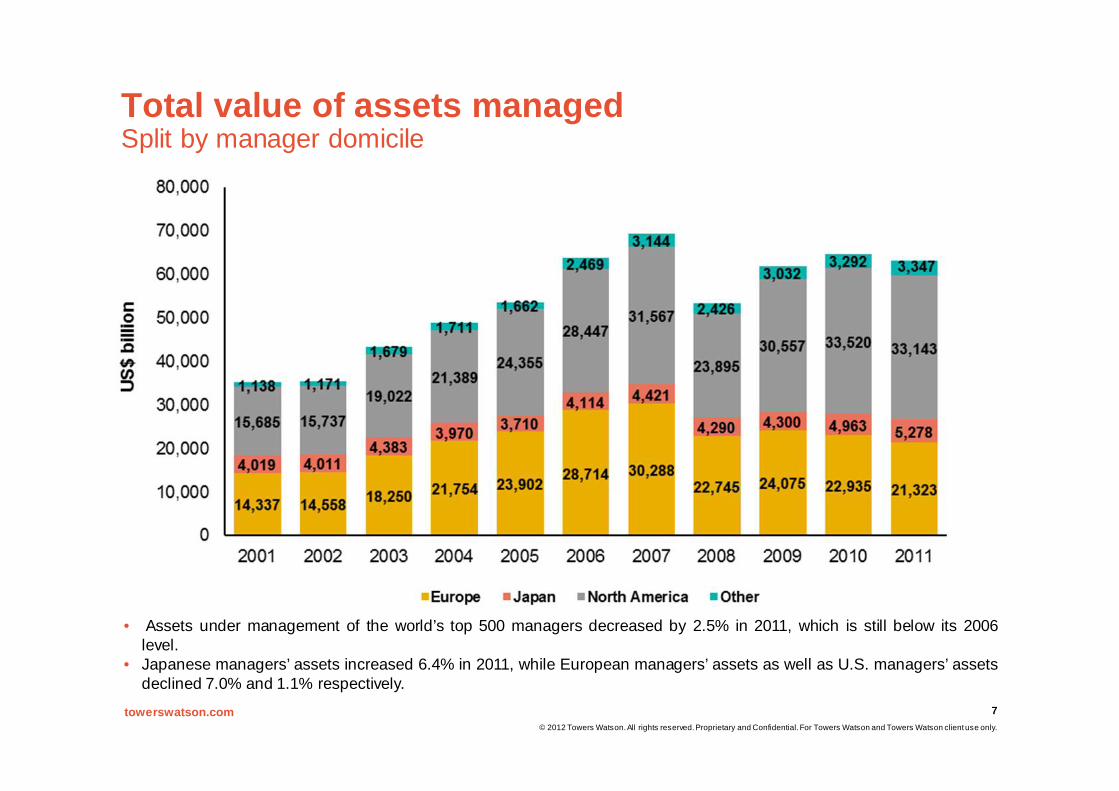
Total value of assets managedSplit by manager domicile
• Assets under management of the world’s top 500 managers decreased by 2.5% in 2011, which is still below its 2006level.
• Japanese managers’ assets increased 6.4% in 2011, while European managers’ assets as well as U.S. managers’ assetsdeclined 7.0% and 1.1% respectively.
towerswatson.com© 2012 Towers Watson. All rights reserved. Proprietary and Confidential. For Towers Watson and Towers Watson client use only.
8
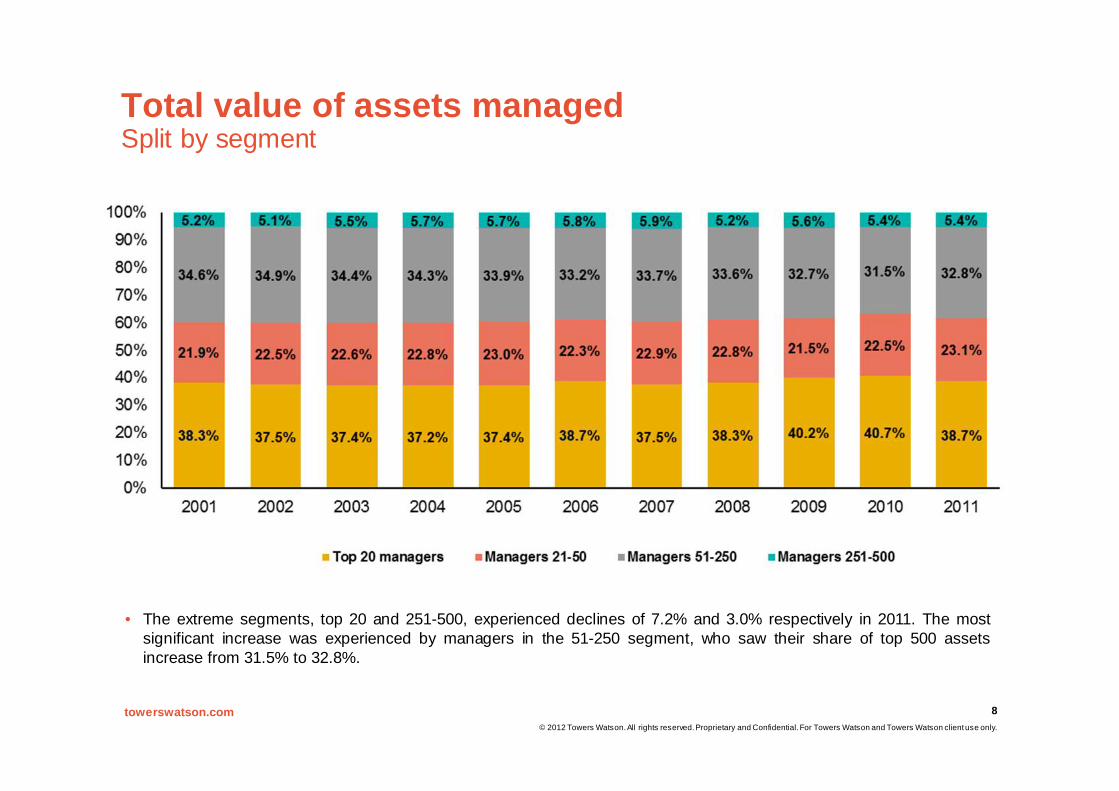
Total value of assets managed Split by segment
• The extreme segments, top 20 and 251-500, experienced declines of 7.2% and 3.0% respectively in 2011. The mostsignificant increase was experienced by managers in the 51-250 segment, who saw their share of top 500 assetsincrease from 31.5% to 32.8%.
towerswatson.com© 2012 Towers Watson. All rights reserved. Proprietary and Confidential. For Towers Watson and Towers Watson client use only.
9
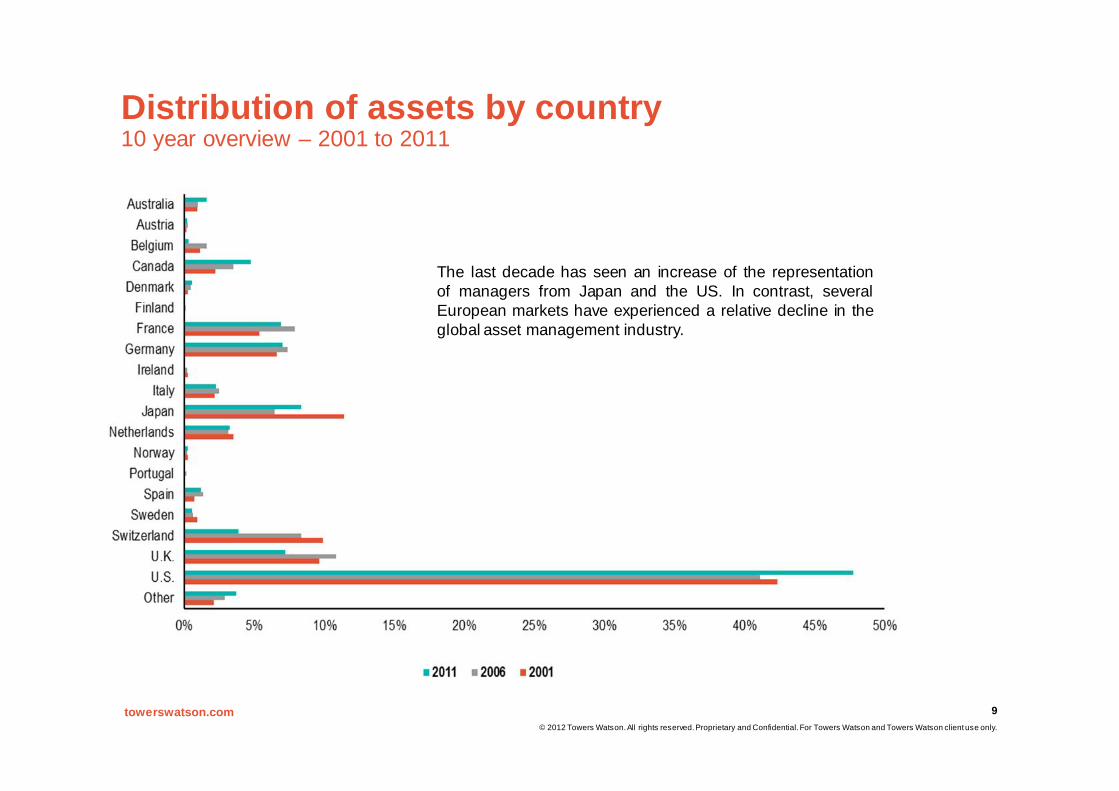
Distribution of assets by country10 year overview – 2001 to 2011
The last decade has seen an increase of the representationof managers from Japan and the US. In contrast, severalEuropean markets have experienced a relative decline in theglobal asset management industry.
towerswatson.com© 2012 Towers Watson. All rights reserved. Proprietary and Confidential. For Towers Watson and Towers Watson client use only.
10
AnalysisSection 2: Analysis of the largest 20 asset managers
towerswatson.com© 2012 Towers Watson. All rights reserved. Proprietary and Confidential. For Towers Watson and Towers Watson client use only.
11
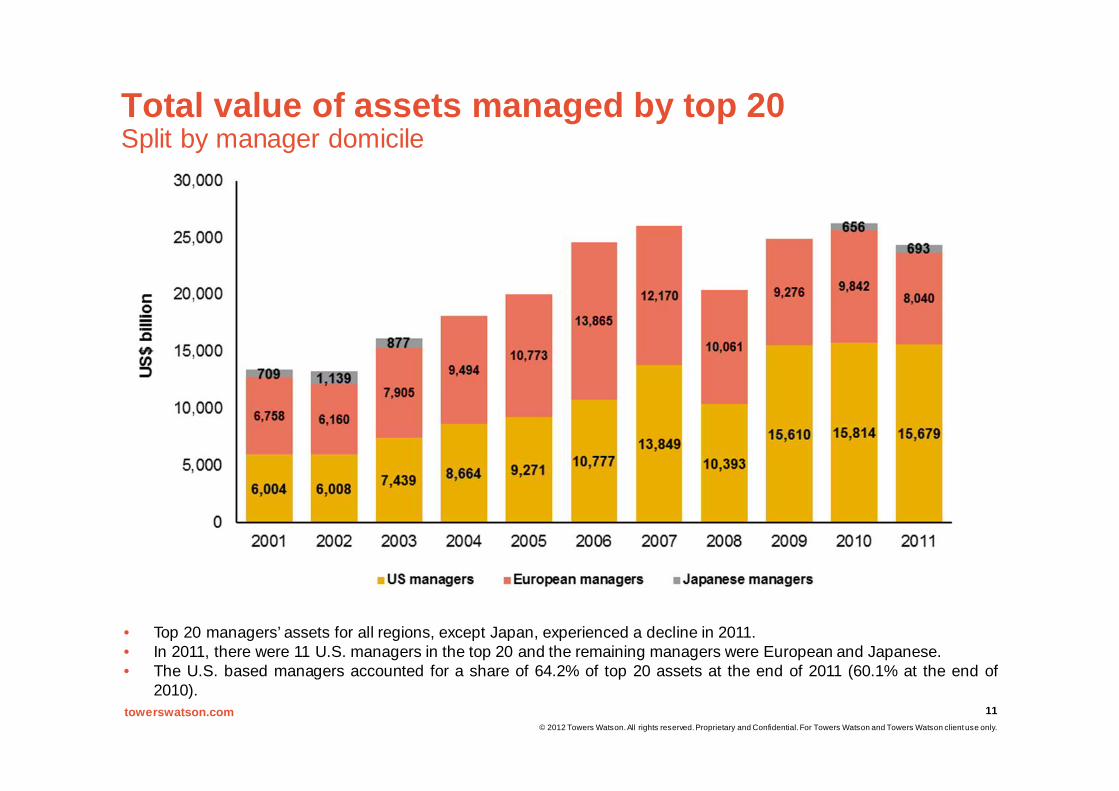
Total value of assets managed by top 20Split by manager domicile
• Top 20 managers’ assets for all regions, except Japan, experienced a decline in 2011.• In 2011, there were 11 U.S. managers in the top 20 and the remaining managers were European and Japanese.• The U.S. based managers accounted for a share of 64.2% of top 20 assets at the end of 2011 (60.1% at the end of
2010).
towerswatson.com© 2012 Towers Watson. All rights reserved. Proprietary and Confidential. For Towers Watson and Towers Watson client use only.
12
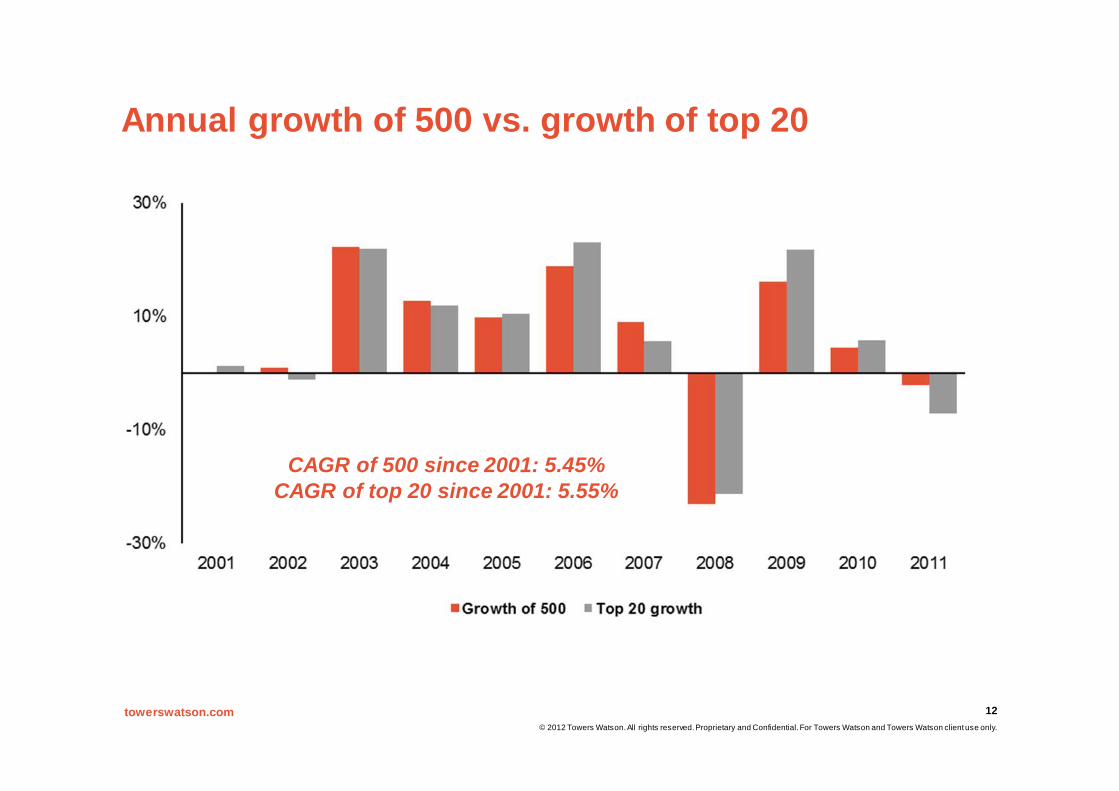
Annual growth of 500 vs. growth of top 20
CAGR of 500 since 2001: 5.45%CAGR of top 20 since 2001: 5.55%
towerswatson.com© 2012 Towers Watson. All rights reserved. Proprietary and Confidential. For Towers Watson and Towers Watson client use only.
13
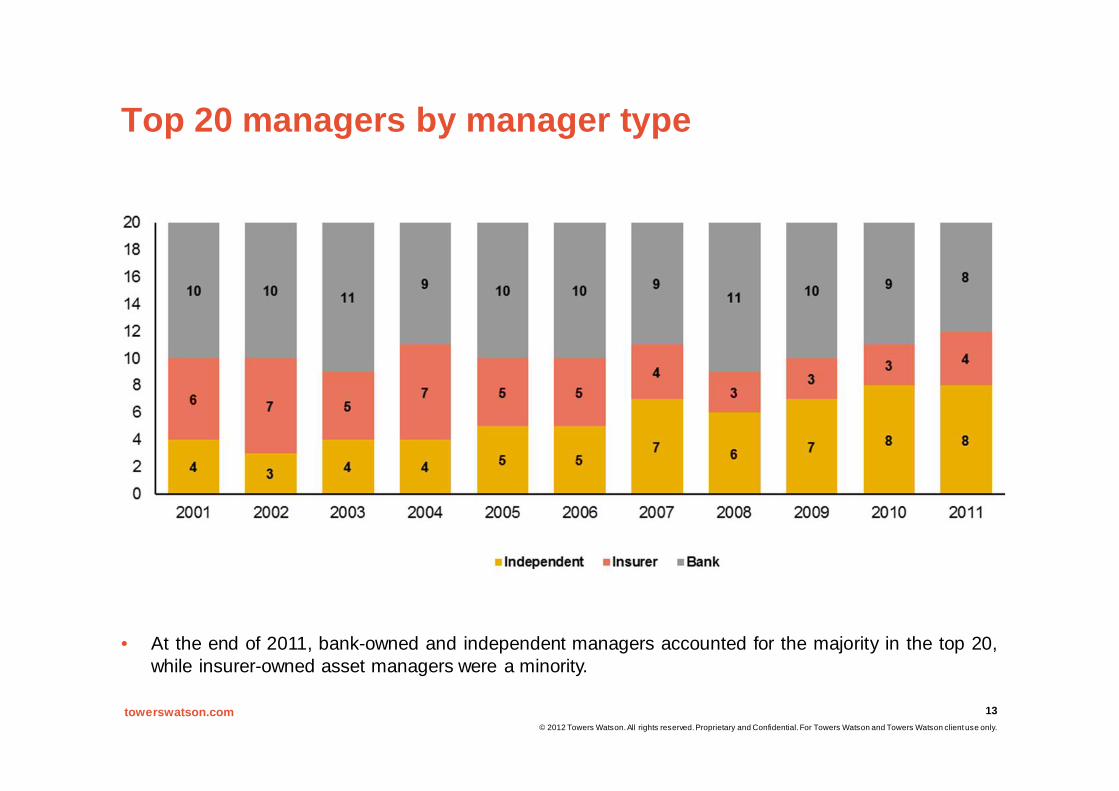
Top 20 managers by manager type
• At the end of 2011, bank-owned and independent managers accounted for the majority in the top 20,while insurer-owned asset managers were a minority.
towerswatson.com© 2012 Towers Watson. All rights reserved. Proprietary and Confidential. For Towers Watson and Towers Watson client use only.
14
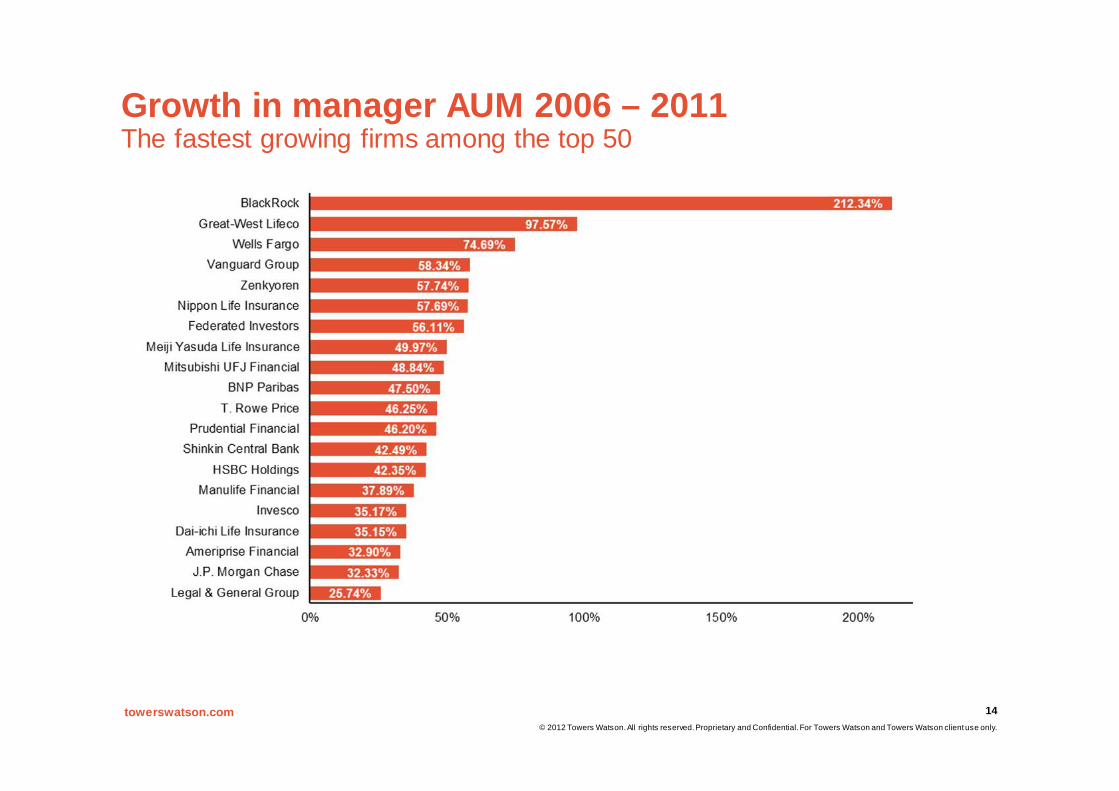
Growth in manager AUM 2006 – 2011The fastest growing firms among the top 50
towerswatson.com© 2012 Towers Watson. All rights reserved. Proprietary and Confidential. For Towers Watson and Towers Watson client use only.
15
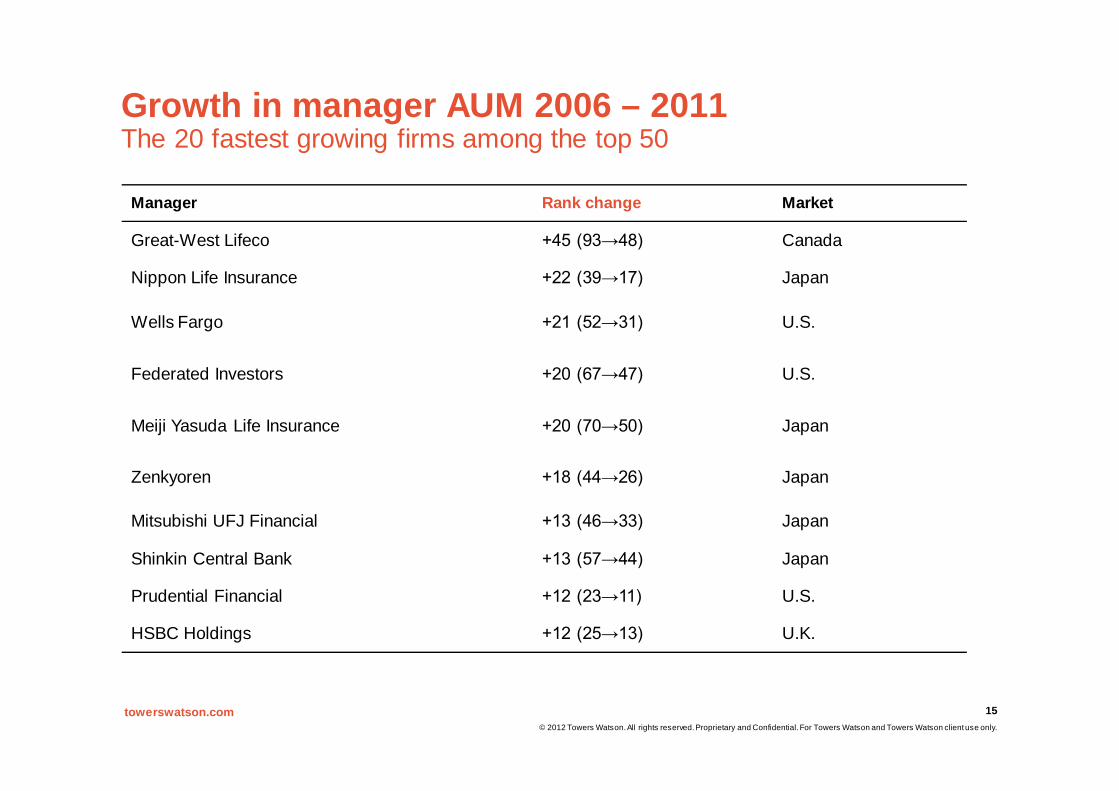
Growth in manager AUM 2006 – 2011The 20 fastest growing firms among the top 50
Manager Rank change Market
Great-West Lifeco +45 (93→48) Canada
Nippon Life Insurance +22 (39→17) Japan
Wells Fargo +21 (52→31) U.S.
Federated Investors +20 (67→47) U.S.
Meiji Yasuda Life Insurance +20 (70→50) Japan
Zenkyoren +18 (44→26) Japan
Mitsubishi UFJ Financial +13 (46→33) Japan
Shinkin Central Bank +13 (57→44) Japan
Prudential Financial +12 (23→11) U.S.
HSBC Holdings +12 (25→13) U.K.
towerswatson.com© 2012 Towers Watson. All rights reserved. Proprietary and Confidential. For Towers Watson and Towers Watson client use only.
16
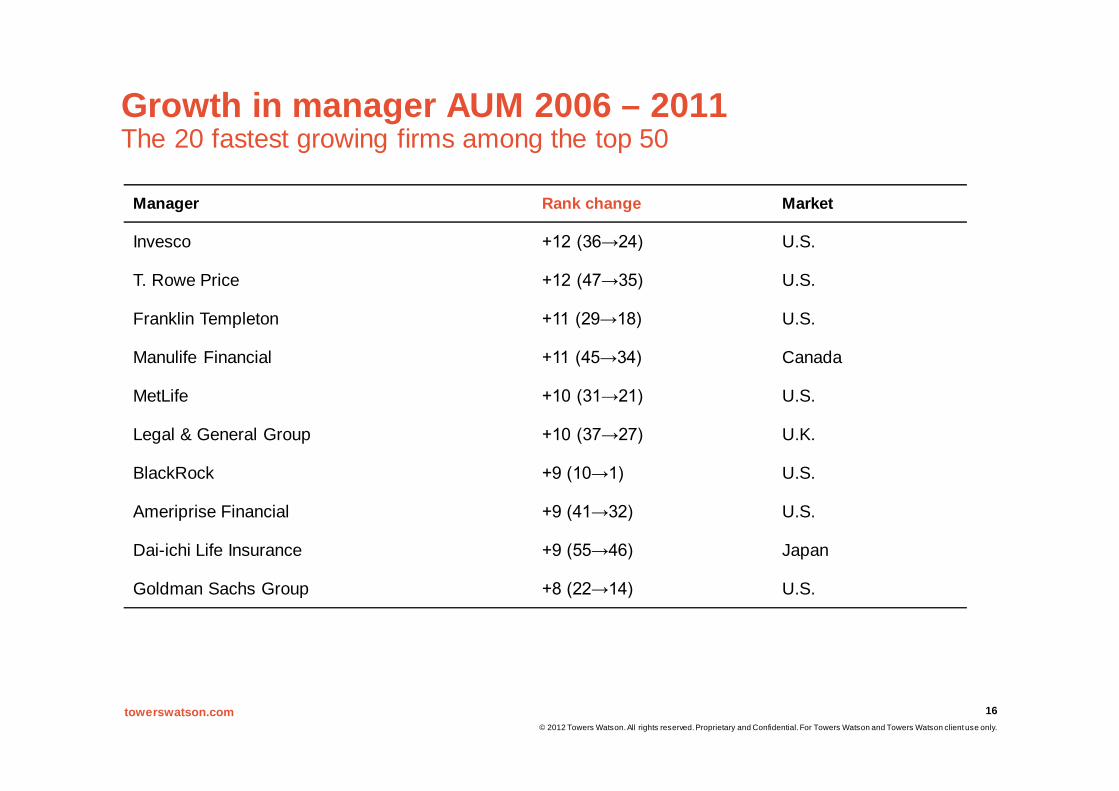
Growth in manager AUM 2006 – 2011The 20 fastest growing firms among the top 50
Manager Rank change Market
Invesco +12 (36→24) U.S.
T. Rowe Price +12 (47→35) U.S.
Franklin Templeton +11 (29→18) U.S.
Manulife Financial +11 (45→34) Canada
MetLife +10 (31→21) U.S.
Legal & General Group +10 (37→27) U.K.
BlackRock +9 (10→1) U.S.
Ameriprise Financial +9 (41→32) U.S.
Dai-ichi Life Insurance +9 (55→46) Japan
Goldman Sachs Group +8 (22→14) U.S.

towerswatson.com© 2012 Towers Watson. All rights reserved. Proprietary and Confidential. For Towers Watson and Towers Watson client use only.
17
AnalysisSection 3: Passive management
towerswatson.com© 2012 Towers Watson. All rights reserved. Proprietary and Confidential. For Towers Watson and Towers Watson client use only.
18
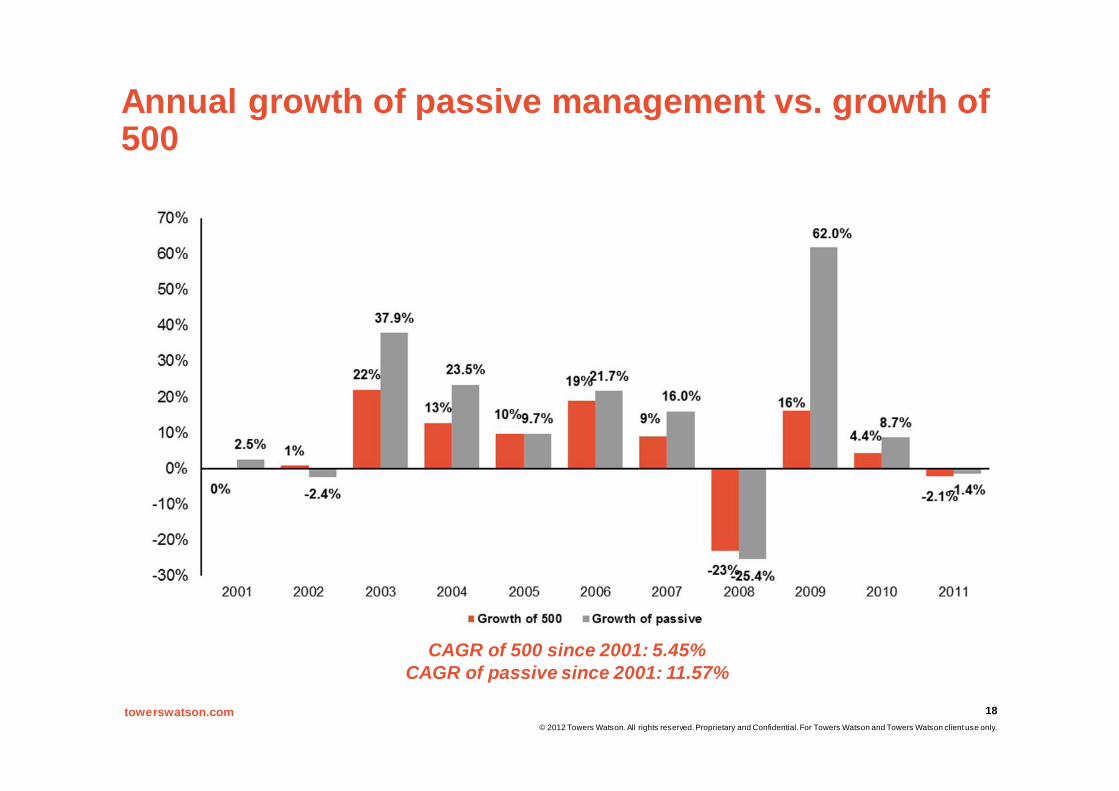
Annual growth of passive management vs. growth of 500
CAGR of 500 since 2001: 5.45%CAGR of passive since 2001: 11.57%
towerswatson.com© 2012 Towers Watson. All rights reserved. Proprietary and Confidential. For Towers Watson and Towers Watson client use only.
19
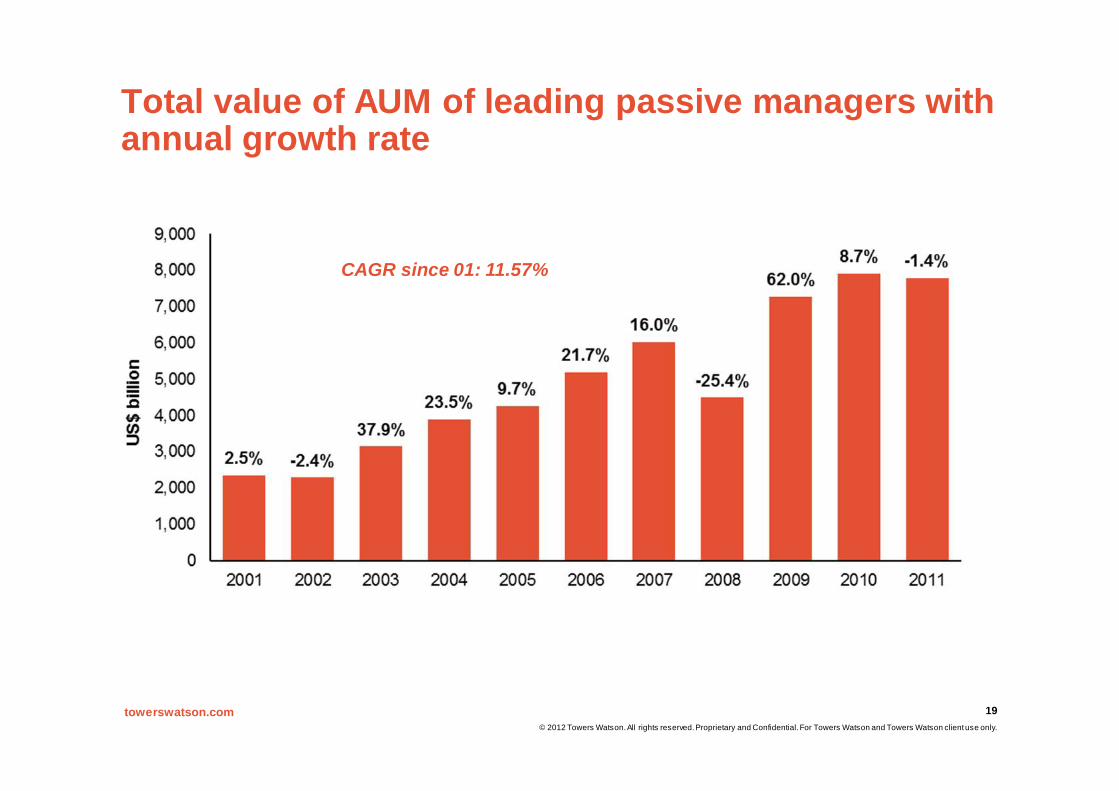
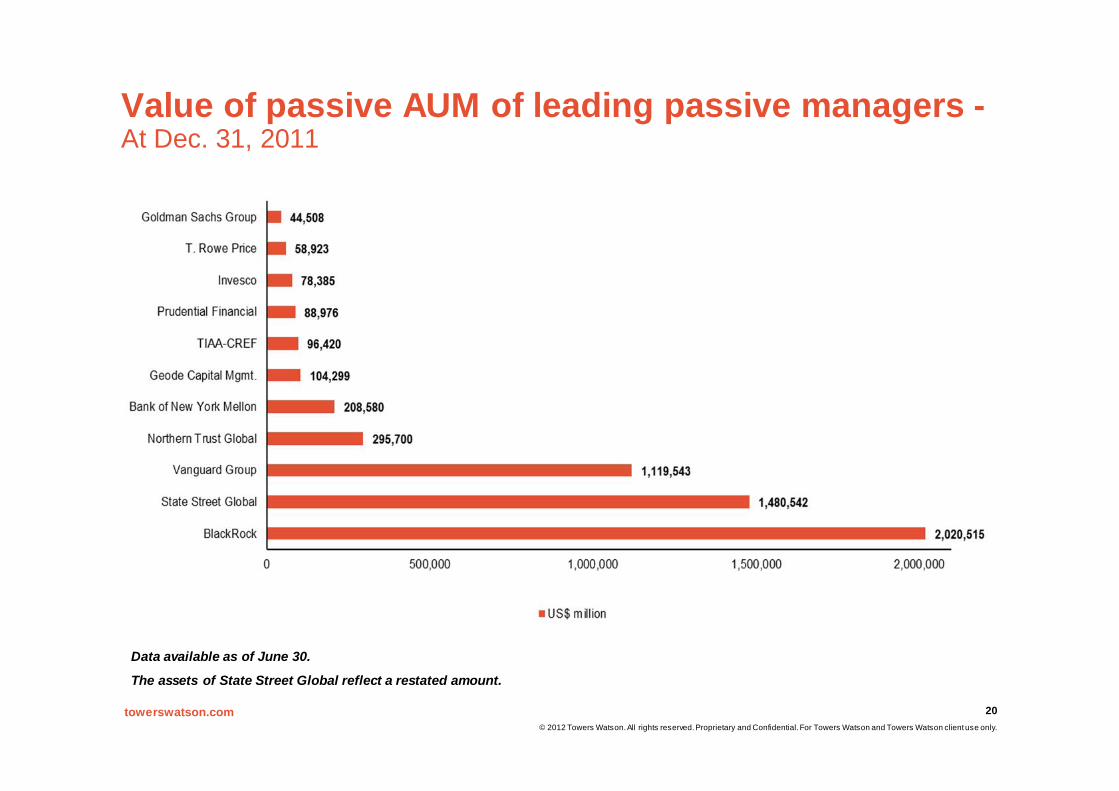
Total value of AUM of leading passive managers with annual growth rate
CAGR since 01: 11.57%
towerswatson.com© 2012 Towers Watson. All rights reserved. Proprietary and Confidential. For Towers Watson and Towers Watson client use only.
20
Value of passive AUM of leading passive managers -At Dec. 31, 2011
Data available as of June 30.
The assets of State Street Global reflect a restated amount.
towerswatson.com© 2012 Towers Watson. All rights reserved. Proprietary and Confidential. For Towers Watson and Towers Watson client use only.
21
Contact details and limitations of reliancel Contact details
Jessica GaoTowers Watson Investment +44 207 227 [email protected]
James PriceTowers Watson Investment +44 207 227 [email protected]
l In preparing this report at times we have relied upon estimates and data supplied to us by third parties. While reasonable care has been taken to gauge the reliability of this data, this report carries no guarantee of accuracy or completeness and Towers Watson cannot be held accountable for the misrepresentation of data by third parties involved.
l This report is based on information available to Towers Watson at the date of the report and takes no account of subsequent developments after that date. It may not be modified or provided to any other party without Towers Watson’s prior written permission. It may also not be disclosed to any other party without Towers Watson’s prior written permission except as may be required by law. In the absence of our express written agreement to the contrary, Towers Watson accepts no responsibility for any consequences arising from any third party relying on this report or the opinions we have expressed. This report is not intended by Towers Watson to form a basis of any decision by a third party to do or omit to do anything.
towerswatson.com© 2012 Towers Watson. All rights reserved. Proprietary and Confidential. For Towers Watson and Towers Watson client use only.
22
AppendixComplete ranking
towerswatson.com© 2012 Towers Watson. All rights reserved. Proprietary and Confidential. For Towers Watson and Towers Watson client use only.
23
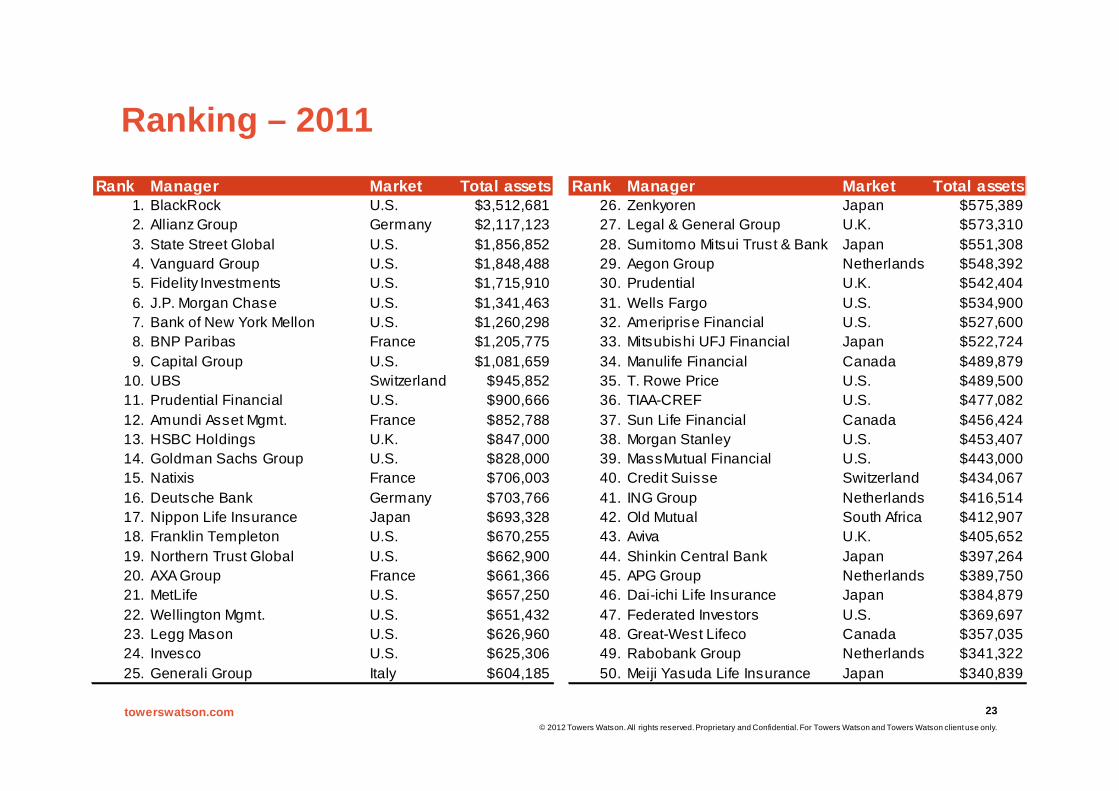
Ranking – 2011Rank Manager Market Total assets Rank Manager Market Total assets
1. BlackRock U.S. $3,512,681 26. Zenkyoren Japan $575,3892. Allianz Group Germany $2,117,123 27. Legal & General Group U.K. $573,3103. State Street Global U.S. $1,856,852 28. Sumitomo Mitsui Trust & Bank Japan $551,3084. Vanguard Group U.S. $1,848,488 29. Aegon Group Netherlands $548,3925. Fidelity Investments U.S. $1,715,910 30. Prudential U.K. $542,4046. J.P. Morgan Chase U.S. $1,341,463 31. Wells Fargo U.S. $534,9007. Bank of New York Mellon U.S. $1,260,298 32. Ameriprise Financial U.S. $527,6008. BNP Paribas France $1,205,775 33. Mitsubishi UFJ Financial Japan $522,7249. Capital Group U.S. $1,081,659 34. Manulife Financial Canada $489,879
10. UBS Switzerland $945,852 35. T. Rowe Price U.S. $489,50011. Prudential Financial U.S. $900,666 36. TIAA-CREF U.S. $477,08212. Amundi Asset Mgmt. France $852,788 37. Sun Life Financial Canada $456,42413. HSBC Holdings U.K. $847,000 38. Morgan Stanley U.S. $453,40714. Goldman Sachs Group U.S. $828,000 39. MassMutual Financial U.S. $443,00015. Natixis France $706,003 40. Credit Suisse Switzerland $434,06716. Deutsche Bank Germany $703,766 41. ING Group Netherlands $416,51417. Nippon Life Insurance Japan $693,328 42. Old Mutual South Africa $412,90718. Franklin Templeton U.S. $670,255 43. Aviva U.K. $405,65219. Northern Trust Global U.S. $662,900 44. Shinkin Central Bank Japan $397,26420. AXA Group France $661,366 45. APG Group Netherlands $389,75021. MetLife U.S. $657,250 46. Dai-ichi Life Insurance Japan $384,87922. Wellington Mgmt. U.S. $651,432 47. Federated Investors U.S. $369,69723. Legg Mason U.S. $626,960 48. Great-West Lifeco Canada $357,03524. Invesco U.S. $625,306 49. Rabobank Group Netherlands $341,32225. Generali Group Italy $604,185 50. Meiji Yasuda Life Insurance Japan $340,839
towerswatson.com© 2012 Towers Watson. All rights reserved. Proprietary and Confidential. For Towers Watson and Towers Watson client use only.
24
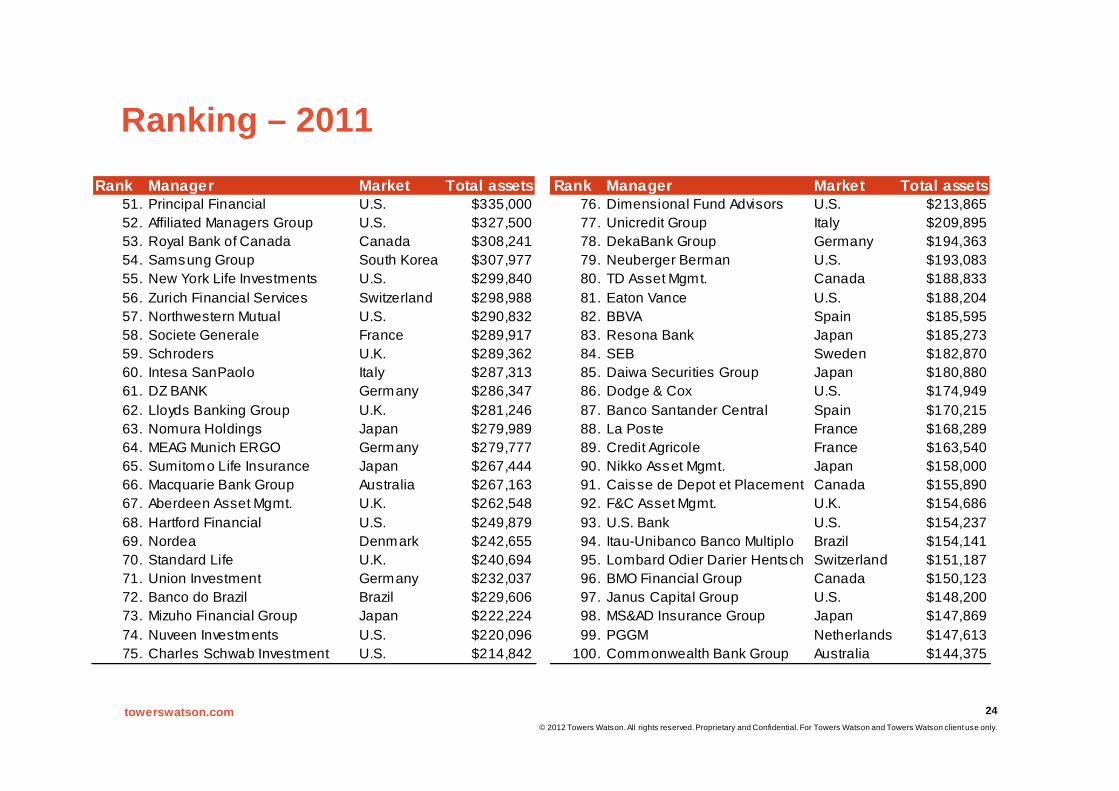
Ranking – 2011Rank Manager Market Total assets Rank Manager Market Total assets
51. Principal Financial U.S. $335,000 76. Dimensional Fund Advisors U.S. $213,86552. Affiliated Managers Group U.S. $327,500 77. Unicredit Group Italy $209,89553. Royal Bank of Canada Canada $308,241 78. DekaBank Group Germany $194,36354. Samsung Group South Korea $307,977 79. Neuberger Berman U.S. $193,08355. New York Life Investments U.S. $299,840 80. TD Asset Mgmt. Canada $188,83356. Zurich Financial Services Switzerland $298,988 81. Eaton Vance U.S. $188,20457. Northwestern Mutual U.S. $290,832 82. BBVA Spain $185,59558. Societe Generale France $289,917 83. Resona Bank Japan $185,27359. Schroders U.K. $289,362 84. SEB Sweden $182,87060. Intesa SanPaolo Italy $287,313 85. Daiwa Securities Group Japan $180,88061. DZ BANK Germany $286,347 86. Dodge & Cox U.S. $174,94962. Lloyds Banking Group U.K. $281,246 87. Banco Santander Central Spain $170,21563. Nomura Holdings Japan $279,989 88. La Poste France $168,28964. MEAG Munich ERGO Germany $279,777 89. Credit Agricole France $163,54065. Sumitomo Life Insurance Japan $267,444 90. Nikko Asset Mgmt. Japan $158,00066. Macquarie Bank Group Australia $267,163 91. Caisse de Depot et Placement Canada $155,89067. Aberdeen Asset Mgmt. U.K. $262,548 92. F&C Asset Mgmt. U.K. $154,68668. Hartford Financial U.S. $249,879 93. U.S. Bank U.S. $154,23769. Nordea Denmark $242,655 94. Itau-Unibanco Banco Multiplo Brazil $154,14170. Standard Life U.K. $240,694 95. Lombard Odier Darier Hentsch Switzerland $151,18771. Union Investment Germany $232,037 96. BMO Financial Group Canada $150,12372. Banco do Brazil Brazil $229,606 97. Janus Capital Group U.S. $148,20073. Mizuho Financial Group Japan $222,224 98. MS&AD Insurance Group Japan $147,86974. Nuveen Investments U.S. $220,096 99. PGGM Netherlands $147,61375. Charles Schwab Investment U.S. $214,842 100. Commonwealth Bank Group Australia $144,375
towerswatson.com© 2012 Towers Watson. All rights reserved. Proprietary and Confidential. For Towers Watson and Towers Watson client use only.
25
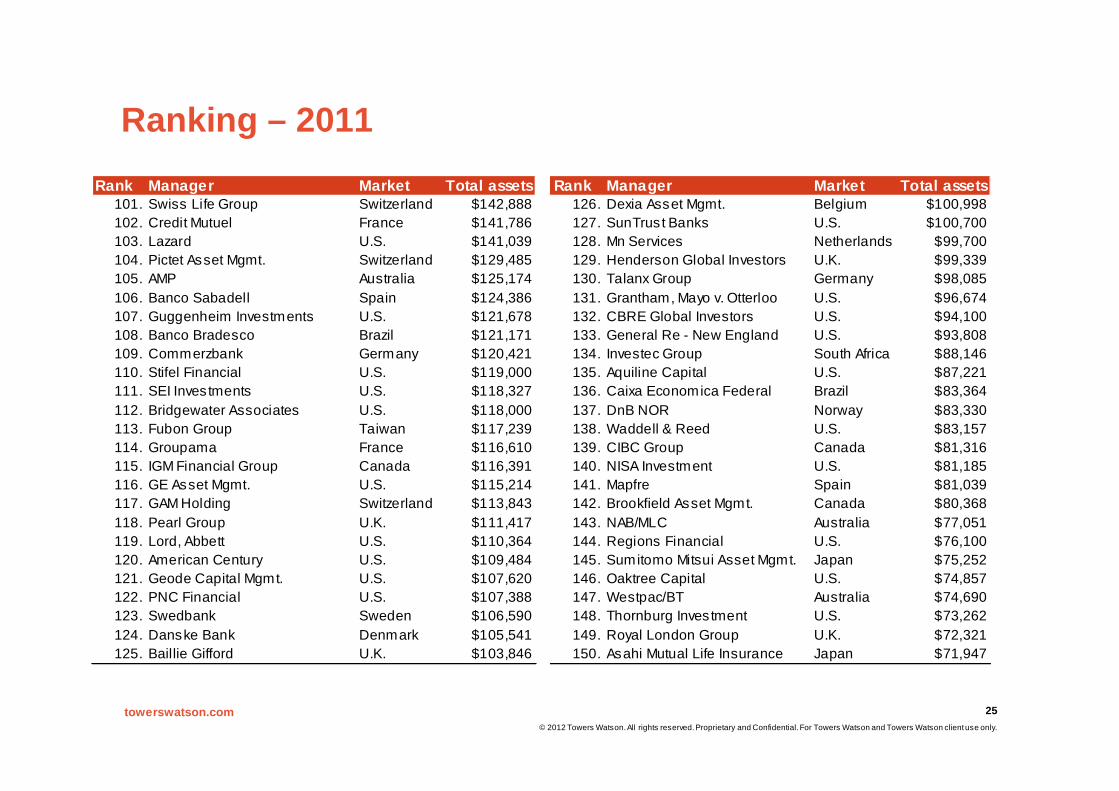
Ranking – 2011Rank Manager Market Total assets Rank Manager Market Total assets
101. Swiss Life Group Switzerland $142,888 126. Dexia Asset Mgmt. Belgium $100,998102. Credit Mutuel France $141,786 127. SunTrust Banks U.S. $100,700103. Lazard U.S. $141,039 128. Mn Services Netherlands $99,700104. Pictet Asset Mgmt. Switzerland $129,485 129. Henderson Global Investors U.K. $99,339105. AMP Australia $125,174 130. Talanx Group Germany $98,085106. Banco Sabadell Spain $124,386 131. Grantham, Mayo v. Otterloo U.S. $96,674107. Guggenheim Investments U.S. $121,678 132. CBRE Global Investors U.S. $94,100108. Banco Bradesco Brazil $121,171 133. General Re - New England U.S. $93,808109. Commerzbank Germany $120,421 134. Investec Group South Africa $88,146110. Stifel Financial U.S. $119,000 135. Aquiline Capital U.S. $87,221111. SEI Investments U.S. $118,327 136. Caixa Economica Federal Brazil $83,364112. Bridgewater Associates U.S. $118,000 137. DnB NOR Norway $83,330113. Fubon Group Taiwan $117,239 138. Waddell & Reed U.S. $83,157114. Groupama France $116,610 139. CIBC Group Canada $81,316115. IGM Financial Group Canada $116,391 140. NISA Investment U.S. $81,185116. GE Asset Mgmt. U.S. $115,214 141. Mapfre Spain $81,039117. GAM Holding Switzerland $113,843 142. Brookfield Asset Mgmt. Canada $80,368118. Pearl Group U.K. $111,417 143. NAB/MLC Australia $77,051119. Lord, Abbett U.S. $110,364 144. Regions Financial U.S. $76,100120. American Century U.S. $109,484 145. Sumitomo Mitsui Asset Mgmt. Japan $75,252121. Geode Capital Mgmt. U.S. $107,620 146. Oaktree Capital U.S. $74,857122. PNC Financial U.S. $107,388 147. Westpac/BT Australia $74,690123. Swedbank Sweden $106,590 148. Thornburg Investment U.S. $73,262124. Danske Bank Denmark $105,541 149. Royal London Group U.K. $72,321125. Baillie Gifford U.K. $103,846 150. Asahi Mutual Life Insurance Japan $71,947
towerswatson.com© 2012 Towers Watson. All rights reserved. Proprietary and Confidential. For Towers Watson and Towers Watson client use only.
26
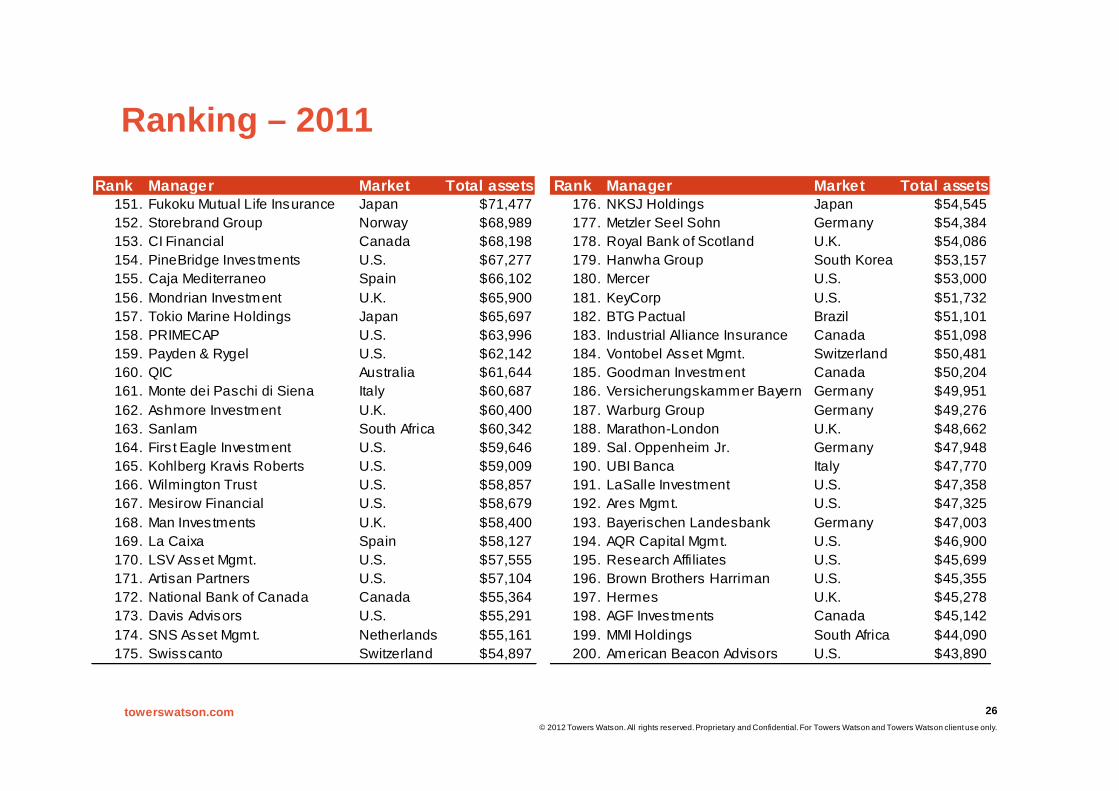
Ranking – 2011Rank Manager Market Total assets Rank Manager Market Total assets
151. Fukoku Mutual Life Insurance Japan $71,477 176. NKSJ Holdings Japan $54,545152. Storebrand Group Norway $68,989 177. Metzler Seel Sohn Germany $54,384153. CI Financial Canada $68,198 178. Royal Bank of Scotland U.K. $54,086154. PineBridge Investments U.S. $67,277 179. Hanwha Group South Korea $53,157155. Caja Mediterraneo Spain $66,102 180. Mercer U.S. $53,000156. Mondrian Investment U.K. $65,900 181. KeyCorp U.S. $51,732157. Tokio Marine Holdings Japan $65,697 182. BTG Pactual Brazil $51,101158. PRIMECAP U.S. $63,996 183. Industrial Alliance Insurance Canada $51,098159. Payden & Rygel U.S. $62,142 184. Vontobel Asset Mgmt. Switzerland $50,481160. QIC Australia $61,644 185. Goodman Investment Canada $50,204161. Monte dei Paschi di Siena Italy $60,687 186. Versicherungskammer Bayern Germany $49,951162. Ashmore Investment U.K. $60,400 187. Warburg Group Germany $49,276163. Sanlam South Africa $60,342 188. Marathon-London U.K. $48,662164. Firs t Eagle Investment U.S. $59,646 189. Sal. Oppenheim Jr. Germany $47,948165. Kohlberg Kravis Roberts U.S. $59,009 190. UBI Banca Italy $47,770166. Wilmington Trust U.S. $58,857 191. LaSalle Investment U.S. $47,358167. Mesirow Financial U.S. $58,679 192. Ares Mgmt. U.S. $47,325168. Man Investments U.K. $58,400 193. Bayerischen Landesbank Germany $47,003169. La Caixa Spain $58,127 194. AQR Capital Mgmt. U.S. $46,900170. LSV Asset Mgmt. U.S. $57,555 195. Research Affiliates U.S. $45,699171. Artisan Partners U.S. $57,104 196. Brown Brothers Harriman U.S. $45,355172. National Bank of Canada Canada $55,364 197. Hermes U.K. $45,278173. Davis Advisors U.S. $55,291 198. AGF Investments Canada $45,142174. SNS Asset Mgmt. Netherlands $55,161 199. MMI Holdings South Africa $44,090175. Swisscanto Switzerland $54,897 200. American Beacon Advisors U.S. $43,890
towerswatson.com© 2012 Towers Watson. All rights reserved. Proprietary and Confidential. For Towers Watson and Towers Watson client use only.
27
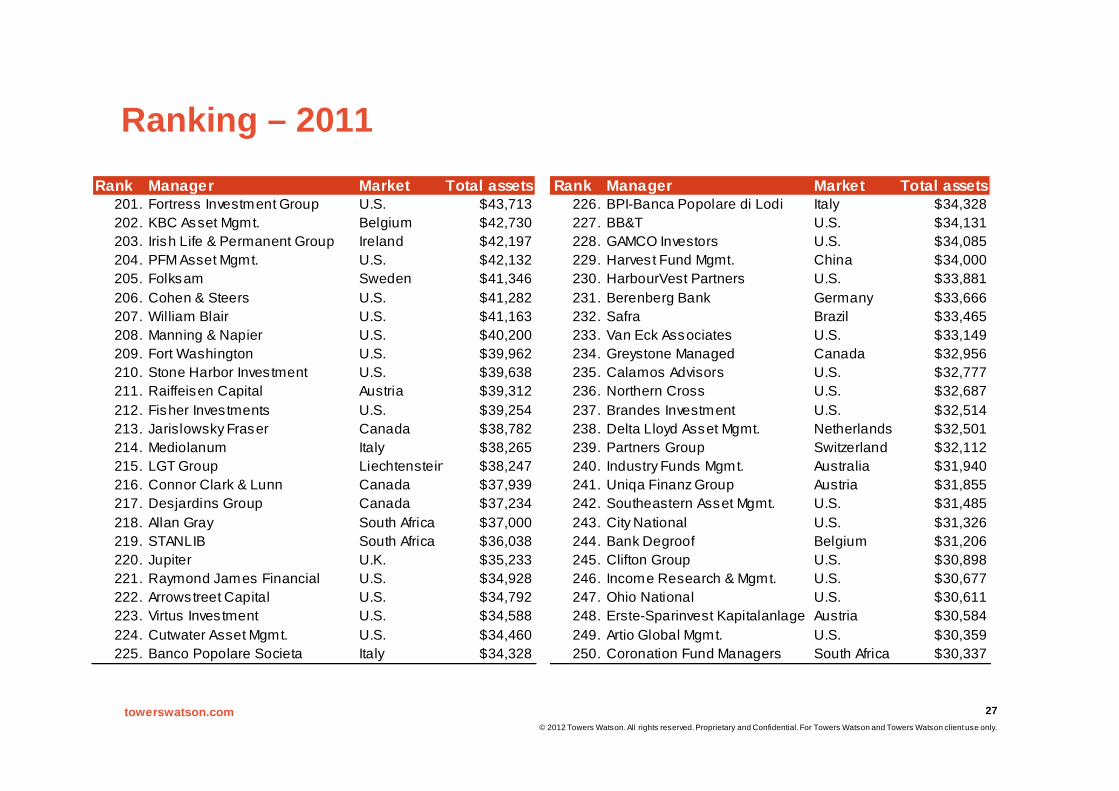
Ranking – 2011Rank Manager Market Total assets Rank Manager Market Total assets
201. Fortress Investment Group U.S. $43,713 226. BPI-Banca Popolare di Lodi Italy $34,328202. KBC Asset Mgmt. Belgium $42,730 227. BB&T U.S. $34,131203. Irish Life & Permanent Group Ireland $42,197 228. GAMCO Investors U.S. $34,085204. PFM Asset Mgmt. U.S. $42,132 229. Harvest Fund Mgmt. China $34,000205. Folksam Sweden $41,346 230. HarbourVest Partners U.S. $33,881206. Cohen & Steers U.S. $41,282 231. Berenberg Bank Germany $33,666207. William Blair U.S. $41,163 232. Safra Brazil $33,465208. Manning & Napier U.S. $40,200 233. Van Eck Associates U.S. $33,149209. Fort Washington U.S. $39,962 234. Greystone Managed Canada $32,956210. Stone Harbor Investment U.S. $39,638 235. Calamos Advisors U.S. $32,777211. Raiffeisen Capital Austria $39,312 236. Northern Cross U.S. $32,687212. Fisher Investments U.S. $39,254 237. Brandes Investment U.S. $32,514213. Jarislowsky Fraser Canada $38,782 238. Delta Lloyd Asset Mgmt. Netherlands $32,501214. Mediolanum Italy $38,265 239. Partners Group Switzerland $32,112215. LGT Group Liechtenstein $38,247 240. Industry Funds Mgmt. Australia $31,940216. Connor Clark & Lunn Canada $37,939 241. Uniqa Finanz Group Austria $31,855217. Desjardins Group Canada $37,234 242. Southeastern Asset Mgmt. U.S. $31,485218. Allan Gray South Africa $37,000 243. City National U.S. $31,326219. STANLIB South Africa $36,038 244. Bank Degroof Belgium $31,206220. Jupiter U.K. $35,233 245. Clifton Group U.S. $30,898221. Raymond James Financial U.S. $34,928 246. Income Research & Mgmt. U.S. $30,677222. Arrowstreet Capital U.S. $34,792 247. Ohio National U.S. $30,611223. Virtus Investment U.S. $34,588 248. Erste-Sparinvest Kapitalanlage Austria $30,584224. Cutwater Asset Mgmt. U.S. $34,460 249. Artio Global Mgmt. U.S. $30,359225. Banco Popolare Societa Italy $34,328 250. Coronation Fund Managers South Africa $30,337
towerswatson.com© 2012 Towers Watson. All rights reserved. Proprietary and Confidential. For Towers Watson and Towers Watson client use only.
28
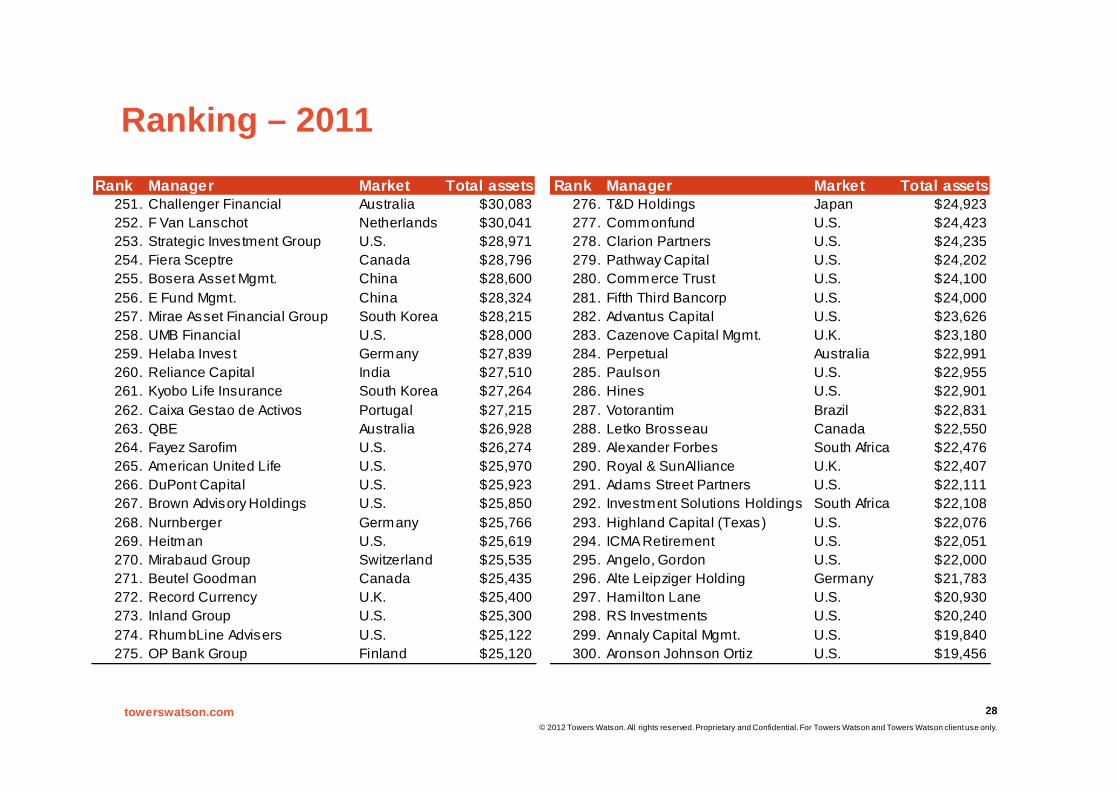
Ranking – 2011Rank Manager Market Total assets Rank Manager Market Total assets
251. Challenger Financial Australia $30,083 276. T&D Holdings Japan $24,923252. F Van Lanschot Netherlands $30,041 277. Commonfund U.S. $24,423253. Strategic Investment Group U.S. $28,971 278. Clarion Partners U.S. $24,235254. Fiera Sceptre Canada $28,796 279. Pathway Capital U.S. $24,202255. Bosera Asset Mgmt. China $28,600 280. Commerce Trust U.S. $24,100256. E Fund Mgmt. China $28,324 281. Fifth Third Bancorp U.S. $24,000257. Mirae Asset Financial Group South Korea $28,215 282. Advantus Capital U.S. $23,626258. UMB Financial U.S. $28,000 283. Cazenove Capital Mgmt. U.K. $23,180259. Helaba Invest Germany $27,839 284. Perpetual Australia $22,991260. Reliance Capital India $27,510 285. Paulson U.S. $22,955261. Kyobo Life Insurance South Korea $27,264 286. Hines U.S. $22,901262. Caixa Gestao de Activos Portugal $27,215 287. Votorantim Brazil $22,831263. QBE Australia $26,928 288. Letko Brosseau Canada $22,550264. Fayez Sarofim U.S. $26,274 289. Alexander Forbes South Africa $22,476265. American United Life U.S. $25,970 290. Royal & SunAlliance U.K. $22,407266. DuPont Capital U.S. $25,923 291. Adams Street Partners U.S. $22,111267. Brown Advisory Holdings U.S. $25,850 292. Investment Solutions Holdings South Africa $22,108268. Nurnberger Germany $25,766 293. Highland Capital (Texas) U.S. $22,076269. Heitman U.S. $25,619 294. ICMA Retirement U.S. $22,051270. Mirabaud Group Switzerland $25,535 295. Angelo, Gordon U.S. $22,000271. Beutel Goodman Canada $25,435 296. Alte Leipziger Holding Germany $21,783272. Record Currency U.K. $25,400 297. Hamilton Lane U.S. $20,930273. Inland Group U.S. $25,300 298. RS Investments U.S. $20,240274. RhumbLine Advisers U.S. $25,122 299. Annaly Capital Mgmt. U.S. $19,840275. OP Bank Group Finland $25,120 300. Aronson Johnson Ortiz U.S. $19,456
towerswatson.com© 2012 Towers Watson. All rights reserved. Proprietary and Confidential. For Towers Watson and Towers Watson client use only.
29
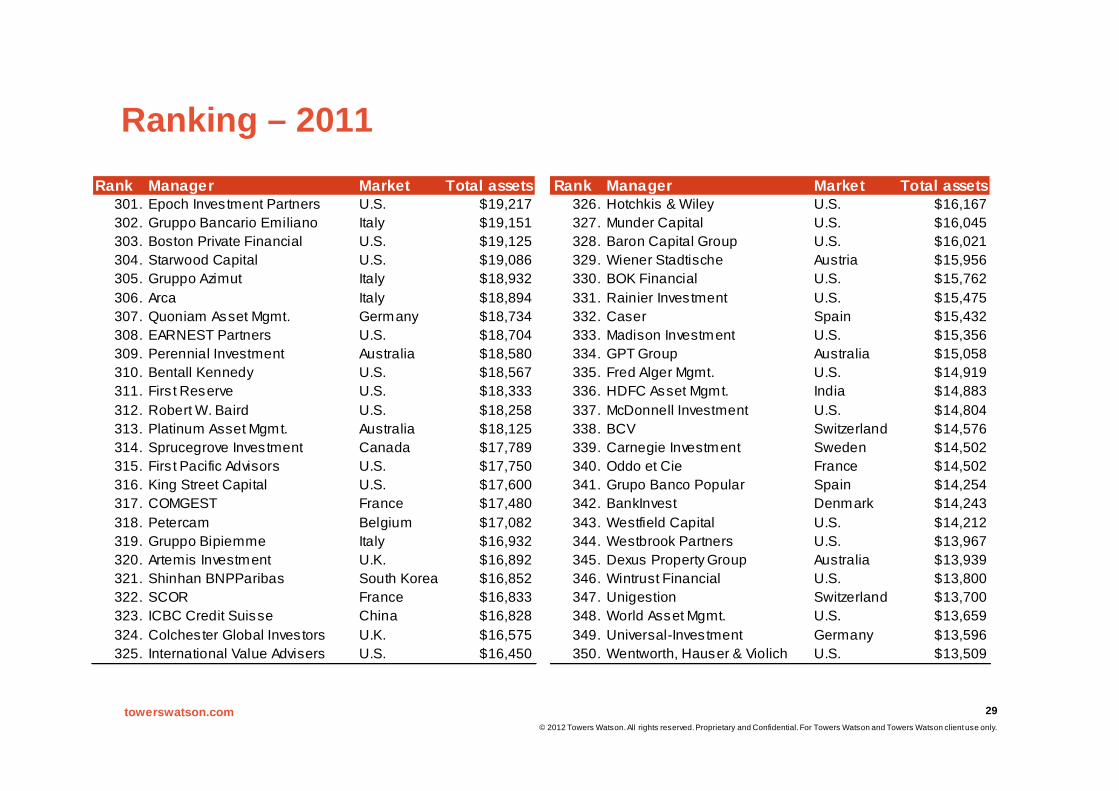
Ranking – 2011Rank Manager Market Total assets Rank Manager Market Total assets
301. Epoch Investment Partners U.S. $19,217 326. Hotchkis & Wiley U.S. $16,167302. Gruppo Bancario Emiliano Italy $19,151 327. Munder Capital U.S. $16,045303. Boston Private Financial U.S. $19,125 328. Baron Capital Group U.S. $16,021304. Starwood Capital U.S. $19,086 329. Wiener Stadtische Austria $15,956305. Gruppo Azimut Italy $18,932 330. BOK Financial U.S. $15,762306. Arca Italy $18,894 331. Rainier Investment U.S. $15,475307. Quoniam Asset Mgmt. Germany $18,734 332. Caser Spain $15,432308. EARNEST Partners U.S. $18,704 333. Madison Investment U.S. $15,356309. Perennial Investment Australia $18,580 334. GPT Group Australia $15,058310. Bentall Kennedy U.S. $18,567 335. Fred Alger Mgmt. U.S. $14,919311. Firs t Reserve U.S. $18,333 336. HDFC Asset Mgmt. India $14,883312. Robert W. Baird U.S. $18,258 337. McDonnell Investment U.S. $14,804313. Platinum Asset Mgmt. Australia $18,125 338. BCV Switzerland $14,576314. Sprucegrove Investment Canada $17,789 339. Carnegie Investment Sweden $14,502315. Firs t Pacific Advisors U.S. $17,750 340. Oddo et Cie France $14,502316. King Street Capital U.S. $17,600 341. Grupo Banco Popular Spain $14,254317. COMGEST France $17,480 342. BankInvest Denmark $14,243318. Petercam Belgium $17,082 343. Westfield Capital U.S. $14,212319. Gruppo Bipiemme Italy $16,932 344. Westbrook Partners U.S. $13,967320. Artemis Investment U.K. $16,892 345. Dexus Property Group Australia $13,939321. Shinhan BNPParibas South Korea $16,852 346. Wintrust Financial U.S. $13,800322. SCOR France $16,833 347. Unigestion Switzerland $13,700323. ICBC Credit Suisse China $16,828 348. World Asset Mgmt. U.S. $13,659324. Colchester Global Investors U.K. $16,575 349. Universal-Investment Germany $13,596325. International Value Advisers U.S. $16,450 350. Wentworth, Hauser & Violich U.S. $13,509
towerswatson.com© 2012 Towers Watson. All rights reserved. Proprietary and Confidential. For Towers Watson and Towers Watson client use only.
30
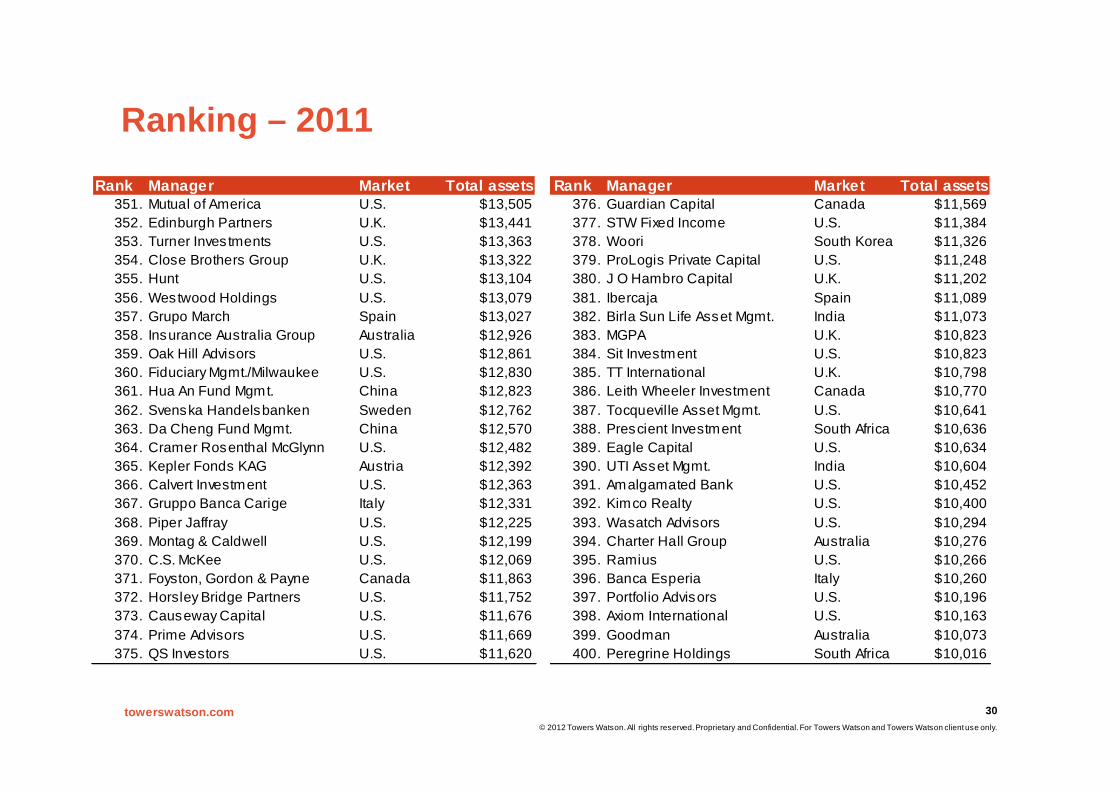
Ranking – 2011Rank Manager Market Total assets Rank Manager Market Total assets
351. Mutual of America U.S. $13,505 376. Guardian Capital Canada $11,569352. Edinburgh Partners U.K. $13,441 377. STW Fixed Income U.S. $11,384353. Turner Investments U.S. $13,363 378. Woori South Korea $11,326354. Close Brothers Group U.K. $13,322 379. ProLogis Private Capital U.S. $11,248355. Hunt U.S. $13,104 380. J O Hambro Capital U.K. $11,202356. Westwood Holdings U.S. $13,079 381. Ibercaja Spain $11,089357. Grupo March Spain $13,027 382. Birla Sun Life Asset Mgmt. India $11,073358. Insurance Australia Group Australia $12,926 383. MGPA U.K. $10,823359. Oak Hill Advisors U.S. $12,861 384. Sit Investment U.S. $10,823360. Fiduciary Mgmt./Milwaukee U.S. $12,830 385. TT International U.K. $10,798361. Hua An Fund Mgmt. China $12,823 386. Leith Wheeler Investment Canada $10,770362. Svenska Handelsbanken Sweden $12,762 387. Tocqueville Asset Mgmt. U.S. $10,641363. Da Cheng Fund Mgmt. China $12,570 388. Prescient Investment South Africa $10,636364. Cramer Rosenthal McGlynn U.S. $12,482 389. Eagle Capital U.S. $10,634365. Kepler Fonds KAG Austria $12,392 390. UTI Asset Mgmt. India $10,604366. Calvert Investment U.S. $12,363 391. Amalgamated Bank U.S. $10,452367. Gruppo Banca Carige Italy $12,331 392. Kimco Realty U.S. $10,400368. Piper Jaffray U.S. $12,225 393. Wasatch Advisors U.S. $10,294369. Montag & Caldwell U.S. $12,199 394. Charter Hall Group Australia $10,276370. C.S. McKee U.S. $12,069 395. Ramius U.S. $10,266371. Foyston, Gordon & Payne Canada $11,863 396. Banca Esperia Italy $10,260372. Horsley Bridge Partners U.S. $11,752 397. Portfolio Advisors U.S. $10,196373. Causeway Capital U.S. $11,676 398. Axiom International U.S. $10,163374. Prime Advisors U.S. $11,669 399. Goodman Australia $10,073375. QS Investors U.S. $11,620 400. Peregrine Holdings South Africa $10,016
towerswatson.com© 2012 Towers Watson. All rights reserved. Proprietary and Confidential. For Towers Watson and Towers Watson client use only.
31
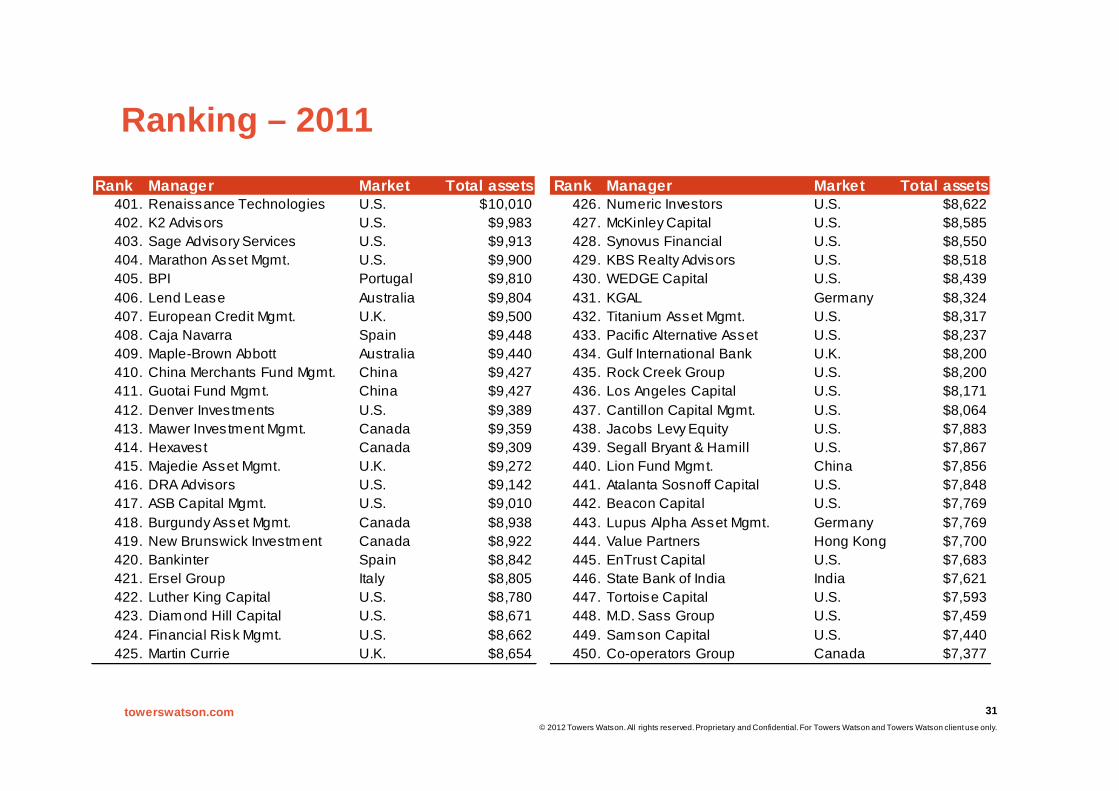
Ranking – 2011Rank Manager Market Total assets Rank Manager Market Total assets
401. Renaissance Technologies U.S. $10,010 426. Numeric Investors U.S. $8,622402. K2 Advisors U.S. $9,983 427. McKinley Capital U.S. $8,585403. Sage Advisory Services U.S. $9,913 428. Synovus Financial U.S. $8,550404. Marathon Asset Mgmt. U.S. $9,900 429. KBS Realty Advisors U.S. $8,518405. BPI Portugal $9,810 430. WEDGE Capital U.S. $8,439406. Lend Lease Australia $9,804 431. KGAL Germany $8,324407. European Credit Mgmt. U.K. $9,500 432. Titanium Asset Mgmt. U.S. $8,317408. Caja Navarra Spain $9,448 433. Pacific Alternative Asset U.S. $8,237409. Maple-Brown Abbott Australia $9,440 434. Gulf International Bank U.K. $8,200410. China Merchants Fund Mgmt. China $9,427 435. Rock Creek Group U.S. $8,200411. Guotai Fund Mgmt. China $9,427 436. Los Angeles Capital U.S. $8,171412. Denver Investments U.S. $9,389 437. Cantillon Capital Mgmt. U.S. $8,064413. Mawer Investment Mgmt. Canada $9,359 438. Jacobs Levy Equity U.S. $7,883414. Hexavest Canada $9,309 439. Segall Bryant & Hamill U.S. $7,867415. Majedie Asset Mgmt. U.K. $9,272 440. Lion Fund Mgmt. China $7,856416. DRA Advisors U.S. $9,142 441. Atalanta Sosnoff Capital U.S. $7,848417. ASB Capital Mgmt. U.S. $9,010 442. Beacon Capital U.S. $7,769418. Burgundy Asset Mgmt. Canada $8,938 443. Lupus Alpha Asset Mgmt. Germany $7,769419. New Brunswick Investment Canada $8,922 444. Value Partners Hong Kong $7,700420. Bankinter Spain $8,842 445. EnTrust Capital U.S. $7,683421. Ersel Group Italy $8,805 446. State Bank of India India $7,621422. Luther King Capital U.S. $8,780 447. Tortoise Capital U.S. $7,593423. Diamond Hill Capital U.S. $8,671 448. M.D. Sass Group U.S. $7,459424. Financial Risk Mgmt. U.S. $8,662 449. Samson Capital U.S. $7,440425. Martin Currie U.K. $8,654 450. Co-operators Group Canada $7,377
towerswatson.com© 2012 Towers Watson. All rights reserved. Proprietary and Confidential. For Towers Watson and Towers Watson client use only.
32
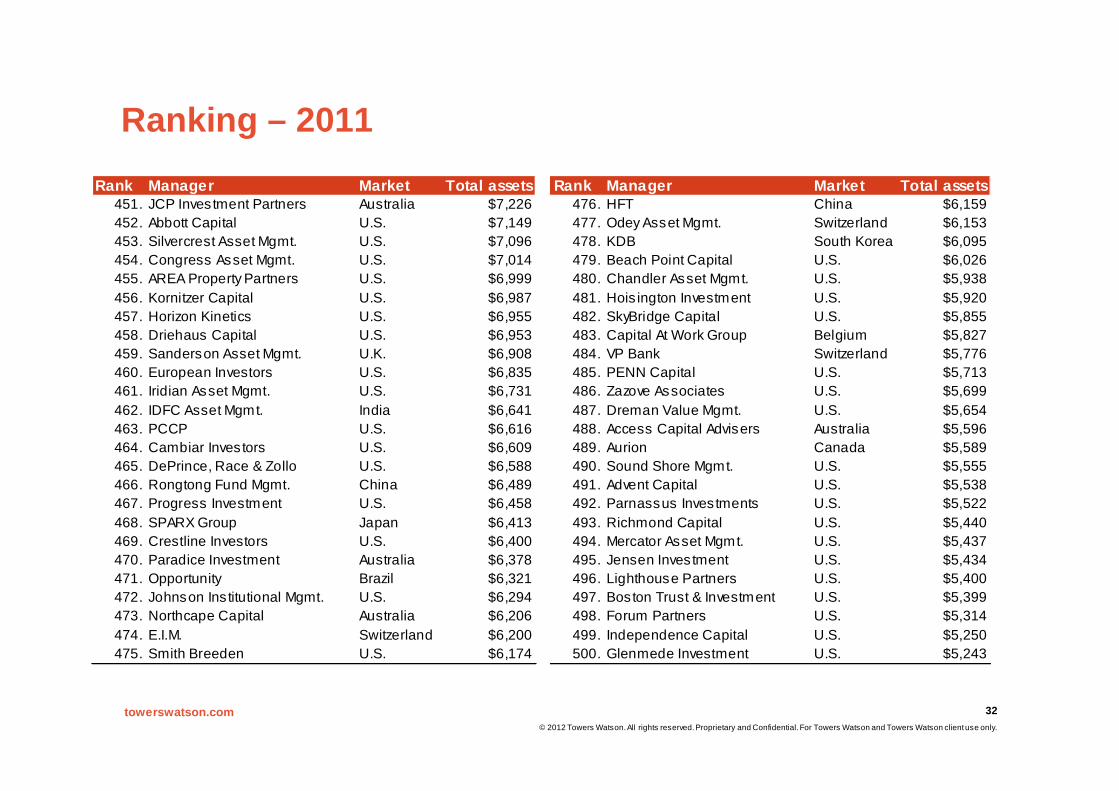
Ranking – 2011Rank Manager Market Total assets Rank Manager Market Total assets
451. JCP Investment Partners Australia $7,226 476. HFT China $6,159452. Abbott Capital U.S. $7,149 477. Odey Asset Mgmt. Switzerland $6,153453. Silvercrest Asset Mgmt. U.S. $7,096 478. KDB South Korea $6,095454. Congress Asset Mgmt. U.S. $7,014 479. Beach Point Capital U.S. $6,026455. AREA Property Partners U.S. $6,999 480. Chandler Asset Mgmt. U.S. $5,938456. Kornitzer Capital U.S. $6,987 481. Hois ington Investment U.S. $5,920457. Horizon Kinetics U.S. $6,955 482. SkyBridge Capital U.S. $5,855458. Driehaus Capital U.S. $6,953 483. Capital At Work Group Belgium $5,827459. Sanderson Asset Mgmt. U.K. $6,908 484. VP Bank Switzerland $5,776460. European Investors U.S. $6,835 485. PENN Capital U.S. $5,713461. Iridian Asset Mgmt. U.S. $6,731 486. Zazove Associates U.S. $5,699462. IDFC Asset Mgmt. India $6,641 487. Dreman Value Mgmt. U.S. $5,654463. PCCP U.S. $6,616 488. Access Capital Advisers Australia $5,596464. Cambiar Investors U.S. $6,609 489. Aurion Canada $5,589465. DePrince, Race & Zollo U.S. $6,588 490. Sound Shore Mgmt. U.S. $5,555466. Rongtong Fund Mgmt. China $6,489 491. Advent Capital U.S. $5,538467. Progress Investment U.S. $6,458 492. Parnassus Investments U.S. $5,522468. SPARX Group Japan $6,413 493. Richmond Capital U.S. $5,440469. Crestline Investors U.S. $6,400 494. Mercator Asset Mgmt. U.S. $5,437470. Paradice Investment Australia $6,378 495. Jensen Investment U.S. $5,434471. Opportunity Brazil $6,321 496. Lighthouse Partners U.S. $5,400472. Johnson Ins titutional Mgmt. U.S. $6,294 497. Boston Trust & Investment U.S. $5,399473. Northcape Capital Australia $6,206 498. Forum Partners U.S. $5,314474. E.I.M. Switzerland $6,200 499. Independence Capital U.S. $5,250475. Smith Breeden U.S. $6,174 500. Glenmede Investment U.S. $5,243