Embed Size (px)
Citation preview
THECB 7/2004
Closing the Gaps by 2015Closing the Gaps by 2015
Progress Report, July 2004Progress Report, July 2004
THECB 7/2004
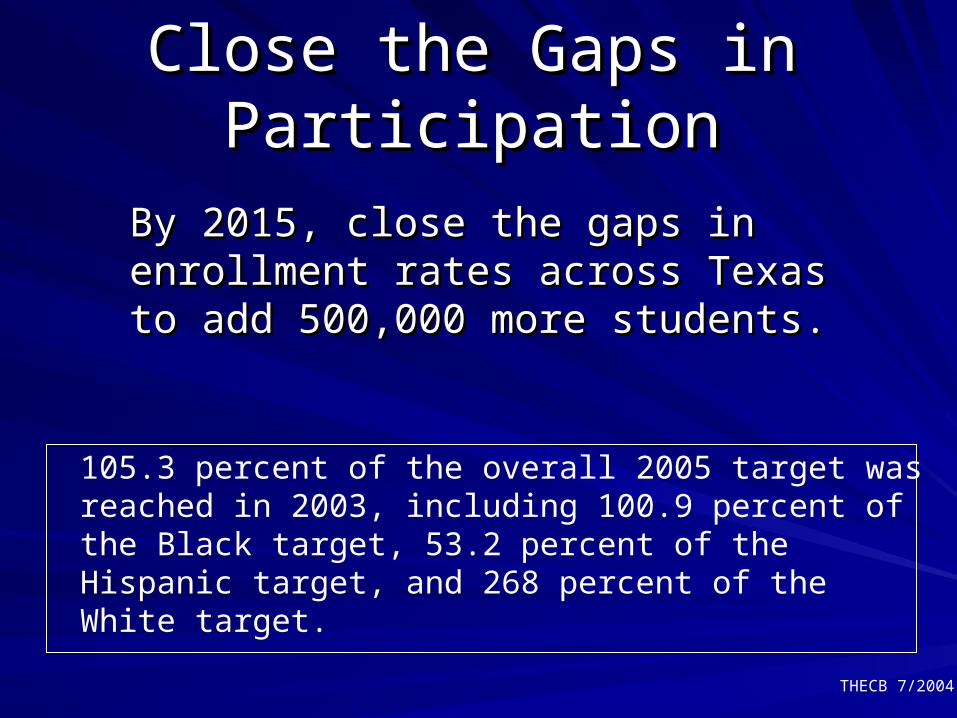
Close the Gaps in Close the Gaps in ParticipationParticipation
By 2015, close the gaps in By 2015, close the gaps in enrollment rates across Texas to enrollment rates across Texas to add 500,000 more students.add 500,000 more students.
105.3 percent of the overall 2005 target was reached in 2003, including 100.9 percent of the Black target, 53.2 percent of the Hispanic target, and 268 percent of theWhite target.

THECB 7/2004
Three-Year 157,420 Increase: Three-Year 157,420 Increase: Largest in Texas HistoryLargest in Texas History
0
100
200
300
400
500
2000 2005 2010 2015
Th
ou
san
ds Target Actual
157,420
THECB 7/2004
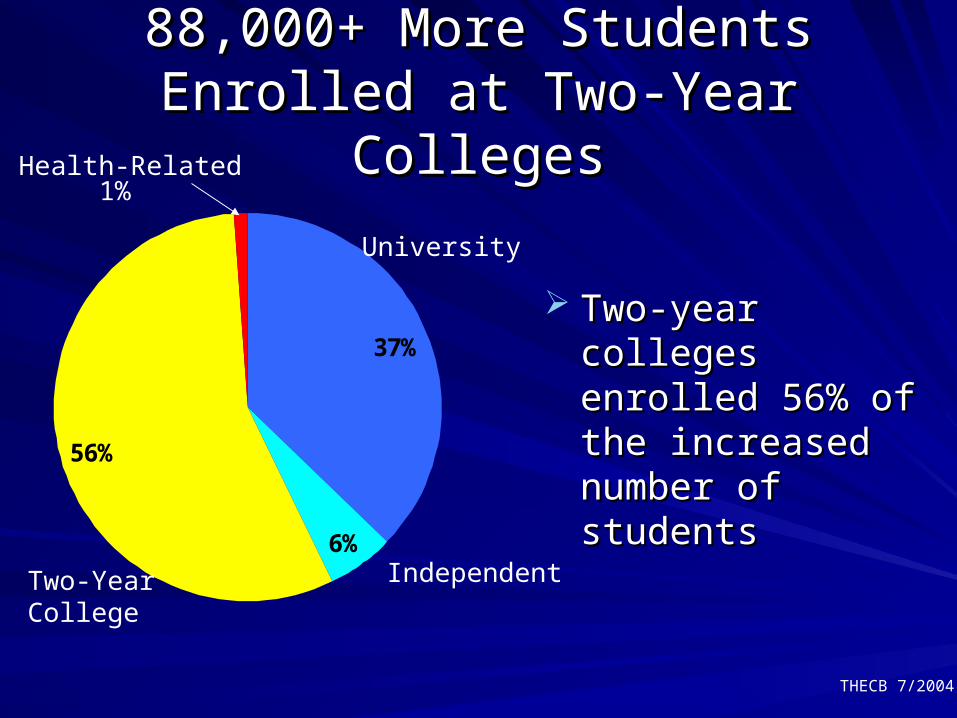
88,000+ More Students Enrolled at 88,000+ More Students Enrolled at Two-Year CollegesTwo-Year Colleges
37%
6%
56%
Two-year colleges Two-year colleges enrolled 56% of the enrolled 56% of the increased number of increased number of students students
Health-Related
University
IndependentTwo-YearCollege
1%

THECB 7/2004
2005 Hispanic Target Remains a 2005 Hispanic Target Remains a ChallengeChallenge
23,748
54,565
56,159
48,041
0
20,000
40,000
60,000
80,000
100,000
120,000
White Hispanic Black
2003 Progress To Reach 2005 Target
* Asians are not targeted in the plan.
THECB 7/2004
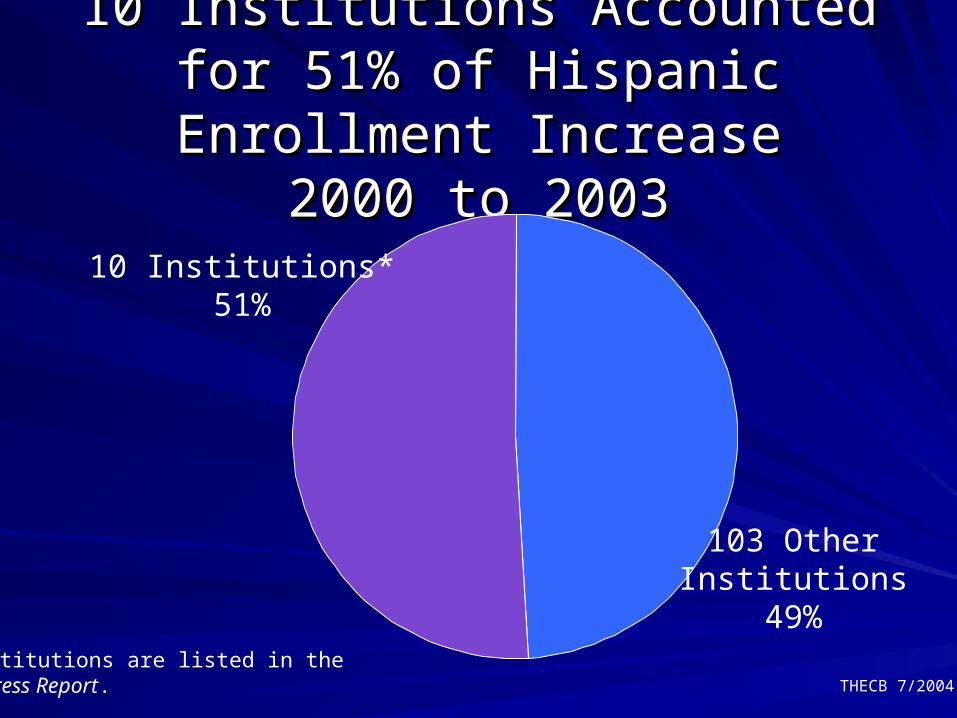
10 Institutions Accounted for 51% 10 Institutions Accounted for 51% of Hispanic Enrollment Increaseof Hispanic Enrollment Increase
2000 to 20032000 to 2003
10 Institutions*51%
103 OtherInstitutions
49%*Institutions are listed in the Progress Report.
THECB 7/2004
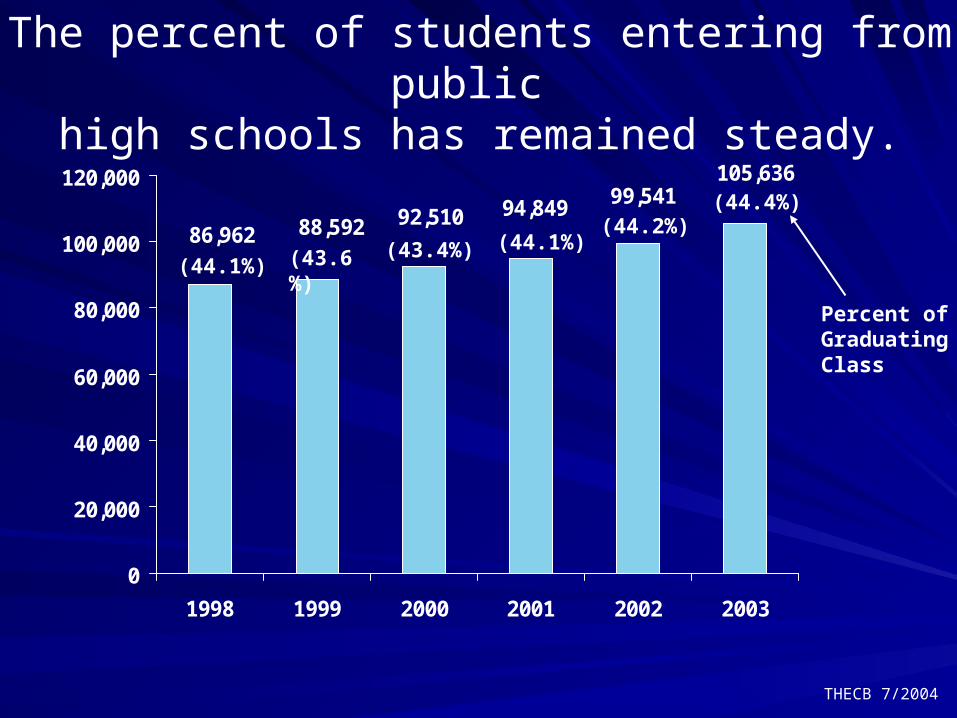
105,63699,54194,84992,51088,59286,962
0
20,000
40,000
60,000
80,000
100,000
120,000
1998 1999 2000 2001 2002 2003
The percent of students entering from public high schools has remained steady.
(44.1%) (43.6%) (43.4%) (44.1%)(44.2%)
Percent of GraduatingClass
(44.4%)
THECB 7/2004
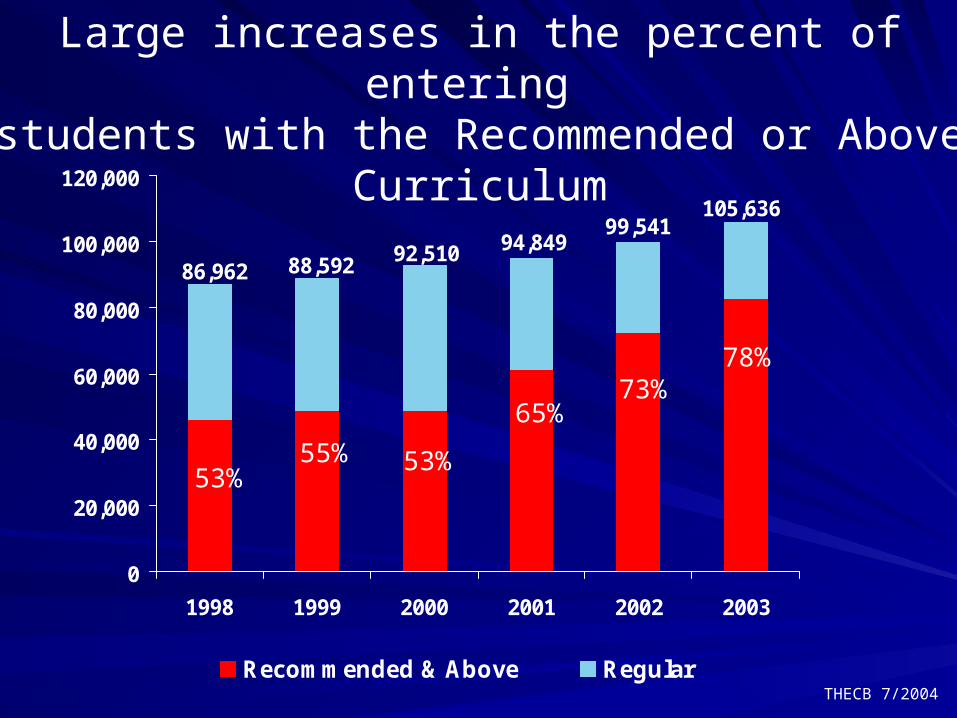
105,63699,541
94,84992,51088,59286,962
0
20,000
40,000
60,000
80,000
100,000
120,000
1998 1999 2000 2001 2002 2003
Recommended & Above Regular
Large increases in the percent of entering students with the Recommended or Above
Curriculum
55% 53%
65%73%
78%
53%
THECB 7/2004
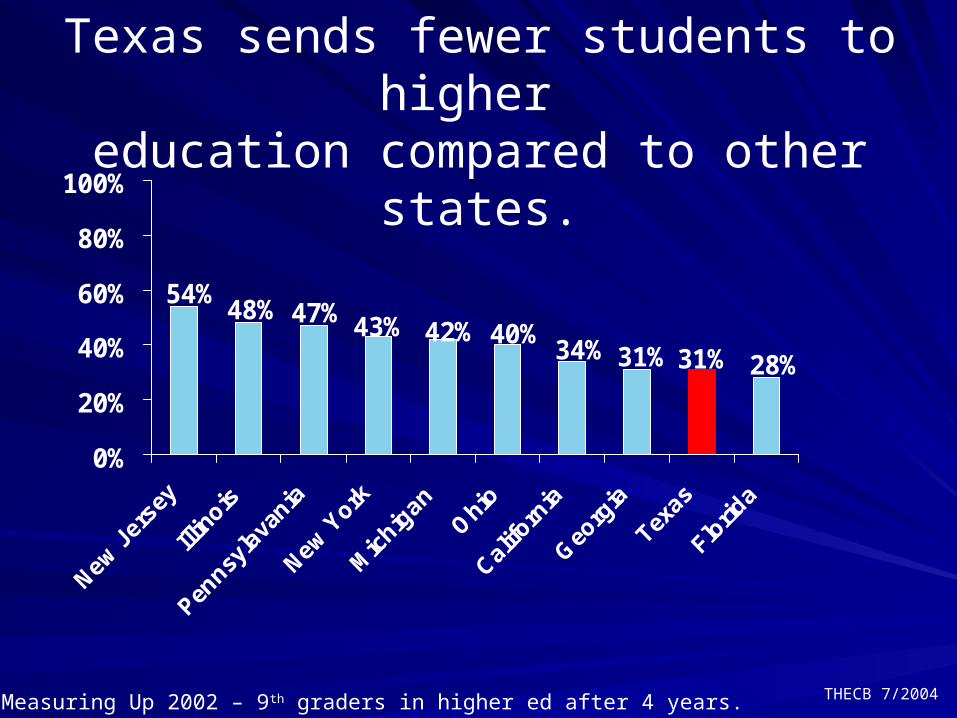
28%31%31%34%40%42%43%47%48%
54%
0%
20%
40%
60%
80%
100%
Texas sends fewer students to higher education compared to other states.
Source: Measuring Up 2002 – 9th graders in higher ed after 4 years.
THECB 7/2004
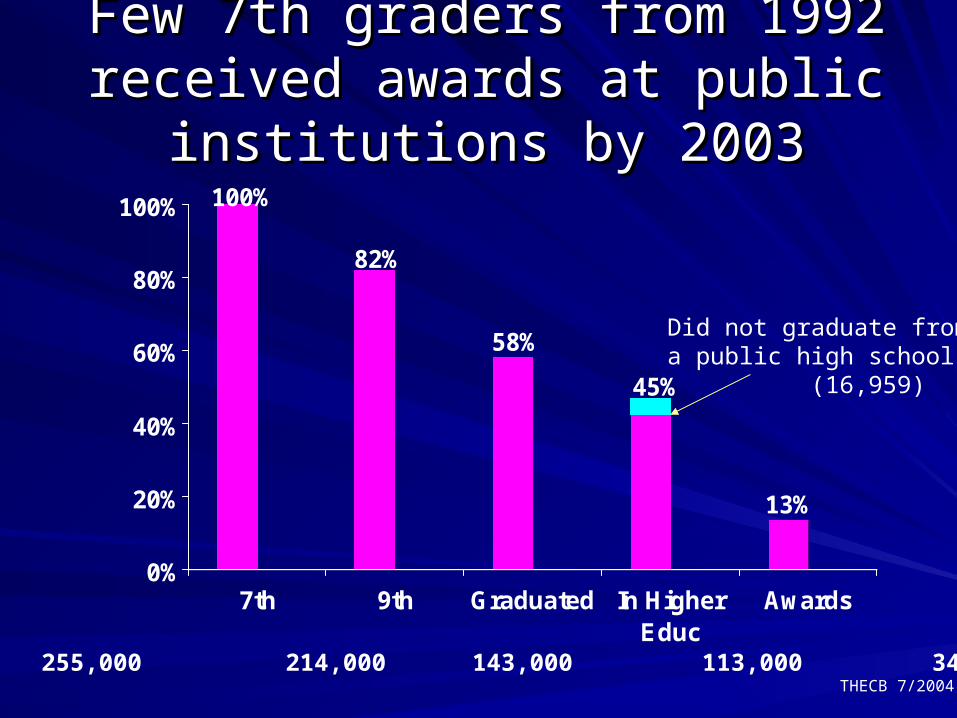
Few 7th graders from 1992 received Few 7th graders from 1992 received awards at public institutions by 2003awards at public institutions by 2003
100%
82%
58%
45%
13%
0%
20%
40%
60%
80%
100%
7th 9th Graduated In HigherEduc
Awards
255,000 214,000 143,000 113,000 34,000
Did not graduate froma public high school (16,959)
THECB 7/2004
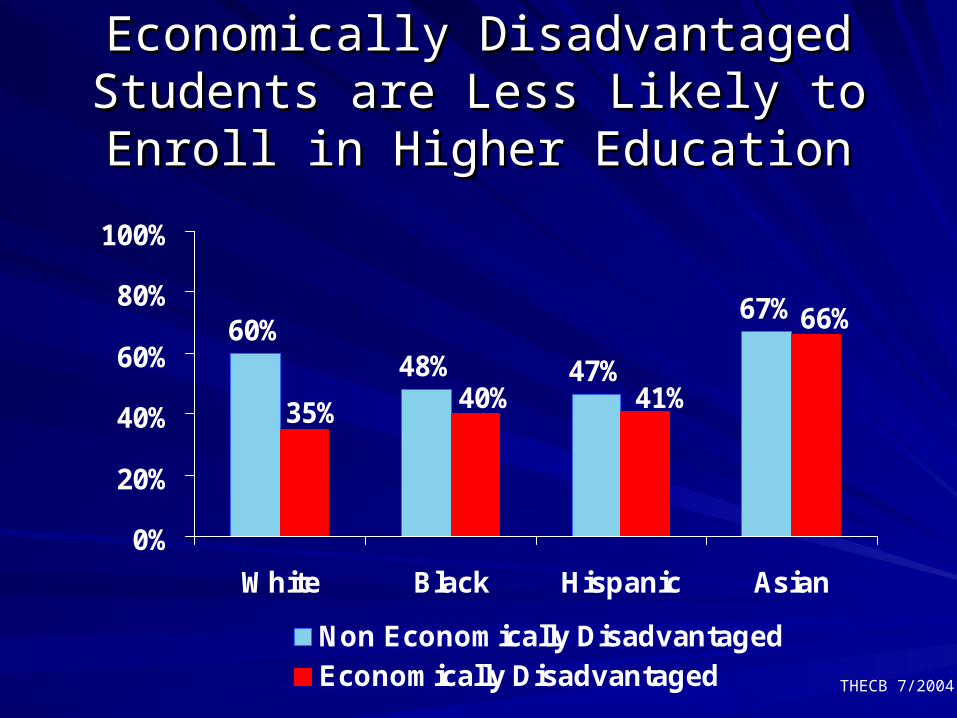
Economically Disadvantaged Students Economically Disadvantaged Students are Less Likely to Enroll in Higher are Less Likely to Enroll in Higher
EducationEducation
60%48% 47%
67%66%
41%40%35%
0%
20%
40%
60%
80%
100%
White Black Hispanic Asian
Non Economically DisadvantagedEconomically Disadvantaged
THECB 7/2004
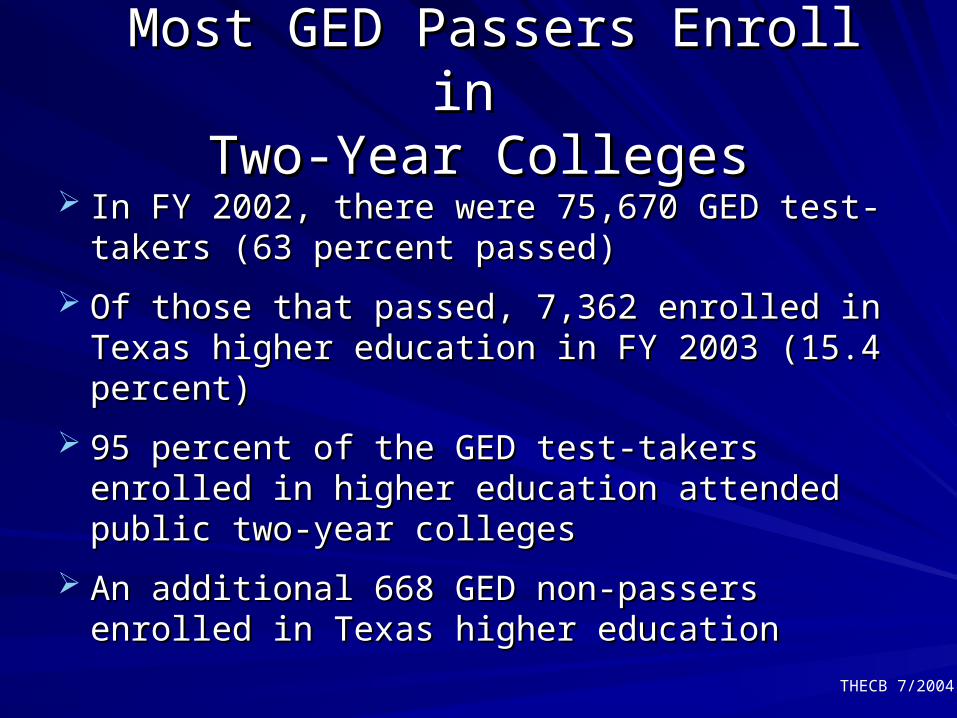
Most GED Passers Enroll in Most GED Passers Enroll in Two-Year CollegesTwo-Year Colleges
In FY 2002, there were 75,670 GED test-takers In FY 2002, there were 75,670 GED test-takers (63 percent passed)(63 percent passed)
Of those that passed, 7,362 enrolled in Texas Of those that passed, 7,362 enrolled in Texas higher education in FY 2003 (15.4 percent)higher education in FY 2003 (15.4 percent)
95 percent of the GED test-takers enrolled in 95 percent of the GED test-takers enrolled in higher education attended public two-year higher education attended public two-year collegescolleges
An additional 668 GED non-passers enrolled in An additional 668 GED non-passers enrolled in Texas higher educationTexas higher education
THECB 7/2004
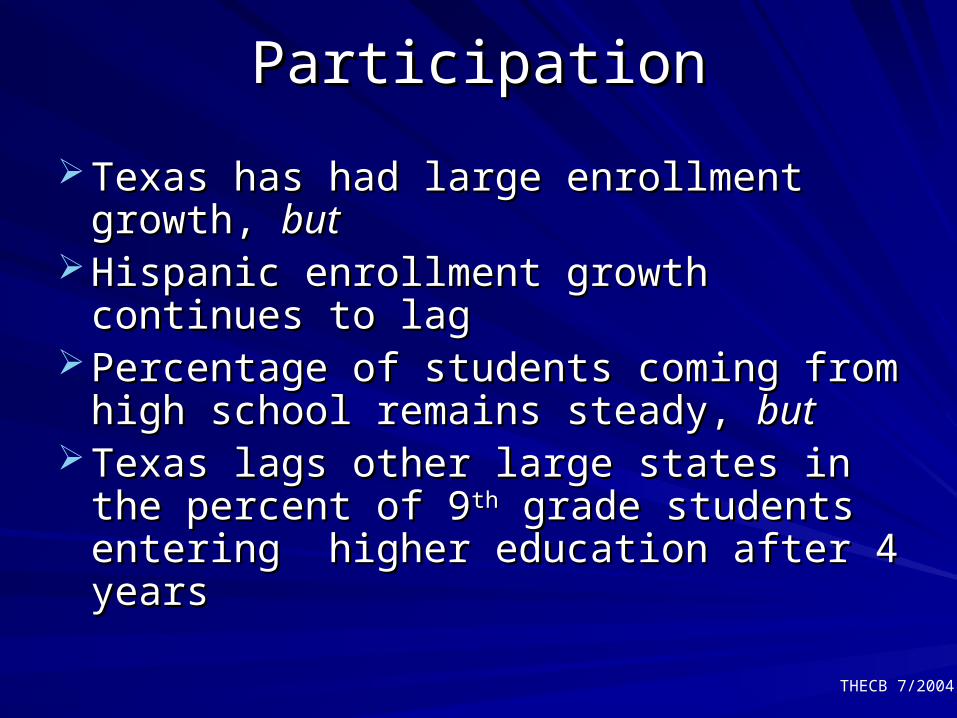
ParticipationParticipation
Texas has had large enrollment growth, Texas has had large enrollment growth, butbut
Hispanic enrollment growth continues to Hispanic enrollment growth continues to laglag
Percentage of students coming from high Percentage of students coming from high school remains steady, school remains steady, butbut
Texas lags other large states in the Texas lags other large states in the percent of 9percent of 9thth grade students entering grade students entering higher education after 4 yearshigher education after 4 years
THECB 7/2004
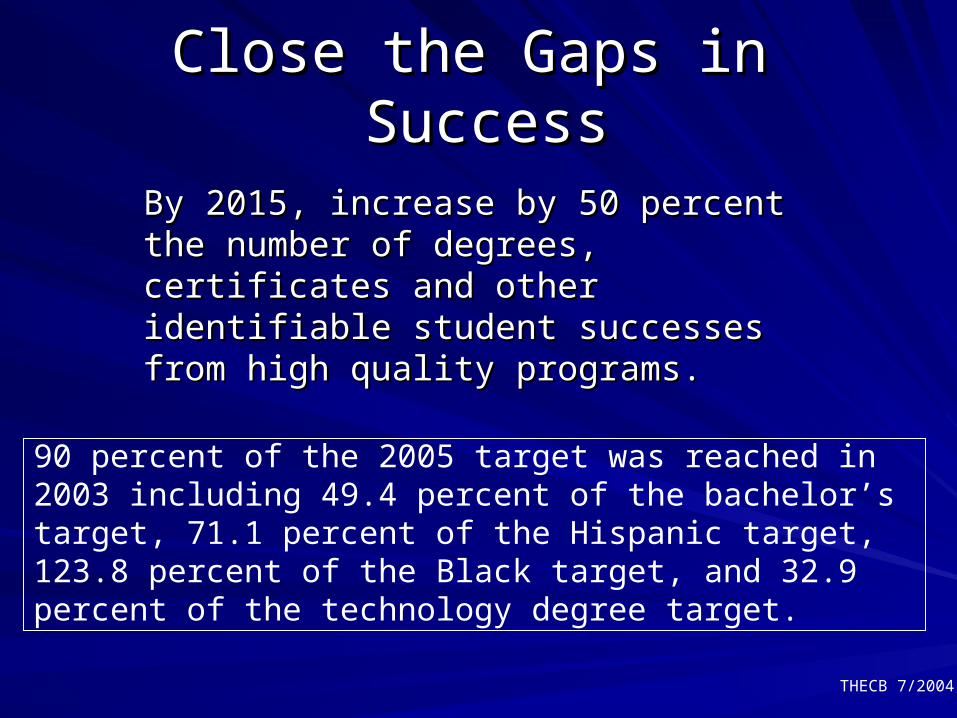
Close the Gaps in Close the Gaps in SuccessSuccess
By 2015, increase by 50 percent the By 2015, increase by 50 percent the number of degrees, certificates and number of degrees, certificates and other identifiable student successes other identifiable student successes from high quality programs.from high quality programs.
90 percent of the 2005 target was reached in 2003 including 49.4 percent of the bachelor’s target, 71.1 percent of the Hispanic target, 123.8 percent of the Black target, and 32.9 percent of the technology degree target.
THECB 7/2004
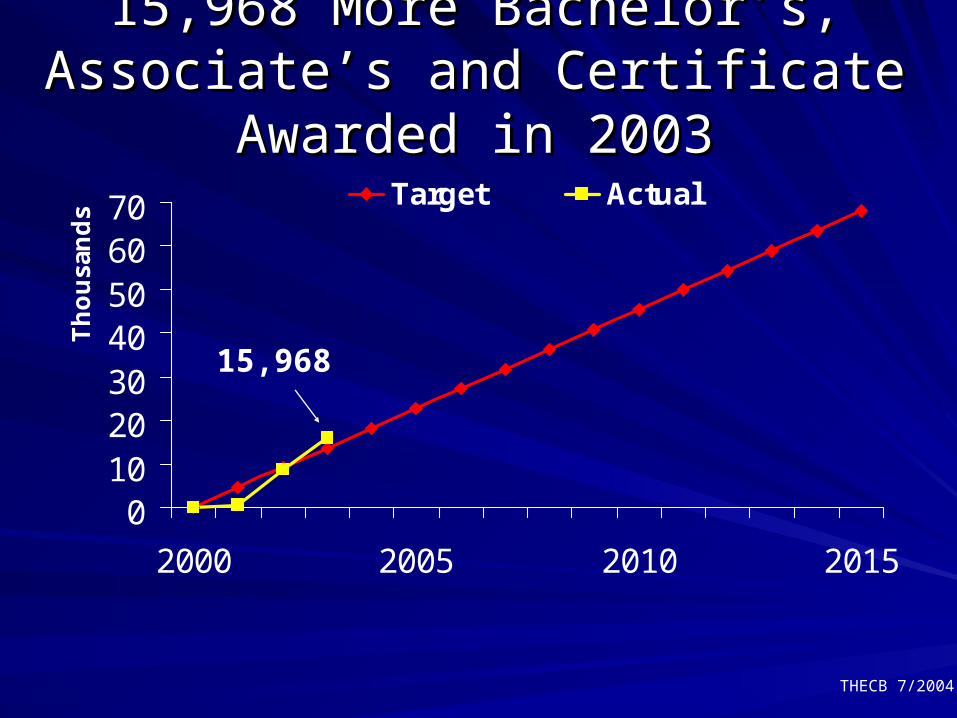
15,968 More Bachelor’s, Associate’s 15,968 More Bachelor’s, Associate’s and Certificate Awarded in 2003and Certificate Awarded in 2003
010203040506070
2000 2005 2010 2015
Th
ou
san
ds
Target Actual
15,968
THECB 7/2004
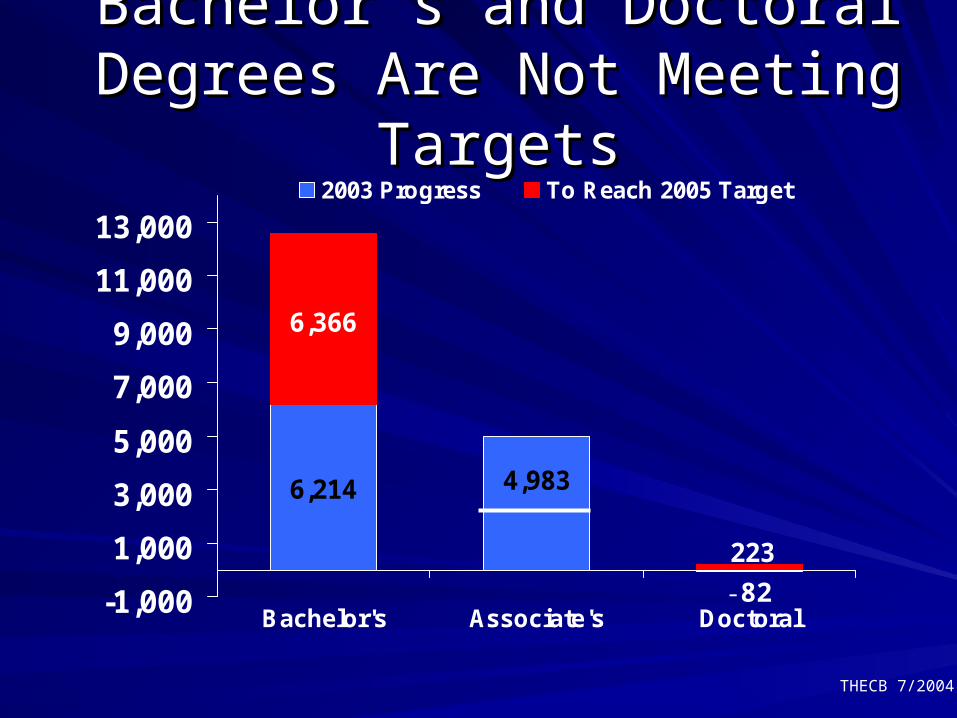
Bachelor’s and Doctoral Degrees Bachelor’s and Doctoral Degrees Are Not Meeting TargetsAre Not Meeting Targets
6,366
4,9836,214
223
-1,000
1,000
3,000
5,000
7,000
9,000
11,000
13,000
Bachelor's Associate's Doctoral
2003 Progress To Reach 2005 Target
-82
THECB 7/2004
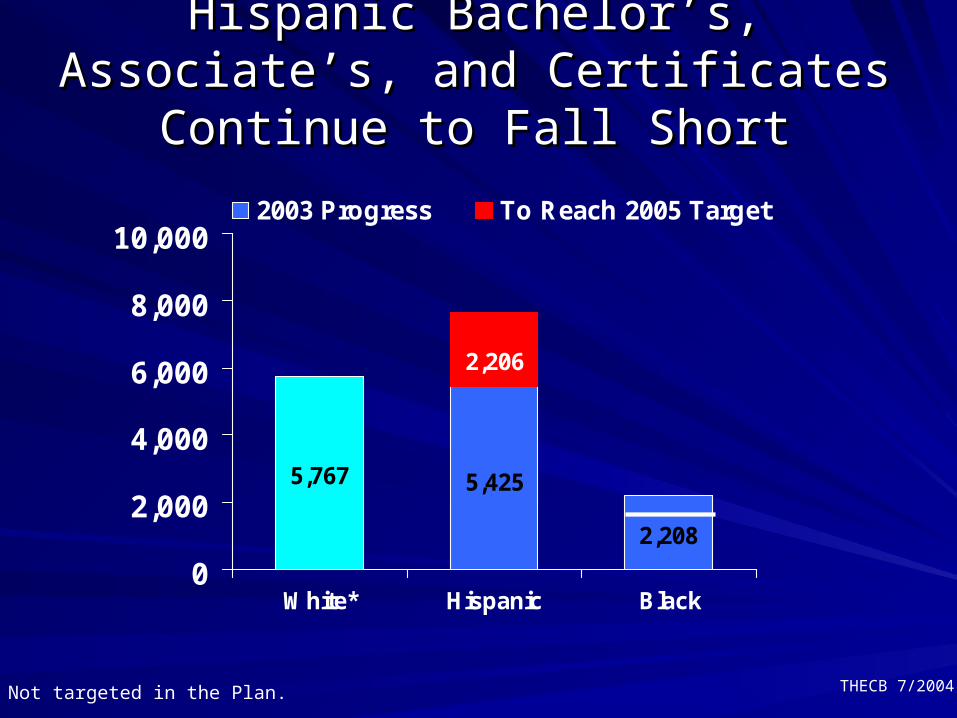
Hispanic Bachelor’s, Associate’s, and Hispanic Bachelor’s, Associate’s, and Certificates Continue to Fall ShortCertificates Continue to Fall Short
5,767 5,425
2,208
2,206
0
2,000
4,000
6,000
8,000
10,000
White* Hispanic Black
2003 Progress To Reach 2005 Target
* Not targeted in the Plan.
THECB 7/2004
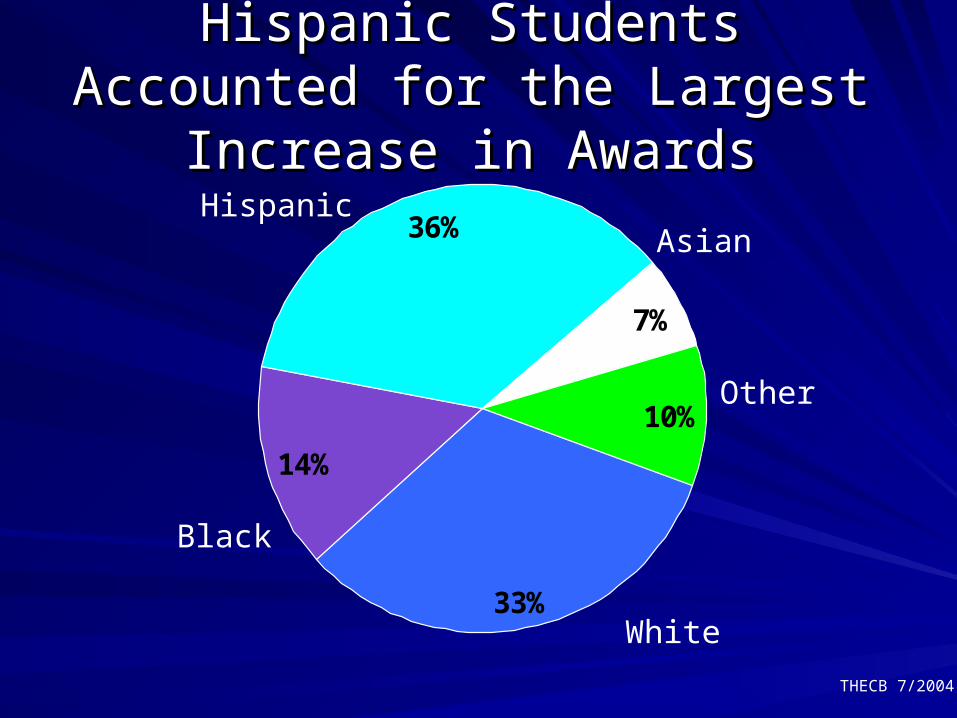
Hispanic Students Accounted for Hispanic Students Accounted for the Largest Increase in Awardsthe Largest Increase in Awards
33%
14%
36%
7%
10%
White
Black
HispanicAsian
Other
THECB 7/2004
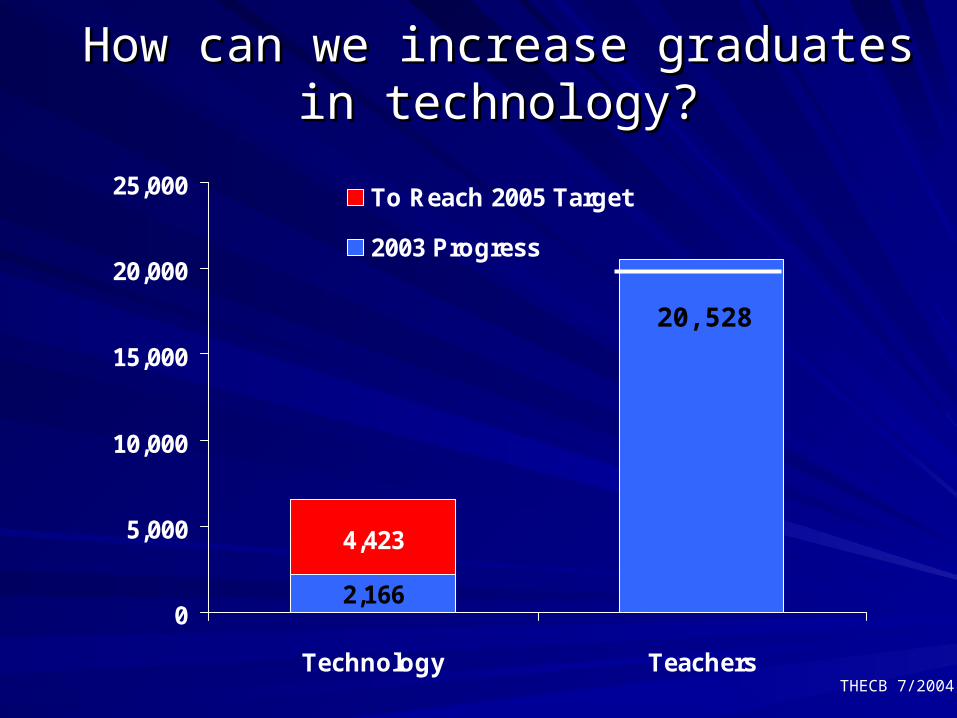
How can we increase graduates in How can we increase graduates in technology?technology?
4,423
2,1660
5,000
10,000
15,000
20,000
25,000
Technology Teachers
To Reach 2005 Target
2003 Progress
20,528

THECB 7/2004
Modest increases in Allied Health and Modest increases in Allied Health and Nursing may reflect recent efforts Nursing may reflect recent efforts
12,000
13,000
14,000
15,000
16,000
THECB 7/2004
Close the Gaps in Close the Gaps in ExcellenceExcellence
By 2015, substantially increase the By 2015, substantially increase the number of nationally recognized number of nationally recognized programs or services at colleges and programs or services at colleges and universities in Texas.universities in Texas.
100 percent of the institutions have chosen at least one program to raise to a nationally recognized level of excellence.
THECB 7/2004
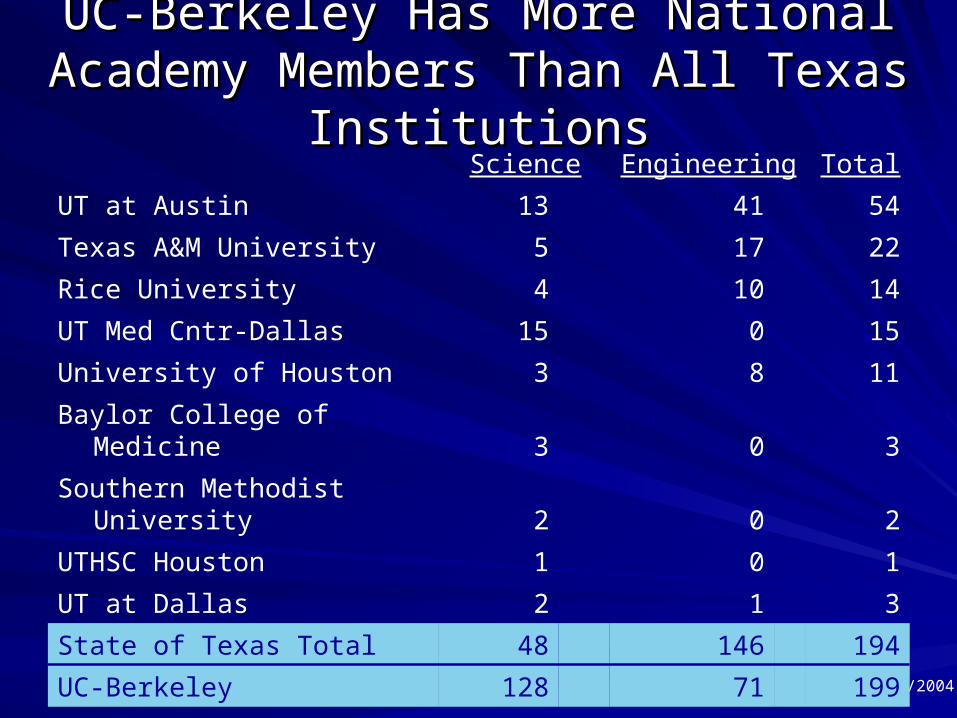
UC-Berkeley Has More National Academy UC-Berkeley Has More National Academy Members Than All Texas InstitutionsMembers Than All Texas Institutions
Science Engineering Total
UT at Austin 13 41 54
Texas A&M University 5 17 22
Rice University 4 10 14
UT Med Cntr-Dallas 15 0 15
University of Houston 3 8 11
Baylor College of Medicine 3 0 3
Southern Methodist University 2 0 2
UTHSC Houston 1 0 1
UT at Dallas 2 1 3
State of Texas Total 48 146 194
UC-Berkeley 128 71 199
THECB 7/2004
Undergraduate ExcellenceUndergraduate Excellence
77% of all public university students are 77% of all public university students are undergraduatesundergraduates
89% of all public college and university 89% of all public college and university students are undergraduatesstudents are undergraduates
Access to excellent undergraduate Access to excellent undergraduate education is criticaleducation is critical
THECB 7/2004
Close the Gaps in Close the Gaps in ResearchResearch
By 2015, increase the level of federal By 2015, increase the level of federal science and engineering research science and engineering research funding to Texas institutions by 50 funding to Texas institutions by 50 percent to $1.3 billion.percent to $1.3 billion.
295 percent of the 2007 federal science and engineering funding target was reached in Fiscal Year 2003
THECB 7/2004
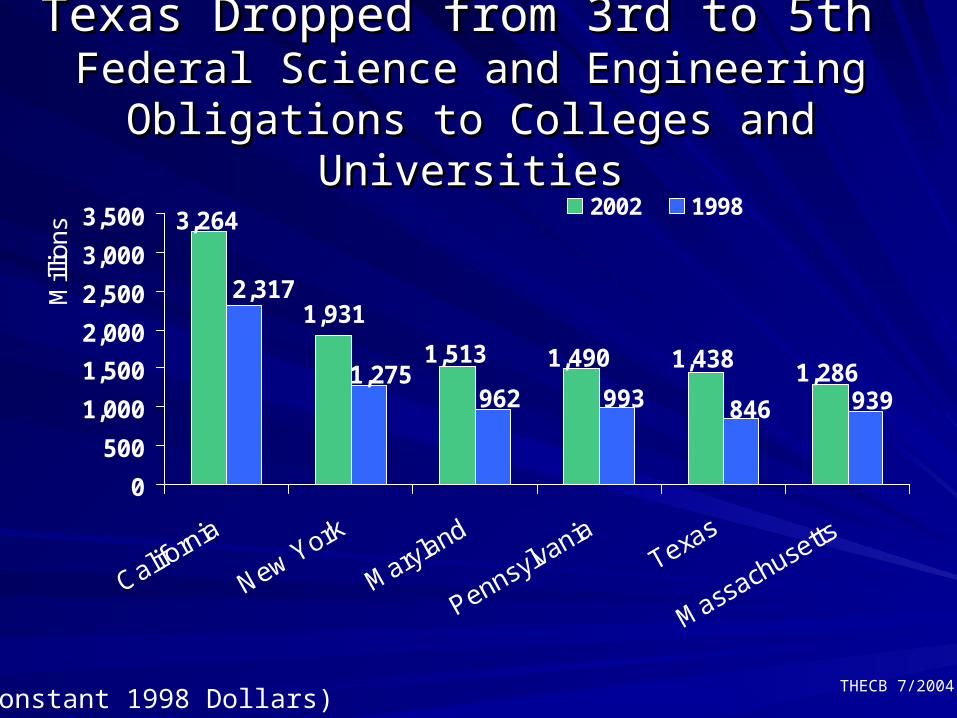
Texas Dropped from 3rd to 5th Texas Dropped from 3rd to 5th Federal Science and Engineering Obligations Federal Science and Engineering Obligations
to Colleges and Universitiesto Colleges and Universities
1,931
1,2861,513 1,490 1,438
3,264
9398469939621,275
2,317
0
500
1,000
1,500
2,000
2,500
3,000
3,500
Mill
ions
2002 1998
(Constant 1998 Dollars)
THECB 7/2004
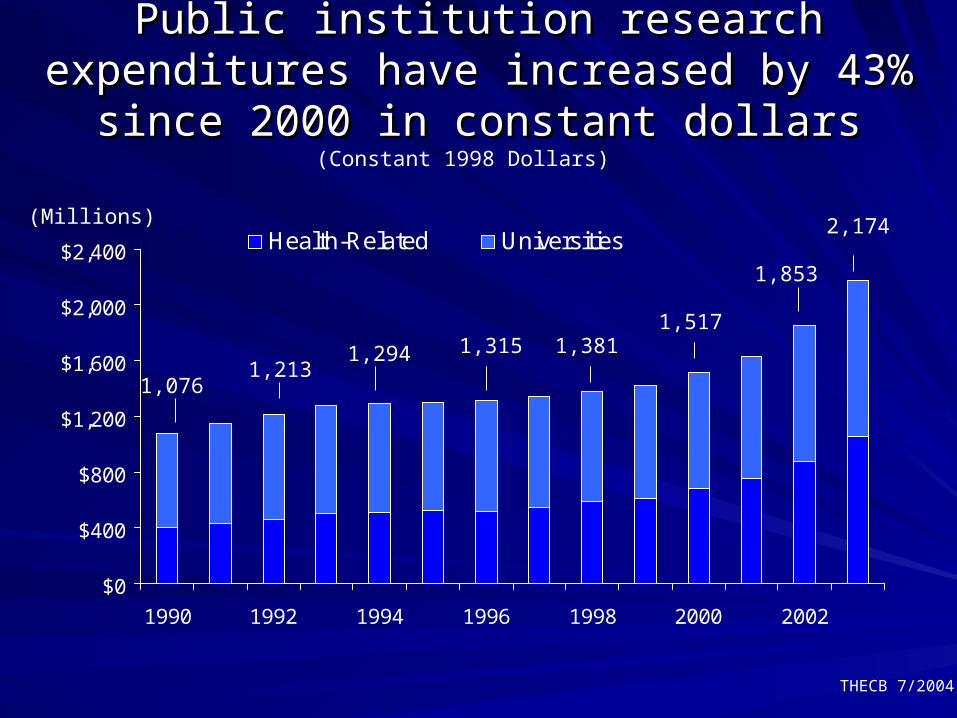
Public institution research expenditures have Public institution research expenditures have increased by 43% since 2000 in constant dollarsincreased by 43% since 2000 in constant dollars
$0
$400
$800
$1,200
$1,600
$2,000
$2,400
1990 1992 1994 1996 1998 2000 2002
Health-Related Universities
(Constant 1998 Dollars)
(Millions)
1,0761,213
1,3811,3151,294
1,517
2,174
1,853