Embed Size (px)
Citation preview

Energy and Power Engineering, 2013, 5, 459-473 http://dx.doi.org/10.4236/epe.2013.57050 Published Online September 2013 (http://www.scirp.org/journal/epe)
Theoretical and Experimental Investigation of Brake Energy Recovery in Industrial Loads
Nick Papanikolaou1*, John Karatzaferis2, Michael Loupis1, Emmanuel Tatakis2 1Department of Electrical Engineering, TEI of Lamia, Lamia, Greece
2Laboratory of Electromechanical Energy Conversion (LEMEC), Department of Electrical and Computer Engineering, University of Patras, Patras, Greece
Email: *[email protected], [email protected], [email protected], [email protected]
Received July 16, 2013; revised August 16, 2013; accepted August 24, 2013
Copyright © 2013 Nick Papanikolaou et al. This is an open access article distributed under the Creative Commons Attribution Li-cense, which permits unrestricted use, distribution, and reproduction in any medium, provided the original work is properly cited.
ABSTRACT
The issue of calculating the energy saving amount due to regenerative braking implementation in modern AC and DC drives is of great importance, since it will decide whether this feature is cost effective. Although several works have been presented in this subject, they are concentrated on the case of electric vehicles because of the higher energy amounts or the need for more extended autonomy. However, as the increase of the electric energy cost at the Hellenic industrial sector, the need for advanced energy saving techniques emerged in order to cut down operational costs. To this direction, this paper presents a theoretical, simulation and experimental investigation on the quantization of energy recovery due to regenerative braking application in industrial rotating loads. The simulation and the experimental proc-esses evaluate the theoretical calculations, where it is highlighted that annual energy saving may become higher than 10% even for small industrial loads, making the implementation of commercial regenerative braking units rather attrac-tive. Finally, a power electronic conversion scheme is proposed for the storage/exploitation of the recovered energy amount.
Keywords: Regenerative Braking; Energy Recovery; Inverters; DC-DC Converters; AC Drives
1. Introduction
The purpose of this study is to investigate the possibility of saving energy during braking of industrial loads (ro- tated by three phase induction motors), as theoretically as experimentally, driven by commercial inverters. The reason why the study focuses on this type of electronic motor drives is due to the fact that it is the most widely used method in the industry, according to a recent analy- sis of industrial loads in Hellenic Industry (80% of par- ticipating businesses use AC Drives) [1].
The following sections include a brief review of the most widely used methods of industrial motor control that are applied by commercial inverters, and a theoreti- cal investigation of the possibility to exploit the braking energy of electric motors driven by commercial inverters, concluding with presenting and evaluating the simulation —experimental results on a commercial inverter.
2. Modern Methods of Industrial Voltage Inverter Control
The rapid developments in microcontroller systems over the past ten years gave the impetus to the production of commercial inverters with highly functional features and abundance of possibilities for control [2-4]. These data were presented extensively in a recent analysis of indus- trial loads in Hellenic Industry [1] and are summarized as follows: Wide range of power capacity. Soft start, adjustable to small starting current. Control of current and voltage output. Smooth braking. Increased starting torque. Automatic or programmable settings. Full speed control over a wide range (typically up to
6000 rpm). Saving energy.
*Corresponding author. Reversible rotation without additional switches.
Copyright © 2013 SciRes. EPE

N. PAPANIKOLAOU ET AL. 460
Increased engine protection. Silent operation. Increased tolerance to background noise and reliabil-
ity. Simple and integrated communications.
The major advantage of using powerful processors to control industrial inverters, to which most of the afore-mentioned functional characteristics could be attributed, is the application of various vector control methods on three-phase induction motors [5-7]. It is well known from electromechanical systems dynamics theory, that the vector control of three-phase asynchronous motors is based on Park’s transformation, i.e. the analysis of the motor’s electromagnetic values mapped onto a stationary reference system in accordance with the relationship:
2π 2πsin sin sin
3 32
3 2π 2πcos cos cos
3 3
asf f fqs
bsds
f f f cs
ii
ii
i
(1)
iqs, ids, are the currents in the q, d axes of the static ref- erence system. θf, is the angle of the rotor’s interlaced flux, λr, relative
to the static reference system. ias, ibs, ics, the phase currents of the stator. If the d axis is aligned with the axis of the interlaced
flow λr then the current ids coincides with excitation cur- rent of the asynchronous machine, while the perpendicu- lar vector of current iqs is the equivalent rotor current (analogous with the separately excited dc machine). Thus, by means of Park’s transformation the load current is completely separated from the magnetizing current, ren- dering the electromagnetic torque fully controllable. This is the basic tool for achieving improved operating char- acteristics, particularly the smooth acceleration/decal- eration (braking) and the increased torque at start-up by 50% - 80%.
Even though the basic vector control method is the di- rect vector control, the implementation of which requires the existence of a flow sensor to directly measure the induced voltage and a rotor speed sensor, it is worth not- ing that in modern industrial inverters the following variants of vector control are often adopted: Sensorless Vector Control: In this case, the flow
sensor is not used, and the rotor speed sensor may be absent as well. The vector controller is extracted from the dynamic equations of the induction machine in a synchronous rotating frame of reference, usually aligned to the rotor.
Space Vector PWM: Typically used in high power industrial inverters exceeding 90 kW. The operating principle is based on the fact that the possible states of the switches of a three phase inverter are limited to eight, as the others lead to a short circuit of the input.
Therefore, the reference vector (called space vector) results from the combination of the two adjacent states and the zero states.
3. Electric Braking in Modern Industrial Inverters
As already indicated, braking in modern industrial in- verters is effectuated via full control of the electromag- netic torque [8-10]. Thus, what is usually set is the de- celeration time, which may take typical values of tens of seconds to a few tenths of a second. The process of de- celeration is a linear decrease of engine speed so as to avoid impulse load on the axis. Additionally, the inverter user sets the maximum permissible electromagnetic torque during deceleration, for protection against over- current. Figure 1 illustrates a typical deceleration curve using an industrial inverter. The electromagnetic torque necessary for the implementation of this scheme is the outcome of the torque equation on the motor shaft:
60 d
2π dems
e L
J nT T
t (2)
Te, is the absolute value of the electromagnetic torque of the motor.
LT , is the absolute value of the load torque reduced on the motor shaft, including any mechanical losses.
Jems, the total m oment of inertia of the electric drive system.
n, the rotor speed (rpm). Since the speed reduction is linear, according to the
Figure 1, it follows that the rate of change of revolutions can be considered constant and equal to:
d
di
Br
nn
t t (3)
ni, the initial rotor speed at the beginning of braking. tBr, the set time of deceleration (braking). Combining Equations (2), (3), we can express the ratio
of the mean electromagnetic torque, , to the mean load torque,
,e avgT
,L avgT , during braking:
,
, ,
601
2πe avg ems i
L avg L avg Br
T J n
T T t
(4)
Full Speed
0 rpm
tst tBr
Acc
elar
atio
n Braking
Figure 1. Typical acceleration—braking curve with an in-dustrial inverter.
Copyright © 2013 SciRes. EPE

N. PAPANIKOLAOU ET AL. 461
Equation (4) can express qualitatively the percentage of the recoverable braking energy, because evidently the initial kinetic energy of the electric motor system, during braking, is shared upon the work of these two moments. The energy converted into electrical one is expressed by the mean electromagnetic torque whereas the work of the mean load torque is the portion of the kinetic energy consumed by the load and the mechanical losses. Hence:
,
, ,
601
2πe avge ems
L L avg L avg Br
TE J
E T T t
in (5)
22π1
2 60i
i ems e
nE J E E
L (6)
Ei, is the initial kinetic energy of the electric motor system. ΔEe, is the kinetic energy portion converted into elec-
tric energy. ΔEL, is the kinetic energy portion consumed by the
load and the mechanical losses. To what concerns the determination of ,L avg , we can
safely assume that its value is not affected by the set braking time, because in every case the deceleration fol-lows a linear path. Thus, we can approximate this value by a free braking test (Te,avg = 0):
T
, ,
60 600
2π 2πems i ems i
L avg L avgFR FR
J n JT T
t
n
t (7)
Combining Equations (5)-(7) we arrive at the follow-ing expression for the braking energy:
1e FR
L Br
E t
E t
(8)
1
1
1 1
e
i FR
Br
E
E t
t
(9)
tFR, is the free braking time (Te,avg = 0). Figure 2 shows the theoretical percentage of the ki-
netic energy that can be converted into electrical energy during braking of the electric motor system.
We observe that the percentage is significantly in- creased when the set braking time is substantially re- duced relatively to the free braking time. This can be explained in two ways; significant levels of braking en- ergy conversion into electrical can be achieved either if the braking is done with no load on the motor (or at least with reduced load) or by applying a very high electro- magnetic torque. Obviously the first case increases time tFR, while the second case significantly reduces time tBr. It is shown that the case of no-load brake is beneficial, as in the case of very high electromagnetic torque (100% - 150% of rated torque) the following negative effects take place:
0,0 0,2 0,4 0,6 0,8 1,00,0
0,2
0,4
0,6
0,8
1,0
∆E
reg
/ Ei
tBr
/ tFR
No losses curve t
Br = 1,5 sec
tBr
= 1,0 sec
tBr
= 0,5 sec
tBr
= 0,3 sec
tBr
= 0,1 sec
1.0
0.8
0.6
0.4
0.2
0.00.0 0.2 0.4 0.6 0.8 1.0
1.5 sec
1.0 sec
0.5 sec
0.3 sec
0.1 sec
tBr / tFR
Figure 2. Kinetic energy recovery potential during braking. Increased electrical copper losses of the motor and
conduction losses of the inverter, proportional to the square of to the motor stator current.
Increased switching losses of the inverter, propor- tional to the motor stator current.
In extremely short braking times, intense voltage dis- charge of the DC link may take place, resulting in excessive electric power consumption from the grid. Additionally, in this case the electric losses of the motor-inverter multiply.
Deceleration deviates from the desired linearity, due to limiting the set delay time at rates comparable to the time constants of the inverter control.
The conclusion from these observations is that the pursuit of extremely small deceleration times, in order to maximize the percentage of recoverable braking energy, leads to a large increase of electrical losses in the motor and inverter. Thus, the recoverable energy can be sig- nificantly reduced, compromising or negating the advan- tages of electric braking. Finally, the recoverable braking energy results from ΔEe by subtracting the electric losses of the motor and the inverter:
, ,
, ,
reg L inv L mot
reg L inv L mote
i i i
E E E
E E EE
E E E
(10)
regE , is the recoverable portion of kinetic energy.
,L invE , are the electric inverter losses during braking.
,L motE , are the electric motor losses during braking. As regards both the electrical losses of the inverter and
the motor, these can be expressed by the approximate relationship [11,12]:
2Loss oP P kP (11)
Ploss, is the power of losses at power level P. Po, is the power of constant losses (irrespective of
power level). k, constant [W−1].
Copyright © 2013 SciRes. EPE
N. PAPANIKOLAOU ET AL. 462
Notably, the values of parameters k, Po are experi- mentally determined through the analysis of the mo- tor-inverter system losses as a function of operating power. Assuming therefore that the mean power during braking is equal to:
eBr
Br
EP
t
(12)
We end up by combining Equations (11) and (12), with the following expressions:
, , , ,L inv L mot L inv L mote
i i e
E E E EE
E E E
(13)
2, ,L inv L mot e o Br e o
Bri i Br i Br
E E E P kP E PkP
E E P E P
(14)
, ,
1
reg e L inv L mot
reg e oBr
i i Br
E E E E
E E PkP
E E P
(15)
Equation (15) shows that the energy finally recover- able deviates from the theoretical value of Equation (9), which does not take into account electrical losses. Exam- ples are given in the graphs in Figure 2, for parameter values k, Po, satisfying an efficiency value 85% (for the motor-inverter system) and an initial kinetic energy of 200 Joule (which corresponds to a motor system in the order of 2.5 kW), tBr being parametric. It is evident from the graphs that an extremely short braking can compro- mise or reduce the recoverability of energy—similarly to extremely long braking.
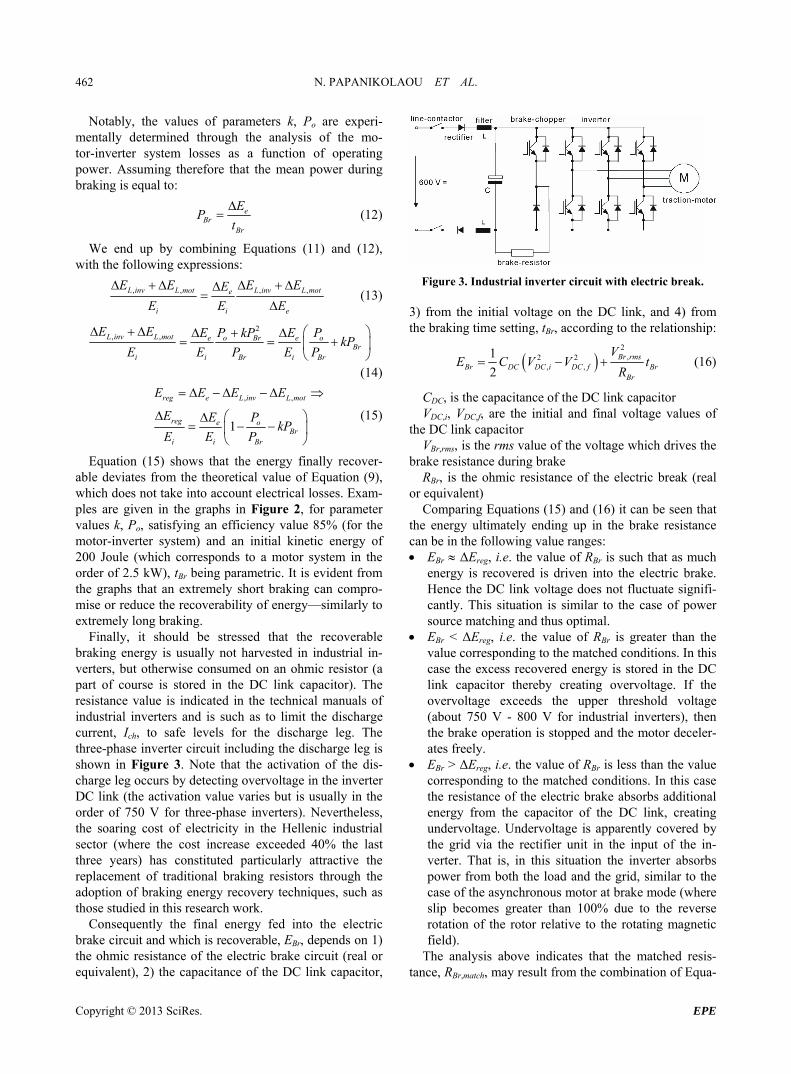
Finally, it should be stressed that the recoverable braking energy is usually not harvested in industrial in- verters, but otherwise consumed on an ohmic resistor (a part of course is stored in the DC link capacitor). The resistance value is indicated in the technical manuals of industrial inverters and is such as to limit the discharge current, Ich, to safe levels for the discharge leg. The three-phase inverter circuit including the discharge leg is shown in Figure 3. Note that the activation of the dis-charge leg occurs by detecting overvoltage in the inverter DC link (the activation value varies but is usually in the order of 750 V for three-phase inverters). Nevertheless, the soaring cost of electricity in the Hellenic industrial sector (where the cost increase exceeded 40% the last three years) has constituted particularly attractive the replacement of traditional braking resistors through the adoption of braking energy recovery techniques, such as those studied in this research work.
Consequently the final energy fed into the electric brake circuit and which is recoverable, EBr, depends on 1) the ohmic resistance of the electric brake circuit (real or equivalent), 2) the capacitance of the DC link capacitor,
Figure 3. Industrial inverter circuit with electric break. 3) from the initial voltage on the DC link, and 4) from the braking time setting, tBr, according to the relationship:
2
,2 2, ,
1
2Br rms
Br DC DC i DC fBr
VE C V V t
R Br (16)
CDC, is the capacitance of the DC link capacitor VDC,i, VDC,f, are the initial and final voltage values of
the DC link capacitor VBr,rms, is the rms value of the voltage which drives the
brake resistance during brake RBr, is the ohmic resistance of the electric break (real
or equivalent) Comparing Equations (15) and (16) it can be seen that
the energy ultimately ending up in the brake resistance can be in the following value ranges: EBr ΔΕreg, i.e. the value of RBr is such that as much
energy is recovered is driven into the electric brake. Hence the DC link voltage does not fluctuate signifi- cantly. This situation is similar to the case of power source matching and thus optimal.
EBr < ΔΕreg, i.e. the value of RBr is greater than the value corresponding to the matched conditions. In this case the excess recovered energy is stored in the DC link capacitor thereby creating overvoltage. If the overvoltage exceeds the upper threshold voltage (about 750 V - 800 V for industrial inverters), then the brake operation is stopped and the motor deceler-ates freely.
EBr > ΔΕreg, i.e. the value of RBr is less than the value corresponding to the matched conditions. In this case the resistance of the electric brake absorbs additional energy from the capacitor of the DC link, creating undervoltage. Undervoltage is apparently covered by the grid via the rectifier unit in the input of the in- verter. That is, in this situation the inverter absorbs power from both the load and the grid, similar to the case of the asynchronous motor at brake mode (where slip becomes greater than 100% due to the reverse rotation of the rotor relative to the rotating magnetic field).
The analysis above indicates that the matched resis- tance, RBr,match, may result from the combination of Equa-
Copyright © 2013 SciRes. EPE

N. PAPANIKOLAOU ET AL.
Copyright © 2013 SciRes. EPE
463
variable resistive load. The presence of two DC motors allows the variation of the moment of inertia of the elec-tric motor system. Table 1 lists all the technical features of the test system.
tions (15), (16), assuming that the variation of the DC link voltage is zero:
, , ,
2,
,
DC i DC f Br rms
DC iBr match Br
reg
V V V
VR t
E
(17) To what concerns the experimental procedure, it is consisted of two parts. In the first part, the motor system is consisted of electric motors M1 and M2. There was no electrical load and therefore the motor system simulated a sliding friction mechanical load. The second part in-volved all three electric motors M1, M2, M3. Motor M2 is not stimulated but increases the moment of inertia of the system, while motor M3 operates as a generator that sup-plies the electric load. Thereby a mechanical load with a power proportional to the square of the rotational speed is simulated, such as grinding and material polishing machines.
At this point it should be noted that the calculation of resistance RBr,match was made considering that during the braking process the electric brake resistance is constantly connected to the DC link, without the presence of semi- conductor switch. If—as in many industrial inverter cases—there is a semiconductor switch that regulates the delivery of energy to the brake, it should remain closed throughout the duration of braking in the case of match- ing, and therefore the Equation (17) is valid in this case as well.
4.1. Section Α: Laboratory Measurements with Sliding Friction Load 4. Experimental Results of Measurements
upon Industrial Inverter Experiment data:
The following sections present the experimental results from laboratory measurements made upon an industrial inverter. Figure 4 shows the laboratory electric motor system used in the experimental study, consisting of a three-phase induction motor (M1) driven by an industrial inverter. The mechanical load consists of two DC motors separately excited (M2, M3) and the consumer used is a
Total moment of inertia Jems = 0.0101 kgm2. Mechanical load torque 10%L NT T (brake under
low load). Frequency 50/60 Hz. Inverter switching frequency 3 - 6 - 9 - 12 kHz. Brake resistance 50 Ω - 100 Ω - 200 Ω. Free braking time 4.2 sec/50 Hz, 5.7 sec/60 Hz.
Table 1. Technical data of the test system components.
Electric Motors
Μ1 Μ2 Μ3
Asynchronous three-phase squirrel cage motor 400 V/Δ, 660 V/Y
1.5 kW 3.1 A, 1420 rpm/50 Hz 2.5 A, 1720 rpm/60 Hz cosφ = 0.8 ind J = 0.0027 kgm2
DC motor separately excited 220 V, 12 Α (Rotor) 220 V, 0.8 A (Excitation) 2.2 kW/1500 rpm J = 0.0074 kgm2
DC motor separately excited 220 V, 6 Α (Rotor) 220 V, 0.55 A (Excitation) 1.2 kW/1400 rpm (Generator) 1.0 kW/1400 rpm (Shunt Motor) 1.0 kW/1150 rpm (Series Motor) J = 0.004 kgm2
Industrial inverter Ohmic resistances
3-phase input voltage 400 V/50 - 60 Hz Maximum power 5.5 kVA Output voltage 0 - 400 V (phase to phase) Output frequency 0 - 480 Hz Efficiency 98% @ 4.5 kW Sensorless Vector Control Maximum electromagnetic torque 150% Electric braking Braking Semiconductor Switch: No
1) Electric load of variable ohmic resistance Maximum power 3.5 kW 230 Vrms/5 A per phase (three independent phases) cosφ = 0.98
2) Electric brake resistance 3 free wiring resistors 100 Ohm, 500 W per resistor cosφ = 0.98
Modelling of the electrical losses of the asynchronous motor - industrial inverter system:
k = 6 × 10⁻⁴ W−1 Po = 50 W Combined Efficiency 83% @ 1.5 kW - 50 Hz

N. PAPANIKOLAOU ET AL. 464
(a)
(b)
Figure 4. (a) The experimental set-up for measurements— Real laboratory setup; (b) The experimental set-up for measurements—Functional diagram.
Table 2 shows the matching resistance value for 50 Hz and 60 Hz, according to Equation (17), taking into ac- count the electrical losses of the electric motor system according to Figure 2. From the values in Table 2 it is evident that matching is achieved under extremely high values of the electric brake ohmic resistance, mainly due to the power level of the application. Therefore, in every case the ohmic resistance of the electric brake is less than the matching resistance. Hence, according to the theo- retical analysis, the energy supplied to the brake resis- tance is expected to be greater than the recovered energy.
Figures 5-12 confirm this fact, especially for the oh-mic resistance of 50 Ohm and for braking times of less than 1.0 sec. The fact that for braking times greater than 1.0 sec the electric brake energy is reduced, can be at- tributed mainly to a higher energy percentage stored in the DC link capacitor, without causing prohibitive over- voltage—because of the low braking power. On the other hand, reduction of the brake energy is limited in highly dynamic braking (braking times in the order of 0.3 sec) due to excessive increase of power loss in the motor sys- tem, in accordance with Equation (15), as the braking
Table 2. Matching break resistor value for Section A ex-periments.
RBr,match (Ω) tBr (sec)
50 Hz 60 Hz
1.5 18,000 7500
1.0 6900 3600
0.5 2180 1378
0.3 1100 755
power increases excessively.
Regarding the influence of the switching frequency of the inverter, despite the fact that its increase entails an increase in switching losses, it is observed not to ad- versely affect the energy fed into the electric brake. In contrast, increasing the switching frequency in the upper permissible values of 9 kHz and 12 kHz, increases sub- stantially the said amount of energy. This is due firstly to the small size of switching losses compared to the in- verter conduction and motor copper losses during brak- ing (which increase proportionally to the square of the braking force). On the other hand the quality of the motor current waveform is improved by increasing the switch- ing frequency—thereby reducing the proportion of cop- per loss associated with the skin effect. Finally, Figures 13-15 present indicative waveforms of the voltage at the brake resistance during braking.
4.2. Section Β: Laboratory Measurements with Load Dependent on the Square of the Angular Speed of Rotation
Experiment data: Total moment of inertia Jems = 0.0140 kgm2. Mechanical load torque 70% - 100%L NT T (brak-
ing under high load). Frequency 50/60 Hz. Inverter switching frequency 6 kHz. Brake resistance 50 Ω. Free braking time 3.2 sec/1720 rpm, 2.0 sec/1439 rpm,
1.9 sec/1420 rpm. Table 3 shows the matching resistance value for the
three rotational speeds, according to Equation (17), tak-ing into account the electrical losses of the electric motor system according to Figure 2.
As in Section A, the values in Table 3 it is evident that matching is achieved under extremely high values of the electric brake ohmic resistance, mainly due to the power level of the application. Therefore, in every case the oh-mic resistance of the electric brake is less than the matching resistance. Hence, according to the theoretical analysis, the energy supplied to the brake resistance is expected to be greater than the recovered energy.
Copyright © 2013 SciRes. EPE

N. PAPANIKOLAOU ET AL. 465
0,2 0,4 0,6 0,8 1,0 1,2 1,4 1,6
20
40
60
80
100
120
140
160
180
200
EB
r / E
i (%
)
tBr (sec)
RBr=50 Ohms
RBr=100 Ohms
RBr=200 Ohms
fS = 3 kHz, f
ac = 50 Hz
0.2 0.4 0.6 0.8 1.0 1.2 1.4 1.6
Figure 5. Energy recovery during Section A experimental process (fS = 3 kHz, fac = 50 Hz, RBr being parameter).
0,2 0,4 0,6 0,8 1,0 1,2 1,4 1,60
100
200
300
400
tBr
(sec)
EB
r / E
i (%
)
fS = 3 kHz, f
ac = 60 Hz
RBr
=50 Ohms
RBr
=100 Ohms
RBr
=200 Ohms
0.2 0.4 0.6 0.8 1.0 1.2 1.4 1.6
Figure 6. Energy recovery during Section A experimental process (fS = 3 kHz, fac = 60 Hz, RBr being parameter).
0,2 0,4 0,6 0,8 1,0 1,2 1,4 1,60
50
100
150
200
tBr
(sec)
EB
r / E
i (%
)
fS = 6 kHz, f
ac = 50 Hz
RBr
=50 Ohms
RBr
=100 Ohms
RBr
=200 Ohms
0.2 0.4 0.6 0.8 1.0 1.2 1.4 1.6
Figure 7. Energy recovery during Section A experimental process (fS = 6 kHz, fac = 50 Hz, RBr being parameter).
0,2 0,4 0,6 0,8 1,0 1,2 1,4 1,60
50
100
150
200
250 fS = 6 kHz, f
ac = 60 Hz
RBr=50 Ohms
RBr=100 Ohms
RBr=200 Ohms
EB
r / E
i (%
)
tBr (sec)
0.2 0.4 0.6 0.8 1.0 1.2 1.4 1.6
Figure 8. Energy recovery during Section A experimental process (fS = 6 kHz, fac = 60 Hz, RBr being parameter).
0,2 0,4 0,6 0,8 1,0 1,2 1,4 1,60
10
20
30
40
50
60
70
80
90
100
110
tBr
(sec)
EB
r / E
i (%
)
RBr
=50 Ohms
RBr
=100 Ohms
RBr
=200 Ohms
fS = 9 kHz, f
ac = 50 Hz
0.2 0.4 0.6 0.8 1.0 1.2 1.4 1.6
Figure 9. Energy recovery during Section A experimental process (fS = 9 kHz, fac = 50 H RBr being parameter).
,
z,
0,2 0,4 0,6 0,8 1,0 1,2 1,4 1 60
50
100
150
200
250
300
350
400
450
RBr
=50 Ohms
RBr
=100 Ohms
RBr
=200 Ohms
EB
r / E
i (%
)
tBr
(sec)
fS = 9 kHz, f
ac = 60 Hz
0.2 0.4 0.6 0.8 1.0 1.2 1.4 1.6
Figure 10. Energy recovery during Section A experimentaprocess (fS = 9 kHz, fac = 60 Hz, RBr being parameter).
l
Copyright © 2013 SciRes. EPE
N. PAPANIKOLAOU ET AL. 466
0,2 0,4 0,6 0,8 1,0 1,2 1,4 1,60
50
100
150
200
250
300
EB
r / E
i (%
)
tBr
(sec)
R =50 O
fS = 12 kHz, f
ac = 50 Hz
Brhms
RBr
=100 Ohms
RBr
=200 Ohms
0.2 0.4 0.6 0.8 1.0 1.2 1.4 1.6
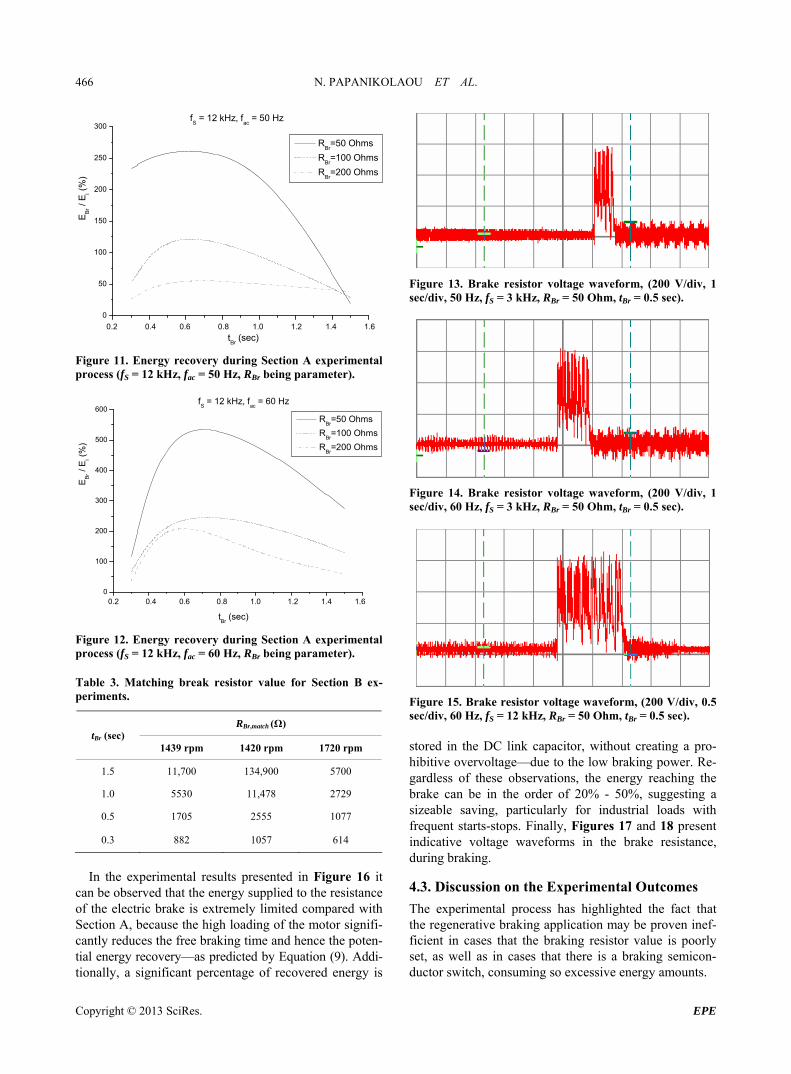
Figure 11. Energy recovery during Section A experimentaprocess (f = 12 kHz, f = 50 Hz, R being parameter).
l S ac Br
0,2 0,4 0,6 0,8 1,0 1,2 1,4 1,60
100
200
300
400
500
600
EB
r / E
i (%
)
tBr
(sec)
RBr
=50 Ohms
RBr
=100 Ohms
RBr
=200 Ohms
fS = 12 kHz, f
ac = 60 Hz
0.2 0.4 0.6 0.8 1.0 1.2 1.4 1.6
Figure 12. Energy recovery during Section A experimentaprocess (f = 12 kHz, f = 60 Hz, R being parameter).
ex-eriments.
RBr,match (Ω)
l S ac Br
Table 3. Matching break resistor value for Section Bp
tBr (sec) 1439 rpm 1720 rpm 1420 rpm
1.5 11,700 134,900 5700
1.0 5530 11,478 2729
0.5 1705 2555 1077
0.3 882 1057 614
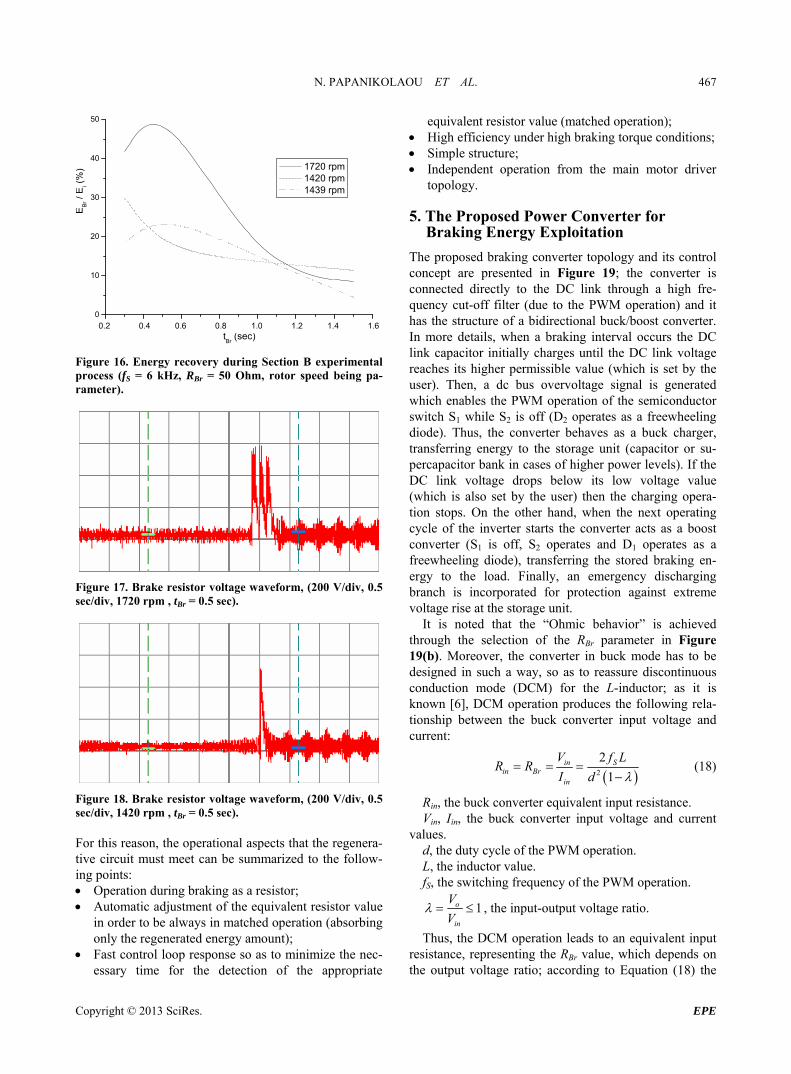
In t xperimental results presented in Figure 16 it
a
he ec n be observed that the energy supplied to the resistance of the electric brake is extremely limited compared with Section A, because the high loading of the motor signifi-cantly reduces the free braking time and hence the poten- tial energy recovery—as predicted by Equation (9). Addi- tionally, a significant percentage of recovered energy is
Figure 13. Brake resistor voltage waveform, (200 V/div, 1 sec/div, 50 Hz, fS = 3 kHz, RBr = 50 Ohm, tBr = 0.5 sec).
Figure 14. Brake resistor voltage waveform, (200 V/div, 1 sec/div, 60 Hz, fS = 3 kHz, RBr = 50 Ohm, tBr = 0.5 sec).
Figure 15. Brake resistor voltage waveform, (200 V/div, 0.5 sec/div, 60 Hz, fS = 12 kHz, RBr = 50 Ohm, tBr = 0.5 sec).
pro- ibitive overvoltage—due to the low braking power. Re-
f-
ductor switch, consuming so excessive energy amounts.
stored in the DC link capacitor, without creating a hgardless of these observations, the energy reaching the brake can be in the order of 20% - 50%, suggesting a sizeable saving, particularly for industrial loads with frequent starts-stops. Finally, Figures 17 and 18 present indicative voltage waveforms in the brake resistance, during braking.
4.3. Discussion on the Experimental Outcomes
The experimental process has highlighted the fact thatthe regenerative braking application may be proven ineficient in cases that the braking resistor value is poorly set, as well as in cases that there is a braking semicon-
Copyright © 2013 SciRes. EPE
N. PAPANIKOLAOU ET AL. 467
0,2 0,4 0,6 0,8 1,0 1,2 1,4 1
40
50
,60
10
20
30
EB
r / E
i (%
)
tBr
(sec)
1720 rpm 1420 rpm 1439 rpm
0.2 0.4 0.6 0.8 1.0 1.2 1.4 1.6
Figure 16. Energy recovery during Section B experimental process (fS = 6 kHz, RBr = 50 Ohm, rotor speed being pa-rameter).
Figure 17. Brake resistor voltage waveform, (200 V/div, 0.5 sec/div, 1720 rpm , tBr = 0.5 sec).
Figure 18. Brake resistor voltage waveform, (200 V/div, 0.5 sec/div, 1420 rpm , tBr = 0.5 sec).
ummarized to the follow-g points:
o be always in matched operation (absorbing
ration);
driver
Energy Exploitation
ontrol
co h a high fre-
in buck mode has to be de
For this reason, the operational aspects that the regenera-tive circuit must meet can be sin Operation during braking as a resistor; Automatic adjustment of the equivalent resistor value
in order tonly the regenerated energy amount);
Fast control loop response so as to minimize the nec-essary time for the detection of the appropriate
equivalent resistor value (matched ope High efficiency under high braking torque conditions; Simple structure; Independent operation from the main motor
topology.
5. The Proposed Power Converter for Braking
The proposed braking converter topology and its cconcept are presented in Figure 19; the converter is
nnected directly to the DC link througquency cut-off filter (due to the PWM operation) and it has the structure of a bidirectional buck/boost converter. In more details, when a braking interval occurs the DC link capacitor initially charges until the DC link voltage reaches its higher permissible value (which is set by the user). Then, a dc bus overvoltage signal is generated which enables the PWM operation of the semiconductor switch S1 while S2 is off (D2 operates as a freewheeling diode). Thus, the converter behaves as a buck charger, transferring energy to the storage unit (capacitor or su- percapacitor bank in cases of higher power levels). If the DC link voltage drops below its low voltage value (which is also set by the user) then the charging opera- tion stops. On the other hand, when the next operating cycle of the inverter starts the converter acts as a boost converter (S1 is off, S2 operates and D1 operates as a freewheeling diode), transferring the stored braking en- ergy to the load. Finally, an emergency discharging branch is incorporated for protection against extreme voltage rise at the storage unit.
It is noted that the “Ohmic behavior” is achieved through the selection of the RBr parameter in Figure 19(b). Moreover, the converter
signed in such a way, so as to reassure discontinuous conduction mode (DCM) for the L-inductor; as it is known [6], DCM operation produces the following rela- tionship between the buck converter input voltage and current:
2
2
1in S
in Br
V f LR R
I din
(18)
Rin, the buck converter equivalent input resiVin, Iin, the buck converter input voltag
values.
switching frequency of the PWM operation.
stance. e and current
d, the duty cycle of the PWM operation. L, the inductor value. fS, the
1o
V
in
V , the input-output voltage ratio.
Thus, the DCM operation leads to an equivalent input resistance, re depends on the output voltage ratio; according to Equation (18) the
presenting the RBr value, which
Copyright © 2013 SciRes. EPE

N. PAPANIKOLAOU ET AL.
Copyright © 2013 SciRes. EPE
468
Indus nvertertrial I
AC
ACDC
Industrial Load
Power Supply(single or three
phase)
Braking Converter
Electrolytic Capacitor /Supercapacitor
High FrequencyCut-Off Filter
(a)
VDCVBr
LD1
S1
D2
S2
DC bus Overvoltage Signal
Function Generator PWM Controller
DC Link Voltage Measurement
Hysteresis Control
Storage Overvoltage Signal
Storage Voltage Measurement
Hysteresis Control
Emergency Overvoltage Protection
Rem
RBr,0
d
?
fS
Function Generator
(b)
Figure 19. The proposed braking converter; (a) converter topology, (b) control concept.
N. PAPANIKOLAOU ET AL. 469
RBr becomes constant if:
,0
,0,0 2
1S
Sf
2constantS
Br Br
f
f LR R
d
(19)
fS,0, the switching frequency for The control loop in Figure 19 value
co ack, implemen g so Eq
0 0oV (b) keeps the RBr
nstant due to the voltage feedb tinuation (19). Moreover, the condition for DCM mode is
[6]:
1 inVI d (20) in
inR
Equation set (19), (20) can be ution of L, fS,0 values so as to reassure DCM operation. As it
e converter manages to meet the requirements th
in ,5
proposed brThe outcomes are presented in Figures 21-23, in terms
of regenerative energy amount as a ratio of braking time etical calculation
by the selected RBr value. Of co
the main su
rative braking has ork ads,
acc Section 3, the
tBr = 0.5 sec.
sed for the determina-
concerns boost operation during discharge, this may be either CCM or DCM without any affection on the brak- ing mode.
According to its operation description, the proposed regenerativ
at have been set in the previous Section. In more details, the operation of the braking scheme is independent by the inverter topology and operation (it is connected di- rectly to the DC bus), while it is a very simple structure. Finally, the fact that the braking energy is stored locally reduces the additional energy losses due to the energy injection to the grid.
6. MATLAB/Simulink Simulation Process
The proposed braking converter has been simulated MATLAB/Simulink environment, for the case of the 2kW system that has been experimentally studied. A typi-cal acceleration—normal operation—braking operation cycle is presented in Figure 20—for the case of low load operation. The low and overvoltage thresholds for the DC link are set to 700 V and 750 V respectively (680 V nominal voltage during operation is supposed), while the equivalent resistance is set to 50 Ohm; a 1000 μF ca- pacitor has been used for the energy storage unit, with maximum permissible voltage fluctuation (during brak- ing) is between 100 V - 600 V (175 Joule capacity while the initial kinetic energy of the rotating system is be- tween 200 - 250 Joules, depending on the speed set). Finally, the industrial inverter switching frequency is 9 kHz. As it can be noted, the rotating speed increases/ decreases linearly while the DC link voltage during braking has similar waveform with the ones that have been recorded during the experimental process.
A detailed simulation process took place in order to evaluate the operational characteristics of the
aking scheme for various values of the RBr parameter.
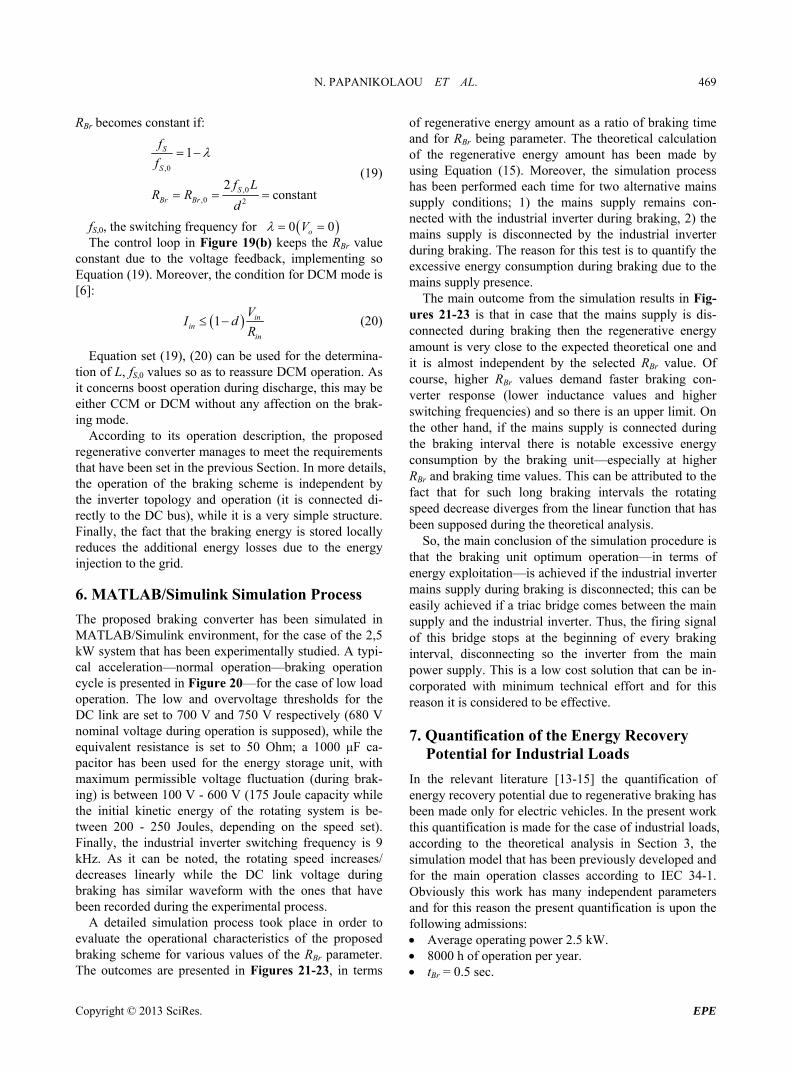
of the regenerative energy amount has been made by using Equation (15). Moreover, the simulation process has been performed each time for two alternative mains supply conditions; 1) the mains supply remains con- nected with the industrial inverter during braking, 2) the mains supply is disconnected by the industrial inverter during braking. The reason for this test is to quantify the excessive energy consumption during braking due to the mains supply presence.
The main outcome from the simulation results in Fig- ures 21-23 is that in case that the mains supply is dis- connected during braking then the regenerative energy amount is very close to the expected theoretical one and it is almost independent
and for RBr being parameter. The theor
urse, higher RBr values demand faster braking con- verter response (lower inductance values and higher switching frequencies) and so there is an upper limit. On the other hand, if the mains supply is connected during the braking interval there is notable excessive energy consumption by the braking unit—especially at higher RBr and braking time values. This can be attributed to the fact that for such long braking intervals the rotating speed decrease diverges from the linear function that has been supposed during the theoretical analysis.
So, the main conclusion of the simulation procedure is that the braking unit optimum operation—in terms of energy exploitation—is achieved if the industrial inverter mains supply during braking is disconnected; this can be easily achieved if a triac bridge comes between
pply and the industrial inverter. Thus, the firing signal of this bridge stops at the beginning of every braking interval, disconnecting so the inverter from the main power supply. This is a low cost solution that can be in-corporated with minimum technical effort and for this reason it is considered to be effective.
7. Quantification of the Energy Recovery Potential for Industrial Loads
In the relevant literature [13-15] the quantification of energy recovery potential due to regenebeen made only for electric vehicles. In the present wthis quantification is made for the case of industrial lo
ording to the theoretical analysis in simulation model that has been previously developed and for the main operation classes according to IEC 34-1. Obviously this work has many independent parameters and for this reason the present quantification is upon the following admissions: Average operating power 2.5 kW. 8000 h of operation per year.
Copyright © 2013 SciRes. EPE

N. PAPANIKOLAOU ET AL. 470
(a)
(b)
(c)
Figure 20. Simulated waveforms during an operation cycle (acceleration-constant speed-braking); DC_Link is the voltage on the DC bus, n (rpm) is the motor rotating speed, Reference is the SPWM control signals.
Copyright © 2013 SciRes. EPE
N. PAPANIKOLAOU ET AL. 471
0,2 0,4 0,6 0,8 1,0
0,0
0,1
0,2
0,3
0,4
0,5
0,6
0,7
0,8
ΔE re
g /
E i
tBr
/ tFR
RBr
=50 Ohm
RBr
=50 Ohm, Power Off
Theoretical Curve
0.8
0.7
0.6
0.5
0.4
0.3
0.2
0.1
0.0 0.2 0.4 0.6 0.8 1.0
Figure 21. Simulation waveforms and the corresponding theoretical calculations for the regenerative energy amount as a function of braking time, R = 50 Ohm. Br
0,2 0,4 0,6 0,8 1,0
0,0
0,1
0,2
0,3
0,4
0,5
0,6
0,7
0,8
ΔE re
g /
E i
tBr
/ tFR
RBr
=100 Ohm
RBr
=100 Ohm, Power Off
Theoretical Curve
0.8
0.7
0.6
0.5
0.4
0.3
0.2
0.1
0.0 0.2 0.4 0.6 0.8 1.0
Figure 22. Simulation waveforms and the correspondin
der matching conditions.
The electric losses of the inverter-induction motor system are determined by its nominal efficiency, ηN, as: ηN = 75%, k = 8.5 × 10⁻⁵ W−1, Po = 90 W ηN = 80%, k = 7.0 × 10⁻⁵ W−1, Po = 70 W ηN = 85%, k = 5.8 × 10⁻⁵ W−1, Po = 50 W
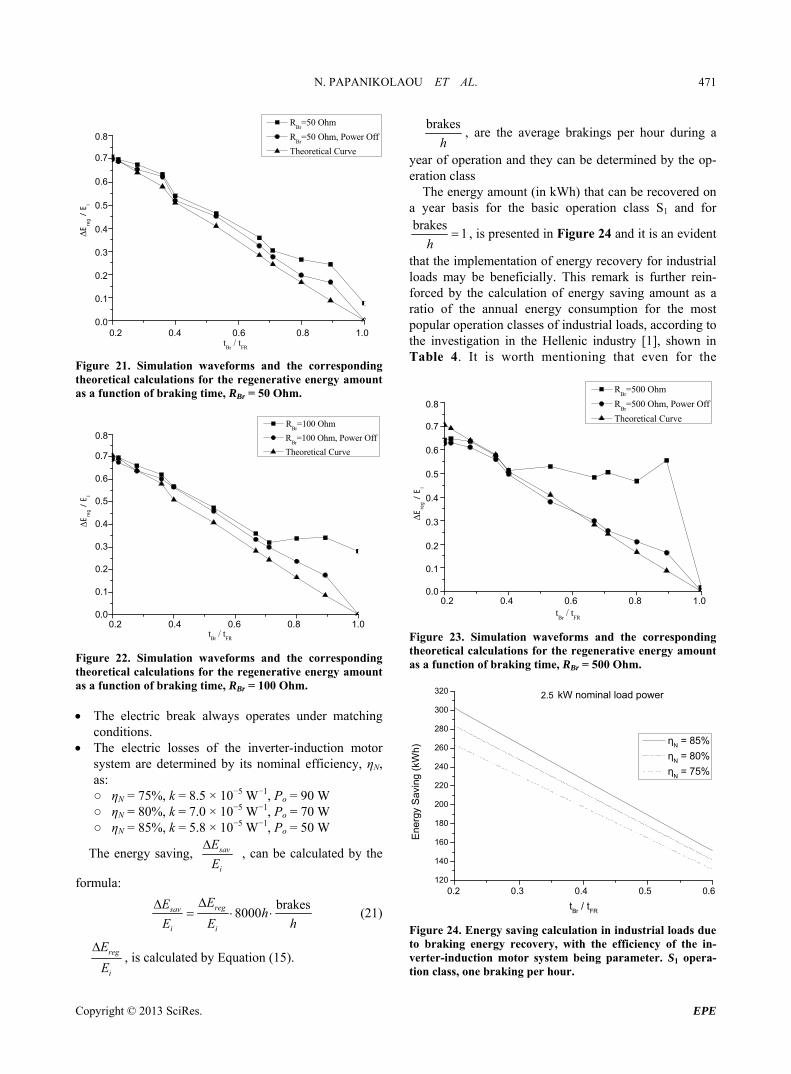
The energy saving,
g theoretical calculations for the regenerative energy amount as a function of braking time, RBr = 100 Ohm. The electric break always operates un
sav
i
E
E
, can be calculated by the
formula:
brakes8000regsav
i i
EEh
E E h
(21)
reg
iE
brakes
h, are the average brakings per hour during a
year of operation and they can be determined by the op-eration class
The energy amount (in kWh) that can be recovered on a year basis for the basic operation class S1 and for brakes
1h
, is presented in Figure 24 and it is an evident
that the implementation of energy recovery for industrial loads may be beneficially. This remark is further rein-forced by the calculation of energy saving amount as a ratio of the annual energy consumption for the most popular operation classes of industrial loads, according to the investigation in the Hellenic industry [1], shown in Table 4. It is worth mentioning that even for the
0,2 0,4 0,6 0,8 1,0
E, is calculated by Equation (15).
0,0
0,1
0,2
0,3
0,4
0,5
0,6
0,7
0,8
RBr
=500 Ohm
ΔE re
g /
E i
tBr
/ tFR
RBr
=500 Ohm, Power Off0.8
Theoretical Curve0.7
0.6
0.5
0.4
0.3
0.2
0.1
0.00.2 0.4 0.6 0.8 1.0
. Simulation waveforms and the corresponding l calculations for the regenerative energy amount
as a function of braking time, RBr = 500 Ohm.
Figure 23theoretica
0,2 0,3 0,4 0,5 0,6120
140
240
260
280
300
320
160
180
200
220
2,5 kW nominal load power2.5
ηN = 85%
er (
kWh)
En
gy S
avin
g
tBr
/ tFR
ηN = 80%
η = 75%N
0.2 0.3 0.4 0.5 0.6
Figure 24. Energy saving calculation in industrial loads due to braking energy recovery, with the efficiency of the in-verter-induction motor system being parameter. S1 opera-tion class, one braking per hour.
Copyright © 2013 SciRes. EPE

N. PAPANIKOLAOU ET AL. 472
Table 4. Energy saving for various operation classes.
Operation class according to IEC
34-1
brakes
h Annual Energy
Saving (%)
S1 1 - 2 1.0% - 3.0%
1 1.0% - 3.0%
3 3.0% - 4.5% S2
5 4.5% - 8.0%
3 3.0% - 9.5%
7 6.0% - 16.0% S3, S4
10 8.5% - 18.0%
3 5.0% - 9.5%
7 8.5% - 18.0% S5
10 11.0% - 20.0%
relatively small power level of 2.5 kW the expected en
saving ratio that has been reported for electric vehicles [13-15]. Thus, the development of regenerative braking units dedicated for industrial loads is a very promising commercial sec-tor.
Finally, the present energy saving calculation algo-rithm can be used for various power levels and operation classes of industrial loads, in order to assess whether the introduction of regenerative braking is cost effective or not.
8. Conclusions
The present paper investigated in detail both theoretically and experimentally the energy recovery potential in commercial inverters that drive industrial loads. Th
cifivariab se value will be set to the optimuval ng resistance. To achbra opology and its control abeen prop d thoroug udied throsimulation process, proven to very effecof energy eneration—espe e m trial inverter s ly is disconnecte during brak s.
Finally, as it concerns future work, the options in this project should be udied furth The n and the imp entation in
converter topology in for f parallel ules and the modification f its contro dto inco orate the interleaved pulse m In this way the need for hig requency be
drastically reduced and th hole syst e a plug-n-play device of which power level can be in-
volves the DC link voltage (which in some types of
ork was supported by the “Reinforcement program m enterprises for research and tech-ent activities” under research project -
ergy saving can reach very satisfying levels—even more than 10%. This is a very important finding of the present
ork and it is comparable with the energyw
e -main conclusion from the results of this study is that en
ergy recovery may vary at a satisfactory level (even higher than 10%), but require the proper design of the circuitry, which plays the role of brake resistance. Spe-
cally, the energy recovery circuitry should act as a m a ve
_content.html
[5] R. Krishnan, “Electric Motor Drives: Modeling, Analysis, and Control,” Pearson Education, Inc., Prentice Hall, Upper Saddle River, 2001.
[6] N. Mohan, T. Undeland and W. Robbins, “Power Elec- tronics: Converters, Applications, and Design,” 2nd Edi- tion, John Willey & Sons Inc., Hoboken, 1995.
[7] M. Rashid, “Power Electronics: Circuits, Devices and Applications,” Pearson/Prentice Hall, Upper Saddle River, 2003.
le resistor, whoue of the matchiking converter t
ieve this goal, concept h
osed an hly st ugh a detailed ms
-
g d-er
[8] J. S. Jiang and J. Holtz, “An Efficient Braking Method for Controlled AC Drives with a Diode Rectifier Front End,” IEEE Transactions on Industry Applications, Vol. 37, No. 5, 2001, pp. 1299-1307. doi:10.1109/28.952505
be tive—in ter regupp
cially if thd
ains indusing interval following
st er: desig lem of the brak
m o operating mo o l loop in or
odulation. rph f filtering will
e w em will becom
creased or decreased just by adding or removing modules.
The external setting of the equivalent resistance, en-tering data for the settable braking time, free braking time and the moment of inertia of the industrial load. In this way the optimum RBr value can be calculated and set, cancelling so the need for a control loop that ininverters is not accessible but instead that a braking leg is available).
9. Acknowledgements
This wof small and mediunological developm23SMEs2009 and funded by the European social fund and by national funds.
REFERENCES [1] N. Papanikolaou and Th. Ikonomakis, “Investigation of
the Optimum Power Electronic Converter Topology for Reactive Power Compensation and Breaking Energy Ex-ploitation for Industrial Processes,” 2012.
[2] LG Inverters, Series iC5, iG5A, iS5, iP5A & iH, Techni-cal Reference, 2012. www.pconvent.ru/download/LG_iC5_Manual_ENG.pdf
[3] AuCom Series EMX3, Technical Reference, 2012. http://www.aucom.com/images/stories/aucom_resource_files/brochures/EMX3_Brochure.pdf
[4] Mitsubishi Inverters. http://www.mitsubishi-automation.com/products/inverters
[9] M. Rastogi and P. W. Hammond, “Dual-Frequency Brak- ing in AC Drives,” IEEE Transactions on Power Elec- tronics, Vol. 17, No. 6, 2002, pp. 1032-1040. doi:10.1109/TPEL.2002.805613
[10] P. J. Grbovic, P. Delarue, P. Le Moigne and P. Bar- citor-Based Regenerative Con-
Power-Smoothing Capabil- tholomeus, “The Ultracapatrolled Electric Drives with
Copyright © 2013 SciRes. EPE

N. PAPANIKOLAOU ET AL.
Copyright © 2013 SciRes. EPE
473
ity,” IEEE Transactions on Industrial Electronics, Vol. 59, No. 12, 2012, pp. 4511-4522. doi:10.1109/TIE.2011.2181129
[11] S. Chapman, “Electric Machinery Fundamentals,” Mc- Graw-Hill, New York, 2000.
[12] G. Notton, V. Lazarov and L. Stoyanov, “Optimal Sizing of a Grid-Connected PV STechnologies r Efficiency Char-
ystem for Various PV Module and Inclinations, Inverte
acteristics and Locations,” Renewable Energy, Vol. 35, 2010, pp. 541-554. doi:10.1016/j.renene.2009.07.013
[13] A. Adinolfi, R. Lamedica, C. Modesto, A. Prudenzi and S. Vimercati, “Experimental Assessment of Energy Saving Due to Trains Regenerative Braking in an ElectrifiedSubway Line,” IEEE Transactions on Power Delivery,
Vol. 13, No. 4, 1998, pp. 1536-1542. doi:10.1109/61.714859
[14] H. Seki, K. Ishihara and S. Tadakuma, “Novetive Braking Control of Electric Power-Assisted W
l Regenera- heel-
chair for Safety Downhill Road Driving,” IEEE Transac- tions on Industrial Electronics, Vol. 56, No. 5, 2009, pp. 1393-1400. doi:10.1109/TIE.2009.2014747
[15] M.-J. Yang, H.-L. Jhou, B.-Y. Ma and K.-K. Shyu, “A Cost-Effective Method of ElectrRegeneration for Electric Vehic
ic Brake with Energy les,” IEEE Transactions
015356on Industrial Electronics, Vol. 56, No. 6, 2009, pp. 2203- 2212. doi:10.1109/TIE.2009.2