Embed Size (px)
Citation preview

Ther
mal
Ana
lysi
s Ex
celle
nce
DMA 1STARe System
Innovative Technology
Versatile Modularity
Swiss Quality
Dynamic Mechanical AnalysisComprehensive Materials Characterization
2
Multipurpose DMA the Perfect Solution for Materials Analysis
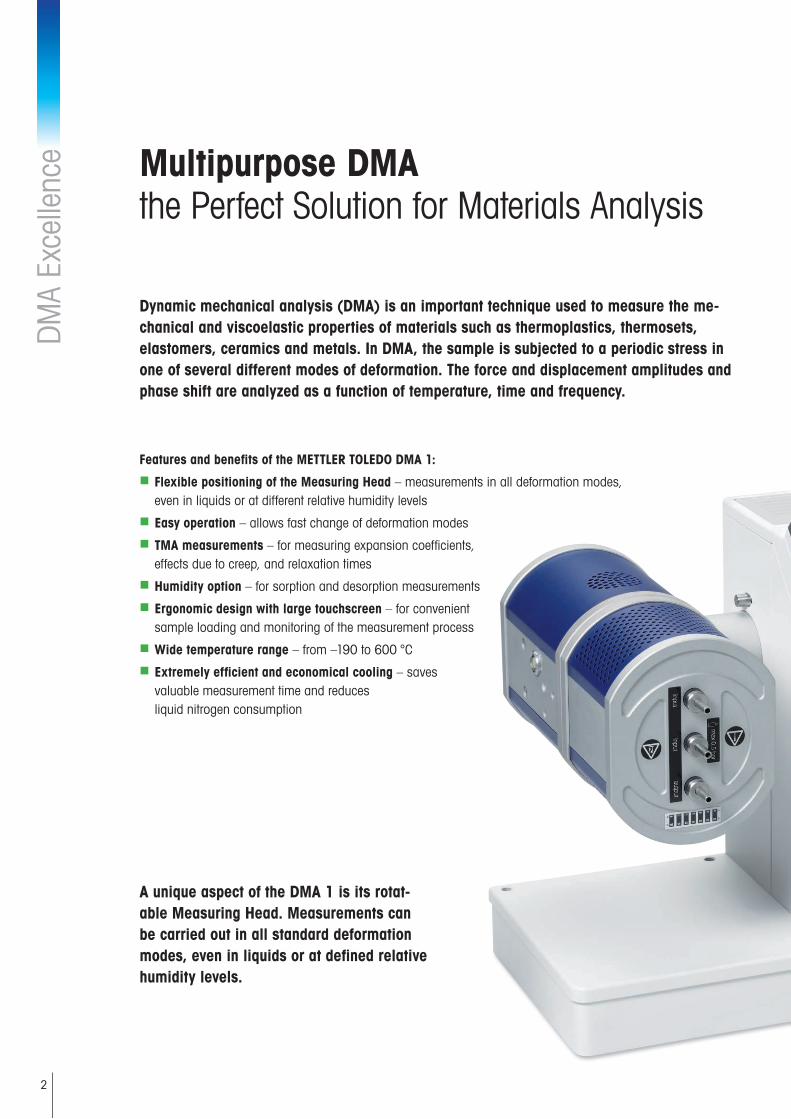
Dynamic mechanical analysis (DMA) is an important technique used to measure the me-chanical and viscoelastic properties of materials such as thermoplastics, thermosets, elastomers, ceramics and metals. In DMA, the sample is subjected to a periodic stress in one of several different modes of deformation. The force and displacement amplitudes and phase shift are analyzed as a function of temperature, time and frequency.
Features and benefits of the METTLER TOLEDO DMA 1:
n Flexible positioning of the Measuring Head – measurements in all deformation modes, even in liquids or at different relative humidity levels
n Easy operation – allows fast change of deformation modes
n TMA measurements – for measuring expansion coefficients, effects due to creep, and relaxation times
n Humidity option – for sorption and desorption measurements
n Ergonomic design with large touchscreen – for convenient sample loading and monitoring of the measurement process
n Wide temperature range – from –190 to 600 °C
n Extremely efficient and economical cooling – saves valuable measurement time and reduces liquid nitrogen consumption
DM
A Ex
celle
nce
A unique aspect of the DMA 1 is its rotat-able Measuring Head. Measurements can be carried out in all standard deformation modes, even in liquids or at defined relative humidity levels.

3
Unmatched Versatility the Optimum Configuration for All Applications
The unparalleled versatility of the DMA 1 allows applications to be performed in the optimum measurement configuration. The DMA 1 is quick and easy to set up, whether for conventional DMA analyses, experiments using static forces or measurements in liquids.
Measurements at controlled relative humidityThe Humidity option consists of a special humidity chamber, a circulating heating bath and a humidity generator. It allows you to perform measure-ments under optimum conditions in every deformation mode. Special readjustment is not necessary after installing the humidity chamber.
Measurements with static forcesBesides the dynamic mode, the DMA 1 permits measurements to be per-formed using static forces (TMA mode). All the deformation modes avail-able for DMA can be used.
Typical TMA applications include:
• Determination of coefficients of thermal expansion• Creep and recovery experiments• Stress-strain diagrams• Deformation-relaxation diagrams• Softening temperature of materials
Measurements in liquidsThe Fluid Bath option allows you to perform DMA or TMA experiments in liquids using all the standard deformation modes. The entire sample holder and sample is immersed in the liquid. The Fluid Bath option consists of a special immersion bath and external temperature control using a circulat-ing heating bath or chiller.
4
TGADSC Flash DSC TMADMA
Rapid Results Thanks to Many Innovations
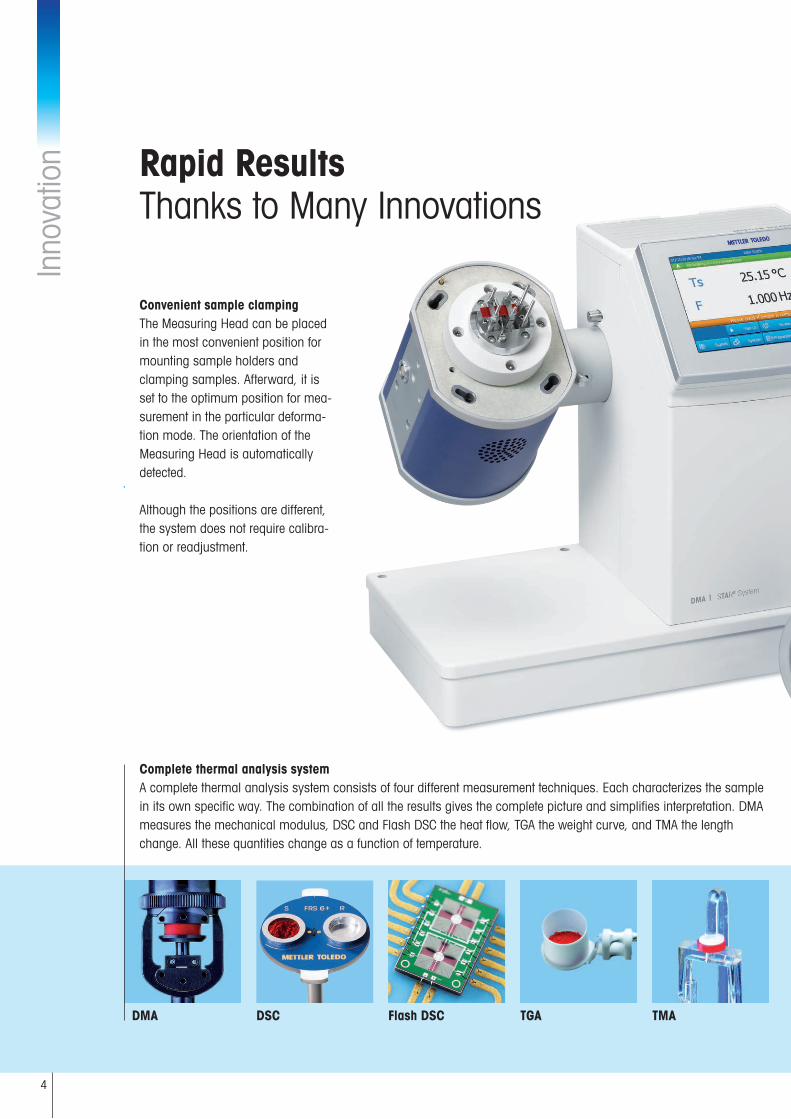
Convenient sample clampingThe Measuring Head can be placed in the most convenient position for mounting sample holders and clamping samples. Afterward, it is set to the optimum position for mea-surement in the particular deforma-tion mode. The orientation of the Measuring Head is automatically detected.
Although the positions are different, the system does not require calibra-tion or readjustment.
Complete thermal analysis systemA complete thermal analysis system consists of four different measurement techniques. Each characterizes the sample in its own specific way. The combination of all the results gives the complete picture and simplifies interpretation. DMA measures the mechanical modulus, DSC and Flash DSC the heat flow, TGA the weight curve, and TMA the length change. All these quantities change as a function of temperature.
Inno
vatio
n
5
Matching accessoriesThe Accessory Box contains all the sample holders and sample clamps needed for mounting sample holders and the temperature sensor. The Calibration Box includes all the materials required for performing individu-al temperature adjustments. This is a key factor for achieving precise and reliable measurement results.
Perfectly DesignedDown to the Last Detail
Titanium sample clampsSample clamps are extremely im-portant for precise measurements. The DMA 1 clamps are made of a titanium alloy. This offers the fol-lowing advantages:• The natural resonant frequency
of the system is shifted to higher frequencies due to the low weight of the clamps.
• The clamps are very resistant to corrosion because titanium forms an inert oxide layer in contact with air. This is especially ad-vantageous for measurements in liquids.
• The clamps can be heated or cooled more quickly because the thermal conductivity of titanium is better than that of most other potentially suitable materials.
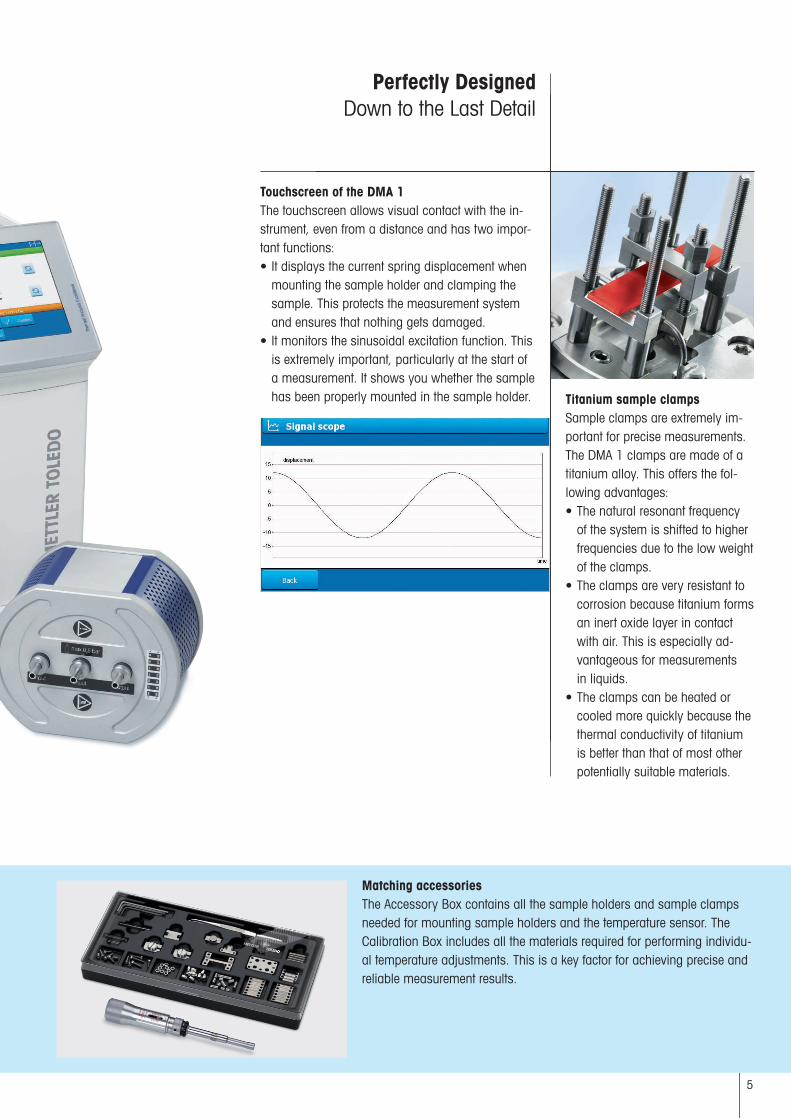
Touchscreen of the DMA 1The touchscreen allows visual contact with the in-strument, even from a distance and has two impor-tant functions:• It displays the current spring displacement when
mounting the sample holder and clamping the sample. This protects the measurement system and ensures that nothing gets damaged.
• It monitors the sinusoidal excitation function. This is extremely important, particularly at the start of a measurement. It shows you whether the sample has been properly mounted in the sample holder.

6
Measuring principle In dynamic mechanical analysis (DMA), the sample is subjected to an oscillating force and the result-ing displacement amplitude is measured. The phase shift between the force and displacement signal is derived from the time lag be-tween the two curves.
Accurate displacement measurementsA key component of the DMA 1 is the LVDT (Linear Variable Differen-tial Transformer). The LVDT mea-sures changes in length over the entire measurement range of ±1 mm with a mean resolution of 2 nm. It is fitted near the sample to minimize any influences caused by deformation of the measuring sys-tem. This improves the accuracy of the measurement of the time lag (the phase shift) between the force and displacement.
Sample with Pt100The Pt100 temperature sensor is positioned as close as possible to the sample. Temperature adjustment in the desired deformation mode ensures that temperatures are correctly measured.
Swis
s Q
ualit
y
Key1 LN2 inlet/outlet
2 Heater element
3 Sample holder
4 Sample
5 Drive shaft
6 LVDT displacement sensor
7 Drive motor
8 Drive shaft guidance (spring)
Reliable, First Class Performanceover the Whole Temperature Range

7
A B C
D E F
Optimized Sample Holder Convenient and Easy Handling
The DMA 1 offers a choice of six different deformation modes. The most suitable mode for a particular application depends on the infor-mation required and the nature and geometry of the sample. The stiff-ness of the sample must be chosen so that it is appreciably lower than that of the measuring system. All six deformation modes can be used for dynamic and static mea-surements.
An important aspect of the sample holder system is the ease with which the sample length can be adjusted in the sample holder. The relevant length can be set in steps of 2.5 mm from the minimum length defined for the particular mode up to the maximum length. Sample lengths can also be contin-uously set using special screws.
The different deformation modes
3-point bending (A): This mode is used for accurate measurements of very stiff samples, such as composite materials or thermosets, particu-larly below the glass transition temperature. It is also very important for TMA measurements.Single cantilever bending (B): This mode is excellent for bar-shaped materials (metals, polymers) that display a high degree of stiffness. The single cantilever approach is ideal for measurements below the glass transition temperature and is the recommended mode for deter-mining the loss factor (tan delta) of powdery materials.Dual cantilever bending (C): This mode is suitable for softer materials with a lower degree of stiffness, in particular thin samples such as films.Tension (D): This is the usual deformation mode for films or fibers. It is also very important for TMA measurements.Compression (E): The compression mode is used to measure foams, gels, and foodstuffs and for static force (TMA) measurements.Shear (F): The shear mode is ideal for soft samples, such as elasto-mers, pressure-sensitive adhesives and for studying curing reactions.
Deformation mode Max. effective sample length (mm) Max. effective sample width (mm) Standard head position (without liquid)
Single cantilever bending 17.5 13 horizontal
Dual cantilever bending 35 13 horizontal
3-point bending 45 13 vertical (pointing up)
Tension 20 13 horizontal
Deformation mode Max. sample diameter (mm) Max. sample thickness (mm) Standard head position (without liquid)
Shear 10 12 horizontal
Compression 10 16 vertical (pointing up)

8
Unsurpassed Cooling Capability Saves Valuable Measurement Time
Temperature range and cooling optionsThe cooling performance of the DMA 1 is very impressive. It cools the sample from room temperature to –190 °C in less than 10 minutes with an amazingly low consump-tion of liquid nitrogen – less than 1 liter for 3 cooling cycles to –100 °C. This saves both time and money because the container does not have to be refilled so often. The main advantage is increased sam-ple throughput.
If a measurement begins at room temperature (RT), the DMA 1 can be operated without a cooling option.
LN2 cooling 1 liter-Dewar 35 liter-Dewar
Temperature range –190 to 600 °C –190 to 600 °C
LN2 consumption for cooling once from RT to –190 °C
<1 liter LN2 ~1.8 liter LN2
LN2 consumption for cooling from RT to –100 °C
<0.3 liter LN2 <0.4 liter LN2
Time taken to cool from RT to –190 °C <10 min <15 min
Option DMA measurements TMA measurements Relative humidity Liquids
DMA 1 basic instrument All modes All modes All modes All modes
Cooling option 1-liter Dewar • •
Cooling option 35-liter Dewar • •
Humidity chamber •
Humidity generator •
Fluid bath •
Circulating heating bath or chiller • •

9
1.41.21.00.80.60.40.2
0– 0.2– 0.4– 0.6– 0.8–1.0–1.2
0 0.2
Time in s
Force in N
Force in NDisplacement in µm
0.4 0.6 0.8 1.0 1.2 1.4
∆
Flexible DMA for DMA and TMA Measurements
Thermomechanical measurementsThe design of the DMA 1 allows it to be used for TMA measurements (using a static force). The sample holders and sample clamps are at-tached in the same way as when performing DMA measurements. Some special types of TMA measurement include:• Creep/Recovery measurements The sample is suddenly subjected to a high static force. After a cer-
tain time, the force is removed and the recovery of the sample is measured as a function of time.
• Stress-Strain diagrams The tension (force per unit area acting on the sample) and resulting
strain are measured and plotted in a diagram. Typically, the initial portion of the curve is linear for low levels of deformation. The be-havior is more complex for larger deformation levels and is no longer linear up to the point at which the sample finally breaks.
• Deformation-Relaxation diagrams These isothermal measurements show how quickly a material de-
forms under a static force before a state of equilibrium is reached. This yields the resulting relaxation time.
DMA theory The modulus is calculated from the applied force am-plitude, Fa, the measured displacement amplitude, La, and the phase shift δ between the force and displace-ment signals. The types of modulus are:• Complex modulus, M*, (elastic modulus, E*,
for tension; G* for shear)• Storage modulus, M‘, (proportional to the energy
stored elastically and reversibly)• Loss modulus, M‘‘, (proportional to the energy trans-
formed into heat and irreversibly lost)
The modulus values can then be used to calculate the loss factor (tan δ), which corresponds to the ratio of M‘‘ to M‘. Completely elastic materials have a loss factor of 0, while purely viscous materials have an infinitely large loss factor (δ = 90°).
The moduli are calculated from the measured stiffness S (N/m) and the geometry factor g. S is the quantity actually determined. M‘ = |M*| cos δ M‘‘ = |M*| sin δ tan δ = M‘‘ / M‘|M*| = S*g = Fa/La*g; stiffness S = Fa/La
Force
Time
Force and displacement at a frequency, f, of 1Hz. The phase shift, δ, can be calculated from the time delay, ∆, using the equation δ = 2πf∆.
Force in NDisplacement in μm
Support and repairSupport and diagnosis in case of technical issues. Carrying out repairs at a customer's site or at one of our service centers.
Quality assurance and certificationQualification, documentation, calibration with certificate.
Performance services and preventive maintenanceProfessional installation (IQ, OQ) and ensuring optimum performance during the life-time of the instrument (PQ and preventive maintenance).
Training and applications supportProfessional applications support, basic and customized training courses, comprehensive applications literature.
10
DMA Provides Answers in Many Application Fields
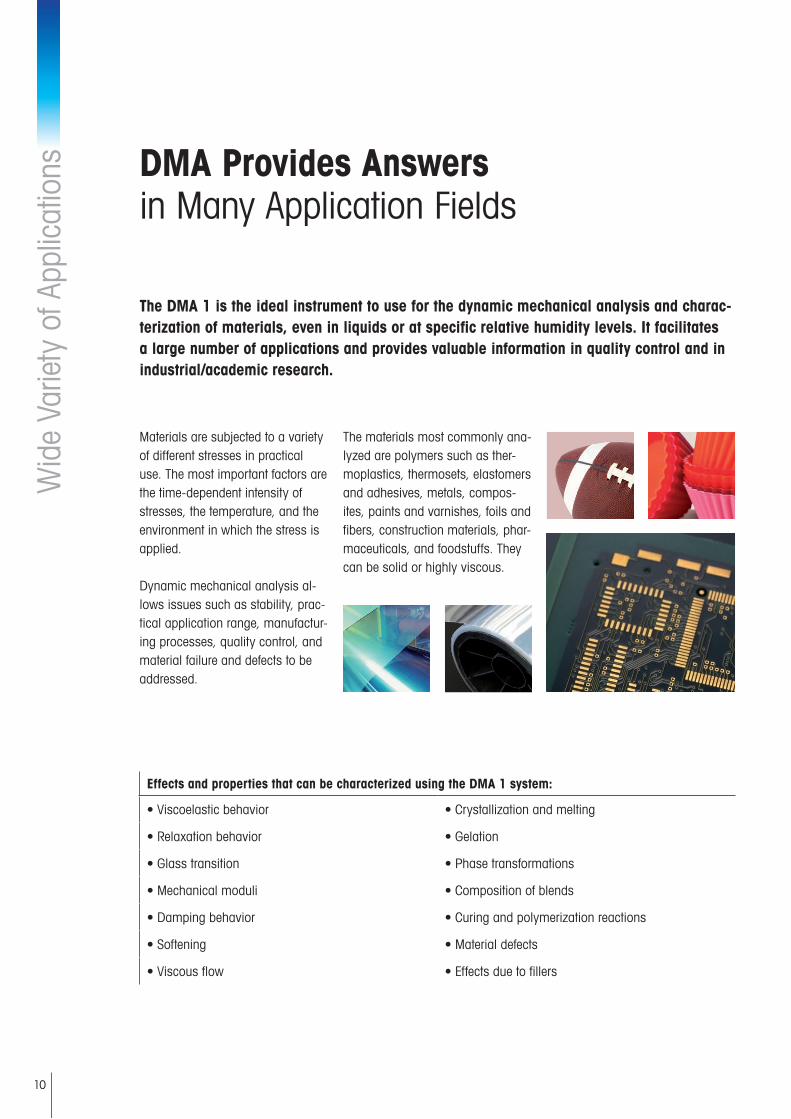
The DMA 1 is the ideal instrument to use for the dynamic mechanical analysis and charac-terization of materials, even in liquids or at specific relative humidity levels. It facilitates a large number of applications and provides valuable information in quality control and in industrial/academic research.
Materials are subjected to a variety of different stresses in practical use. The most important factors are the time-dependent intensity of stresses, the temperature, and the environment in which the stress is applied.
Dynamic mechanical analysis al-lows issues such as stability, prac-tical application range, manufactur-ing processes, quality control, and material failure and defects to be addressed.
The materials most commonly ana-lyzed are polymers such as ther-moplastics, thermosets, elastomers and adhesives, metals, compos-ites, paints and varnishes, foils and fibers, construction materials, phar-maceuticals, and foodstuffs. They can be solid or highly viscous.
Effects and properties that can be characterized using the DMA 1 system:
• Viscoelastic behavior • Crystallization and melting
• Relaxation behavior • Gelation
• Glass transition • Phase transformations
• Mechanical moduli • Composition of blends
• Damping behavior • Curing and polymerization reactions
• Softening • Material defects
• Viscous flow • Effects due to fillers
Wid
e Va
riety
of A
pplic
atio
ns

11
Composite materialsComposite materials made of filled cross-
linked polymers have a high storage modu-
lus at the temperature at which they are
used. The modulus is usually determined
by 3-point bending. The upper curve shows
the storage modulus of a printed circuit
board. The value measured at 70 °C and a
frequency of 1 Hz was 21.1 GPa. The curve
also shows the softening process at the
glass transition where the modulus falls
to less than 5 GPa. The step in the storage
modulus corresponds to the peak in the
loss factor, tan delta.
Phase transitions of PTFEThe DSC curve of PTFE shows phase transi-
tions at about −100 °C and +30 °C as well
as melting at 327 °C. The phase transitions
can also be measured by DMA in the
tension mode. The glass transition is then
observed in addition at +130 °C. The transi-
tion temperatures measured by the two
methods show excellent agreement.
PET film The diagram shows DMA curves of a PET
film measured in the tension mode at 1 Hz.
Curves like these are often used for quality
control purposes. Due to crystallinity, the
change in the modulus at the glass transi-
tion between 80 and 150 °C is only about
one decade. The modulus shows a further
decrease when melting begins at 230 °C.
The tan delta curve exhibits a relaxation
peak in the glass transition range. The bot-
tom curve is measured in the TMA mode
and shows the change in length of the film.
The slope changes at the glass transition
onset temperature of 95 °C. The film shrinks
between 210 and 230 °C.
12
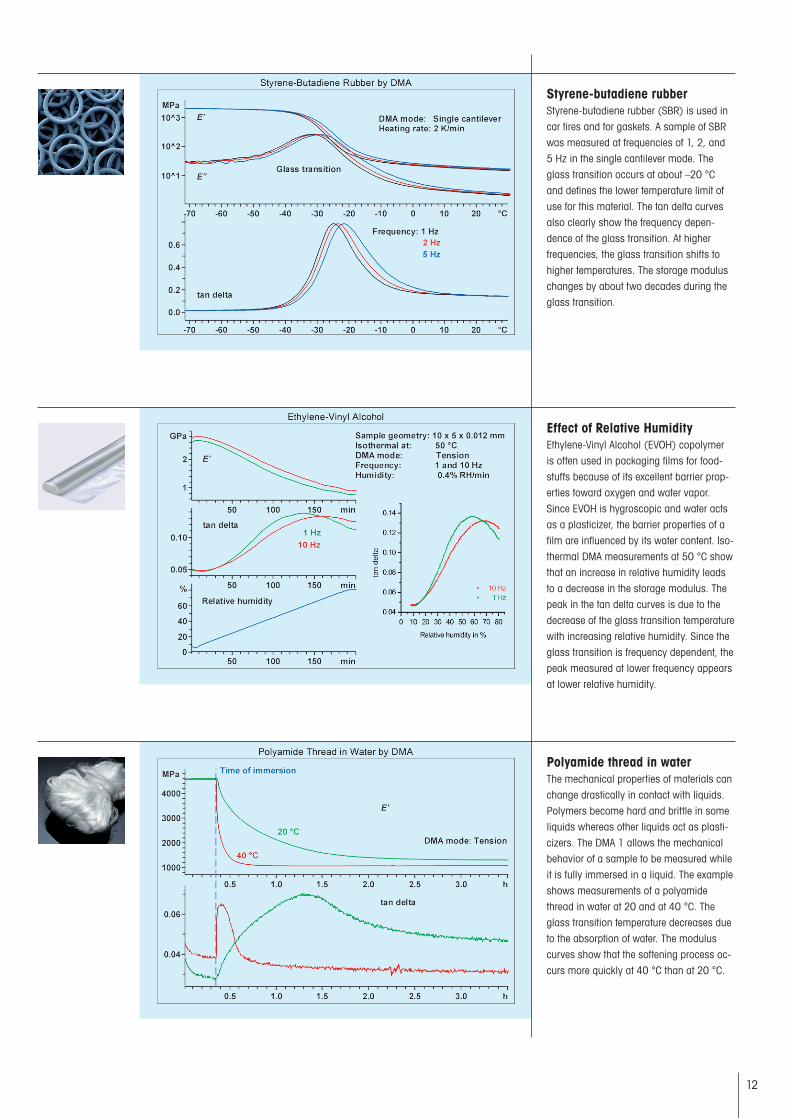
Styrene-butadiene rubberStyrene-butadiene rubber (SBR) is used in
car tires and for gaskets. A sample of SBR
was measured at frequencies of 1, 2, and
5 Hz in the single cantilever mode. The
glass transition occurs at about –20 °C
and defines the lower temperature limit of
use for this material. The tan delta curves
also clearly show the frequency depen-
dence of the glass transition. At higher
frequencies, the glass transition shifts to
higher temperatures. The storage modulus
changes by about two decades during the
glass transition.
Effect of Relative HumidityEthylene-Vinyl Alcohol (EVOH) copolymer
is often used in packaging films for food-
stuffs because of its excellent barrier prop-
erties toward oxygen and water vapor.
Since EVOH is hygroscopic and water acts
as a plasticizer, the barrier properties of a
film are influenced by its water content. Iso-
thermal DMA measurements at 50 °C show
that an increase in relative humidity leads
to a decrease in the storage modulus. The
peak in the tan delta curves is due to the
decrease of the glass transition temperature
with increasing relative humidity. Since the
glass transition is frequency dependent, the
peak measured at lower frequency appears
at lower relative humidity.
Polyamide thread in waterThe mechanical properties of materials can
change drastically in contact with liquids.
Polymers become hard and brittle in some
liquids whereas other liquids act as plasti-
cizers. The DMA 1 allows the mechanical
behavior of a sample to be measured while
it is fully immersed in a liquid. The example
shows measurements of a polyamide
thread in water at 20 and at 40 °C. The
glass transition temperature decreases due
to the absorption of water. The modulus
curves show that the softening process oc-
curs more quickly at 40 °C than at 20 °C.
13
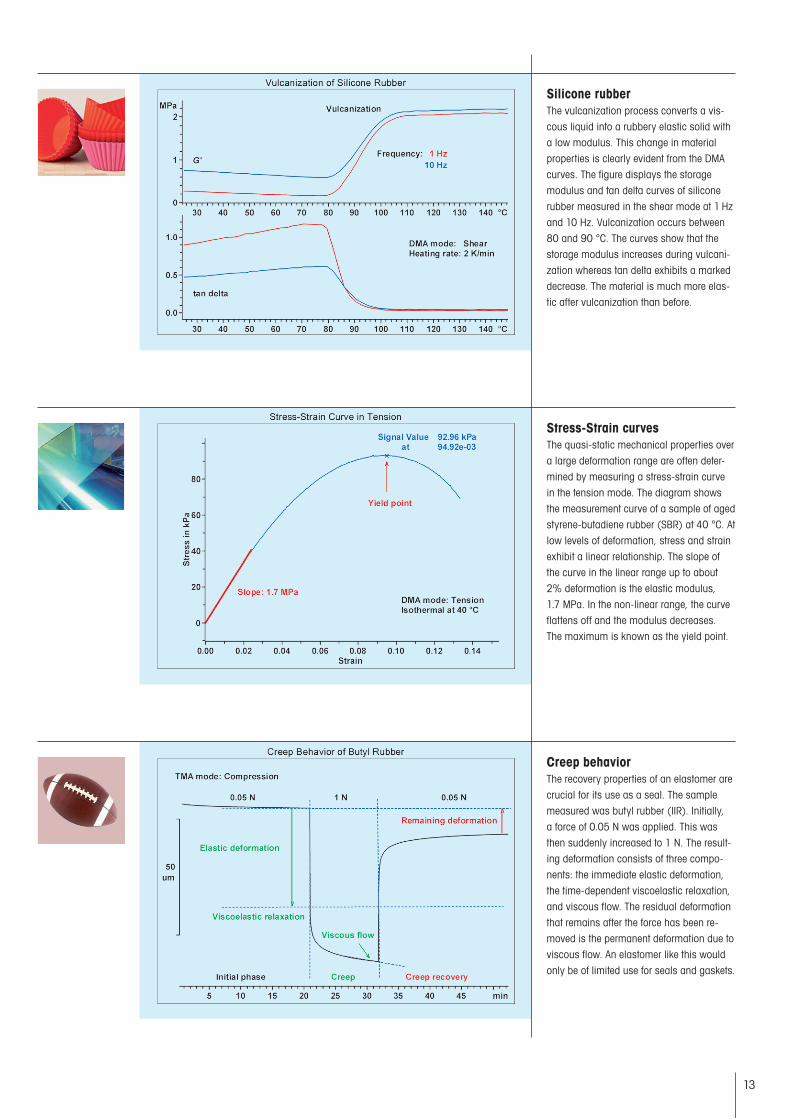
Silicone rubberThe vulcanization process converts a vis-
cous liquid into a rubbery elastic solid with
a low modulus. This change in material
properties is clearly evident from the DMA
curves. The figure displays the storage
modulus and tan delta curves of silicone
rubber measured in the shear mode at 1 Hz
and 10 Hz. Vulcanization occurs between
80 and 90 °C. The curves show that the
storage modulus increases during vulcani-
zation whereas tan delta exhibits a marked
decrease. The material is much more elas-
tic after vulcanization than before.
Stress-Strain curvesThe quasi-static mechanical properties over
a large deformation range are often deter-
mined by measuring a stress-strain curve
in the tension mode. The diagram shows
the measurement curve of a sample of aged
styrene-butadiene rubber (SBR) at 40 °C. At
low levels of deformation, stress and strain
exhibit a linear relationship. The slope of
the curve in the linear range up to about
2% deformation is the elastic modulus,
1.7 MPa. In the non-linear range, the curve
flattens off and the modulus decreases.
The maximum is known as the yield point.
Creep behaviorThe recovery properties of an elastomer are
crucial for its use as a seal. The sample
measured was butyl rubber (IIR). Initially,
a force of 0.05 N was applied. This was
then suddenly increased to 1 N. The result-
ing deformation consists of three compo-
nents: the immediate elastic deformation,
the time-dependent viscoelastic relaxation,
and viscous flow. The residual deformation
that remains after the force has been re-
moved is the permanent deformation due to
viscous flow. An elastomer like this would
only be of limited use for seals and gaskets.

www.mt.com/DMA
DMA 1 Specifications
Mettler-Toledo GmbH, AnalyticalCH-8603 Schwerzenbach, SwitzerlandTel. +41 44 806 77 11Fax +41 44 806 72 60
Subject to technical changes© 02/2016 Mettler-Toledo GmbH, 30129289AMarketing MatChar / MarCom Analytical
For more information
Quality certificate. Development, production and testing according to ISO 9001.
Environmental management system according to ISO 14001.
“European conformity”. The CE conformity mark provides you with the assurance that our products comply with the EU directives.
Temperature dataTemperature range –190 to 600 °C
Technical resolution 0.1 K
Temperature accuracy 0.75 K
Heating rate 0.1 to 20 K/min
Cooling rate 0.1 to 30 K/min
Force dataForce range ±0.001 to ±10 N
Technical resolution 0.25 mN
Sensitivity 1 mN
Displacement dataDisplacement range ±1 mm
Technical resolution 2 nm
Sensitivity 30 nm
StiffnessStiffness range 50 to 105 N/m
Precision 0.50%
Tan deltaTan delta range 0.0001 to 50
Technical resolution 0.00001
Sensitivity 0.0001
FrequencyFrequency range 0.001 to 300 Hz
Technical resolution 0.0001 Hz
Accuracy 0.001 Hz
Frequency modes • Logarithmic and linear scans• Multi-frequency (sequentially)
Maximum sample lengthSample length 55 mm
Fluid Bath OptionTemperature range –20 to 200 °C
Humidity OptionTemperature range 5 to 85 °C
Humidity range 5% to 95% RH
ApprovalsIEC/EN61010-1:2001, IEC/EN61010-2-010:2003CAN/CSA-C22.2 No. 61010-1-04 & -2-010UL Std. No. 61010-1 (2nd Edition)IEC61326-1:2005 / EN61326-1:2006 (class B)IEC61326-1:2005 / EN61326-1:2006 (Industrial Environment)FCC, Part 15, class AAS/NZS CISPR 22, AS/NZS 61000.4.3Conformity Mark: CE