Embed Size (px)
Citation preview
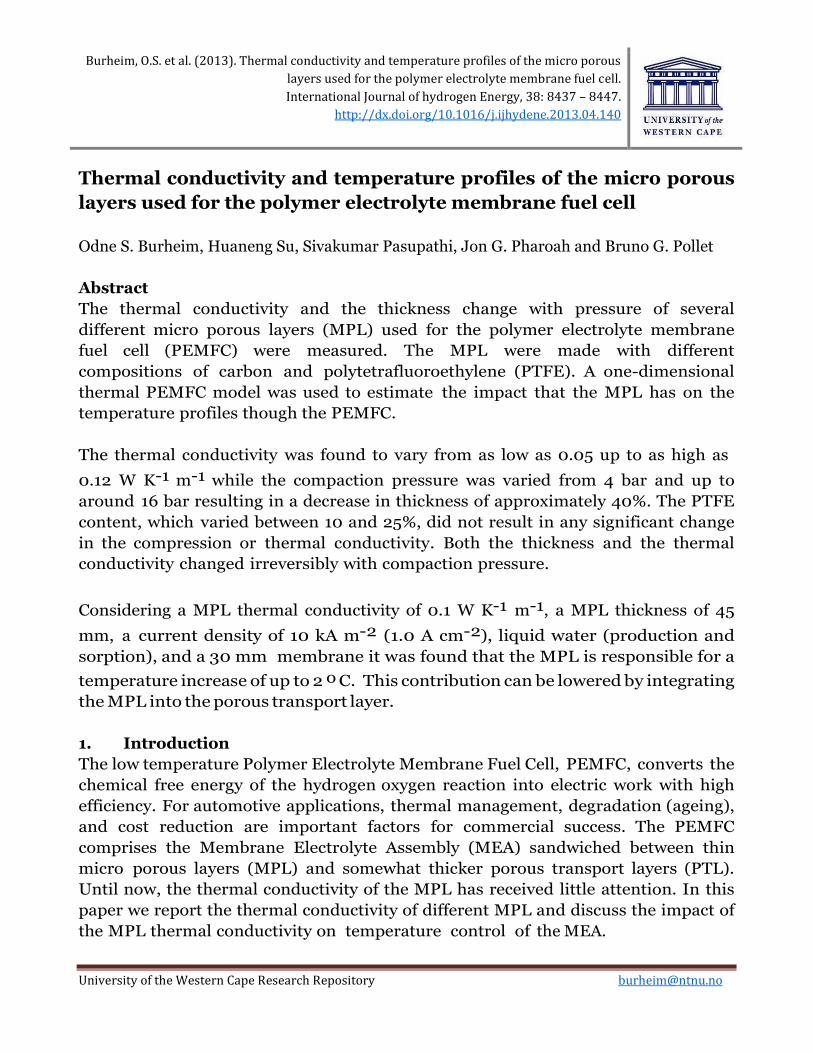
Burheim, O.S. et al. (2013). Thermal conductivity and temperature profiles of the micro porous
layers used for the polymer electrolyte membrane fuel cell.
International Journal of hydrogen Energy, 38: 8437 – 8447.
http://dx.doi.org/10.1016/j.ijhydene.2013.04.140
University of the Western Cape Research Repository [email protected]
Thermal conductivity and temperature profiles of the micro porous
layers used for the polymer electrolyte membrane fuel cell
Odne S. Burheim, Huaneng Su, Sivakumar Pasupathi, Jon G. Pharoah and Bruno G. Pollet
Abstract
The thermal conductivity and the thickness change with pressure of several
different micro porous layers (MPL) used for the polymer electrolyte membrane
fuel cell (PEMFC) were measured. The MPL were made with different
compositions of carbon and polytetrafluoroethylene (PTFE). A one-dimensional
thermal PEMFC model was used to estimate the impact that the MPL has on the
temperature profiles though the PEMFC.
The thermal conductivity was found to vary from as low as 0.05 up to as high as
0.12 W K-1 m-1 while the compaction pressure was varied from 4 bar and up to
around 16 bar resulting in a decrease in thickness of approximately 40%. The PTFE
content, which varied between 10 and 25%, did not result in any significant change
in the compression or thermal conductivity. Both the thickness and the thermal
conductivity changed irreversibly with compaction pressure.
Considering a MPL thermal conductivity of 0.1 W K-1 m-1, a MPL thickness of 45
mm, a current density of 10 kA m-2 (1.0 A cm-2), liquid water (production and
sorption), and a 30 mm membrane it was found that the MPL is responsible for a
temperature increase of up to 2 o C. This contribution can be lowered by integrating
the MPL into the porous transport layer.
1. Introduction
The low temperature Polymer Electrolyte Membrane Fuel Cell, PEMFC, converts the
chemical free energy of the hydrogen oxygen reaction into electric work with high
efficiency. For automotive applications, thermal management, degradation (ageing),
and cost reduction are important factors for commercial success. The PEMFC
comprises the Membrane Electrolyte Assembly (MEA) sandwiched between thin
micro porous layers (MPL) and somewhat thicker porous transport layers (PTL).
Until now, the thermal conductivity of the MPL has received little attention. In this
paper we report the thermal conductivity of different MPL and discuss the impact of
the MPL thermal conductivity on temperature control of the MEA.
2
1.1. Heat and work of the PEMFC
The PEMFC is not only a very efficient energy converter, but also a very effective
one. However, when increasing the current density (reaction rate), the reversible
and irreversible heat release increases as well. This is for at least three reasons [1e7].
The temperature multiplied by the change in the reaction entropy and the current
divided by the Faraday constant (TDSj/nF ) is a reversible and inevitable heat source
in a PEMFC. The Tafel (or ButlereVolmer) equation predicts that increased current
densities necessarily result in additional losses, i.e. a reduction in the cell potential
by an over-potential, h, with a corresponding heat release. This is the origin of the
second heat source which is numerically the product of the current and the over-
potential (hj ) [8]. Finally, the Joule or ohmic heat is due to ohmic resistance (RUj
), most significantly in the membrane, and is given by RUj2.
According to Fourier’s law of heat conduction, this heat release necessarily results
in temperature gradients inside the PEMFC. Because almost all the heat sources
are associated with the MEA, the thermal conductivity of the PTL and the MPL is
more important than the thermal conductivity of the MEA itself. This is because
these porous layers literally provide thermal insulation for the MEA. Whereas
many of the mechanical properties and the thermal conductivity of the PTL is
now starting to be understood and thoroughly investigated, the MPL thermal
conductivity is not as well addressed [9e11]. What is known, is that for some
combinations of MPL and PTL the average or combined effective thermal
conductivity is not significantly different [12,13]. One reason why the pure MPL
thermal conductivity is overlooked can be related to the fact that the MPL is one
order of magnitude thinner than the PTL. However, in this paper we demonstrate
that the thermal conductivity is also one order of magnitude larger for the MPL
compared to some types of PTL. Because of this relation, the thermal conductivity
of these two materials are equally important.
1.2. The role of the MPL in a PEMFC
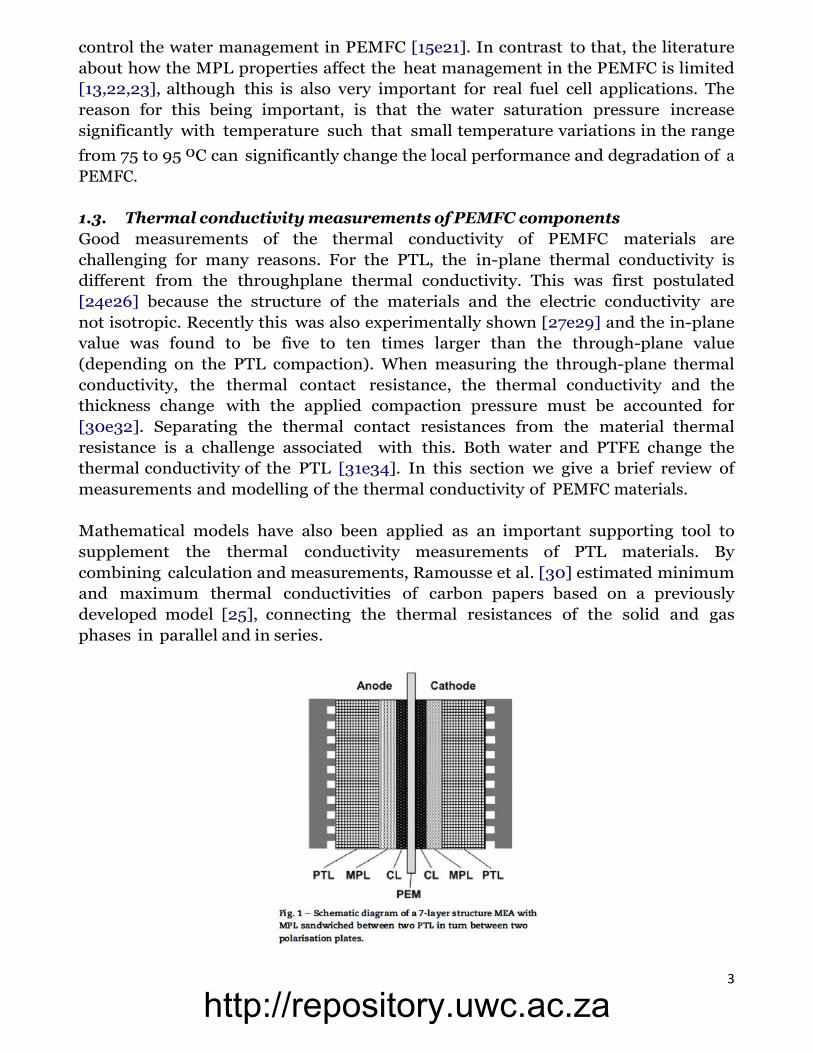
Often a MPL is included in the MEA structure, between each backing layer (i.e. PTL)
and catalyst layer (CL), as illustrated in Fig. 1. The MPL consists of carbon black
powder and a hydrophobic agent, usually polytetrafluoroethylene (PTFE). The
function of the MPL is to provide proper pore structure and hydrophobicity to allow
a better gas transport and water removal from the CLs, and also to minimise
electric contact resistance between the CL and the macroporous PTL substrate
(usually carbon paper or carbon cloth) by forming a flat and uniform layer [14].
With respect to the importance of achieving high performance of PEMFC,
extensive work has been performed to examine how the MPL properties such as
(i) carbon powder type, (ii) carbon loading (or thickness), and (iii) PTFE content
http://repository.uwc.ac.za
3
control the water management in PEMFC [15e21]. In contrast to that, the literature
about how the MPL properties affect the heat management in the PEMFC is limited
[13,22,23], although this is also very important for real fuel cell applications. The
reason for this being important, is that the water saturation pressure increase
significantly with temperature such that small temperature variations in the range
from 75 to 95 oC can significantly change the local performance and degradation of a
PEMFC.
1.3. Thermal conductivity measurements of PEMFC components
Good measurements of the thermal conductivity of PEMFC materials are
challenging for many reasons. For the PTL, the in-plane thermal conductivity is
different from the throughplane thermal conductivity. This was first postulated
[24e26] because the structure of the materials and the electric conductivity are
not isotropic. Recently this was also experimentally shown [27e29] and the in-plane
value was found to be five to ten times larger than the through-plane value
(depending on the PTL compaction). When measuring the through-plane thermal
conductivity, the thermal contact resistance, the thermal conductivity and the
thickness change with the applied compaction pressure must be accounted for
[30e32]. Separating the thermal contact resistances from the material thermal
resistance is a challenge associated with this. Both water and PTFE change the
thermal conductivity of the PTL [31e34]. In this section we give a brief review of
measurements and modelling of the thermal conductivity of PEMFC materials.
Mathematical models have also been applied as an important supporting tool to
supplement the thermal conductivity measurements of PTL materials. By
combining calculation and measurements, Ramousse et al. [30] estimated minimum
and maximum thermal conductivities of carbon papers based on a previously
developed model [25], connecting the thermal resistances of the solid and gas
phases in parallel and in series.
http://repository.uwc.ac.za
4
Sadeghi et al. [26] reported an analytical model to predict thermal conductivity
based on the material structure, simplified by assuming a basic repeating structure.
Recently, Yablecki et al. reported a model of thermal conductivity including PTFE
under various loads [35].
Together with precise thickness measurements, determining the thermal
contact resistances between the apparatus and the samples and also between the
samples when stacked are the most important elements when conducting
thermal conductivity measurements [30]. Ramousse et al. stated that the
contact resistance should be bound by the resistance of layers of either air or
carbon of the thickness of an individual PTL fibre. Previously we reported the
contact resistance to be approximately 2 x 10⁻⁴ m2 K W-1 [31] which, if
considering a fibre thickness of about 5 mm, refers to a thermal conductivity of the
contact region close to 0.025 W K-1 m-1. This value is the same as for air. When
stacking any samples in the measurement, a new contact resistance emerges e
namely the sampleesample contact resistance. The challenge associated with this
resistance is that for every added sample one also adds one more sampleesample
contact resistance. This procedure is often done to change the thickness of the
sample so that one can find the ratio between the thickness and the thermal
resistance of the material or the thermal conductivity. However, since one also
increases the sampleesample contact resistance there are more unknowns than
equations. In several measurements we have shown that the sampleesample
thermal contact resistance is in fact negligible [12,31]. Regardless of this, we
include an appendix, A, to justify which thermal contact resistances are
significant.
The first in-situ measurement for the through-plane thermal conductivity was
reported by Vie et al. [36]. Embedding thermo-couples in the gas channels and
between the membrane and the catalyst layer and accounting for the known heat
release, a thermal conductivity of 0.19 ± 0.05 W K-1 m-1 for an ETEK ELAT PTL was
estimated. The first ex-situ experiments of thermal resistance (of the sample and the
contact to the apparatus) were reported by Ihonen et al. [37]. Khandelwal and Mench
[34] reported the first ex-situ measurements of PTL materials where the thermal
conductivity and the thermal contact resistance to the apparatus was de-
convoluted. In this study, the compression, and thus the actual thickness, was not
measured - lowering the precision of the reported values. Ramousse et al. [4]
used a similar approach. Their apparatus applied copper plates at the end of each
cylinder, sandwiching the investigated sample. Using this experimental set-up,
different PTL materials provided by Toray (3 different thicknesses) and SIGRACET
were tested by measuring the thermal resistance of stacks of samples. The first
report on ex-situ measurements accounting all of the three parameters required by
Fourier’s law and as a function of compaction pressures was that of Burheim et al.
http://repository.uwc.ac.za
5
[31]. When correcting for the actual thickness due to the compression, the
reported thermal conductivity values change by 5e20%. Perhaps the most important
part of this study was that we demonstrated that the PTLePTL contact thermal
resistance was negligible such that stacks of samples could legitimately be used
to vary the sample thickness and to separate the through-plane thermal
conductivity from the contact resistance with the apparatus.
When the temperature changes, the material properties can also change. The
change in thermal conductivity with temperature of PTL (both in- and through-
plane) was measured by Zamel et al. [29,38]. For the through-plane thermal
conductivity with thickness controlled compression; it was found that at 16%
compression (unknown compaction pressure) the thermal conductivity of the PTL,
regardless of PTFE content, does not depend significantly on temperature [38]. For
the in-plane thermal conductivity it was found that for PTFE free PTLs the thermal
conductivity is lowered by w50% when comparing values measured at room
temperature to values from measurements undertaken at 60 oC and higher [29].
For the PTFE treated samples, the in-plane thermal conductivity is nearly unaffected
in the range of -20 to þ120 o C, respectively [29]. This is similar to what
Khandelwal reported for Nafion [34].
The most recent contributions to the knowledge of thermal conductivity of the PTL is
the effect of ageing [12] and the role of the so called heat pipe effect in PTLs [33].
Ageing removes PTFE in the PTL. The PTFE appears to be removed only at the
locations away from fibre-to-fibre contact such that the thermal conductivity of the
dry PTL remains unaffected. However, the ageing makes the PTLs more susceptible
to water and therefore the thermal conductivity of aged wet PTLs is higher than that
of pristine wet PTLs [12]. Another subject that is recently reported on is the heat-
pipe-effect. This is the effect of heat transported by vaporisation and condensation
in a porous (or a pipe) in a thermal gradient. When PTLs are wet and at
temperatures above 70 o C the thermal conductivity of the PTL is increased by
20e40% [33].
In many of the first studies, the thermal conductivity of the PTL, the MPL coated PTL
and the membrane (Nafion) was reported [31,34]. Recently, Unsworth et al. reported
a study on SolviCore PTLs with and without MPL [13]. The study shows that adding
the MPL to the PTL only slightly lowered the effective thermal conductivity of the
layer and only at higher compaction. Later, for Sigracet carbon papers, it was
found that the MPL coating does not significantly change the overall effective
thermal conductivity [12]. The thermal conductivity of the MPL in itself without the
supporting PTL is still not (to our knowledge) studied and reported. For the first
time we study and report the thermal conductivity and compression of the MPL in
the absence of the PTL substrate. We are also for the first time, to our knowledge,
discussing how the temperature profile is affected by the MPL properties.
http://repository.uwc.ac.za
6
2. Theory and experimental
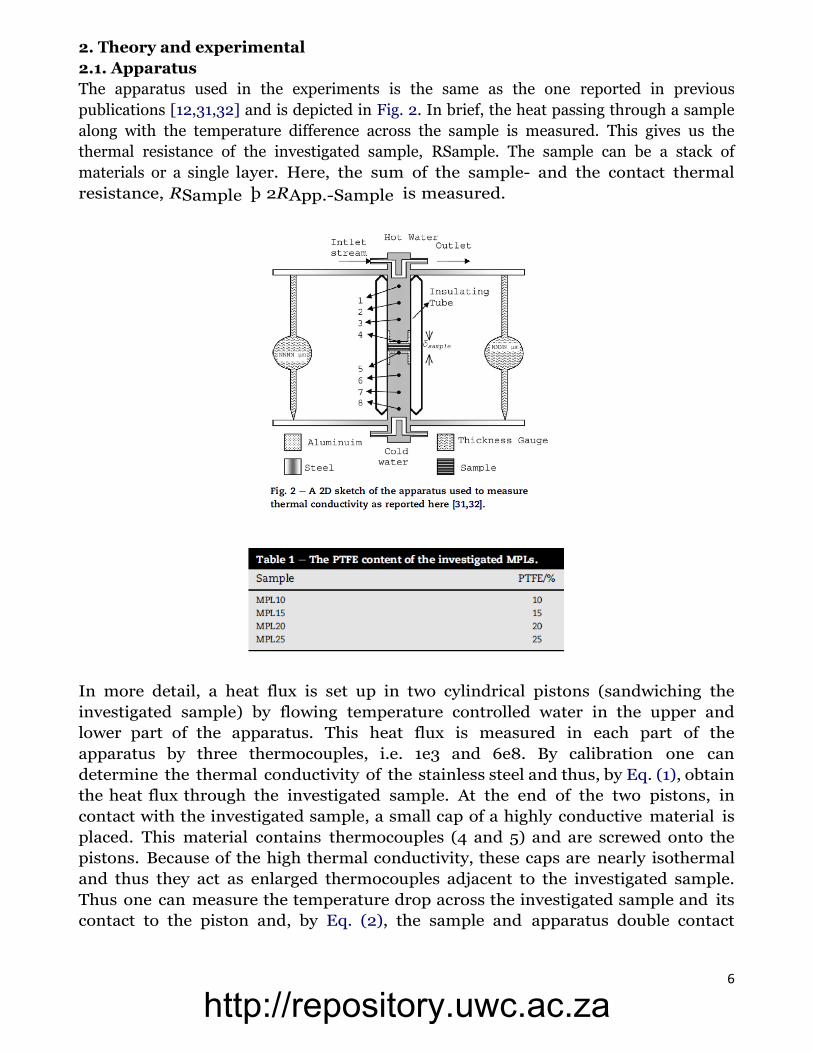
2.1. Apparatus
The apparatus used in the experiments is the same as the one reported in previous
publications [12,31,32] and is depicted in Fig. 2. In brief, the heat passing through a sample
along with the temperature difference across the sample is measured. This gives us the
thermal resistance of the investigated sample, RSample. The sample can be a stack of
materials or a single layer. Here, the sum of the sample- and the contact thermal
resistance, RSample þ 2RApp.-Sample is measured.
In more detail, a heat flux is set up in two cylindrical pistons (sandwiching the
investigated sample) by flowing temperature controlled water in the upper and
lower part of the apparatus. This heat flux is measured in each part of the
apparatus by three thermocouples, i.e. 1e3 and 6e8. By calibration one can
determine the thermal conductivity of the stainless steel and thus, by Eq. (1), obtain
the heat flux through the investigated sample. At the end of the two pistons, in
contact with the investigated sample, a small cap of a highly conductive material is
placed. This material contains thermocouples (4 and 5) and are screwed onto the
pistons. Because of the high thermal conductivity, these caps are nearly isothermal
and thus they act as enlarged thermocouples adjacent to the investigated sample.
Thus one can measure the temperature drop across the investigated sample and its
contact to the piston and, by Eq. (2), the sample and apparatus double contact
http://repository.uwc.ac.za
7
resistance. By using calibrated micrometer gauges, the actual thickness was
measured.
2.2. The micro porous layers
In total four different MPLs were prepared. These were made by spraying several
layers of carbon particles, PTFE and a solvent on a thin copper film (28 ± 2 mm).
Subsequently the layers where heated to remove the solvent. The PTFE contents are
given in Table 1. In order to prepare carbon ink for the MPL, carbon powder (Vulcan
XC72, Cabot, USA) was mixed with PTFE-dispersed water (60 wt% PTFE, Alfa Aesar)
and isopropyl alcohol in an ultrasonic bath for 1 h. The resulting carbon ink was
spray-deposited onto one side of the copper foil (annealed, 99.8%, Alfa Aesar),
followed by drying at 80 o C (N2 atmosphere) for 2 h to evaporate all remaining
solvent, and then at 350 oC (N2 atmosphere) for 30 min to uniformly distribute
PTFE throughout the MPL [39]. The thickness of the layers were controlled by
adding several MPL layers on top of each other.
2.3 Procedure
For this research the investigated material was stacked. This was done by taking a
disk of the prepared MPL on copper along with a disk of pure aluminium (99.9%) on
top of the MPL. Thus the MPL is sandwiched between a thin disk of copper and one
of aluminium. This unit was investigated either as single or in a stack of two units (in
order to vary the thickness as much as possible).
Looking at Eqs. (1) and (2), one can see that knowledge of the sample thickness is
important. The metal films sandwiching the MPL sample were chosen especially
because of their high thermal conductivity. Thus these films will not contribute
directly to the measured thermal resistance, RApp.- Sample þ 2RApp.-Sample.
However these materials will contribute to the measured thickness of the
sample. Therefore the thickness of these films was measured and subtracted
for before plotting and calculating the thermal conductivities.
2.4 Statistical analysis and accuracy of the measurements
The thermal conductivity apparatus was calibrated using materials with known
thermal conductivity, see Ref. [31]. These values are known with 5% accuracy and
thus this is the accuracy limitation of the reported values in this paper [31]. The
http://repository.uwc.ac.za
8
thermal conductivities in the result section reports deviations from the linear
regression using a least square of residual approach. All numbers are reported with
95% confidence intervals. When subtracting for the aluminium and copper film
thicknesses the variance, si2 , will propagate as given by the r of propagations
formula, Eq. (3).
2.5. Temperature distribution model
Mathematical models of fuel cells accounting for temperature gradients have become more
common over the last decade, as are well summarised by Bapat and Thynell [40] and by
Zhang and Khandlikar [41].
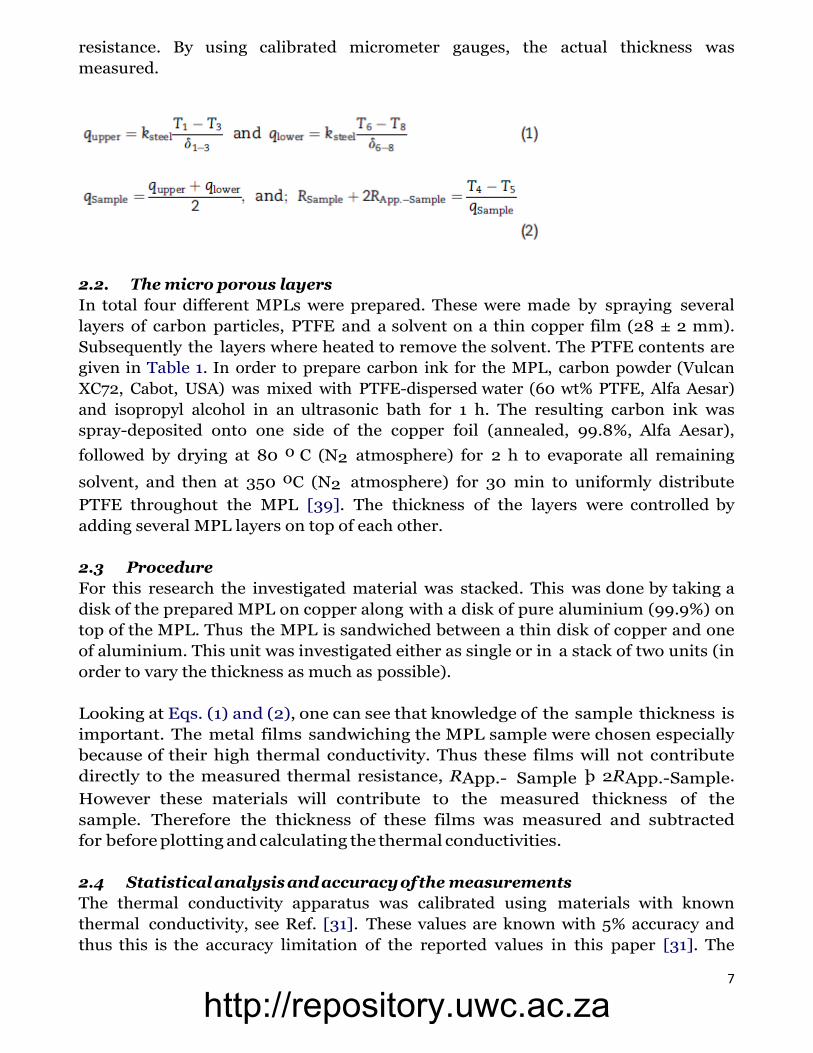
Highly complex and dynamic models can be developed. In this study, however, we
are only interested in evaluating the impact that the MPL and that MPLePTL
integration has on the temperature profiles through the PEMFC. In Fig. 3, several
illustrations of potential MPL-PTL integrations are given. Because the MPL is
typically deposited on top of the highly porous PTL (typically around 80%), it will
to some extent be integrated with the PTL. Therefore, the “On-Top MPL” in Fig. 3 is
not considered very likely and is not considered in this study. The four other
scenarios are considered. If the MPL is fully integrated in the PTL, there will be no
http://repository.uwc.ac.za
9
layer with a thermal conductivity equivalent to the values reported in this paper.
This is because from previous studies [12,13] it is known that the effective thermal
conductivity is not affected by the MPL when fully integrated in the PTL, at least in a
dry state. Thus this MPLePTL configuration was chosen as a base case and with the
MPL-only thickness equal to zero, see Table 2. Furthermore, three configurations
were considered where there is a MPL on the top of the PTL. In Fig. 3, these can be
seen as thin, normal and thick MPL partly integrated in the PTL. These
configurations, thin, normal, and thick partly integrated MPL, are represented by 15,
30, 45 mm thick pure MPL on top of the PTL in the model (see Table 2),
correspondingly. In order to justify the actual choice of MPL thickness’s in our
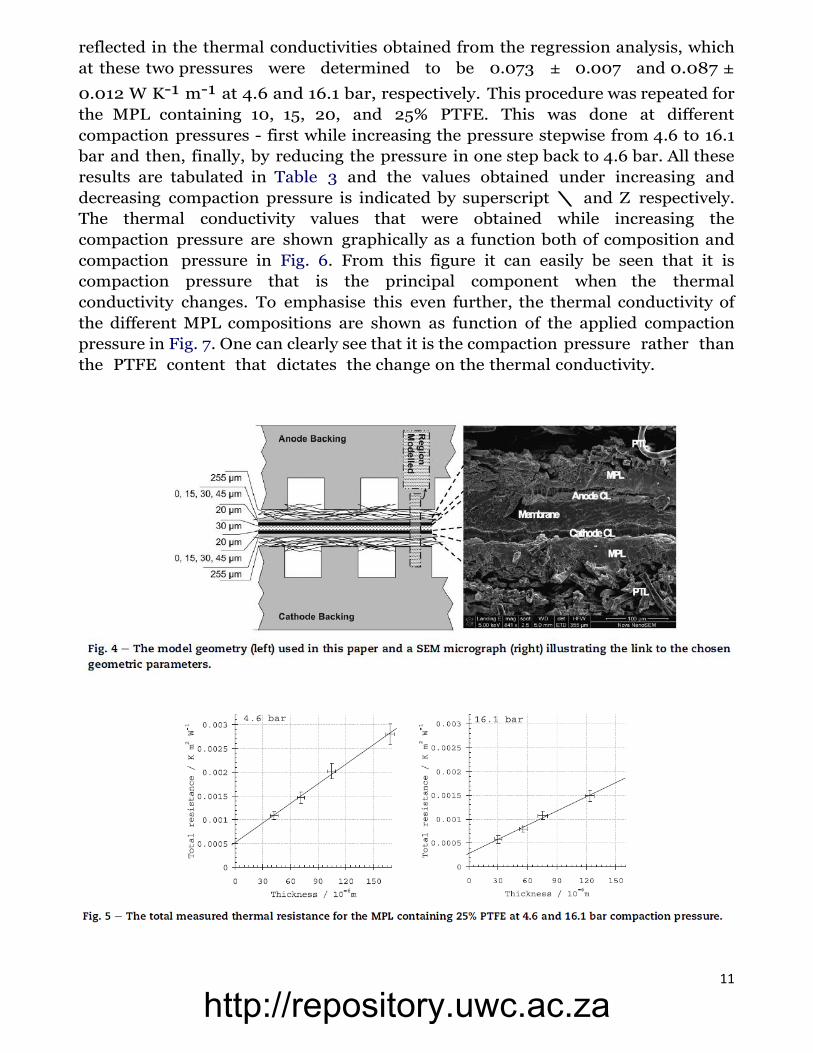
model, a SEM micrograph of a freeze-cut of the core of a PEMFC was studied, see
Fig. 4. In this figure, the PEMFC consisted of two commercially MPL coated PTL
(Freudenberg FFCT H2315 3X196) sandwiching a custom made MEA (0.4
mg Pt cm-2 on a Nafion 212). The MEA in the SEM micrograph was prepared by
using the catalyst coated membrane (CCM) method. (Catalyst inks were prepared
by dispersing catalyst powder (Hispec 4100 Pt/C, Johnson Matthey) into a mixture
of isopropanol and 5 wt% Nafion ionomer solution (DuPont, USA). The dispersion
mixture was ultrasonicated for 30 min before being used. Then, the inks were sprayed
on both sides of Nafion 212 membrane (DuPont, USA) to form the catalyst layers.)
The freeze cut was made by immersing this PEMFC in liquid nitrogen and then
cutting with a scalpel. This figure is shown here to demonstrate the degree of realism
in the MPLePTL configuration discussion above. The figure also shows the region
chosen to represent the model and how this model is geometrically linked to a
PEMFC.
Moreover, the PTL in the region was considered to contain some residual water, to
be operated with backing plates at 70 o C, and with a current density of 10 000 A
m-2 (1 A cm-2). A cathode over potential of (0.447 þ 0.058 ln[j/104])1 [2] was
assumed and a conductivity of 8.7 S m-1 [42] and a Nafion 111 membrane, this
current density corresponds to a cell potential of approximately 0.7 V. The reaction
is considered to produce liquid water and not to adsorb any water from the gas
vapour phase. Thus, the cathode reaction entropy is close to 163 J mol-12 K-
1 ; because most of [5] or large portions [7] of the reaction entropy for a PEMFC in
operation is measured to be associated with the cathode and because liquid water
absorbing and desorbing from a well humidified Nafion membrane is close to zero
[43]. Regarding the cathode heat sources, F is the Faraday constant, DS the
reaction entropy, and j the current density as A m-2. It was considered that the
PTL was a slightly wetted Toray TGP-090 10% wet proof with a thermal conductivity
twice that of the dry value at w14 bar compaction pressure, i.e. 2 x 0.48 W K-1 m-
1 [32]. The MPL layer that is on top of the PTL is considered to have a thermal
conductivity of 0.10 W K-1 m-1, according to the measurements reported in this
paper. The electrode layer is considered to have a similar thermal conductivity as the
http://repository.uwc.ac.za
10
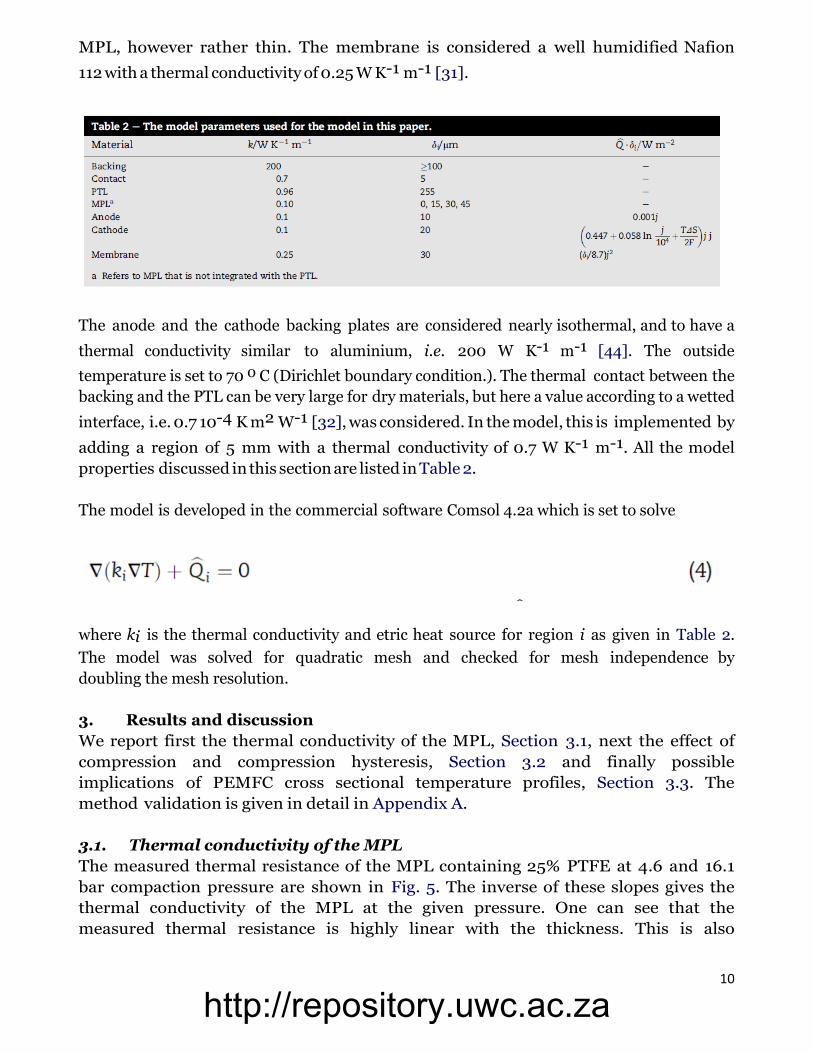
MPL, however rather thin. The membrane is considered a well humidified Nafion
112 with a thermal conductivity of 0.25 W K-1 m-1 [31].
The anode and the cathode backing plates are considered nearly isothermal, and to have a
thermal conductivity similar to aluminium, i.e. 200 W K-1 m-1 [44]. The outside
temperature is set to 70 o C (Dirichlet boundary condition.). The thermal contact between the
backing and the PTL can be very large for dry materials, but here a value according to a wetted
interface, i.e. 0.7 10-4 K m2 W-1 [32], was considered. In the model, this is implemented by
adding a region of 5 mm with a thermal conductivity of 0.7 W K-1 m-1. All the model
properties discussed in this section are listed in Table 2.
The model is developed in the commercial software Comsol 4.2a which is set to solve
where ki is the thermal conductivity and etric heat source for region i as given in Table 2.
The model was solved for quadratic mesh and checked for mesh independence by
doubling the mesh resolution.
3. Results and discussion
We report first the thermal conductivity of the MPL, Section 3.1, next the effect of
compression and compression hysteresis, Section 3.2 and finally possible
implications of PEMFC cross sectional temperature profiles, Section 3.3. The
method validation is given in detail in Appendix A.
3.1. Thermal conductivity of the MPL
The measured thermal resistance of the MPL containing 25% PTFE at 4.6 and 16.1
bar compaction pressure are shown in Fig. 5. The inverse of these slopes gives the
thermal conductivity of the MPL at the given pressure. One can see that the
measured thermal resistance is highly linear with the thickness. This is also
http://repository.uwc.ac.za
11
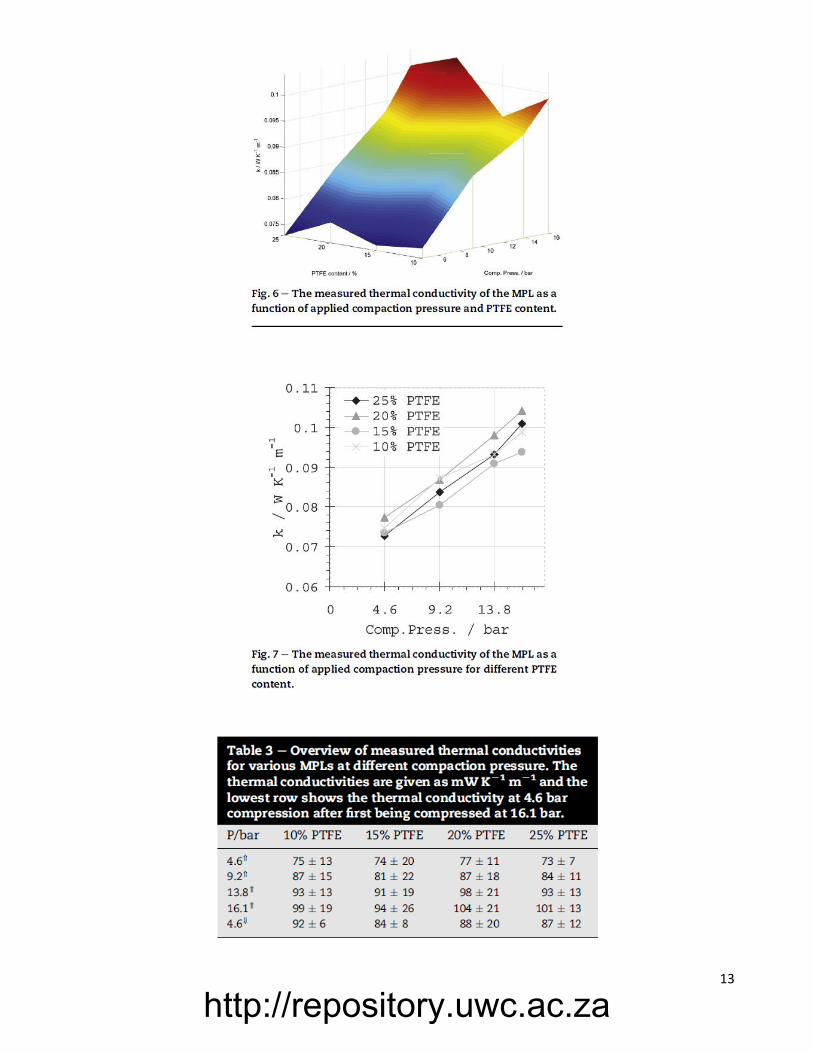
reflected in the thermal conductivities obtained from the regression analysis, which
at these two pressures were determined to be 0.073 ± 0.007 and 0.087 ±
0.012 W K-1 m-1 at 4.6 and 16.1 bar, respectively. This procedure was repeated for
the MPL containing 10, 15, 20, and 25% PTFE. This was done at different
compaction pressures - first while increasing the pressure stepwise from 4.6 to 16.1
bar and then, finally, by reducing the pressure in one step back to 4.6 bar. All these
results are tabulated in Table 3 and the values obtained under increasing and
decreasing compaction pressure is indicated by superscript \ and Z respectively.
The thermal conductivity values that were obtained while increasing the
compaction pressure are shown graphically as a function both of composition and
compaction pressure in Fig. 6. From this figure it can easily be seen that it is
compaction pressure that is the principal component when the thermal
conductivity changes. To emphasise this even further, the thermal conductivity of
the different MPL compositions are shown as function of the applied compaction
pressure in Fig. 7. One can clearly see that it is the compaction pressure rather than
the PTFE content that dictates the change on the thermal conductivity.
http://repository.uwc.ac.za
12
3.2. Compressibility of the MPL
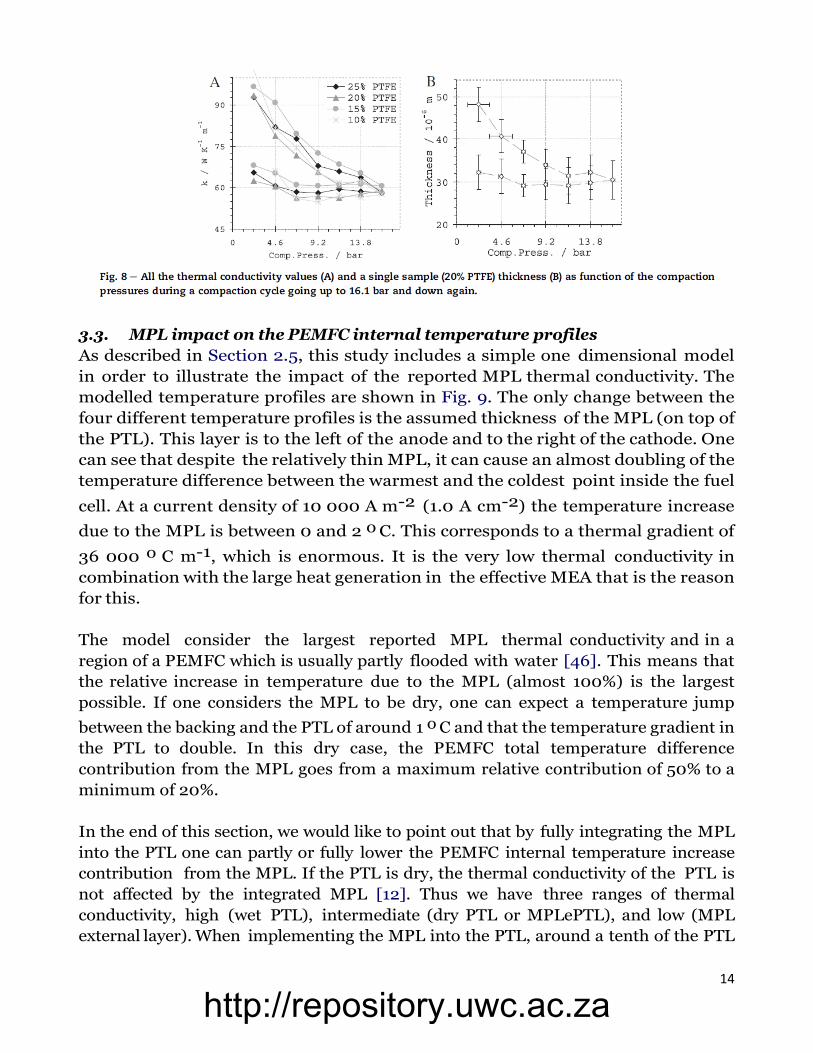
The thermal conductivity cycle of all the materials and the thickness cycle (of a
sample containing 20% PTFE) as functions of compaction pressure can be seen in
Fig. 8. From this figure, one can see how strong the relation between the
compression and the thermal conductivity is. One can also see that the
compression is almost completely irreversible. This means that when the MPL is
compressed in a PEMFC, it is the highest compaction applied that will dictate the
thermal conductivity of the layer.
Another aspect that should also be clear is that the thermal conductivity of this soft
material relies on contact between the material particles within. This study does not
consider the gas phase tortuousity of the MPL under compression. As the material is
compressed this property is likely to increase, and the increased thermal
conductivity might come at the cost of reactant and product gas transport
properties.
As was discussed in the introduction [45], some fibrous carbon papers used as PTL
exhibit partial hysteresis in thickness when exposed to cyclic compression. When
these materials are compressed, some of the fibres snap or break while others
remain intact. Because some fibres break and some do not, the PTL is not entirely
elastic and not fully irreversibly compressed. Because the PTL is the support for the
MPL, the hysteresis of compression for the MPL and the PTL should be seen
together. For instance, when the membrane expands and contracts when undergoing
hydration cycles (e.g. during start-up and shut-down of the PEMFC systems); The
MPL can be expected to keep a constant thickness due to the first
compressions whereas the PTL will contract and expand elastically. Hence the PTL
thermal conductivity can be expected to be dynamic and the MPL thermal
conductivity static.
http://repository.uwc.ac.za
13
http://repository.uwc.ac.za
14
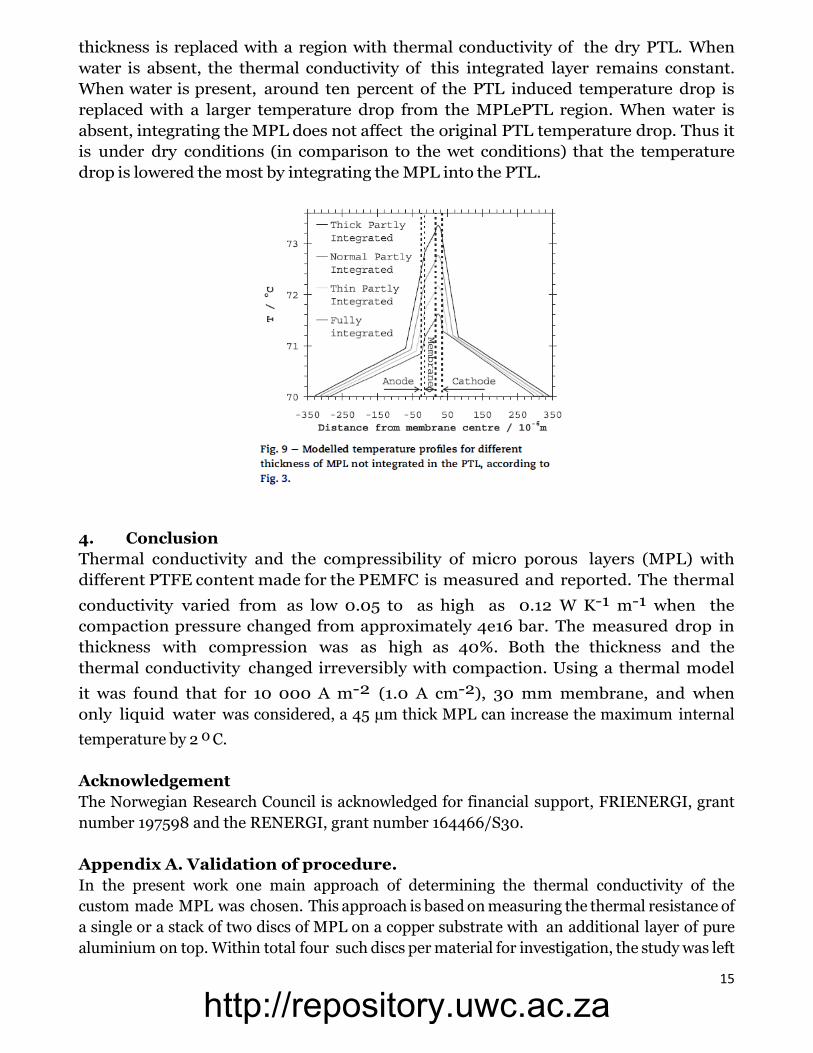
3.3. MPL impact on the PEMFC internal temperature profiles
As described in Section 2.5, this study includes a simple one dimensional model
in order to illustrate the impact of the reported MPL thermal conductivity. The
modelled temperature profiles are shown in Fig. 9. The only change between the
four different temperature profiles is the assumed thickness of the MPL (on top of
the PTL). This layer is to the left of the anode and to the right of the cathode. One
can see that despite the relatively thin MPL, it can cause an almost doubling of the
temperature difference between the warmest and the coldest point inside the fuel
cell. At a current density of 10 000 A m-2 (1.0 A cm-2) the temperature increase
due to the MPL is between 0 and 2 o C. This corresponds to a thermal gradient of
36 000 o C m-1, which is enormous. It is the very low thermal conductivity in
combination with the large heat generation in the effective MEA that is the reason
for this.
The model consider the largest reported MPL thermal conductivity and in a
region of a PEMFC which is usually partly flooded with water [46]. This means that
the relative increase in temperature due to the MPL (almost 100%) is the largest
possible. If one considers the MPL to be dry, one can expect a temperature jump
between the backing and the PTL of around 1 o C and that the temperature gradient in
the PTL to double. In this dry case, the PEMFC total temperature difference
contribution from the MPL goes from a maximum relative contribution of 50% to a
minimum of 20%.
In the end of this section, we would like to point out that by fully integrating the MPL
into the PTL one can partly or fully lower the PEMFC internal temperature increase
contribution from the MPL. If the PTL is dry, the thermal conductivity of the PTL is
not affected by the integrated MPL [12]. Thus we have three ranges of thermal
conductivity, high (wet PTL), intermediate (dry PTL or MPLePTL), and low (MPL
external layer). When implementing the MPL into the PTL, around a tenth of the PTL
http://repository.uwc.ac.za
15
thickness is replaced with a region with thermal conductivity of the dry PTL. When
water is absent, the thermal conductivity of this integrated layer remains constant.
When water is present, around ten percent of the PTL induced temperature drop is
replaced with a larger temperature drop from the MPLePTL region. When water is
absent, integrating the MPL does not affect the original PTL temperature drop. Thus it
is under dry conditions (in comparison to the wet conditions) that the temperature
drop is lowered the most by integrating the MPL into the PTL.
4. Conclusion
Thermal conductivity and the compressibility of micro porous layers (MPL) with
different PTFE content made for the PEMFC is measured and reported. The thermal
conductivity varied from as low 0.05 to as high as 0.12 W K-1 m-1 when the
compaction pressure changed from approximately 4e16 bar. The measured drop in
thickness with compression was as high as 40%. Both the thickness and the
thermal conductivity changed irreversibly with compaction. Using a thermal model
it was found that for 10 000 A m-2 (1.0 A cm-2), 30 mm membrane, and when
only liquid water was considered, a 45 µm thick MPL can increase the maximum internal
temperature by 2 o C.
Acknowledgement
The Norwegian Research Council is acknowledged for financial support, FRIENERGI, grant
number 197598 and the RENERGI, grant number 164466/S30.
Appendix A. Validation of procedure.
In the present work one main approach of determining the thermal conductivity of the
custom made MPL was chosen. This approach is based on measuring the thermal resistance of
a single or a stack of two discs of MPL on a copper substrate with an additional layer of pure
aluminium on top. Within total four such discs per material for investigation, the study was left
http://repository.uwc.ac.za
16
with a minimum of the requirement for a linear regression and a corresponding variance.
The chosen method allows for at least three critical questions against the choice of this
procedure.
One argument against the chosen approach is that three points are too little to give a
reasonable estimate on the thermal conductivity value and its variance because one should
use at least five points to have a valid regression and variance. This argument is wrong. The fact
is that one can severely lower the variance by increasing the number of measurements and
that when one has five measured values the equations giving the variance is lowered enough
(because of the denominator (n-2)) to be in a state where systematic errors (calibration of
measurements) becomes more important than the random scatter of the measurements.
What is also important in a least square residual approach is the distance between the points in
the regression. For instance, in the present case it is better to measure three single points with
a large thickness range than to measure many single points with a low thickness range. In the
reported measurements it was strived to increase the range while keeping the number
reasonably large (four).
A second argument against the chosen approach is the loss of precision in the thickness
measurement when subtracting the Cu- and Al-film thicknesses, and in particular when
considering the “single” thickness MPL. The error of the thickness measurements when
subtracting for these thicknesses propagates and decreases the precision of the
measurements. However, also on thicker MPL were measured and it was taken care to make
sure that every layer is compressed in a reproducible manner. This suggests that it is indeed
better to have a reproducible layer of aluminium on top of each disc of MPL than to have
different contacts for the single and the stacked materials.
The third argument against the chosen approach should be introduction of several contact
resistances and because of the linear coupling between contact resistances and samples one is
left with with a matrix without a determinant. This argument is only valid if the contact
resistances of “MPL-Aluminium” and “aluminium-heated copper” are as large or larger
than the order of a tenth of the resistance of the (double) MPL. This topic was debated
extensively by Ramousse et al. [30]. There are two ways that one can use to test the lack of
significance of these contact resistances.
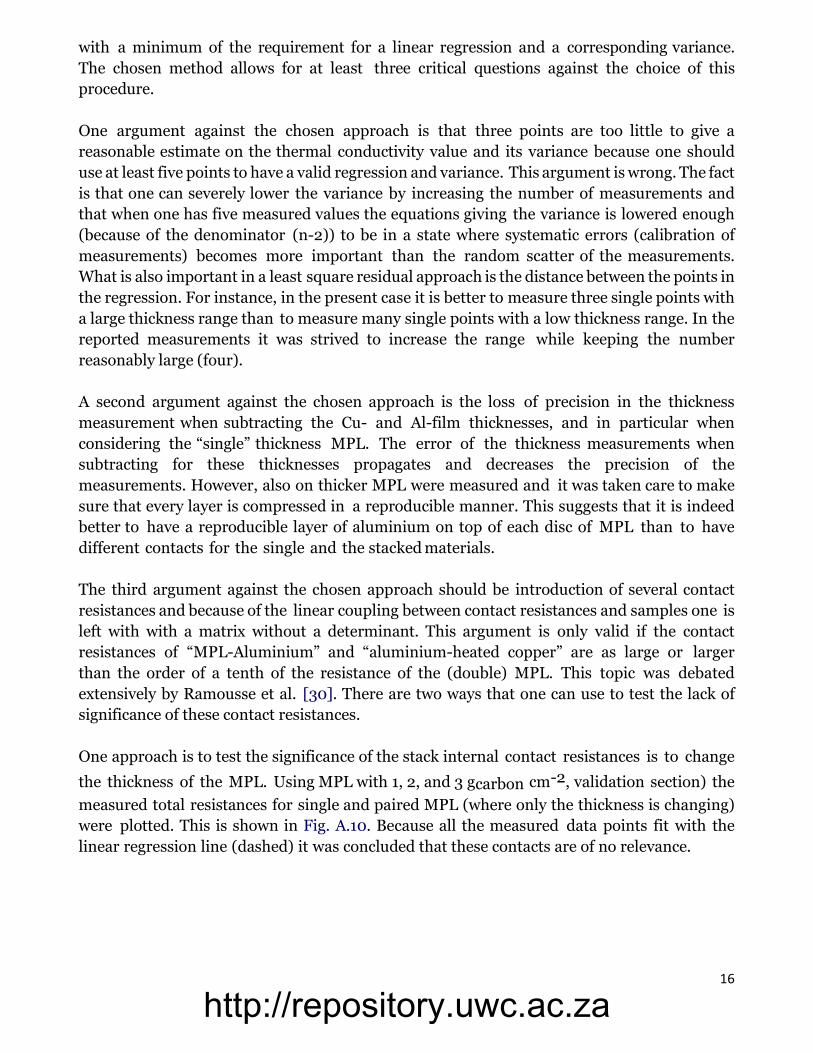
One approach is to test the significance of the stack internal contact resistances is to change
the thickness of the MPL. Using MPL with 1, 2, and 3 gcarbon cm-2, validation section) the
measured total resistances for single and paired MPL (where only the thickness is changing)
were plotted. This is shown in Fig. A.10. Because all the measured data points fit with the
linear regression line (dashed) it was concluded that these contacts are of no relevance.
http://repository.uwc.ac.za
17
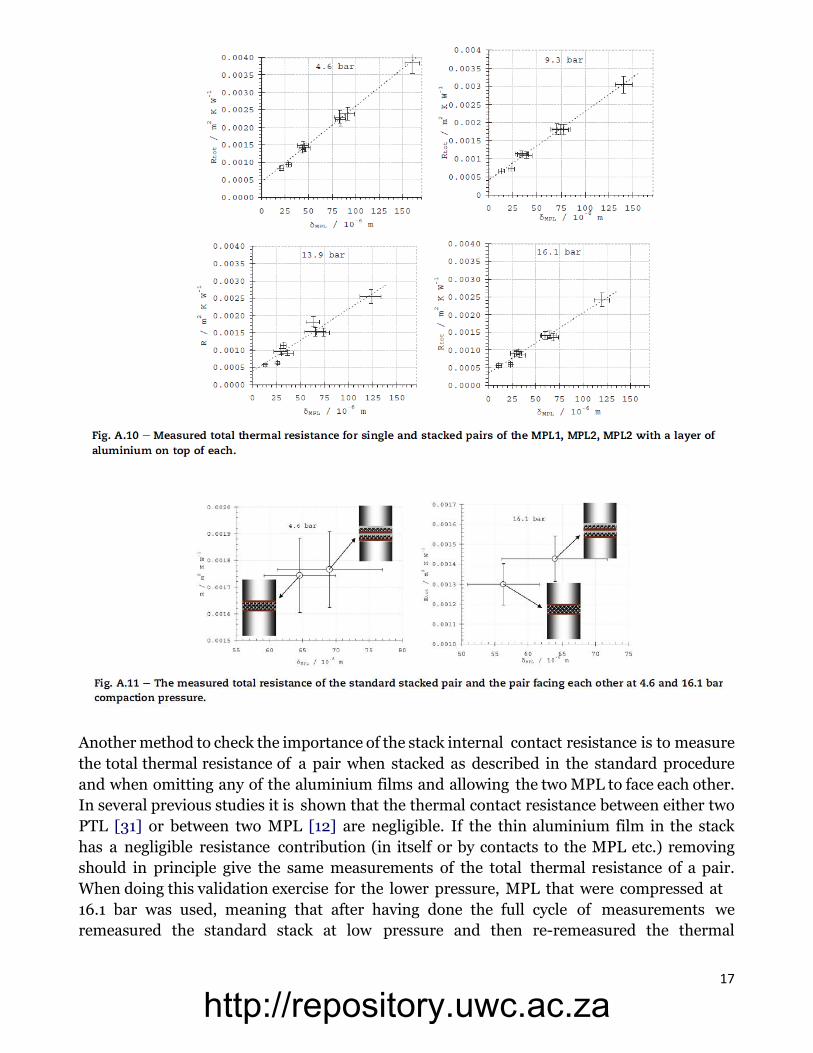
Another method to check the importance of the stack internal contact resistance is to measure
the total thermal resistance of a pair when stacked as described in the standard procedure
and when omitting any of the aluminium films and allowing the two MPL to face each other.
In several previous studies it is shown that the thermal contact resistance between either two
PTL [31] or between two MPL [12] are negligible. If the thin aluminium film in the stack
has a negligible resistance contribution (in itself or by contacts to the MPL etc.) removing
should in principle give the same measurements of the total thermal resistance of a pair.
When doing this validation exercise for the lower pressure, MPL that were compressed at
16.1 bar was used, meaning that after having done the full cycle of measurements we
remeasured the standard stack at low pressure and then re-remeasured the thermal
http://repository.uwc.ac.za

18
resistance of this pair when removing the aluminium films and having the MPL facing each
other. The result for the lower (4.6 bar) and the higher (16.1 bar) pressure are shown in Fig. A.11.
Regardless of the compaction pressure, the measured total thermal resistance is the same
for both the configurations. Thus a second validation of the chosen procedure is given.
http://repository.uwc.ac.za
19
References
[1] Kjelstrup S, Røsgjorde A. Local and total entropy production and heat and water
fluxes in a one-dimensional polymer electrolyte fuel cell. J Phys Rev B
2005;109:9020.
[2] Burheim O, Vie P, Møller-Holst S, Pharoah J, Kjelstrup S. A calorimetric analysis
of a polymer electrolyte fuel cell and the production of H2O2 at the cathode.
Electrochim Acta 2010;5:935e42.
[3] Thomas A, Maranzana G, Didierjean S, Dillet J, Lottin O. Thermal effect on
water transport in proton exchange membrane fuel cell. Fuel Cells 2012;12:212e24.
[4] Ramousse J, Lottin O, Didierjean S, Maillet D. Heat sources in proton exchange
membrane (PEM) fuel cells. J Power Sources 2009;192:435e41.
[5] Burheim O, Kjelstrup S, Pharoah J, Vie P, Møller-Holst S. Calculation of reversible
electrode heats in the proton exchange membrane fuel cell from calorimetric
measurements. Electrochim Acta 2011;5:935e42.
[6] Thomas A, Maranzana G, Didierjean S, Dillet J, Lottin O. Measurements of
electrode temperatures, heat and water fluxes in PEMFCs: conclusions about
transfer mechanisms. J Electrochem Soc 2013;160(2):F191e204.
[7] Kjelstrup S, Vie PJS, Akyalcin L, Zefaniya P, Pharoah J, Burheim OS. The
seebeck coefficient and the peltier effect in a polymer electrolyte membrane cell
with two hydrogen electrodes. Electrochim Acta 2013;99:166e75.
[8] Kinoshita K. Electrochemical oxygen technology. New York: Interscience; 1992.
[9] El-kharouf A, Mason TJ, Brett DJ, Pollet BG. Ex-situ characterisation of gas
diffusion layers for proton exchange membrane fuel cells. J Power Sources
2012;218:393e404.
[10] El-Kharouf A, Chandan A, Hattenberger M, Pollet B. Proton exchange
membrane fuel cell degradation and testing: review. J Energy Inst
2012;85(4):188e200.
[11] Zamel N, Li X. Effective transport properties for polymer electrolyte membrane
fuel cells e with a focus on the gas diffusion layer. Prog Energy Combust Sci
2013;39:146.
[12] Burheim OS, Ellila G, Fairweather JD, Labouriau A, Kjelstrup S, Pharoah JG.
Ageing and thermal conductivity of porous transport layers used for PEM fuel cells.
J Power Sources 2013;221:356e65.
[13] Unsworth G, Zamel N, Li X. Through-plane thermal conductivity of the
microporous layer in a polymer electrolyte membrane fuel cell. Int J Hydrogen Energy
2012;37(6):5161e9.
[14] Cindrella L, Kannan A, Lin J, Saminathan K, Ho Y, Lin C, et al. Gas diffusion layer
for proton exchange membrane fuel cells e a review. J Power Sources
2009;194(1):146e60.
[15] Wang X, Zhang H, Zhang J, Xu H, Tian Z, Chen J, et al. Microporous layer with
composite carbon black for PEM fuel cells. Electrochim Acta 2006;51(23):4909e15.
[16] Ji Y, Luo G, Wang C-Y. Pore-level liquid water transport through composite
diffusion media of PEMFC. J Electrochem Soc 2010;157:B1753.
http://repository.uwc.ac.za
20
[17] Park S, Lee J-W, Popov BN. Effect of carbon loading in microporous layer on
PEM fuel cell performance. J Power Sources 2006;163:357e63.
[18] Park S, Lee J-W, Popov BN. Effect of PTFE content in microporous layer on
water management in PEM fuel cells. J Power Sources 2008;177:457e63.
[19] Kim T, Lee S, Park H. A study of water transport as a function of the micro-
porous layer arrangement in PEMFCs. Int J Hydrogen Energy 2010;35:8631e43.
[20] Wu R, Zhu X, Liao Q, Wang H, dong Ding Y, Li J, et al. A pore network study on
the role of micro-porous layer in control of liquid water distribution in gas diffusion
layer. Int J Hydrogen Energy 2010;35:7588e93.
[21] Weng F-B, Hsu C-Y, Su M-C. Experimental study of micro-porous layers for
PEMFC with gradient hydrophobicity under various humidity conditions. Int J
Hydrogen Energy 2011;36:13708e14.
[22] Nitta I, Himanen O, Mikkola M. Thermal conductivity and contact resistance of
compressed gas diffusion layer of PEM fuel cell. Fuel Cells 2008;8:111e9.
[23] He G, Yamazaki Y, Abudula A. A three-dimensional analysis of the effect of
anisotropic gas diffusion layer (GDL) thermal conductivity on the heat transfer and
two-phase behavior in a proton exchange membrane fuel cell (PEMFC). J Power
Sources 2010;195:1551e60.
[24] Pharoah J, Karan K, Sun W. On effective transport coefficients in PEM fuel
cell electrodes: Anisotropy of the porous transport layer. J Power Sources
2006;161:214e24.
[25] Danes F, Bardon J. Thermal conductivity of the carbon felts, strongly
anisotropic insulants: modelling of heat conduction by solid phase. Uses of carbon
felts for high temperature insulation are reviewed. Eff Raw Mater Fabr
2008;36:200e8.
[26] Sadeghi E, Bahrami M, Djilali N. Analytic determination of the effective
thermal conductivity of PEM fuel cell gas diffusion layers. J Power Sources
2008;179:200e8.
[27] Sadeghi E, Djilali N, Bahrami M. A novel approach to determine the in-plane
thermal conductivity of gas diffusion layers in proton exchange membrane fuel
cells. J Power Sources 2011;196:3565-71.
[28] Teertstra P, Karimi G, Li X. Measurement of in-plane effective thermal
conductivity in PEM fuel cell diffusion media. Electrochim Acta 2011;56:1670-5.
[29] Zamel N, Litovsky E, Shakhshir S, Li X, Kleiman J. Measurement of in-plane
thermal conductivity of carbon paper diffusion media in the temperature range of -
20 o C to þ120 o C. Appl Energy 2011;88:3042-50.
[30] Ramousse J, Lottin O, Didierjean S, Maillet D. Estimation of the thermal
conductivity of carbon felts used as PEMFC gas diffusion layers. Int J Thermal Sci
2008;47:1e6.
[31] Burheim O, Vie P, Pharoah J, Kjelstrup S. Ex-situ measurements of through-
plane thermal conductivities in a polymer electrolyte fuel cell. J Power Sources
2010;195:249e56.
http://repository.uwc.ac.za
21
[32] Burheim O, Lampert H, Pharoah J, Vie P, Kjelstrup S. Throughplane thermal
conductivity of PEMFC porous transport layers. Fuel Cell Sci Technol 2011;8:1e11.
Art. no. 021013.
[33] Wang Y, Gundevia M. Measurement of thermal conductivity and heat pipe
effect in hydrophilic and hydrophobic carbon papers. Int J Heat Mass Transf
2013;60:134e42.
[34] Khadelwal M, Mench MM. Direct measurement of throughplane thermal
conductivity and contact resistance in fuel cell materials. J Power Sources
2006;161:1106e15.
[35] Yableckia J, Nabovati AA, Bazylak A. Modeling the effective thermal
conductivity of an anisotropic gas diffusion layer in a polymer electrolyte
membrane fuel cell. J Electrochem Soc 2012;159:B647e53.
[36] Vie P, Kjelstrup S. Thermal conductivities from temperature profiles in the
polymer electrolyte fuel cell. Electrochim Acta 2004;49:1069e77.
[37] Ihonen J, Mikkola M, Lindhberg G. The flooding of gas diffusion backing in
PEFCs; physical and electrochemical characterisation. J Electrochem Soc
2004;151:A1152e61.
[38] Zamel N, Litovsky E, Shakhshir S, Li X, Kleiman J. Measurement of the
through-plane thermal conductivity of carbon paper diffusion media for the
temperature range from -50 to þ120 oc. Int J Hydrogen Energy 2011;36:12618e25.
[39] Su H-N, Liao S-J, Wu Y-N. Significant improvement in cathode performance for
proton exchange membrane fuel cell by a novel double catalyst layer design. J Power
Sources 2010;195:3477e80.
[40] Bapat C, Thynell S. Anisotropic heat conductions effects in proton-exchange
membrane fuel cells. ASME J Heat Transfer 2007;129:1109e18.
[41] Zhang G, Kandlikar SG. A critical review of cooling techniques in proton
exchange membrane fuel cell stacks. Int J Hydrogen Energy 2012;37:2412e29.
[42] Springer TE, Zawodzinski TA, Gottesfeld SS. Polymer electrolyte fuel cell model. J
Electrochem Soc 1991;138:2334e43.
[43] Reucroft P, Rivin D, Schneider N. Thermodynamics of nafion-vapor
interactions. I. Water vapor. Polymer 2002;43:5157e61.
[44] West RC. CRC e handbook of physical and chemical properties. 58th ed. CRC
Press, Inc; 1977-1978.
[45] Sadeghi E, Djilali N, Bahrami M. Effective thermal conductivity and thermal
contact resistance of gas diffusion layers in proton exchange membrane fuel cells.
Part 2: hysteresis effect under cyclic compressive load. J Power Sources
2010;195:8104e9.
[46] Turhan A, Heller K, Brenizer J, Mench M. Passive control of liquid water
storage and distribution in a PEFC through flow-field design. J Power Sources
2008;180:773e83.
http://repository.uwc.ac.za