Embed Size (px)
Citation preview
Proceedings World Geothermal Congress 2010 Bali, Indonesia, 25-29 April 2010
1
Thermal Imaging of Geothermal Features
Gunnlaugur M. Einarsson & Sigurður G. Kristinsson
Iceland GeoSurvey, Grensásvegur 9, 108 Reykjavík, Iceland
Keywords: Remotes sensing, Thermal Imaging, Geothermal areas, geothermal mapping, environmental monitoring
ABSTRACT
With advances in thermal imaging and thermal cameras becoming more like conventional cameras, imaging of geothermal features in the field is becoming an important alternative to conventional methods.
This paper outlines a study where ground based thermal images are compared with results from conventional soil temperature mapping. With data obtained in Hveragerði, Southern Iceland georeferenced images and thermal images taken from the ground are compared with soil in-situ thermocouple measurements. Results show similar temperature patterns, although temperature from the thermal camera is slightly lower than the in-situ temperature.
Thermal imaging also has environmental monitoring applications. Here, an example from Reykjanes, SW-Iceland is presented, where hot brine water from a power plant is pumped into the sea and the amount of affected seawater is estimated.
1. INTRODUCTION
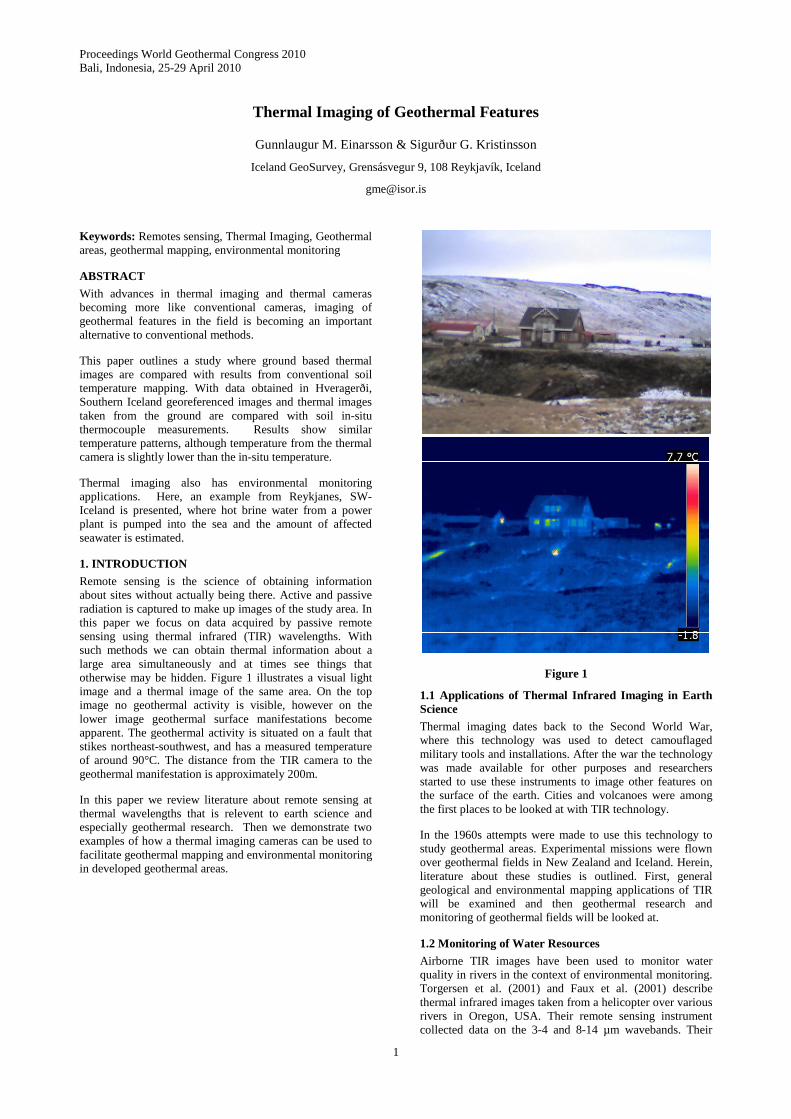
Remote sensing is the science of obtaining information about sites without actually being there. Active and passive radiation is captured to make up images of the study area. In this paper we focus on data acquired by passive remote sensing using thermal infrared (TIR) wavelengths. With such methods we can obtain thermal information about a large area simultaneously and at times see things that otherwise may be hidden. Figure 1 illustrates a visual light image and a thermal image of the same area. On the top image no geothermal activity is visible, however on the lower image geothermal surface manifestations become apparent. The geothermal activity is situated on a fault that stikes northeast-southwest, and has a measured temperature of around 90°C. The distance from the TIR camera to the geothermal manifestation is approximately 200m.
In this paper we review literature about remote sensing at thermal wavelengths that is relevent to earth science and especially geothermal research. Then we demonstrate two examples of how a thermal imaging cameras can be used to facilitate geothermal mapping and environmental monitoring in developed geothermal areas.
Figure 1
1.1 Applications of Thermal Infrared Imaging in Earth Science
Thermal imaging dates back to the Second World War, where this technology was used to detect camouflaged military tools and installations. After the war the technology was made available for other purposes and researchers started to use these instruments to image other features on the surface of the earth. Cities and volcanoes were among the first places to be looked at with TIR technology.
In the 1960s attempts were made to use this technology to study geothermal areas. Experimental missions were flown over geothermal fields in New Zealand and Iceland. Herein, literature about these studies is outlined. First, general geological and environmental mapping applications of TIR will be examined and then geothermal research and monitoring of geothermal fields will be looked at.
1.2 Monitoring of Water Resources
Airborne TIR images have been used to monitor water quality in rivers in the context of environmental monitoring. Torgersen et al. (2001) and Faux et al. (2001) describe thermal infrared images taken from a helicopter over various rivers in Oregon, USA. Their remote sensing instrument collected data on the 3-4 and 8-14 µm wavebands. Their
Einarsson and Kristinsson
2
instrument was accurate to temperature differences of ±0.2°C. They noted that energy emitted comes only from the topmost 0.1 mm of the water body and therefore is not representative of the whole depth of the river. With a flight altitude of 500-700 m above the ground surface, the resolution of the images ranged from 0.2 to 0.4 m2. In addition to image acquisition, they had temperature data loggers at various locations in the streams observed. This data was then used to create temperature profiles upstream of the rivers. These profiles show that temperature differences over larger areas correlate with morphological variance in the areas where the rivers flow. They also conclude the difference between the kinetic temperature measured in the streams and the radiant temperature measured in the streams is on average ± 0.5°C. They however conclude that TIR imaging studies of rivers require some ground control measurements. Faux et al. (2001) show an example where water from a hot spring enters the river. But notes that these locations are few in their study area and therefore hard to detect.
1.3 Lithologic Mapping, Volcano and Forest Fire Monitoring
Thermal Infrared remote sensing data is not only acquired from aircraft. Some instruments that are thermal infrared sensitive have been put into satellites. For example, Band 6 in the Landsat series of satellites collects data on TIR wavelengths. Also the Advanced Spaceborne Thermal Emission and also Reflection Radiometer (ASTER) include a thermal infrared sensor.
Rowan and Mars (2003) describe the efforts to use TIR remote sensing to map the lithology or bedrock composition from ASTER data. Because of the different emission probabilities of different rock types they can map the difference of large blocks of bedrock where there is no vegetation, such as in the Nevada desert in USA. They show that using the TIR bands in combination with other bands it is possible to map rock type on a large scale. Their study shows that Thermal Infrared data can distinguish between igneous rocks and hydrothermally altered rocks by using different combinations of wavelength bands of the same area.
Satellite remote sensing of geothermal areas has to date not been very useful for detailed mapping. This is due to resolution limitations, with pixel size being 90 by 90 m. Whilst this can be enough for regional studies this resolution is not enough to look at geothermal areas in detail.
Thermal Infrared instruments have been flown over erupting volcanoes to monitor the flow of lavas. These kinds of studies have been carried out for example on Hawaii and on Mt. Etna in Italy. In addition Higgins and Harris (1997) describe a computer algorithm to detect thermal anomalies from AVHRR images, in an attempt to create a remote system to monitor volcanoes in near real-time. A 3 by 3 kernel is run over the image, and pixels with higher value, over known volcanic areas are interpreted as evidence of activity.
Forest fires are monitored from space using the MODIS satellite systems and websites publish locations of wildfires in real time. One of the bands used to detect fires is the thermal infrared band (Remote Sensing Applications Centre - USDA Forest Service http://activefiremaps.fs.fed.us/ ).
1.4 Remote Sensing of Geothermal Areas
The literature about geothermal exploration and research, dating as far back as the 1960’s mention the use of remote
sensing. These studies are mostly describing new developments and technology, without more than a limited testing of methods, to produce useful results. These early studies show that geothermal activity can be seen on TIR data but no detailed processing has been carried out on the data. These studies have experienced various problems, such as spatial resolution and methods of analysis.
The first geothermal area studied with TIR technology was the Wairakei geothermal area on North Island, New Zealand. Dawson and Dickinson (1970) study heat flow from the thermal area. TIR data is used to map the extent of thermal features, and field measurements used to obtain temperature data. They note that there is a difference in heat discharge from the same place (hot ground) depending on the water content of the soil. The wetter the soil the more heat discharge. As vegetation in soil that is effected by geothermal heat is represented differently in TIR data that it is used to map the extent of hotter ground.
New Zealand was not the only place where thermal infrared images were tested in geothermal exploration. Pálmarsson et al. (1970) and Friedman et al. (1972) report on thermal infrared flights over Icelandic geothermal areas flown in 1966 and 1968. Pálmarsson et al. (1970) discusses TIR images taken over the Reykjanes and Torfajökull geothermal areas. These images collected data on the 4.0 – 5.5 µm wavelength bands. At this time the images were all collected on film, and therefore it was required to quantify them with field temperature measurements. That was done for the Reykjanes geothermal area, at the same time as these TIR studies were being done. The area was being explored and developed for the building of a sea salt factory that used geothermal energy to boil see and deposit salt. The study uses the same technique as described by Dawson and Dickinson (1970) to quantify heat flow from the area. Pálmarsson et al. (1970) p. 406 states that:
“When weaker anomalies in the Reykjanes imagery have been filtered out away by the amplitude slicing technique a very clear picture emerges of the stronger anomalies. There geometrical pattern clearly shows a relationship to the tectonic fractures in the area”
They also state that these anomalies are much better distinguished in the TIR imagery than on other aerial photography. For Torfajökull area this study does not have as complete direct heat measurements as for Reykjanes geothermal area.
Reykjanes and Torfajökull were not the only geothermal areas in Iceland that were photographed using TIR imagery instrument. Among the other fields photographed was Kverkfjöll area in Northern Vatnajökull glacier. This area is on the margin of the glacier and interacts with it. Freidman et al. (1972) report on that study. The images were taken on a film sensitive to IR wavelengths, were manipulated as regular stereo images and then used to map thermal features, and the movement of the glacier margin. The images are also used to estimate the thermal discharge from the area.
In the sixties and seventies the first remote sensing satellites were placed in orbit. In a report by Williams et al. (1974) there is an attempt to look at the extent of a geothermal area by looking at the snowmelt pattern around it using ERTS-1 MSS system. The report indicates that it is possible to map the extent of geothermal areas using data collected during the winter.
Mongillo (1998) used thermal infrared imagery video recording device mounted on a helicopter in his study in
Einarsson and Kristinsson
3
New Zealand. The system was set up wrongly so the images had more noise than was expected and the system could not record vertical images due to leaking of fluid from the system so most of the images are oblique. All the interpretation in this study was done visually, and therefore it is hard to quantify the result. After extensive preparation of the data they conclude and show that different geothermal features can be identified from this imagery.
LandSat images have also been applied to geothermal areas as reported by Alcantara et al (1988), Mongillo et al. (1995), Ramasamy et al. (1994) and Ruiz-Armenta and Ledesma (1995). They mostly use stressed vegetation and linear alignment of features as well as mineral reflectance from altered and fresh bedrock, to determine the extent of geothermal areas. These studies use images that have spatial resolution that is of around 30 – 100 m pixel size. That resolution can give an idea of the extent of area, but in order to use them to monitor changes in geothermal areas the resolution is not high enough.
In the early 1990’s the department of physics and engineering in University of Iceland experimented with an airborne TIR sensor. Árnason et al. (1994) report on the development of the instrument and its application over populated areas, over sea and over geothermal areas. Experimental flights were flown over several geothermal areas including the Hengill area. As this project was more about making the sensing system than to apply the technology to a specific task the images for this time are only one flight line over each areas where geothermal manifestations exist. However three years in a row, thermal infrared missions were flown over geothermal fields as reported by Árnason (1994, 1995). These images do not cover the whole area as they are single flight lines. The study only shows the images and compares them in printed format on paper, as they were not presented with in a GIS. These studies show again that the TIR imagery can be used to map and monitor geothermal manifestations.
The most recent research that applies remote sensing techniques to geothermal exploration is reported from Nevada USA (Calvin et al. 2002, 2006). Their research applies satellite imagery with pixel resolution of 90 m in the deserts of South-Western USA where vegetation is not an issue, and everything is larger than anywhere else. Remote Sensing imagery, both from airborne and satellite sources have been used to look at mineral alteration at the Steamboat Springs and Bradys Hot Springs in Nevada. These studies use both night and daytime imagery. This research is mostly looking at mineral composition.
2. THERMAL IMAGING OF GEOTHERMAL FEATURES FROM THE GROUND
In the above sections the focus has been on previous studies where thermal images obtained from airborne and spaceborne platforms have been discussed. In the following sections we outline studies carried out using a handheld FLIR T360 thermal infrared camera. Attempts have been made to georeferece images to obtain thermal maps of the study areas. These are then compared to in-situ temperature measurements, obtained with a thermocouple. In addition thermal images have been obtained overlooking a water body where geothermal brine is pumped into the ocean.
2.1 Soil Temperature, Hveragerði S-Iceland
The traditional method to estimate temperature distribution in soils is to use thermocouples to measure temperature at a shallow depth. These provide important data when identifying aquifers in places where geologic structures
many be intersected. They can also be used to map linear structures were soil and vegetation cover the study area (Flóvenz, 1985). With data obtained in Hveragerði we try to compare soil temperature measurements with a temperature map derived from thermal images to estimate outlines and structures of the geothermal features.
Hveragerði, in S-Iceland has an active geothermal field in the middle of a small town. It belongs to the Hveragerði volcanic system east of the Hengill central volcano. The activity in Hveragerði is linked to linear features that strike NNA-SSV. Hot springs in the area are in a line with these faults and fissures.
A geothermal map (Sæmundsson and Kristinsson 2005) was made in 2005 of the town showing geothermal anomalies within the soil. There a previously unknown line was forming in the eastern part of the town.
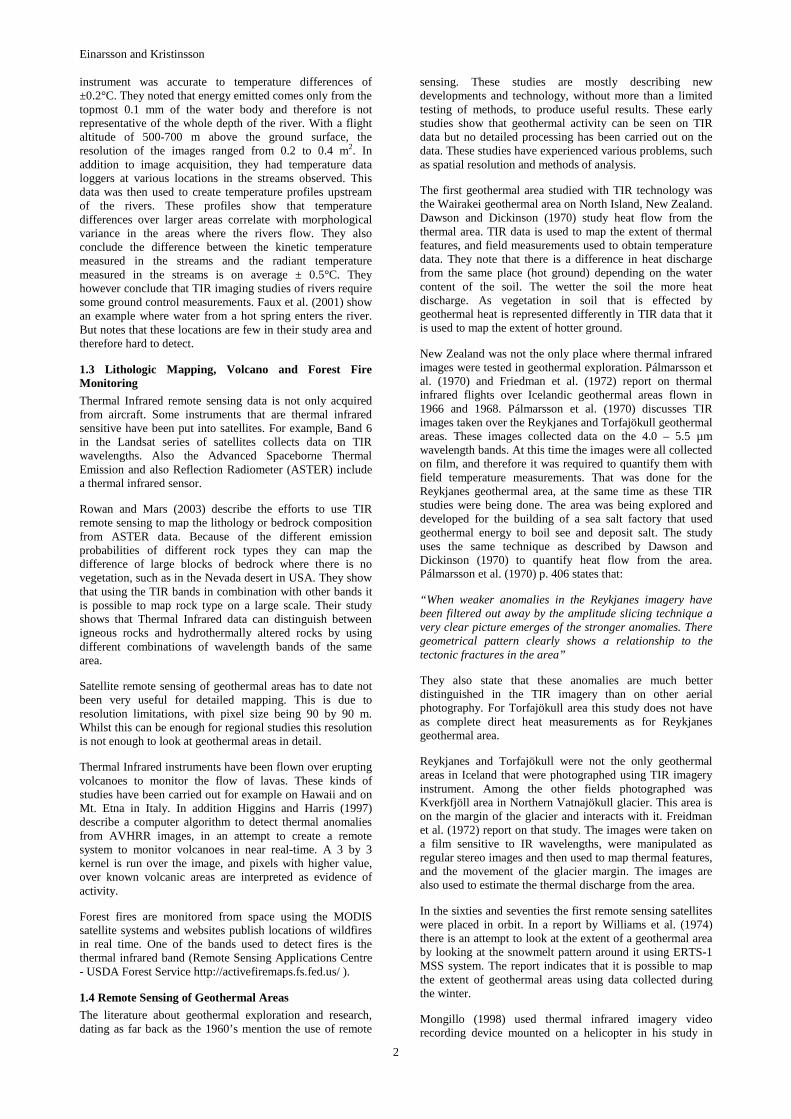
In this study soil temperature and thermal images where obtained. Soil temperature measurements carried out in grid 5 by 20 wide and at 20 cm depth. The grid was measured with tape and GPS points taken at the end of the lines.
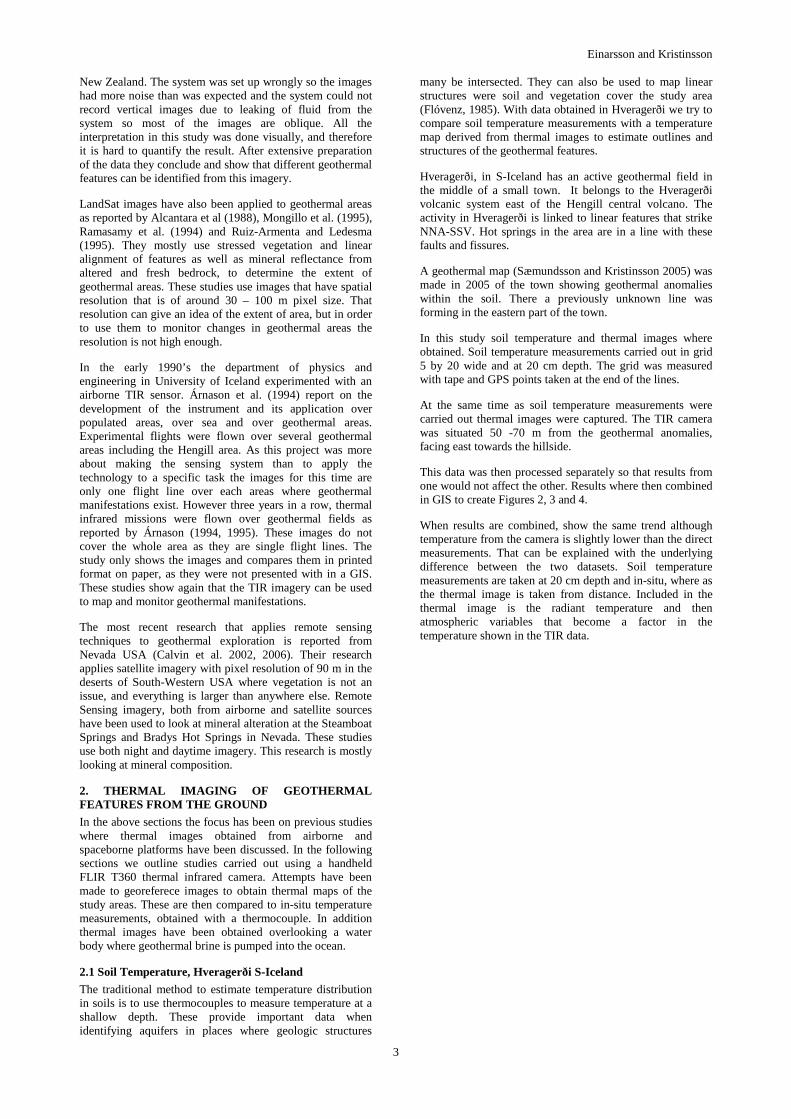
At the same time as soil temperature measurements were carried out thermal images were captured. The TIR camera was situated 50 -70 m from the geothermal anomalies, facing east towards the hillside.
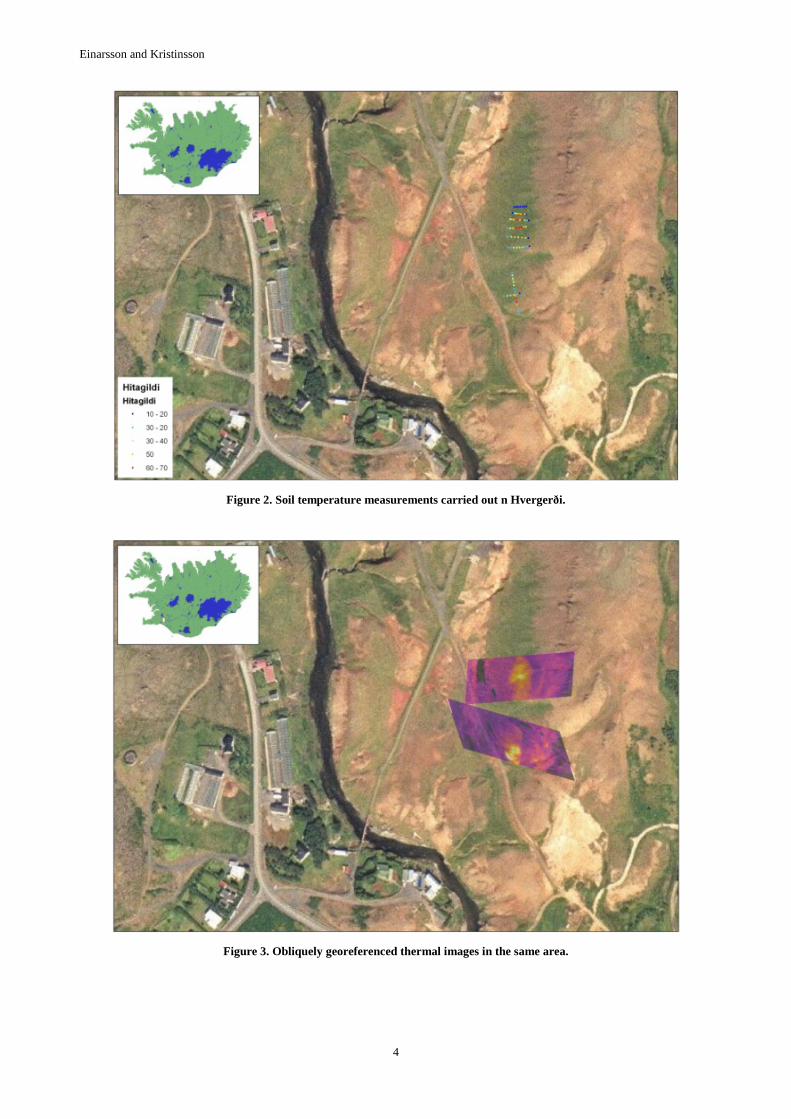
This data was then processed separately so that results from one would not affect the other. Results where then combined in GIS to create Figures 2, 3 and 4.
When results are combined, show the same trend although temperature from the camera is slightly lower than the direct measurements. That can be explained with the underlying difference between the two datasets. Soil temperature measurements are taken at 20 cm depth and in-situ, where as the thermal image is taken from distance. Included in the thermal image is the radiant temperature and then atmospheric variables that become a factor in the temperature shown in the TIR data.
Einarsson and Kristinsson
4
Figure 2. Soil temperature measurements carried out n Hvergerði.
Figure 3. Obliquely georeferenced thermal images in the same area.
Einarsson and Kristinsson
5
Figure 4. Thermal images and temperature measurements combined.
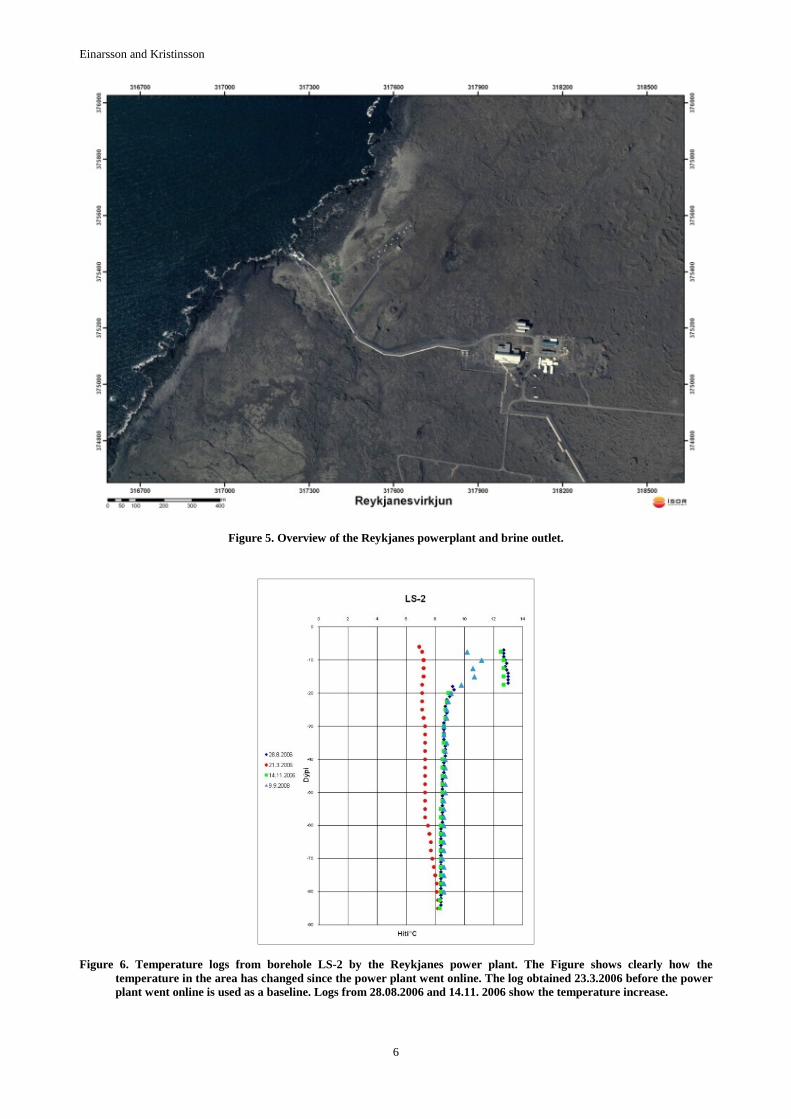
2.2 Reykjanes
The Reykjanes geothermal field has been utilized for electricity since 2007. The power plant is located at the tip of the Reykjanes peninsula and uses steam from a geothermal reservoir. The Reykjanes power plant generates 100 MW of electricity. From that time hot brine water from the power plant has been pumped in to the ocean. The volume of brine water is around 4000 l/s of 55°-75°C hot water. The power plant uses cold seawater for cooling and that water and geothermal fluid makes the brine water.
This has had some effect on the coast and surrounding water. An attempt is made to quantify this effect using thermal images as one of the data sources. Other data, such as temperature logs from boreholes are also used. In addition temperature measurements have been carried out along the coastline.
Thermal images are used to obtain estimation of the area effect by the brine water, where as borehole data indicates increase in the temperature of sea water. Figure 5 shows the described area.
Along the coast line the environmental changes are most extensive close to the disposal site and nothing can be detected 250 m NE from the site. Insignificant changes have been detected to the SW of the site. There the elevation is some meters higher than in the NE part. The predominant costal current in the area flows to the north, and north east.
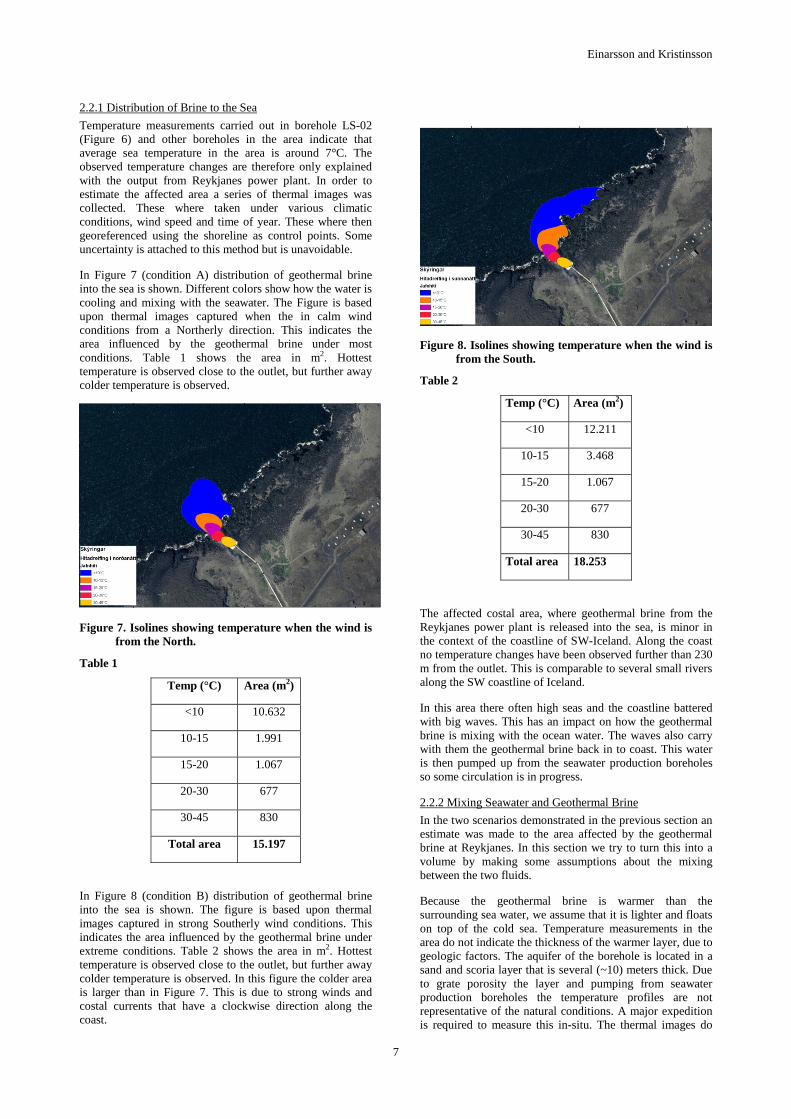
Soon after the power plant started operation a slight temperature increase was detected in the surrounding boreholes.
Well LS-02 is located in between seawater wells that provide the Reykjanes power plant with cooling water. The purpose of the borehole is to serve monitoring of the sea water reservoir. The borehole is 85 m deep and produces
mainly sea water. Temperature in the well is measured several times every year.
Before the power plant started operation temperature in the borehole was around 7°C. After the sea water became affected by the brine water, temperature started to increase in the top most part of the borehole. Temperature increased to 13°C or about 6°C when the temperature of the brine was ~70°C. This can only be explained by with the hot brine water. Then the temperature of the brine was adjusted so that slightly cooler water is now being pumped to the sea.
When the brine water was cooled down to ~50°C the temperature in LS-02 decreased to 11°C or about 2°C. Temperature logs that indicate this are shown in Figure 6.
Einarsson and Kristinsson
6
Figure 5. Overview of the Reykjanes powerplant and brine outlet.
Figure 6. Temperature logs from borehole LS-2 by the Reykjanes power plant. The Figure shows clearly how the temperature in the area has changed since the power plant went online. The log obtained 23.3.2006 before the power plant went online is used as a baseline. Logs from 28.08.2006 and 14.11. 2006 show the temperature increase.
Einarsson and Kristinsson
7
2.2.1 Distribution of Brine to the Sea
Temperature measurements carried out in borehole LS-02 (Figure 6) and other boreholes in the area indicate that average sea temperature in the area is around 7°C. The observed temperature changes are therefore only explained with the output from Reykjanes power plant. In order to estimate the affected area a series of thermal images was collected. These where taken under various climatic conditions, wind speed and time of year. These where then georeferenced using the shoreline as control points. Some uncertainty is attached to this method but is unavoidable.
In Figure 7 (condition A) distribution of geothermal brine into the sea is shown. Different colors show how the water is cooling and mixing with the seawater. The Figure is based upon thermal images captured when the in calm wind conditions from a Northerly direction. This indicates the area influenced by the geothermal brine under most conditions. Table 1 shows the area in m2. Hottest temperature is observed close to the outlet, but further away colder temperature is observed.
Figure 7. Isolines showing temperature when the wind is from the North.
Table 1
Temp (°C) Area (m2)
<10 10.632
10-15 1.991
15-20 1.067
20-30 677
30-45 830
Total area 15.197
In Figure 8 (condition B) distribution of geothermal brine into the sea is shown. The figure is based upon thermal images captured in strong Southerly wind conditions. This indicates the area influenced by the geothermal brine under extreme conditions. Table 2 shows the area in m2. Hottest temperature is observed close to the outlet, but further away colder temperature is observed. In this figure the colder area is larger than in Figure 7. This is due to strong winds and costal currents that have a clockwise direction along the coast.
Figure 8. Isolines showing temperature when the wind is from the South.
Table 2
Temp (°C) Area (m2)
<10 12.211
10-15 3.468
15-20 1.067
20-30 677
30-45 830
Total area 18.253
The affected costal area, where geothermal brine from the Reykjanes power plant is released into the sea, is minor in the context of the coastline of SW-Iceland. Along the coast no temperature changes have been observed further than 230 m from the outlet. This is comparable to several small rivers along the SW coastline of Iceland.
In this area there often high seas and the coastline battered with big waves. This has an impact on how the geothermal brine is mixing with the ocean water. The waves also carry with them the geothermal brine back in to coast. This water is then pumped up from the seawater production boreholes so some circulation is in progress.
2.2.2 Mixing Seawater and Geothermal Brine
In the two scenarios demonstrated in the previous section an estimate was made to the area affected by the geothermal brine at Reykjanes. In this section we try to turn this into a volume by making some assumptions about the mixing between the two fluids.
Because the geothermal brine is warmer than the surrounding sea water, we assume that it is lighter and floats on top of the cold sea. Temperature measurements in the area do not indicate the thickness of the warmer layer, due to geologic factors. The aquifer of the borehole is located in a sand and scoria layer that is several (~10) meters thick. Due to grate porosity the layer and pumping from seawater production boreholes the temperature profiles are not representative of the natural conditions. A major expedition is required to measure this in-situ. The thermal images do
Einarsson and Kristinsson
8
not provide any data on the thickness of the layer, as Torgersen et. al (2001) & Faux et. al. (2001) have shown. Therefore no direct data is available on the thickness of this layer. What follows is an estimate on the volume and time variables, assuming no vertical mixing.
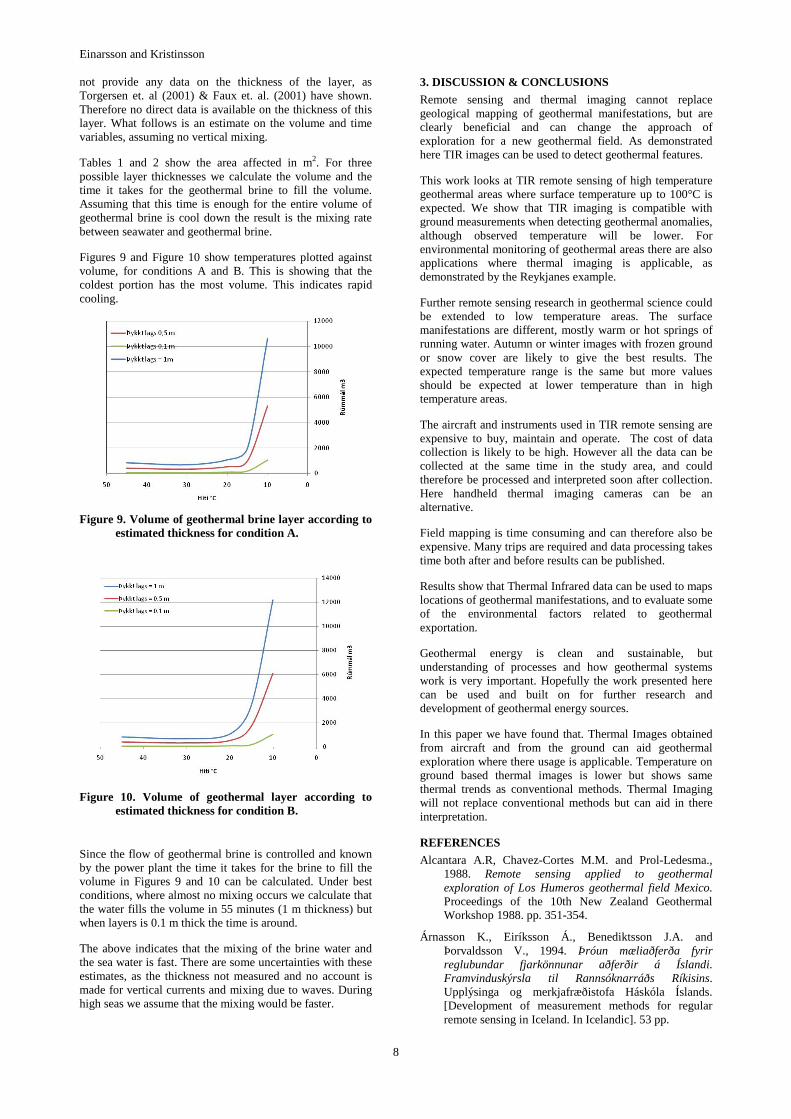
Tables 1 and 2 show the area affected in m2. For three possible layer thicknesses we calculate the volume and the time it takes for the geothermal brine to fill the volume. Assuming that this time is enough for the entire volume of geothermal brine is cool down the result is the mixing rate between seawater and geothermal brine.
Figures 9 and Figure 10 show temperatures plotted against volume, for conditions A and B. This is showing that the coldest portion has the most volume. This indicates rapid cooling.
Figure 9. Volume of geothermal brine layer according to estimated thickness for condition A.
Figure 10. Volume of geothermal layer according to estimated thickness for condition B.
Since the flow of geothermal brine is controlled and known by the power plant the time it takes for the brine to fill the volume in Figures 9 and 10 can be calculated. Under best conditions, where almost no mixing occurs we calculate that the water fills the volume in 55 minutes (1 m thickness) but when layers is 0.1 m thick the time is around.
The above indicates that the mixing of the brine water and the sea water is fast. There are some uncertainties with these estimates, as the thickness not measured and no account is made for vertical currents and mixing due to waves. During high seas we assume that the mixing would be faster.
3. DISCUSSION & CONCLUSIONS
Remote sensing and thermal imaging cannot replace geological mapping of geothermal manifestations, but are clearly beneficial and can change the approach of exploration for a new geothermal field. As demonstrated here TIR images can be used to detect geothermal features.
This work looks at TIR remote sensing of high temperature geothermal areas where surface temperature up to 100°C is expected. We show that TIR imaging is compatible with ground measurements when detecting geothermal anomalies, although observed temperature will be lower. For environmental monitoring of geothermal areas there are also applications where thermal imaging is applicable, as demonstrated by the Reykjanes example.
Further remote sensing research in geothermal science could be extended to low temperature areas. The surface manifestations are different, mostly warm or hot springs of running water. Autumn or winter images with frozen ground or snow cover are likely to give the best results. The expected temperature range is the same but more values should be expected at lower temperature than in high temperature areas.
The aircraft and instruments used in TIR remote sensing are expensive to buy, maintain and operate. The cost of data collection is likely to be high. However all the data can be collected at the same time in the study area, and could therefore be processed and interpreted soon after collection. Here handheld thermal imaging cameras can be an alternative.
Field mapping is time consuming and can therefore also be expensive. Many trips are required and data processing takes time both after and before results can be published.
Results show that Thermal Infrared data can be used to maps locations of geothermal manifestations, and to evaluate some of the environmental factors related to geothermal exportation.
Geothermal energy is clean and sustainable, but understanding of processes and how geothermal systems work is very important. Hopefully the work presented here can be used and built on for further research and development of geothermal energy sources.
In this paper we have found that. Thermal Images obtained from aircraft and from the ground can aid geothermal exploration where there usage is applicable. Temperature on ground based thermal images is lower but shows same thermal trends as conventional methods. Thermal Imaging will not replace conventional methods but can aid in there interpretation.
REFERENCES
Alcantara A.R, Chavez-Cortes M.M. and Prol-Ledesma., 1988. Remote sensing applied to geothermal exploration of Los Humeros geothermal field Mexico. Proceedings of the 10th New Zealand Geothermal Workshop 1988. pp. 351-354.
Árnasson K., Eiríksson Á., Benediktsson J.A. and Þorvaldsson V., 1994. Þróun mæliaðferða fyrir reglubundar fjarkönnunar aðferðir á Íslandi. Framvinduskýrsla til Rannsóknarráðs Ríkisins. Upplýsinga og merkjafræðistofa Háskóla Íslands. [Development of measurement methods for regular remote sensing in Iceland. In Icelandic]. 53 pp.
Einarsson and Kristinsson
9
Árnasson K., 1994. Hitamyndir af jarðhitasvæðum. Fjarkönnun á hitainnrauðu sviði úr flugvél 1994 I. Reykjanes, Eldvörp, Svartsengi, Kleifarvatn og Hengill. Upplýsinga og merkjafræðistofa Háskóla Íslands. [Heat images of geothermal areas. Thermal infrared remote sensing from an airplane. I. Reykjanes, Eldvörp, Svartsengi, Kleifarvatn og Hengill]. 48 pp.
Árnasson K., 1995. Hitamyndir af jarðhitasvæðum. Fjarkönnun á hitainnrauðu sviði úr flugvél 10.nóv 1995 II. Krísuvík, Brennisteinsfjöll og Hengill. Upplýsinga og merkjafræðistofa Háskóla Íslands. [Heat images of geothermal areas. Thermal infrared remote sensing from an airplane. II. Reykjanes, Eldvörp, Svartsengi, Kleifarvatn og Hengill]. 36 pp.
Calvin, W. M., Coolbaugh, M., Kratt, C. and Vaughan, R.C., 2006. Application of Remote Sensing Technology in Geothermal Exploration http://www.unr.edu/geothermal/pdffiles/CalvinGSN05.pdf [last visited 2. may 2006].
Calvin, W. M., Coolbaugh, M. and Vaughan, R.C., 2002. Thermal Infrared remote sensing for geothermal site characterization. The Geological Society of America GSA 2002 Denver Annual Meeting, paper no. 242-4. Abstract online http://gsa.confex.com/gsa/2002AM/finalprogram/abstract_43790.htm [last visited 2. may 2006]
Dawson, G.B. and Dickinson, D.J., 1970. Heat flow studies in thermal areas of the North Island of New Zealand. Geothermics Special Issue 2. pp. 466-473.
Faux, R.N., Lachowski, H., Maus, P., Torgersen C.E. and Boyd, M.S., 2001. New approaches for monitoring stream temperature: Airborne thermal infrared remote sensing. Report. 32 pp. Available online http://oregonstate.edu/~torgersc/pub/Fauxetal2001.pdf [Last visited 23. may 2006]
Flóvenz Ó.G., 1985. Applications of subsurface temperature measurements in geothermal prospecting in Iceland. Journal of geodynamics 4. pp. 331-340.
Freidman J.D., Williams Jr R.S., Þórarinsson S., and Pálmarsson G., 1972. Infrared Emission from Kverkfjöll Subglacial Volcanic and Geothermal Area, Iceland. Jökull 22. pp. 27 – 43.
Higgins, J. and Harris A., 1997. VAST a program to locate and analyse volcanic thermal anomalies automatically form remotely sensed data. Computers and Geosciences 23. 6. pp. 627-645.
Mongillo M.A., 1998. Thermal infrared video imagery of the Rotorua geothermal field. Proceedings of the 10th New Zealand Geothermal Workshop 1998. pp 333- 338.
Mongillo, M.A., Cochrane G.R. and Browne P.R.L. 1995. Application of satellite imagery to explore and monitor geothermal systems. Proceedings of the World Geothermal Congress 1995, Pisa Italy. pp 951- 956.
Pálmarsson G., Friedman J.D., Williams Jr. R.S., Jónsson J. and Sæmundsson K., 1970. Aerial Infrared Surveys of Reykjanes and Torfajökull Thermal Areas, Iceland, with a Section on Cost of Exploration Surveys. Geothermics. Special issue 2 U.N. Symposium on the Development and Utilization of Geothermal Resources. Pisa. Vol. 2. Part 1. pp 339-412.
Ramasamy S.M., Jayakumar R., Balaji S. and Balasubramanian, 1994. Application of Remote Sensing for Geothermal exploration in Southern Indian Peninsula. Proceedings of the 16th New Zealand Geothermal Workshop. pp 203-208.
Remote Sensing Applications Center - USDA Forest Service http://activefiremaps.fs.fed.us/ [Last visited 2. august 2006].
Ruiz-Armenta, J.R. and Ledesma, R.M.P., 1995. Identification of hyrdothermal alteration using Satellite images in areas with dense vegetation cover. World Geothermal Congress Italy 1995. pp. 945-949.
Rowan, L.C and Mars J. C., 2003. Lithologic mapping in the Mountain Pass, California area using Advance Spaceborne Thermal Emission and Reflection Radiometer (ASTER) data. Remote Sensing of Environment 84. pp 350-366.
Sæmundsson, K. and Kristinsson S.G., 2005. Hveragerði. Hitamælingar í jarðvegi og sprungur. ISOR-2005/041. 16 pp, 2 maps. [In Icelandic].
Torgersen, C.E., Faux R.N., McIntosh, B.A., Poage N.J. and Norton D.J., 2001. Airborne thermal remote sensing for water temperature assessment in rivers and streams. Remote Sensing of Environment 76, 386-398 pp.
Williams R.S., Böðvarsson Á., Friðriksson S., Pálmarsson G., Rist S., Sigtryggsson H., Sæmundsson K., Thorarinssson S. and Thorsteinsson I., 1974. Environmental Studies of Iceland with ERTS-1 imagery. Proceedings of the ninth international symposium on remote sensing of environment 1974, 52 pp.
![THERMAL IMAGING GUIDEBOOK - flirmedia.com · THERMAL IMAGING GUIDEBOOK FOR FACILITIES MAINTENANCE. Table of Contents: 1] How thermal imaging cameras work 2 ... and water intrusion](https://img.pdfslide.net/doc/110x75/5b47a1fc7f8b9a252e8b889b/thermal-imaging-guidebook-thermal-imaging-guidebook-for-facilities-maintenance.jpg)