Embed Size (px)
Citation preview

PLEA NO T ES
note 2
Passive and Low Energy Architecture International DESIGN TOOLS AND TECHNIQUES
THERMAL INSULATION Andras Z61d and Steven Szokolay
IN ASSOCIATION WITH THE UNIVERSITY OF QUEENSLAND DEPT. OF ARCHITECTURE & REPRINTED BY RESEARCH, CONSULTING AND COMMUNICATIONS, KANGAROO VALLEY, NSW ,

THERMAL INSULATION
©. Andras Zlild and Steven V. Szokolay all righ.ts reserved
edited by s v Szokolay
first published 1997 Reprinted by R.C.&C. 2001
PLEA : Passive and Low Energy Architecture International In assocla!ion with Department of Architecture, The Univel'sity of Queensland Brisbane 4072
Andras Zold is professor of Building Physics at the Tecllntcai University of Budapest (Hungary), chairing the Department of Building Energetics. He is author of numerous books on energy conservation, energy economics In buildings and he serves on both national and intematlonal standards committees.
Steven V. Szokoiay was Director of the Architectural Science Unit and later Head of Department of Architecture at the University of Queensland-now retired. He has a dozen books and over a hundred research papers to his credit. He is a consultant to various UN bodies and served on numerous government committees. He is currently President of PLEA.
The manuscript of this pubficatlon has been refereed by John Martin Evans. Director. Research Centre for Habitat and E;nergy, University of Buenos Aires.
and Or. Nick Baker, Director, The Martin Centre, Department of Architecture The University of Gambrtdge
Originally printed by The University of Queensland Printery, Manager ian Taylor Reproduced by R.C. & C., NSW
ISBN 0 86776 671 9
PREFACE
The Directorate of PLEA (Passive and Low Energy Architecture} International recognised the lack of inexpensive but authoritative texts on various topics relating to sustainability, to the design of buildings for passive environmental control. In response to this need it was decided to produce and publish a series of PLEA Notes, under the overall title: Design Tools and Techniques.
The first in the series: Solar geometry has been published last year and the present Thermal Insulation is Note 2 in the series. Note 3, on Thermal comfort is in preparation and it is likely to be published later this year.
Further titles in preparation are:
Radiative and evaporative cooling Control of open spaces Energy issues in sketch design Daylighting.
Any suggestions for further topics to be covered, offers of contribution, as well as comments and criticisms would be welcome and should be addressed to me, as series editor, at P 0 Box 851, Kenmore, 4069, Australia fax No: 61 7 3378 1051 or e-mail: [email protected] .au.
These Notes are available at the same address.
Steven V. Szokolay January 1997
...
' '

CONTENTS
1
2
3
4 5
Basics and practicalities 1.1 The role of insulation 1.2 Thermal quantities 1.3 Heatflow 1.4 Surface conductatlce atld resistatlce 1.5 Cavities 1.6 Transmittance: U-value 1.7 Insulating materials ••. 1.8 Envelope conductance 1.9 Temperature gradients 1.10 Transmittance calculations 1.11 Rools at1d exposed floors 1.12 Slabs on ground and basements 1.13 Transparent insulation 1.14 Practicalities: Where to put the insulation?
1.14.1 Flat roofs 1.14.2 Pitched rools and attics 1.14.3 Floors 1.14.4 Walls: external insulation 1.14.5 External surfaces: absorptatlce and emittance 1.14.6 Walls: cavily insulation 1.14.7 Walls: internal insulation 1.14.8 Some common mistakes
1.15 What does thermal insulation give? 1.15.1 Thermal insulation and necessary air change 1.15.2 Fabric protection
1.16 Someconclusions Theory and refinements 2.1 Transport phenomena in general 2.2 Balance conditions 2.3 Design objectives and approaches 2.4 Conductivity: declared and design values 2.5 Multidimensional heal flow: thermal bridges 2.6 Calculation method 2.7 Thermal points 2.8 Resuhanl transmittance 2.9 Radiant heattransfet 2.10 Radiant heal exchange: terrestrial bodies 2.11 Radiative balance of opaque elements 2.12 Non-steady one-dimensional heat flow 2.13 Periodic heal flow 2.14 Heal storage cepacily Moisture transport 3.1 Dalton's law 3.2 Characlersistics of moist air 3.3 Sorption 3.4 Convective moisture transport 3.5 Vapour diffusion through walls 3.6 Vapour pressure distribution in cross section 3.7 Design approach 3.8 Graphic analysis 3.9 Moisture transport through flat roofs Economics of insulation References Data sheets Index
Wor1<ed examples ex.t U-value of multilayer waH ex.2 Temperature gtarfient ex.3 U-vaJue to limit inner surface temperature ex.4 lnsulauon to satisfy a requirement ex.5 Locating a point of specified temperature ex.6 U-value of a composite wall ex.l U-value of a pitched roof ex.8 Modifyir>J U-value for added insulation ex.9 CalculatiOn of ground losses examples 1, 2, 3, 4 correcled ex. t 0 Modify U-value for thermal points ex.tt Resultant U-value calculation ex. 12 Prediction of condensation risk
2
page 5 5 6 7 7 8 8
10 10 11 16 17 18 18 20 20 21 22 23 24 24 25 25 25 26 26
27 28 28 29 31 32 34 35 36 37 39 40 41 42
43 43 46 46 47 48 49 50 54 55 58
59-65 66
11 12 12 13 14 15 16 17 17 30 34 35 51

CONTEXT
Thermal insulation is one of the most important techniques In the hands of the architect for providing indoor thermal comfort with minimal energy use. Insulation can drasticalfy reduce, in some cases almost eliminate heat flow through the building envelope. Its role is most significant in climates where the thermal problem is constant for long periods of time, such as
1) in cold climates, in heated buildings, where heat loss is to be reduced
2) In warm climates, in air conditioned buildings, where heat gain is to be minimised
In climates where cold winters alternate with hot summers, insulation may be beneficial in both seasons.
However, in climates with large diurnal variations, or in any climate where the building can satisfactorily operate 'free running', I.e. without heating or cooling, the significance of insulation is much reduced. Here several other thermal control strategies may be used.
In hot-dry climates the thermal mass of the building can be relied on to even out the large diurnal variation of temperatures. In fully crossventilated buildings of warm humid climates the role of insulation is reduced to practically nil, as the indoor air cannot be lower in temperature than the outdoor, so there is no temperature difference. Exceptions are all envelope elements exposed to solar radiation, particularly the roof. Here the heat flow is driven NOT by the outdoor-indoor air temperature difference, but by tihe difference between the sol-alr temperature of the outer surface (which expresses the combined effect of air temperature and solar radiation) and the indoor alr. For such elements insulation is advisable.
Undoubtedly, insulation is paramount from the point-of- view of energy conservation. It is in consistently cold, or consistently hot climates where buildings use the most energy for heating or air conditioning. And it is under such circumstances that thermal insulation is most effective.
The present Note deals with thermal insulation only. Future Notes will be devoted to other techniques of passive thermal control.
Some may find the present Note too theoretical, abstract and short of actual application examples. This is however quite deliberate. The authors believe that rather than presenting ready-made solutions for a large number of different problems, the principles must be clarified, as if one knows these principles, one can derive the solution for any Situation. The best procedure for any situation is to check what the heat trasfer mechanism is and select the appropriate insulation accordingly.
3

Symbols and abbreviations
(rn'} -. b breadth, lhid<ness (m) A area b• effective ttid<ness (m) AH absolute humidity, moistll'e conl(gtl\g)
c specific heat capacity (J/kgK) c conductance (Wtm•K)
cv vapour concentration (g/m') OBT dry bulb temperature c•q
h height (m) E radiant emission CNim'l
h. convective surface conductance (W/m>K) F, shape factor
hi inside suriace conductance (Wim>K) G global (solar) irradiance (W/rn')
ho outside surtace conductance (Wfm>K) H heat stored (JIK)
h, radiation coefficient (Wtm•K) Hs saturation absolute humidity (g/kg)
k linear heat loss coefficient (W/mK) L volume now in ventilation (m'lh)
I lenglh (m) p permeance (rr¢.m'ltPa) a heat now rate (nux) (W) m mass flow rate (e.g. vapour flux) (glh)
R resistance (m'K/W) p partial pressure of water vapour (Pa)
Ra-a air-to-air resistance (m>KIW) Po saturation vapour pressure (Pa)
Roo surface resistance, oulside (m'K/W) q overall heat loss coefficient (WIK)
Rsl surtace resistance, inside (m'K/W) q. envelope conductance (WIK)
Rv vapour resistance (N.s/g) q. ventilation conductance CNIKl RH relative humiday (%)
s storage quantity temperature ("C)
t.S change in storage quantily '· air temperature c·c1 T absolute temperature c·Kl ~ temperature inside c·c> Tc time constant (s) lo temperature outside c·q u U-value, thermal transmittance CN/m>K)
'"' relative temperature scale
UR resultant U-value rNJm>Kl t.. sol-air temperature c·q w water vapour production (g/h) t.t temperature difference (K)
WBT wet bulb trremperature c•cJ w wavelength (radiation) (flm)
u (alpha) absorptance 6 (delta) permeability (n¢m.kPa)
6 (epsilon) emittance K (kappa) correction to conductivity ). Oambda) conductivity (W/mK)
p (rho) density (kg/rn'} (1 (sigma) Stefan-Boltzmann constant CNfmZK•)
~ (tau) transmiltance 41) (omega) moisture content (10 solids) (%)
4

Fig.U
rfr= I
A leaking bucket
40"C
to•c
Fig.1.2 Temperature point and interval
THERMAL INSULATION
Part 1 BASICS AND PRACTICALITIES
1.1 The role of lnsulalion
A bLilding Is essentially o space surrounded by the ouHcflng envelope: floor, walls and roof as the main elements, which may Include subelements, such as windows, doors, etc. If the Interior spoco Is kept at o temperature different from that outdoors (by heating or cooling), heat will flow through the envelope from the wormer to the cOlder side.
In winter, heating Is provided by some energy-using Installation. This heat input must equal the heat loss, if the Indoor temperature is to be maintained. The analogy of a leaking bucket (Fig.l.1) may help to visuof.se the piocess. Cteo~y. H the water level (the indoor temperature) is to be mdntOinod. the water flow rote from the top (the heat input) must be the some os the water flowing out through the hOles (the heal loss through the envelope), The water level Is analogous with temperature. If the sum of· all leaks Is greaiEII than the flow from the lop, the water level (the indoor temperature) wDI drop. Conversely, when the bucket Is empty (the inside is at lhe same temperature as the outside) and we wont to liM tho bucket (heat up the building), the flow from the top (the heat input) must be greater then the leaks (the heat foss),
If energy Is to be conserved, or the healing cost Is to be kept down, then the heal loss through the envelope should be reduced C leak plugging'). This Is the task of thermal Insulation.
In summer, If the Interior Is cooled by on ene~gy-bosed !Niollollon (eg. mechanical cOOling) then there wit be on Inward heat flow,le. heat gain, which Is port of the cooing lood. This con also be controled by lnsuotlon.
Before we con oHempt to contrOl such heat flows, the heal transfer processes themselves must be understood.
1.2 Thermal quantities
Heal is a form of energy, appearing as molecular motion In substances or as radiation In space. If Is measured in the some units os any other form of energy: the Sl unU being the joule (J). The mulllples kJ (kiloJoule • 1 CXXl J) and MJ (megojoule • 1 000 000 J) ore often used,
Temperature con be considered os a symptom of the presence of heat in a substance; It Is o measure of the thermal state of that substance. The Celsius scale tokes the freezing point of water as the starling point, OOC and the boling point (under normal atmospheric cond<liOns) as lOO"C. The total absence of heat Is the starting point of the absolute temperature or Kelvin scale. The Intervals of thiS scale ore the some as of the Celsius scale, but the starting pOint is the 'absOlute zero', -273.15•C. In notation the folowing convention is adopted (Fig. 1.2): • a particular poSition on the scale (1): •c • a temperature difference or interval. regardless of Its position on the
scale (t.t): K
5

THERMAL INSULAT10N
Specific heat capacity (c) of a substance expresses the relationship between heat and temperature: it is the amount of heat energy that causes unit temperature increase of a unit mass of the substance. measured in units of J/kg.K. Some typical values are:
brick, concrete 800- 1000 J/kg.K dry air 1005 J/kg.K water 4176 J/kg.K ' · ·
For values of ather materialS see Data sheet 1.
1.3 Heat flow
The magnitude of heat flow can be measured two ways: a) as heat flow rate (Q), or heat flux, ie. the total flow In unit time through
a defined area of a body or space, In units of J/s. which Is a watt (W) b) as heat flux density (or density of heat flaw rate), le. the rate of heat
flow through unit area of a body or space, in W/m2 • The muHiple kW, (kilowatt) Is often used for both quantnies).
Heat can be transmitted by three processes: • conduction, the propagation of heat within a body, le. the spreading
of molecular movement throughout an object or objects in contact • convection, in a narrow sense the transfer of heat from a sOlid body
surface to a fluid (gas or liquid) or vice-versa, but In a broader sense it may mean the transport of heat by a carrying fluid from one said surface to another. at some distance away
• radiation: Infrared wavelegths of the electromagnetic radiation spectrum, referred to as 'radiant heat', le. the heat transfer between opposing surfaces, which wiD take place through space, even through vacuum.
All three processes occur in heat transfer through the building envelOpe and each can be contrOlled by different means.
The magnitude of conducflon heat flow rate between two points of a solid (or stagnant fluid) depends on four quantities: a) the cross-sectional area (A) through which the heat can flow. taken
perpendicular to the direction of the heat flow, given In m2
b) the thickness (or 'breadth', b) of the body, ie. the length of heat now path, given in m
c) the temperature dffference between the twa paints (eg. two opposite surfaces of on envelope element), At= t.-t. given inK
d) a characteristic of the molena!. known as conductivity (1.), in older literature referred to as the 'k-volue', measured as the heat flow rote through unit area. with unit temperature difference, between two points unit distance apart, as W.m/m2K = W/m.K The value of 1. varies between 0.02 W/m.K for a very good insulating material and almost 400 W /m.K for a highly conductive metal, such as copper (see Data sheet 1).
The heat flow rote (Q) Is proportionate to the area. the temperature difference and the conductivity, but lnversety proportionate to the thickness (b = 'breodth1.
A Q-A•b•(t.-t;) ... 1.1)
If both 10 and t1 are constant (or assumed to be constant) we consider steadv-state heat flow. In real Situations one or both the.se temperatures vary, which causes a non-steady heat flow.
6

t t
lJ ·~
THERMAL INSULATION
A special case of this is the periodic heat flow. when a certain cycle (eg. the 24-hour day) repeats Itself with little change. ThiS will be mentioned In section 1.7 and discussed in detail in section 2.12-13. However. of least with lightweight structures the steady-state assumption con still be used to provide a snapshot of the momentary heat flow. or an estimate of the overage heat flow ovetQ full cycle,
Whilst conducNvlty Is a property of the material. regardless of shape and Size, conductance (C) is the corresponding property of a defined body, a building element. such os a slob. lfs unit Is W/m2K.
The reciprocal of conductance is resistance ( rl ) in m2K/W, proportionate to the thickness and inversely proportionate to the conductivity.
b R·- ... 1.2) ~
Note that the -ltv ending implies a material property, whilst 1he -once ending the property of a defined body, such as a slab or a wall.
In a multilayer construction (eg. a wall of n layers), the heat will fiOY! through the layers in sequence, thus the resistances of these layers ore "in se(!es', therefore additive.
... 1.3)
1.4 Surface conductance and resistance
WhilSt conductance Is a measure of heat transfer through an element from surface-to surface, the surface hself also offers a resistance to heat flow. These surface resistances ore denoted rl0 or rl"" for inside and outside surfaces respectively. The reciprocal of surface resistance is the lit d
l l • • surface conductance (h), so rl• = ..!. and rl.., = ...:!.. Surface conductance IIi h0
ta ce Is a lumped parameter, including radiant and convective components: Fig.1.3 Surface conduc n h = h + h In the us the terms film coefficient or film conductance is increased by arr ftow (den~ted f) are often used with the same meaning os surface
Fig.1.4 and reduced if the air is still
conductance.
The magnitude of surface resistance depends on the position of the surface, on the direction of heat flow and on air movement (Figs. 1.3 and 1.4). The lost can be natural, due to temperature difference, or forced, eg. due to wind. Standard values ore given in Data sheet 2.
1.5 Cavities .·
Within a matertal layer heat Is propagated by conduction. If the bLilding element includes a cavity or air space. the heat transfer through this is more complex: mainly by convection and radiation. only to a minor extent by conduction. .
In cavities more than a few miUimetres thick. convection currents will develop a nd substantially increase the heat transfer (fig.1.5). The resistance of a cavity will depend primarily on its position (vertiCal in a wall, horiZontal in a roof) and the direction of heat flow. The width of the cavity will make very little difference beyond about 25 mm . The radiant heat transfer may be significant from the wormer to the cooler surface facing the cavity: normally about 2/3 of the total heat flux. 11 occurs even if the
7

THERMAL INSULA 110N
cavity Is evacuated, as radiation travels also through vacuum. Radiant transfer will depend on surface qualities: emittance and absorptance of the two surfaces. In practice it is sufficient to employ a cavity resistance (Rc) value which combines convective and radiant components, but distinguishing cavities between ordinary building materials and with low emittance surfaces (eg. aluminium foil). Cavity resistqr:~e values are given in Data sheet 2.
1.6 Transmittance: U-value
Heat transmission through an envelope element takes place from the air inside the building to the air outside (or vice-versa). The air-to-air resistance (R0 _ 0 ) will be the sum of the resistance of the element itself and the two surface resistances. The reciprocal of this air-to-air resistance is the transmittance, or U-vatue. The unit of measurement is the same as for conductance (W /m2K), the difference being that conductance is taken from surface to surface, whilst the U-value from air to air (Fig.l .6).
... 1.4)
The transmission heat flow is proportionate to the U-value, the area (A) of the element, perpendicular to the direction of heat flow and the difference between the outdoor and indoor temperatures
... 1.6)
The convention here adopted is that always the t1 is subtracted from the t0 , as in winter this gives a negative difference, a negative Q, indicating heat loss. A positive Q indicates heat gain, eg. in air conditioning load calculations.
Air has a very low conductivity, as long as it is still. The best insulators are structures which encapsulate air with as little material as possible. Insulation is provided by the air, the material is there in the form of bubbles, or fibres only to keep the air still.
1. 7 Insulating materials
If the definition of 'insulation' is the control of heat flow, then three forms of insulation can be distinguished: reflective, resistive and capacitive insulation.
Reflective insulation, as mentioned above, can be employed where the dominant heat transfer mechanism is radiation. The only practical reflective insulating material is aluminium foil, which has ·a low absorptance and low emittance (approx. 0.02- 0.05). It can be used on its own, but more frequently laminated with building paper, either single or double-sided, or even to a plasterboard (resulting in a ' foil-backed' plasterboard. To be effective, it must face a cavity or air space. Various multiple-foil insulating products are on the market (eg. 'space- age batts') .
Resistive insulation materials are often referred to as 'bulk insulation': most products are available in this category. In fact all building materials have some resistance to heat flow. Metals are good conductors of heat, so
8
Fig.1.5 Convection air current in cavity
Fig.1.6 Conductance and transmittance
. .

THERMAL INSULA110N
they offer verv lttle resistance. The resistance of a thin metal sheet is neoiQ•ble: its Oir-to-oir resistance wll be the sum of the two surface resistances: R...., • R,. + R1
Conceptually II may be useful to cfJSiinguish a) Insulation. slngle-funcflon materials, whiCh can only be used in
conjunction with others and serve no other purpose but to reduce the heat flow
b) Insulating, multi-purpose materialS, which con stand up on their own, con even be load··bearing, but have reasonable Insulating qualities.
In the first cotegorv there a re two maJor types: fibrous motertols and foams. Exomplos of fibrous Insulation materials ote: • mnerol wools • glass fibre bolls and quits but also some organic fibres (some ote rarely used tOday): • eelgrass • kapok • celulose fi:>re (often produced from recycled paper, used as loose fl)
Foams ore mostly expanded plastic materteis: • expanded polystyrene (EPS) • extruded polystyrene (eg. 'Styrofocrn') • polyurethane • urea -formaldehyde (falling Into disrepute for Its 111-effocls on health) Most of these oro ovolloble as rigid, or semi-rigid slobs of va~ous densities and some con be foamed In situ (eg. Injected Into cavities). ThElre ore also some Inorganic loose fill insulation motertols: • exfoliated vermiculite • pertlle. These may be usod as ightwelght aggregates In concrote (In Ueu of gravel or crushed stone), to form venous types of lightweight concrete, which Is a mu~l-purpose Insulating material.
Ughtweight concretes con also be formed with some foaming (oerohng) agent. A popular example of this Is the • AAC (outocloved aerated concrete), marketed under different trade
names, such as · Thermolte' or ·Hebel blocks'.
Other mlAtl-purpose lnslAoting matertols include various slobs or panelS made of organic motertols, such as • strowboord (eg. 'Stromlt? • reed-board • wood-wool Slob (eg. 'Herak~!) •' • wood- (01 cone-) fibre soft boards (eg. ·canelte')
CapociHve Insulation Is most often discussed as 'thermal capacity' or ' thermal moss', as a totoly separate topic. 11 is verv <Jilferent. Resistive and reflective lnsiAolion has on Instantaneous effect, but capacitive insulation also affects the timng of heat now: it has a delayWlg effect. This difference can be best illustrated by the compariSOn of a) a 10 mm pofYsiYrene slab (U ; 2.17 W /m'K) and b) a 400 mm dense concrete slob (also U; 2.17 W/m"'Q
Under steady-state conditions there win be no difference In heat flow through the two slobs. A significant difference will however occur if these slobs are exposed to a periOdically changing set of conditions.
9

THERMAL INSULA TlON
Fig.1 .7 shows the variation of heat flow rote over 24 hOum at the inside face of the two slobs. exposed to the some external temperature vortotion, whilst the indoor is kept constant. The dolly mean heat flow is the some. but the two sinusoidal curves differ In two ways: time-lag
a 40W
30
20
10
0 12 16 20
d ampleoncr
ecr• 24 amplo
-10 hours Fig.1 .7 Periodic heat flow: a light and a heavy wall of the same U-value
1. the heavy slob's heat flow is delayed: the term lime-lag Is defined as the dilference {in hours) between the peaks of the two curves
2. the amplitude (mean-to-peak) of the heavy slob's curve is reduced well below that of the lightweight one's; the ratio of the two amplitudes is the decrement factor (or amplitude decrement).
The capacitance effect wi l be further cfiScussed in section 2.13-14.
1.8 Envelope conductance
A room or a buRdlng con be choroctertsed by Its envelope conductance (q,). This is the sum of the products of the areas and the U-volues of all envelope elements of the room or building. Note that the word ·conductance' Is used here with a meaning d ifferent to the above: dimensionally this is W/m2K• m2 = W/K.
q, • 2: (A•U) ... 1.7)
The sum of this and the ventilation conductance (q,. which has the some dimension) is the overall heat toss coeffiCient (someHmes referred to as the specific heat loss rote of the building): q = q, + q,.
Venlilation is not lho S<Jbject of lhis Note, suffice it to say that q, • 1200ovr 01 q,= 0.33•V•N where 1200 J,\n'K 01 0.33 Wh/m'K is IlK> specifiC heal of air
vr • ventilation tale in ~/S N = oomber ol air changes per hour V • volume ol room 0< wilding in ~
1.9 Temperarure gradient
The temperature cfiSiribulion in the cross-section of o building element is important from several points of view (eg. thermal comfort, fabric protection. condensation prediction). Temperatures of the indoor and outdoor air ore given. The heat flow is inversely proportionate to the resistance. Under steady state conditions the heat flux Is the same at any plane of the cross section (or through any Ioyer).
10

Fig.t .8 Temperature gradient:
TliERMAL INSULATION
AI any point of the heat flow path. without storage capacity, the arriving flow must equal the leaving flow. The ratio of temperature drop in each Ioyer to the resistance of that Ioyer is the some as the ro~o of the air- toair temperature difference to the olr-to-oir reSistance.
Q t.-t, '•-'• t.-t • . ~ !z..=!!. t 1 -t1 - ...x....-...a..-~ -~- - ---R R,., R3 R2 . R1 R11
... 1.8)
Figs.1.8 - 1.10 show the temperature gradient in various walls. The small orcs at 11 and t0 show the effect of surface resistances. The gradient Is steeper in on lnsuoting Ioyer and flatter In o more conductive material.
wall with external insulation 1.1 0 Transmittance calculations
Fig.1.9 same, but internal insulation
Fig .1.1 0 same, between two solid layers
Examp/9 1 U-value of a multllay9r wall
A won of four loyeiS has the these characteristics, starting from the inSide:
No Material b , m W/mK
1 Plaster O.QlS 0.50 2 Brick 0.30 0.62 3 Expanded polystyrene 0.05 0.035 4 Rende1ing O.Dl 0.60
The A values ore obtained from Dolo sheet 1 and the resistances from Data sheet 2. ColcL•ate the transmittance.
The component reSistances ore: --- · Inner surtoce: Rsi =0.12
lslloyer Rl = O.otS = 0.03 0.50
2nd layer R2 0.30 "0.484 =-0.62
3rd Ioyer R3 = J>.OS = 1.4286 0.035
4th Ioyer R4 0,01 = O.D17 =-0.60
outer surtoce ~'~so =0.06
Air - to - air reslslonce ~'~a-a = 2.14 (rounded)
The lionsmittonce: U- value 2.14
= 0.467
ExampleZ Temperature gradient
Continue the previous example and establish the temperature grodien1. when t1 = 20"C and t0 = o•c. The temperature drop in each Ioyer is proportionate Jo its resistance. The ratio of these temperature drops and the total indoor-outdoor temperature difference Is the same as that of the resistance of the Ioyer and the air-to-air resistance. The resistance ratios (R0/R0 _
0) ore the following:
11

THERMAL INSULA l10N
Inner SUI lace 0.12 2.14
=0.056
1sttover 0.03 = 0.014 2.14
2nd Ioyer 0.484
=0.226 2.14
3rd Ioyer ~ =0.666 2.14
4th Ioyer 0.017 =0.006
2.14
External surface 0.06
:0.028 2.14
'•. • ' cr.'
(these ratios must odd up to 1)
1050 300 15
For each Ioyer the temperature drop will be lhe above ratio times the air- Fig.1.11 Temperature gradie lo-01I temperature difference (10 - t~. which in this case Is 0- 20 = -20< constructed by resistance rati
61 I
II= 20.00C -20 . 0.056 = -1.12 = 18.88 -20 • 0.014 = -0.28 = 18.6 -20 • 0.226 = -4.52 = 14.08 -20 • 0.668 " -13.36 = 0.72 -20 . 0.008 .. -0.16 = 0.56 -20 • 0.028 = -0.56 = 0 see Fig. 1.11.
Temperature gradient con also be constructed by drawing o crosssectiOn ot the element to a scale of resistances (Fig.ll/o). In the above example the olr-to-oir resistance Is 2.14 rrt'X/W. To frt the size of space available toke this to equal 107 mm. le. a scale of 1 m"'</W = 50 mm. Set up on arbitrary vertical temperature scale (eg. using lhe some as above. 20 K • 50 mm or 1 K = 25 mm), mark the Inside and outside oil temperatures and connect these tty a straight lne. The Intersection point or this Rne wllh the Ioyer boundorues con then bo projected across to a physical section ot the element and wiA give the temperature gradient.
I J' 0.~ 0.017
XJ.I' Fig,1.11/a
1.•1 .rKJW 041 I I
0 0) 0.11
¥4 Av
lO'C
Cross section to a resistance scale tor constructing a gradient
12
. ...
lOOmm >

THERMAL INSULATION
Example3 U-value to limit Inner surface temperature
An existing soUd brick won has the following data:
No Motertol b ),.
'·. m W/mK
1 Plaster O.Ql 0.5 2 Brick 0.3B 0.84 3 Rendertng O.Q15 0.6
1-~->l.k-..->1.-The order Is given from the Inside. Temperatures: tr = 2Q•C, t0 = -1 O"C.
The inner surface temperature should not drop below I 7•c. to ovoid a lowering of the MRT (mean radiant temperature) and to prevent surface or capillary condensation. Define the necessary added thermal insulation so that the Inner surface temperature should not be less than 17•c at
lil design conditions. The maximum permiSSible temperature difference between the Indoor air and inner surface is 20-17 = 3K. 10% of the total outdoor - indoor · temperature difference. Thus the inner surface resistance, 0.12 m 2K/W
~ Fig.1.12.) should not be more than 10% of the total air- to- air resistance of the insulated construction. Therefore the minimum air - to - air resistance must be 10 • 0. 12 = 1 .2 m'KIW
Fig.1.12 Maximum inner Resistances of the existing wall layers ore: surface temperature stipulated
Inner surface Rs~ =0.12
Plaster Rl O.o1 :0.02 = -0.5
Brick R =~ 2 0.84 = 0.452
Plaster R _ 0.015 3- --
0.6 :0.025
External surface Rso =0.06
Air - to - air resistance Ro-o = 0.677
To hove the required value. 1.2 - 0.677 = 0.523 resistance must be added. Thus for the additional thermal Insolation the ratio
b,M = 0.523 must be achieved. A IM . . If expanded pOlystyrene is applied as In ex. 1, the A. value is 0.035, thus b~ns = 0.035 • 0.523 = 0.01B m (1B mm)
Insulation motertals ore produced in discrete thicknesses, therefore the calculated thickness should be rounded up to the next thickness available and the calculation repealed with this.
Example4 Insulation to satisfy a requirement
Assume that a giVen regulation limits the U value of building elements and the maximum for exposed waDs is Umox = 0.5 W/m2K. The intended construction is: 250 mm brick (plastered) + thermal insulation + 120 mm brtck. What is the necessory thickness of the insulation?
13

THERMAL INSULA TlON
The given construction from the inside is:
No Material b A m W/mK
1 Plaster 0.01 0.50 2 Brick 0.25 0.62 3 Insulation ? 4 Brick 0.12 0.84
The necessary air - to - air resistance will be 1 1
Rmln = --- - = 2.0 u,.,. 0.5
Resistances of the surfaces and of the given layers:
Inner surface Rll = 0.12
1st Ioyer Rl =~ 0.5
=0.02
2nd layer R _ 025 2 - 0.62
=0.403
4th layer R _ 0.12 4 - 0.84
=0.143
External surface Rso =0.06
Total Ro-o = 0.746
'(inner skin).
(outer skin)
To achieve or exceed the above value, 2.0 - 0.746 = 1.254 m2K/W resistance is to be added. The A value of o mineral woOl (150 kg/m' density) Is 0.044. With this the minimum thickness will hove to be bmln = 0.044•1.254 = 0.055 m The discrete thicknesses available ore 20, 40, 60, 80, 100 mm, the next higher value, 60 mm is to be chosen, thus
R3= ~ = 1.36 0.044
With this, the new air-to-air resistance will be 1.36 + 0.746 = 2.106
and the U value: - 1- = 0.475 W /m2K 2.106
which is less than the limiting value of 0.5, therefore O.K.
Example5 Locating a point of a specified temperature
Calculate the temperature distribution of the previous wall and determine the plane of o•c temperature If tr = 2o•c and t0 = -IOOC. The ratios of component resistances to the air-to-air resistance ore:
Inner surface 0.12 0.057 -- = 2.106
1st Ioyer 0.02 0.0095 --= 2.106
2nd Ioyer 0.403 0.191 -- = 2.106
3rd Ioyer t36 0.646 --= 2.106
lith Ioyer 0.143 0.068 --= 2.106
Outer surface 0.06 0.0285 -- = 2.106
14

• 3 2
"' ~ • •J. 120"6o~- :zso lo
20"C 18.29 18'C
12.27
---7.1 -$.14 -10'C
Fig.1.13 Temperature gradient
.y. 50
[>(] fXl
~ l ... '1 ........
Fig.f. I 4 Composite wall: average U-value
THERMAL INSULATION
These wil also be the ratios of the temperature drops and the total (10 - 10 temperature diftGfence. In this case (-10"C-20"C •-301<). TempGioture drops and values on the surfaces or at the contact planes of odjoiring layers ore to be calculated step by step In the fOllowing way:
61 I
lndoordr 20.0 0.057•-30 = -1.71
Inner surface 18.29 lslloyer 0.0095• - 30 = -0.285
boundary 18.00 2nd Ioyer 0.191• -30= -5.73
boundary 12.27 3rd layer 0.646• -30 = -19.38
boundary -7.10 4th Ioyer 0.068• -30 = -2.04
External surface -9.14 0.0285•-30 = -0.855
Outdoor oil -10.0
ij con be seen. that the plane of O"C wit be wHhln the 3rd lOyer. Its position con be plnpointod from the Fig. 1.13, or colcutoted In the following way: The resistance of the 3rd loyGf Is fl3 = 1.36 Temperature drop In the 3rd layer is 613 = 19.38 The temperature on the Inner surface of the 3 rd Ioyer Is I = 12.27 Temperature drop between this plane and the plane of o•c Is 61 • 12.27 - 0 • 12.2
The rolla of the above two values Is: ~ = 0.633 19.38
meaning that 63.3% of the total temperature drop Is wHhln the 3rd layer. The ratiO of the resistance (also of the thickness. In this case 60 mm. as the lOyer Is homogeneous) being the scrne as that of the temperature drops, the distance of the plane of O"C from the Inner surface of the 3rd Ioyer Is 0.060 • 0.633 • 0.0328 m, ie. 38 mm
Example 6 U-value of a composite wall
Fig.1.14 shows a framed wol, with 50 x 100 mm hardwood studs at 600 mm centrO$, 20 mm timber (pine) boarding externally and 10 mm plasterboard Internally. The resistance at the stud will differ from that through the hollow port, so both must be calculated and the areaweighted overage must be found. The surface resistance ore the some, so these con be added alter the averaging.
b I. fl
HOllOw port: plasterbOard 10 0.16 0.01 0.0625 -= 0.16
covtty 0.35
bOarding 20 0.13 0.02 0.1538 -= 0.13
0.5663
at stud plasterboard as above 0.0625
hardwood 100 0.15 0.1 0.6667 -2
0.15 bOarding as above 0.1538 0.8830
15

THERMAL INSULATION
In o 600 mm panel 550 mm is hOllow and 50 mm Is the stud, so the weighted overage resistance wift be
0.5663<550 + 0.883•50 = 0.593 600
plus R• = 0.12 Roo = 0.06
R = 0.77 .. U =1.29 W/m'K
1.11 Roofs and exposed floors
Heat losses through flat roofs and floors exposed to outside air (eg. o house buiH on stilts. where the under-floor space is completely open) are calculated the same way as walls, using the appropriate U-values. such as those given in Data sheet 5.
Heat losses through pitched roofs are usually calculated taking the horizontal projected area. and the U-values ore given as o function of roof pitch. In calculating such a U-volue, the resistance of any sloping Ioyer is corrected for the increased developed area. as shown below In Example 7.
Insulating products ore increasingly designated by their R-value (rather than by their thickness). If the U-value of o basic construction Is known. the result of added insuotlon can readi y be colculoted, as demonstrated by Example 8.
Example7 U-value of a pitched roof
A ceiling/roof combination consists of the layers listed in the following calculation (Fig.1.15):
b "-
R, 1 holizontal plasterboard 13 0.16
0.1 0.0813 0.17 2 cavity (roof space)
3 sloping (3CJO) bituminous felt 4 tiles
Roo
cos 30• = 0.866
therefore
3 0.5 10 0.84
0.0015 0.0119 0.04
0.0534 0.0534 • 0.866 =
1 =
0.3975
R
0.3513
0,0462
0.3975
2.51 W tm"'<
The sloping area is larger than its horizontal proJection. transmits more heat, thus its resistance is reduced by the cosine of the pitch angle.
Note: It is suggested that in such calculations In the Intermediate steps as many decimals should be retained os the calculator con handle and only the final result Is rounded. It is usual to hove 3-decimol precision for conductivity but only 2 decimalS for U-value.
16
ceiling joist
Fig.1.15 A pitched roof

THERMAL INSULAllON
Example 8 Modifying U-values for added insulation
In Example 7 the U-volue of o Simple baSic roof construction has been calculated. Modify this U-volue for lnsliotion added on top of the ceiling, of R 1.5, R 2 and R 2.5
Basic u = 2.51 1
:. R = 2.51 = 0.398
tor+ R 1.5 0.398 + 1.5 = 1 1.898 :. u = tass = 0.53 w 1m2K
tor+ R 2 0.398 + 2 = 1 2.398 :. U = 2:398 = 0.42 W /m2K
for+ R 2.5 0.398 + 2.5 = 2.898 :. U = 2.~s = 0.35 W /m2K
1.12 Slabs on ground and basements
The BRE/CIBSE system in the UK gives U-volues as o function of floor size for both Slab-on-ground and suspended floors. The European system Is thought to give more reliable results and it is now adopted In several international standards, therefore it wil also be presented here. This system employs linear heat transfer coefficients, token for the perimeter of the building. Informative data ore given in Dolo Sheet6, with I he term •relative height' explained In Fig.1.16 {this is the level difference between the floor and the adjacent ground, negaffve, If the floor is below ground level). These coefficients will hove to be munip&ed by the perimeter lenglh of the buflding.
Fig.1.16 Definition of ;elative Linear heat transfer coefficients for earth Shenered (bermed) walls and height (h) for ground losses the explanation of the dolo ore also given in Dolo Sheet 6 and Flg.1.17
respectively. These ore also linear coefficients for the stated depth of ·r··· basement or earth bermed won. Losses through the adjacent floor must _ be calculated separately, as above.
' Example 9 Calculation of ground losses
Fig.1.17 Definition of height (h) lor ear1h sheltered walls
Consider o slob-on ground floor, the level of which is 0. 7 m above the adjoining ground. II conSists of the following layers:
No Material b "' R m W/mK m'K/W
1 Carpet 0.150 •' 2 Concrete 0.05 1.20 0.042
3 Polystyrene 0.03 0.035 0.857 4 Waterproof membrane 5 Concrete 0.10 1.40 0.071 6 Gravel 0.25
As lor as the thermal resistance of the tioor slob is concerned, foyers below the Insulation con be neglected, lhat of the polystyrene and the layers above if ore to be token In account: R = 0.150 + 0.042 + 0.857 = 1.05 m2KfW (thus u = 0. 95 W /m2K)
From Data Sheet 6, coitrnn headed 1.05-1.5 (resistance) and the line labelled +0.45 to + 1.00 the linear heat loss coefllcient Is k = 1.30
17

THERMAL INSULAllON
If the thickness of thermal insulation is doubled, then R = 1.05 + 0.857 = 1.91 (thus U = 0.52 W /m2K) and the linear coefficient is found In the seventh column: k = 1.15 Note that the linear heat transfer coefficients are not proportionate to the resistance of the thermal insulation. ... ..
1.13 Transparent insulation
A promiSing new technique is the use of transparent insulation materials on external walls and, recently, on their own as a translucent envelope element. The most obvious application is to install transparent insulation on the outer side of massive walls. Due to the good optical transmittance of the insulation (and of the "surface finishing", which in most cases is glass) a major part of incident radiation reaches and is absorbed by the outer surface of the massive wall. The ratio of heat fluxes from this plane towards the room and the environment depends on the ratio of thermal resistances between the absorbing surface and environment, and between the absorbing surface and indoor space. The usual thickness of the massive wall provides an appropriate time lag: a good complement to instantaneous direct gains (see Fig 1.18).
Although generally this system is considered as a "collecting storage wall", separate analySis may be reasonable taking into account that transparent insulation materials combine the properties of good optical transmittance and high thermal resistance, thus they exhibit both 'defensive' and 'interactive or solar' properties.
The transparent insulation itself can be (Fig.1 .19): a) a series of plastic films, parallel with the absorbing surface b) a honeycomb structure, perpendicular to the absorbing surface c) scattering structures (foam, bubbles) d) quasi-homogeneous materials (aerogeL glass fibres)
Besides the above application transparent insulation materials can be used in combination with glazing, partly to replace conventional windows, partly to create well-insulated translucent building elements where daylight requirements take priority over visual contact.
In summer the protection of transparent insulation is necessary both to ensure thermal comfort and to protect the fabric . An effective and reliable solution is the use of thermochromatic (or photochromatic) glazing as the outer surface.
1.14 Practicalities: Where to put the insulation?
The geometry of the building is on important determinant of fabric losses. In multistorey buildings the importance of the roof and lowest floor slabs is relatively less than of the exposed walls. However, In single-storey buildings the roof represents a relatively high proportion of the envelope
Fig.1.18 Heat flows in a wall with transparent insulation
area and so is the lowest floor slab, although, with a strongly indented d plan the exposed walls may still prevail. Besides their area, the U-value of the envelope elements determine their relative· weight within the fabric Fig.1.19 Four structures losses. Usually roofs are better Insulated than the walls. Thermal insulation of transparent insulation of the lowest floor slab is frequently missed.
18

b
Fig.1.20 Spread out and compact plans: both 120m2 area perimeter: a) 78 m, b) 44.4 wall surface: a) 187m2 , b) 106 No.of corners: a) 16, b) 4
Fig.1.21 Elevation of a 10 x 3m wall, with 1 0 m2 window a) one 4x1.5 m, perimeter: 11 m b) four 1 x1.5 m, perimeter: 20 m
THERMAL INSULATION
In tall buildings the facade area represents the largest part of the total envelope. However, the relative Importance of exposed walls depends also on the glazing ratio. The smaller, or the more compact the building is (in three dimensional terms) the more important the complete insulation.
With larger buildings Wis·sufficie!"1t to concentrate on the most effective measures. A considerable part of fabric losses is due to thermal bridge effects (refer to Sections 2.5-6). · For a given construction these losses depend on the length of edges and joints. The specific length of thermal bridges, I. e·. the length/area ratio is higher if • the layout and form of the building is not compact (outer corners,
edges), see Fig.1.20; • the glazed area is divided Into small units (the perimeter of windo.ws),
see Fig.l.21; • there are balconies or other projections on the facades which act as
'cooling fins' • partitions are closely spaced (T-torm joints with the envelope
elements). The latter two cases are typical in some multistorey buildings.
Depending on the construction and the specific length of thermal bridges these losses are 15 - 50% of the transmission losses calculated on one dimensional basis. These facts prove that, while applying added Insulation, not only the modified U values, but also the thermal bridge effect must be taken into account. Depending on the order of the layers, or the position of the added thermal insulation there are different solutions resulting in the same U value. Some solutions can decrease the thermal bridge losses quite considerably, others have practically no effect on them.
In selecting the most appropriate solution, several constraints should be considered from both architectural and constructional points of view. Besides the building geometry, the application of added insulation is influenced by many other pragmatic factors. There are considerable differences in the investment costs of insulation added to walls, roofs, pitched roofs or attics. Adding an insulation layer to walls may be accompanied by the extra costs of surface finishing or vapour barriers.
In flat roofs thermal Insulation of better mechanical properties is required, one that is not affected by moisture. Such materials tend to be more expensive. With other, already multilayer constructions the improvement of insulation may not result in any extra costs.
Added insulation can be most easily applied In attics, on top' of the ceiling, where usually neither new surface finishing, nor a vapour barrier would be necessary. The insulation can be Installed with simple "dry" technology and fixed mechanically, without expensive scaffolding or disturbance to the occupants. The thickness of the Insulation is not limited and there are usually no significant mechanical, climatic or moisture effects. Similarly, there would not be too muc h problem with the added insulation of floors over basements but due to the small temperature difference this insulation is less effective.
Thermal insulation added to flat roofs requires complex reconstruction of the roof system, additional layers (vapour barrier, waterproof membrane, etc.) The thickness of the thermal insulation Is not limited but the material must not be vulnerable to moisture and c limatic effects.
19

THERMAL INSULATION
Outside insulation of walls requires scaffolding and (on existing buildings) new surface finiShing, The thickness of Jhe thermotlnsulation layer can be limited and eilher the malerial must be able to withstand mechanical and some moisture effects or a more expensive construction with ventilated air gap has to be installed. However, os It will be shown, external insulation is thermally more effeclrve. • · ·
As far as Inside Insulation is concerned, different techniques can be applied (In existing buildings with more or less disturbance of the users during the execution). New surface finishing and usually o vapour berner ore necessary. The thickness of the thermal insulation con vary widely. The new internal surface should be able to resiSt mechanical effects and allow the fixing of plclures and other objects, accept plugs for lhe fixing of shelves or smaa pieces of furniture.
In o few special cases existing air gops of cavity wallS con be fRied with insulation. if moisture penetration con be prevented by other means.
1.14.1 Flat roofs
The problem of added ('retrofit) thermo! insulation of flat roofs cannot be separated from the problem of waterproofing. The lollowing options eXist: • to keep the traditional layer-order (on existing buildings by re
building the roof from the load bearing construction. • on existing buudings to keep the tradifionotlayer order by placing
on added thermal insulation layer and a new waterproof membrane on its top,
• to opply on Inverted root membrane assembly by placing on added thermol lnsulolion on the roof with mechanical fixing.
The first retrofit option is the most expensive and because of the risk of rain penetration if con be applied only if the building is not occupied during the process of reconstruction.
The second option IS to be preferred If the original waterproof membrane would need repairs or change, thus the motivation or one of the motivations iS the replacement of that membrane. A wide range of materialS con be used. Depressurisaflon, ie. the release of vapour pressure should be checked carefully and for this purpose the original membrane may have to be perforated (fig. 1 .22).
The third version Is to be applied if the waterproof membrane is In good condition. The thermal lnsliation must be extruded polystyrene, which iS fixed (against negative wind pressure) by grovel or stepping stones (fig. 1 .23). The added thermal resistance is not limited, the usual value being f'l = 0.5- 1.0 m•K/W.
1.14.2 Pitched roofs and attics
There are two options: if the attic Is heated (or the ceinng follows the roof slope). the added thermal insutolion Should be located along the pitched roof. between the rafters or below them. The internal surface finishing con
· be plaster on lath, gypsum board or timber panelling. A vapour barrier below the thermollnsulolion ond ventilated air gop ore odvisoble In order to prevent interstitial condensation (refer to Section 3.3) and some form of sorklng. eg. o foil or bituminous felt over it. as o precaution against any moisture that may hove penetrated the tiles (fig.1.24).
20
Fig. 1 .22 Added insulation + waterproof membrane on a Hal root I: slab, 2: original insulation, 3: existing membrane perforated 4: new insulation, 5: new membrane
5
4
~~~~~-3 V\o'\111-- 2
~+#f
Fig. 1 .23 Added insulation to create an inverted roof I: slab, 2: original insulation 3: original membrane 4: new insulation, 5: gravel
1

THERMAL INSULATION
tiles
~;§!§g~=§~~~lbituminous sarl<ing
;!)11M ruur wWIXIU1T vapour barrier . . .
CROSS-SECTION
Fig.1.24 Insulation of a pitched roof with coupled ceiling
Special core has to be token of the correct insulation of any garrets and dormer windows, in order to ovoid leaving thermal bridges. (These ore often indicated by local meHing of any snow cover.) If the ollie Is not heated and there Is no significant mechonlcollood, the added insulation is to be toea ted horizontosy on top of the ceiling. The area of this is less than that of the pitched roof.
In both versions attention should be paid to fire protection requirements.
1.14.3 Floors
Ground losses represent a considerable port of the total, especially in single storey buildings of a small floor area and indented plan form. Thermal Insulation should cover the whole floor area.
c
"" ' •
"•'
Fig. 1.25 Floor insulation: (a) over the whole area, (b) along the perimeter, horizontally, (c) on foundation wall vertically or (d) extended below ground level.
21

THERMAL INSULATION
On a large and compact floor this solution would be quite expensive, but it is not necessary, as ground losses are concentrated along the edges of the building, it is .sufficient to insulate the perimeter of the building (in a width of 1 -2m). This perimeter insulation can be located vertically, partly on the foundation wall, partly embedded in the grqund, as ~hown in Fig.l.25.
The material of the vertically located insulation must be hard and waterproof; extruded polystyrene foam is appropriate. A continuous barrier up to the top of the footing is necessary.
1.14.4 Walls : External insulation 6
From many points-of-view external thermal insulation is the most effective 2 option. Different versions are possible such as: 3 • insulating plaster (Its thickness is maximum 60 mm, with a usual A. 1
value of 0.09- 0.14 W /m.K), 5 • "Thermal skin" (added insulation plus thin reinforced rendering) • added Insulation outside a ventilated air gap and external
protective skin (Fig. 1.26).
External insulation is usually accompanied by a new surface finish, which may itself cause some thermal effects, eg. admission/exclusion of moisture or its response to solar radiation.
Waterproofing of exposed walls.
Due to the several forms of precipitation, primarily the driving rain effect, wetting of the exposed walls has to be taken into account. Different phenomena are involved, namely water penetration to the inner surface through c racks and joints (of panels or masonry blocks to each other or to windows) , or into the construction, moisture absorption of the wall material itself.
Water, penetrating to the inner surface through cracks or by fDOisture conduction can cause fabric damage (corrosion, erosion, mould growth), as well as indoor air quality problems (mites, living on the mould and spreading In the indoor air).
Due to increased moisture content the conductivity of the wall material increases, resulting in extra transmission heat losses and lower inner surface temperature. Lighter bricks and older hygroscopic piasters are particularly sensitive to this effect. Along cracks and joints filled with water this effect is stronger and the joint itself becomes a thermal bridge or the existing thermal bridge effect is increased
There is another heat loss effect: the absorbed water will be evaporated during drier intervals within the heating season, causing an evaporative heat loss.
The consequences of fabric damages are not easy to allow for in heat loss calculations. The relationship of conductivity and moisture content is Known (or at least can be measured in the laboratory) but the moisture content itself depends on the time of the exposure, the driving rain index, and the length of the dry periods between the exposures. Tests carried out on a normal plastered brick wall specimen in c limate chambers under simulated exposure have shown, that the effect of increased conductivity
22
Fig.1.26 Alternatives for add external insulation+vented air 1 : insulation, 2 & 4: battens, 3: counter-battens, 5: tile-ha1 or fib.cement sheet, 6: sealinc 7: metal support, 8: fixings '
. ·'

THERMAL INSULATION
and the evaporative losses can be expressed as a notional increase of the U value by 0. 1 - 0.2 W /m'l<, depending on the density of the material.
Moisture penetration can be prevented by waterproof surface finishing which con be applied by itself or together wilh the added external thermal insulation (thi~is lhe so called "thermal skin" system). The expected thermal effect is the prevention of the wetting, thus avoiding lhe above notional increment of the U value.
Waterproof plastering is usually reinforced in order to prevent any c racks, which may occur due to thermal movement. Cracks would be especiallY dangerous here. as any water penetrating could not evaporate through the wate~proof plaster (as it would through a normal one).
Waterproof plastering has a considerable resistance to vapour diffusion. it could increase the risk of interslitiol condensation (refer to Section 3.5). Ttis problem can be eliminated if a ventilated air gap of min. 40 mm width is provided between the thermal insulation and the outer skin. This is also the appropriate solution if the wall cannot be dried before applying the new. surface finishing.
1.f4.5 External surfaces: absorptance and emittance
The external surface determines the absorptance and long wave emittance of the wall. The effect of lhe solar radiation and long wave reradiation can be estimated by Introducing the sol-air temperature concept. A notional temperature Increment is calculated, which would hove the same effect on heat flow, as the radiant heat exchange (based on the average irrodiance values over the heating season). II Is usually a few degrees Kelvin (see section 2.11).
In a cool-temperate climatic zone. due to the lower external temperature and irradiance values. external surface obsorptance influences the cumulative transmission losses by a maximum of 4 - 6 %. However, In warm-temperate cimates, where both the external air temperature and lrradlance values are higher. this effect can be 8 - 12 %.
Besides heat lOsses, heat gains in summer and deterioration of the surface finishes (thermal expansion, shrinkage) should be considered. Surloce finishes highly absorbent for solar radiation (which may be desirable in winter) could have unfavourable consequences in the summer, thus should be avOided. ·'
With regard to absorptance It should be remembered that II is not the colour of the surface alone that determines absorption and surface temperature.
Colour is an attribute of visible light. but thermal balance is influenced by the long-wave infrared re-radiatiOn. thus by the emittance in this wavelength bond as well. Surface temperature is the result of the combined effects of absorption and emission. As a consequence, a visually i ght surloce can be quite "dark" In thermal sense and vice versa. A white painted surface Is quite 'selective', it has low absarptance for solar wavelengths, but high emittance at terrestrial temperatures. Most building surfaces have a high emiHance in the long infrared wavelengths.
23
THERMAL INSULATION
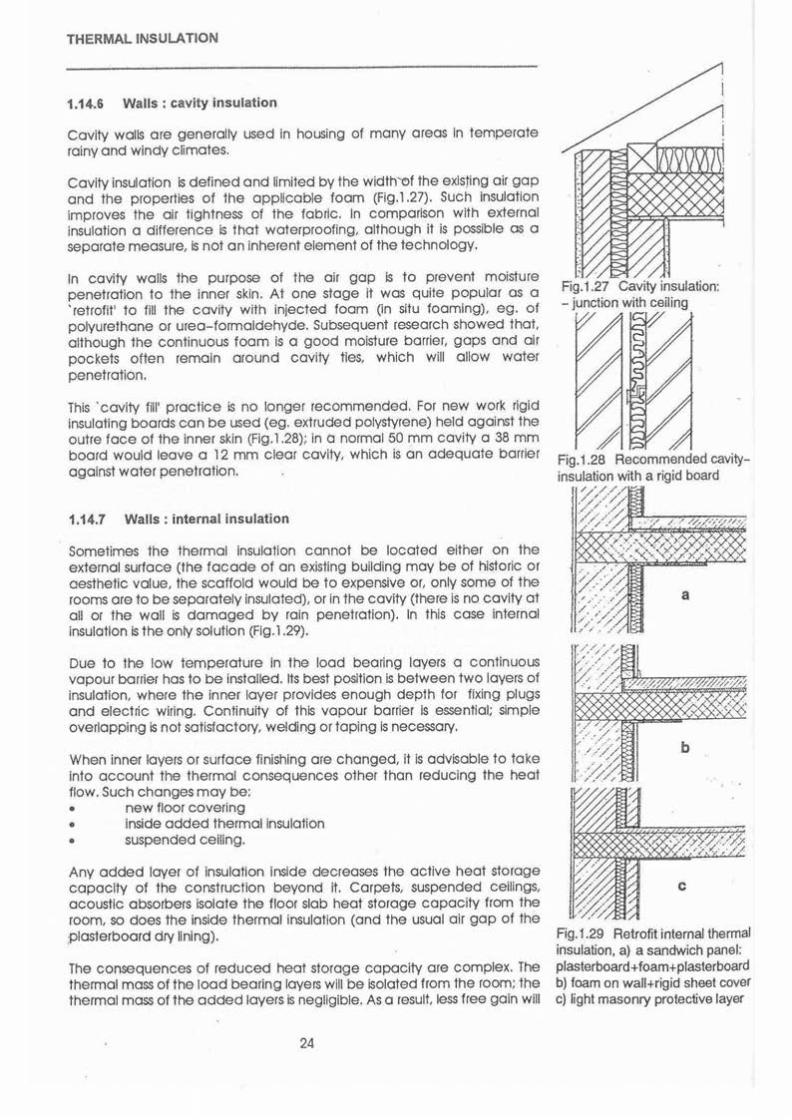
1.14.6 Walls: cavity insulation
Cavity wallS ore generally used in hOusing of many areas In temperate rainy and windy climates.
Cavity insulation IS defined and limited by the width'of the exls!ing air gap and the properties of fhe appticable foam (Fig.l.27). Such Insulation Improves the air tightness of the fabric. In comparison with external Insulation a difference is that waterproofing, although it is possible as a separate measure, is not an inherent element of fhe technology.
In cavity wallS the purpose of the air gap Is fa prevent moisture penetration to the inner skin. At one stage it was quite popular as a 'retrofit' to fill the cavity with injected foam (ln situ foaming), eg. of polyurethane or urea-formaldehyde. Subsequent research showed that, although the continuous foam is a good moisture barrier, gaps and air pockets often remain around cavity ties, which will allow water penetration.
This ·cavity fill' practice is no longer recommended. For new work rigid Insulating boards can be used (eg. extruded polystyrene) held against the outre face of the inner skin (Fig.l.28); in a normal 50 mm cavity o 38 mm board would leave a 12 mm clear cavity, which is an adequate barrier against water penetration.
1.14.7 Walls: internal insulation
Sometimes the thermal insulation cannot be located either on the external surface (the facade of an exisHng building may be of historic or aesthetic value, the scaffold would be to expensive or, only some of the rooms are to be separately insulated), or in the cavity (there Is no cavity at all or the wall is damaged by rain penetration). In this case internal Insulation is the only solution {Fig.1.29).
Due to the low temperature in the load bea~ng layers a continuous vapour borrler has to be installed . Its best position Is between two layers of insulation. where the inner Ioyer provides enough depth for fixing plugs and electric wiring. Continuity of this vapour barrier Is essential; simple overtopping Is not sotlsfoctory, welding or taping is necessary.
When inner layers or surface finishing are changed, II Is advisable to take into account the thermal consequences other than reducing the heat flow. Such changes may be: • new floor covering • Inside added thermal insulation • suspended ceiling.
Any added layer of Insulation Inside decreases the active heat storage capacity of the construction beyond it. Carpets, suspended ceilings, acoustic absorbers Isolate the floor slab heat storage capacity from the room, so does the inside thermal insulation (and the usual air gap of the plasterboard dry lining).
The consequences of reduced heat storage capacity are complex. The thermal mass of the load bearing layers will be isolated from the room; the thermal mass of the added layers is negligible. As a result, Jess free gain will
24
Fig.1.27 Cavity insulation: - junction with ceiling
f"
Fig.1.28 Recommended cavityinsulation with a rigid board
Fig. 1.29 Retrofrt internal thermal insulation, a) a sandwich panel: plasterboard+foam+plasterboard b) foam on wall+rigid sheet cover c) light masonry protective layer

THERMAL INSULA llON
be ulilsed, larger temperature swings are expected in free running rooms In sunvner, night ventilation wil .be less effective. The other side of the coin Is that energy can be saved where the heating is intermittent, provided
~~~~ijjiijij that some temperature swings wll be acceptable from the point-of-view §l of thermal comfort and there Is no fabric damage ~sk due to the lower
temperature and cor1Sequent ~gher relatiVe humidity. ·
Fig. t .30 Continuity of wall and roof insulation
1.14.8 Some common mistakes
Not only the design and detailing of thermal insulation. but also the supervision of its installation ore very Important. Workmen on building sites tend to take shortcuts. In the documentation there should be sufficient detail to prevent the occurrence of such shortcuts.
o) Both wall and roof insulation may be satisfactory, but continuity at the junction of the two must be thOught out and ensured (Fig.1.30).
a timber floor boards b) Compression of insliotlon mote rialS greatly reduces their performance :;;,;;;~~===~~;;;;;~: and con result In local thermal bridges. This often occurs in exposed ~ timber floors, where the insulation Is draped over the floor joists and the ' Jlj[ ~ i<0J. flooring boards are noled down through the insulation blanket
b
~JMJ1f!JUUJNUU .. I/1Pi2i wire mesh + building paper
Fig.1.31 Insulation of exposed timber floor (over open space) a) incorrect, b)correct
(Fig.1.31). The correct solution would be to fit the insulation bolts between the timber joiSts supporting it by a wire mesh fixed to the underside of joists (possibly with a buijding paper).
c) An even worse and frequent mistake is to drape the insulation over metal puriins and to fix the clips of the metal roofing to these purlins through the insulation (Fig.1.32).
d) In on ollie space reflective insulation is often placed on top of the ceiling (or over some bulk insulation on the ceiling)
1.15 What does thermal insulation give 7
Thermal insulation, no doubt, decreases fabric lasses. but It is an error to assume that the only resun will be the lower thermal transmittance of the opaque buiding elements. To focus on the U-value can lead to serious misunderstanding, calculations may be performed out of context. which
~:=;~~iUil!. may lead to exaggerated expectations. The energy saving by the added thermal insulation can be as much as double or only half of the value calculated on the basis of one dimensional steady-state heat flow. This is due to the complex interrelations of different phenomena.
Fig.3.121nsulation of metal roof on pressed steel purlins a: incorrect b: battens for thermal break c: rigid boards on T -bars,
wire hangers
The added thermal insulation Is more than just improved thermal resistance. If II is applied to the outer surface of exposed wall, many other parameters are Influenced. Their relationships are Illustrated In ,Fig.1.33. Continuous external insulation improves the thermal properties of joints and other thermal Mdges: "llneaf' heat tosses along the joints and thermal bridges decrease. Internal Insulation does not give the some effect except at outer corners end at deeply recessed windows.
1.15.1 Thermal insulation and the necessary air change
Lower U-volues and decreased thermal b ridge effects increase the overage inner surface temperature, thus also the mean radiant temperature. If the some resultant temperature is to be provided the air temperature con be lower. Besides the overage, the minimum values of the Inner surface temperature (around thermal bridges) also Increase. As o result, a higher relative humidity of indoor air con be accepted without Increasing the risk of co pilary condensation and mould growth.
25

THERMAL INSULATION
Application of added thennal insulation
Ventilation losses
Fig. 1.33 Effects and side-effects of thermal insulation
In residential buildings the necessary air change rote is usually determined by the relollve humidity of indoor air, low enough to prevent copilory condensation in the inner surface layers. The higher the acceptable relollve humidity, the less !he necessary air change rote. Due to such acceptable towering of the indoor-air temperature, and decreased air change rote, venlllallon heal tosses ore reduced.
1.15.2 Fabric protection
Temperature distribution around panel-joints Is often influenced by air infiltration between the panels. External thermal lnslAotion and outer surface finishing improve the air tightness and eliminate this side-effect.
Improving the tightness of jOints, direct moisture penetration in driving-rain or air exflllrotlon wHI be reduced, possibly eliminated. The drier faint decreases the risk of the mould growth. Waterproofing properties of the outer surface finish decrease the driving rain effects: the drier construction will maintain its conductivity, heat losses by evaporation ore lower.
1.16 Some conclusions
If the attenuation of one-dimensional heat flow is considered as the primary effect of insulallon and the others, such as thermal bridge lasses, ventilation, etc. as side effects, - If outside Insulation Is added - the energy saving due to side effects is of the some magnitude or even greater than that due to the Pflmary effect.
ThiS is why there are considerable differences between internal and external insulation of the some added resistance. These differences ore greater If othe!, non transmission related side effects ore aiSo considered, such as waterproofing, reduced evaporative losses and moiSture absorption or sot-air temperature. With external insulation the air change rote can be decreased without increasing the risk of the fobrtc damage. :ThiS does not apply to internal insulation. Contrary to the transmiSsion losses thiS side effect is mare important ff the surface to volume rolla is lower. As a result, the energy saving by external Insulation is about twice that achieved by internal insulallon of the same added thermal resistance.
26
THERMAL INSULATION
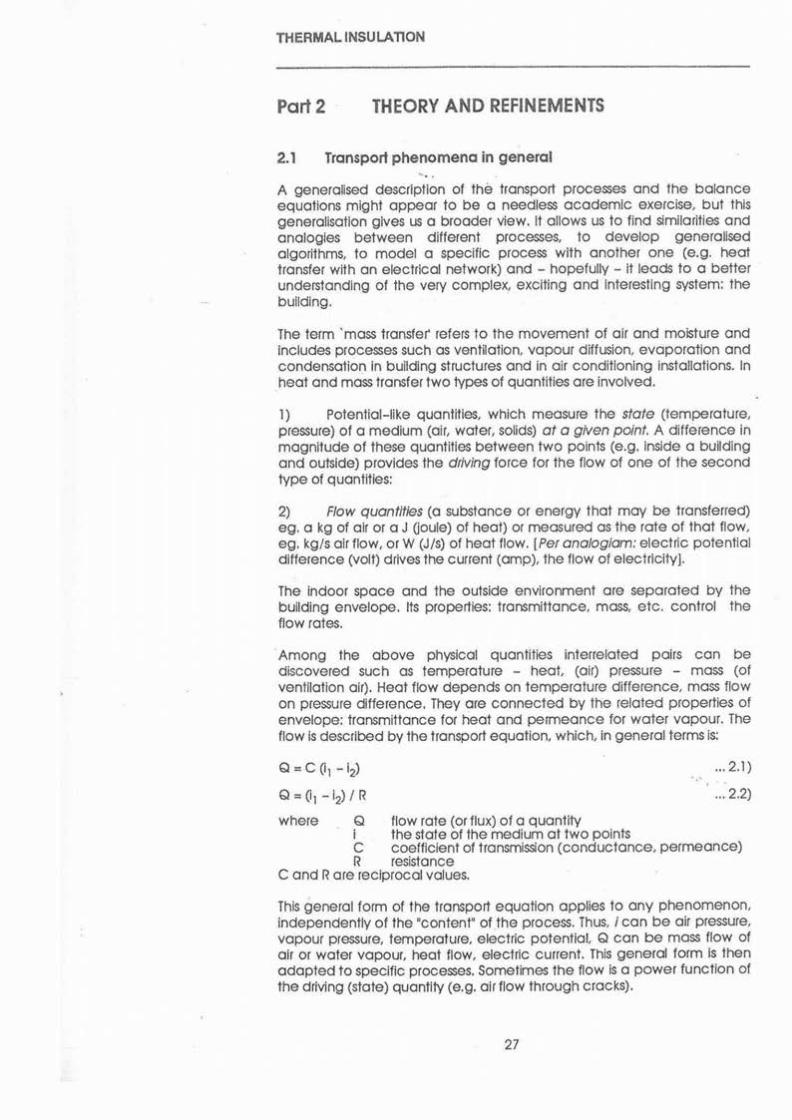
Part 2 THEORY AND REFINEMENTS
2.1 Transport phenomena in general -.. A generotised description of the transport processes and the balance equations might appear to be a needless academic exercise, but this generolisollon gives us a brooder view. It allows us to find similarities and analogies between different processes, to develop generalised algorithms, to model a specific process with another one (e.g. heat transfer with on electrical network) and - hopefully - it leads to a better understanding of the very complex. exciting and interesting system: the building.
The term 'mass transfe( refers to the movement of air and moisture and includes processes such as ventiation, vapour diffusion, evaporation and condensation In building structures and in air conditioning installations. In heat and moss transfer two types of quantities ore involved.
1) Potential-like quantities, which measure the state (temperature, pressure) of a medium (air, wale!, solids) at o given point. A difference In magnitude of these quantities between two points (e.g. inside a bul ding and outside) provides the driving force for the flow of one of the second type of quantities:
2) Flow quantities (O substance or energy that may be transferred) eg. a kg of air or a J Goule) of heat) or measured as the rote of that ftow, eg. kg/s air flow, or W (J/s) of heat flow. (Per anatogiom: etectrtc potential difference (volt) driVes the current (amp), the flow of elecWclty].
The indoor space and the outside environment ore separated by the building envelope. tts properties: transmittance, moss, etc. control the flow rates.
Among the above physical quantities interrelated pairs con be discovered such as temperature - heat, (air) pressure - moss (of ventilation air). Heat flow depends on temperature difference, moss flow on pressure cifference. They ore connected by the related properties of envelope: transmittance for heat and perrneonce for water vapour. The flow is described by the transport equation, which, in general le!nns Is:
Q = c 01 -12)
Q = 01 -1:2l/ R
where Q flow rote (or flux) of a quantity i the state of the medium at two points
... 2.1) 0 ·'
000 2.2)
C coefficient of transmission (conductance, permeonce) R resistance
C and R ore reciprocal values.
This general form of the transport equation applies to any phenomenon, independently of the •content• of the process. Thus, I con be air pressure, vapour pressure, temperature, electric potential, Q con be moss flow of air or water vapour, heat flow, etectrtc current. This general form Is then adopted to specific processes. Sometimes the flow is a power function of the drtving (state) quantity (e.g. air flow through crocks).
27

THERMAL INSULATION
C Itself may depend on the driving- (state-) quantity (eg. thermal conductivity may vary with temperature) 01 another stole quantity (eg. thermal conductivity on relative humidity). The nature of the flow (eg. laminar or turbulent flaw) or Its dlrecflon (eg. air permeonce of windows at in- and exfiltrotion) con alSo Influence the transport equation. There ore cross effects and linked processes: eg. between· ·heat Ol']d moiSture transfer. Nevertheless. the s.impllfled general form fociHotes the understanding of the fundamental processes.
2.2 Balance conditions
The building, or a port of It (a room, a port of a wall) can be consJdered as a thermal system- bordered by real or imaginary boundary surfaces.
Under steady stole conditions, if the driving values (eg. temperature) ore constant, the condition of balance is:
Qin = Qout ... 2.3) thus the sum of the flows (eg. heat flows) into the system is equal to the sum of the flows out of the system.
In a non steady state condition Q;n- ~~:LIS ... 2.4)
thus n there Is a difference In the flows (eg. heat flows in and out) this wm result in a change of the stored quantity (S), e.g. of heat. This w iH produce a change of the state of the system (eg. more heat stored Increases the temperature).
A special case - the quasi steady state condition - exists when the change Is periodic In lime. In this case equation (2.4) describes the momentary situation. but equation 2.3 applies to the overage values for a full cycle. Thus. at a given moment a difference con exist between the flows Into and out of the system, but the sum of the flows for the period of a full cycle Is the same.
2.3 Design objectives and approaches
A precondHion of successful desJgn is the unambiguous identification of the objectives. With regard to energy use for thermal control (and its environmental consequences) the follOwing resuts ore expected:
low heating energy consumption (zero, if reasonably achievable) low or zero cooling energy consumption reduction of the required capacity (thus the sJze) of the heating or cooling system
thus. as a consequence of the above: as long as possJble free running periods of acceptable indoor thermal conditions
and, taking into account other (structural, constructional or aesthetic) aspects: to improve thermal comfod and living conditions to Improve fabric preservation to keep existing or to odd new aesthetic values.
These objectives con be achieved In different ways. With some slmpliflcolion two different possiblftties con be CfJSiinguished: the defensive and the lnterocHve approaches.
28

THERMAL INSULATION
The defensive approach involves the minimisation of the unwonted energy fluxes which would hove to be compensated by the HVAC (heating, ventilation and air conditloning) systems. The main features of o defensive building ore: compact form, high level of thermal insulation. olrtightness, restricted glozing ratio (sometimes with high-tech windows), effective shading devices and heat recovery. As o special case earthsheltered houses con be mentioned.
The lnteracHve (or solar) approach aims at maximising the desirable energy flows which reduce the task of the HVAC systems. The main features of on interactive building ore: building form dictated by orientation. higher and orientation-dependent glazing ratio; some solar systems, conscious use of heat storage capacity and convective en91gy flows, and effective shading devices, In some cases heal recovery.
Sometimes the protagonists of solar strategy overestimate the role of the heat storage capacity and underestimate that of the thermal InsulatiOn. In reauty the utiisation of the stored and released energy depends on the time constant of the bt.ilding (see Section 2.14). which is proportionate to the ratio of the thermal moss and the envelope conductance (the overall heat loss coefflci~nt) of the building. Thus. although the overall insulation level of o solar or Interactive building is limited by the forger glozing ratio and some other solar collecting elements (eg. o greenhouse), the solar building should also be Insulated as well as possible in order to improve its solar pert01mance.
2.4 Conductivity: declared and design values
Conductivity was Introduced In Section 1.3. Conductivities of building materials show o wide variation: from 0.02 W /m.K for the lightest foams. through 0.4-0.9 for different bricks. 1.5 of reinforced concrete, up to 70 for steel and over 200 for aluminium (see Dolo sheet 1). The trend -with o few exceptions- is that the higher the density the higher is the conductivity.
Conductivity is strongly influenced by porosity, the pores filled with stagnant air. This is the case with foams or fibrous motertols. ConductiVity increases if the pores ore fi led with water. ie. if the moisture content of the material Is increased. A fibrous cement insulating board showed the following properties at different levels of moisture content:
dry density: 136 kg/m' conductivity: 0.051 W /m.K wet 272 0.144 soaked 400 0.203
If the structure of o material is such that the air spaces ore inlercor:mected (this is the case of fibrous materials or foams with on open pore structure) and the layer Is in o vertical position, o thermosiphon air circulation con be generated Inside this Ioyer, by the temperature differences (see Fig.1.5). This phenomenon increases the heat transfer which con be expressed by on Increased A value.
The operational conditions in transportation. on building sites and during the life cycle of o building ore such that damage of insulating materials is often inevitable. Therefore In design conservative A values must be used. to allow for the compression. crushing, moisture and other effects reducing the Insulating value of these materials. Due to such effects, eg. the ;, value of o polystyrene loom between reinforced concrete foyers (in o sandwich panel) may increase by 35-45% I
29

THERMAL INSULA TlON
Published values (eg. those given In Data sheet 1) ore measured in laboratory tests, and ore referred to as declared values. Designers should be aware that these ore not appropriate for calculating the transmittance (U-volue). Design conductivny values Should be used. These depend not only on the material Itself, but alSo on the way it Is used, thus allowing for any probable deterioration. ' · .
If no such design values ore available, declared :>.. values should be corrected according to the equation .tdmp • .td«k>nd• (1 +K1 + 1<2 ... ) ... 2.5)
where " =correction factors (additive) from Table 2.1.
Table 2.1 Conductivity correction factors
Motertol
Expanded polystyrene some Rock wool Polyurethane Expanded polystyrene some
between cost concrete layers between masonry wall layers between masonry wall layers in ventilated air gop In venftloted air gop with cement render applied
0.42 0.10 0.10 0.15 0.30 0.25
To Illustrate the magnitude of such corrections, some of the examples of port 1 ore re-examined:
In Example 1 (p. 11) the conductivity of expanded polystyrene was token (from Data sheet 1) as 0.035 W /m.K. ThiS is on external insulation and cement rendering is oppfied directly to it (with some wire mesh): the correction foetor (the last Item in Table 2.1 above) Is"= 0.25 therefore the corrected design value will be :>.. = 0.035 • (1 + 0.25) = 0.0438 W/m.K
thus the resistance ofloyer 3 wHI be o.~ = 1.1416
and the total, corrected resistance becomes 1.8526 therefore ns reciprocal, the corrected U-volue = 0.54 W/m2K (as compared with the previously calculated 0.467, or some 15% Increase) 2o•c
Example 2: the temperature gradient of the some wall has to be recalculated (combining the two tabulations of the original example):
R-rotio•(-20) = At t ·c
Inner surface 0.12 :0.065 -1.3 18.70 1.85
1st Ioyer 0.03 = 0.016 -0.32 18.38 1.85
2nd layer 0.484 185
= 0.261 -5.22 13.16
3rd Ioyer 11416 = 0.617 -12.34 0.82 1.85
4th Ioyer 0.017 185
= 0.009 -0.18 0.64
External surface 0.06 1.85
= 0.032 -0.64 0
30
J
: l
J~ J ,fr 10 50 300
Fig.2.1 The effect of u1 corrected ('design'):>.. val the gradient is lowered

THERMAL INSULATION
· Fig.2.1 shows the revised gradient, compared wllh the uncorrected original.
In Example J II wos found that a resistance of 0.523 m"'(/W must be added to the wall construction. The conductlv1ty of polystyrene is to be corrected same os in example 1, thus the required insulation thickness is
~~~~~~€ b., = 0.0438 • 0.523 = 0.023 (23 mm)
~ ' 7 - rather thon the previously catculoled 18 mm
·~L ~+ In Example 4 (p.l3) It wos found thai a resistance of 1.254 m2K/W must be Fig.2.2 Multinimensional heat dded to the wall. The denSity of mineral wool wos token os 150 kg/m' flow, due to geomelry: (from Dot a sheet!) giving o conductivity of 0.044 W /m.K T -juncijon and window reveal
As this insulation will be placed between correction foetor from Table 2.1 is K = 0.1, thus
~~~ "-=0.044 •(1 +0.1)=0.0484W/m.K
two layers of brick, the
Fig.2.3 Same, due to nonhomegeneous construction
therefore the minimum thickness needed Is b"*' =0.0484 • 1.254 = 0.061 m (= 61 mm)
This Is just over the ovonoble 60 mm thickness, but ony rounding must be upwards: the neorestlorger thickness ovoiloble is 80 mm ond this must be used, therefore the resistance of Ioyer 3 will be R = 0.08 = 1.65 3 0.041!4
thus the the corrected Ro-<1 = 0.7 46 + 1.65 = 2.396 ond u = 0.417 W/m"'(
2.5 Multidimensional steady state heat flow: thermal bridges
In Part I the assumption wos made that heat flows through an envelope element with the flow path being perpendicular to the plane of that
·l~~~i~~~~~ element, ie. the phenomenon is analysed as a one-dimensional heat " flow. This is true only for infinitely large elements with porollel plane
Fig.2.4 Same, the above two effects combined
t
I 1
21
surfaces ond uniform cross-section. The results obtained with colculolion techniques presented in Port 1 ore approximate only.
In real building elements the crite(IO of one dimensional heot flow ore often not fulfilled. Where the boundaries are other than plane parallel surfaces. or the material iS not homogeneous, two or three-dimenSional heat flows develop. Areas where increased, multidimensional heot flow occurs ore called thermo/ bridges. These may be consequences of the geometric form (Fig.2.2), including c01ner effects, the combination of materials of different conductivities (Fig.2.3), or both (Fig.2.4).
Temperature distribution around thermal bridges
Heot flow will toke place along the shortest path, the path of least resistance. In Fig.2.5 the reSistance along flow poth 1 Is less lhon II would be alOng o ine perpendiclAar to the surface, due to the higher conductivity of the column. Along flow path 2 the resistance Is less, due to the bigger 'cross section', not ·occupied' by other flows. The heol flOw
Fig.2.5 Heat flows the 'shortest' denSity will be greater ot thermal bridges, therefore the surface (the least resistance) path temperature outside increased ond inside reduced.
31
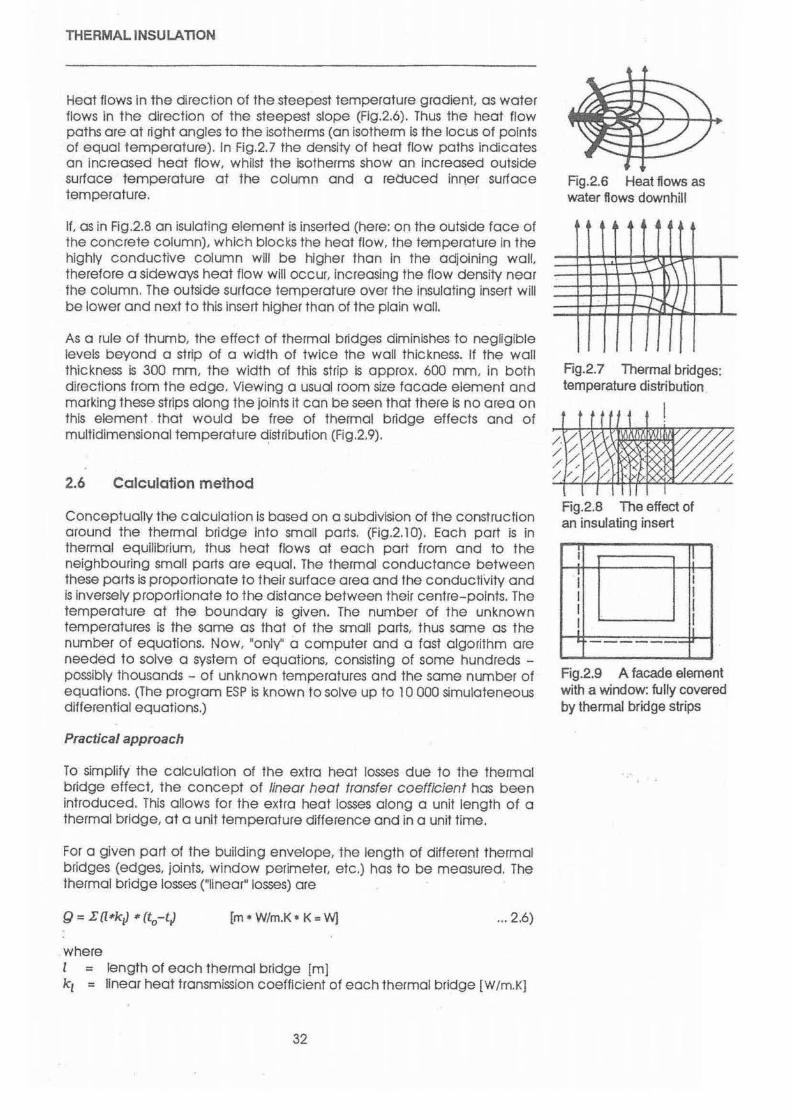
THERMAL INSULATION
Heat flows In the direction of the steepest temperature gradient, as water flows in the direction of the steepest slope (Fig.2.6). Thus the heat flow paths are at right angles to the isotherms (an isotherm is the locus of points of equal temperature) . In Fig.2.7 the density of heat flow paths indicates an increased heat flow, whilst the isotherms show an increased outside surface temperature at the column and a retruced inn_er surface temperature.
If, as in Fig.2.8 an isulating element is inserted (here: on the outside face of the concrete column), which blocks the heat flow, the temperature in the highly conductive column will be higher than in the adjoining wall, therefore a sideways heat flow will occur, increasing the flow density near the column. The outside surface temperature over the insulating insert will be lower and next to this insert higher than of the plain wall.
As a rule of thumb, the effect of thermal bridges diminishes to negligible levels beyond a strip of a width of twice the wall thickness. If the wall thickness is 300 mm, the width of this strip is approx. 600 mm, in both directions from the edge. Viewing a usual room size facade element and marking these strips along the joints it can be seen that there is no area on this element that would be free of thermal bridge effects and of multidimensional temperature d.istribution (Fig.2.9).
2.6 Calculation method
Conceptually the calculation is based on a subdivision of the construction around the thermal bridge into small parts. (Fig.2.10). Each part is in thermal equilibrium, thus heat flows at each part from and to the neighbouring small parts are equal. The thermal conductance between these parts is proportionate to their surface area and the conductivity and is inversely proportionate to the distance between their centre-points. The temperature at the boundary is given. The number of the unknown temperatures is the same as that of the small parts, thus same as the number of equations. Now, "only'' a computer and a fast algorithm are needed to solve a system of equations, consisting of some hundreds -possibly thousands - of unknown temperatures and the same number o f equations. (The program ESP is known to solve up to 1 0 000 simulateneous differential equations.)
Practical approach
To simplify the calculation of the extra heat losses due to the the rmal bridge effect, the concept of linear heat transfer coefficient has been introduced. This allows for the extra heat losses along a unit length of a thermal bridge, at a unit temperature difference and in a unit time.
For a given part of the building envelope, the length of different thermal bridges (edges, joints, window perimeter, etc.) has to be measured. The thermal bridge losses ("linear" losses) are
[m • W/m.K • K = W] ... 2.6)
where l = length of each thermal bridge [m] k1 = linear heat transmission coefficient of eac h thermal bridge [W/m.K]
32
Fig.2.6 Heat flows as water flows downhill
~ -' I I r.....
Fig.2.7 Thermal bridges: temperature distribution
Fig.2.8 The effect of an insulating insert
I I! l I
I I I I I ,l ...1 • ·-
Fig.2.9 A facade element with a window: fully covered by thermal bridge strips

i -I
THERMAL INSULATION
Besides such linecr IO$Ses, the reduced Inner surface temperature Is important from the point of View of fobrtc protection. C nlicat surtace temperatures ore given on a reta«ve scale. The zero paint of this scale is the outdoor temperature, the unit is the difference between the Indoor and outdoor dr temperature. Thus, at point x the temperature (I,..J measured on this retaUve scale wit be: t - lx -to rei- I I
I- •
... 2.7)
le. t, .. is a frocflan of the air-to-air temperature difference, taken as 1. Converting from relative temperature to the CelSius-scale:
... 2.8)
"Thermal bridge colatogues· are available, with thousands ol generalised temperature data and linear heat IO$$ coefficients. Some informative linear heat IO$$ coefficient data are given in Table 2.2.
Note that the extra heat lasses due to thermo/ bridge effects are In· genera/20-50% of the lasses calculated on one dimensional basis.
.............. ;-----t-.......... , .. •
I
...... M .. ····!-, --+-+-+--~c-. ! i J• , ; ;
1----\·····-··-··· ~ - - -·-·---.. ·;·-··~·
Fig.2.1 0 The schema of elementary parts. The resistance between them is proportionate to Ax and inversely proportionate to ).. and the contact plane area This is analogous with an electric resistance network.
Table 2.2
Description
Linear heat loss coefficients
kJ W/m.K
Window perimeter 0 .. 15 Window perimeter if the frame is in the plane of the thenmal insulation 0 Outer corner of homogeneous wall 0.10 Outer corner of wall with external insulation 0. 15 External wall with internal insulation 0 Joint of homogeneous external wall and internal wall (both edges counted) 0. I 2 Joint of ext wall with external insul.and internal wall (both edges counted) 0.06 Joint of homog. ext. wall and floor slab with insul.strip (booth edges counted) 0. I 5 Joint of ext wall with external insulation and floor slab (both edges counted) 0.06 Parapet wall, cornice 0.20 _ Balconies 0.30
33

THERMAL INSULATION
Note that for "T"-form joints k1 values should be applied to both the left and right side. These are of the same values, if the perpendicular construction has a symmetrical cross sectlon, but they differ from each other for on osymmefricol c rass section.
2.7 Thermal points
If thermollnsulaHon Is pierced through with elements of high conductivity (eg. steel reinforcement ties in sandwich panels), on overage conductivity value should be token into account, using on areaweighted averaging:
- (A,~- .:..:A'!..<~:..c:..' ..:..+.:..:A!:., .I.:!., A· -A
where A =area of the element in question As = steel area
.l.d = design conductivity value of thermal insulation
.l.s = conductivity of steel
... 2.9)
Due to the Iorge difference between .l.d and As, lateral heat flaws (parallel with the surface) can be neglected. Note that this approach -area-weighted overage of A values- Is not applicable to any other form of thermal bridges
Example 10 Modify U-value for thermal points
A sandwich panel includes on 80 mm expanded polystyrene slab between two reinforced concrete layers. In 1m2 elevation area there are 4 steel ties of 16 mm diameter, penetrating the polystyrene. Calculate the U value including the effect of the thermal points for the following paneL by on area-weighted averaging method:
No Material b A m W/m.K
1 Reinforced concrete 0.15 1.55 2 Expanded polystyrene 0.08 0.04 3 Reinforced concrete 0.10 1.55
The expanded polystyrene Is between two layers of cast concrete, the necessary correction foetor: " = 0.42, thus the A design value Is: (1 + 0.42)•0.04 = 0.0568 W /m.K
The value wDI be further Increased by the steel ties. Their aggregate crasssectional area per unit panel area (area fraction) is:
4• 0·0 162
" = 0.0008 (m•Jm2) . 4
the weighted average conductivity is: 0.0008o70 + 0.9992•0.0568 = 0.113W/m.K
34

4,0 rn
window
THERMALINSULATION
With this, the resistances ore:
Inner surface
1st layer
2nd layer
3rd layer
External surface
Air -to-air resistance
Thus the u value
'•.
Rll 0.15
Rl =-1.55
R. _ 0.08 2 - 0.113
R _ 0.1 3 - 1.55
Rso
1
0.998
:0.12
:0.065
=0.708
=0.065
=0.04
= 0.998
= 1.002 W/m2K
(without allowing for the thermal points this would be 0.58 7)
2.8 The resultant transmittance
For a given part of the building envelope a resultant heat transmission coefficient can be calculated:
... 2.10)
The resultant U value of prefabricated elements can be measured In colorimeters of adequate size.
Example 6 Resultant U-value calculation A facade element, at the corner of o building. shown In Fig.2.11, consists of the following layers (from the Inside):
No Material b ).
m W/m.K
~ 1.5 m 3,0 1 Plaster O.Q15 0.80 2 Light hollow Brick 0.38 0.41
2,5 m 3 Plaster O.Q15 0.80
Fig.2.11 A facade element The resistances are:
at a corner, with a window Inner surface Ro~ =0.12
lsi layer R 0.015 1 u 0.80 = 0.019
2nd layer R 0.38 2 • 0.41 = 0.926
3rd layer R -~ 3 - 0.80 = 0.019
External surface Rso =0.04
Air-to-air resistance = 1.12
U value 1
t12 =0.89W/m2K
35
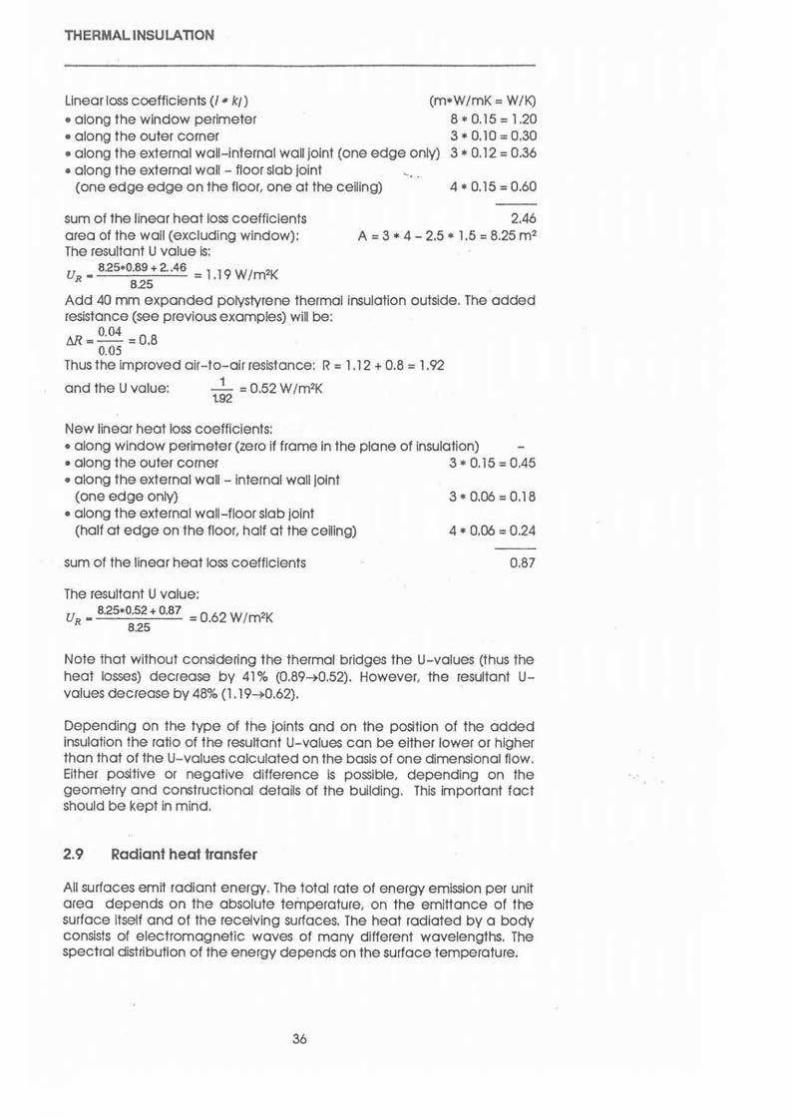
THERMAL INSULATION
Linear loss coefficients u- k/) • along the window perimeter • along the outer corner
(m•W/mK = W/K) 8. 0.15 = 1.20 3. 0.10 = 0.30 3 • 0.12 = 0.36 • along the external wall-internal waD joint (one edge only)
• along the external wall -floor Slab joint ' ·. (one edge edge on the floor, one ot the ceDing) 4. 0.15 = 0.60
2.46 sum of the linear heat loss coefficients area of the wall (excluding window): A = 3 • 4 - 2.5 • 1.5 = 8.25 m• The resultant U value Is: u R • 825•0.89 • 2. .46 = 1.19 W /m"K
825 Add 40 rrvn expanded polystyrene thermal lnsulatlon outside. The added resistance (see previous examples) wil be:
6R: 0.04 = 0.8 0.05
Thus the Improved air-to-air resistance: R = 1.12 + 0.8 = 1.92 1 and the U value: t92 = 0.52 W /m"K
New linear heat loss coefficients: • along window perimeter (zero if frame in the plane of Insulation) • along the outer corner 3 • 0.15 = 0.45 • along the external wal - Internal wall Joint
(one edge only) 3 • 0.06 = 0.18 • along the external wal -floor slab Joint
(half at edge on the floor, half at the ceiling) 4 • 0.06 "0.24
sum of the linear heat loss coefficients
The resultant U value: UR. 8.25•0.52 + 0.87 = 0.62 W/m'K
825
0.87
Note that without considering the thermal bridges the U-values (thus the heat losses) decrease by 41% (0.89~0.52). However, the resultant Uvalues decrease by 48% (1.19-+0.62).
Depending on the type of the Joints and on the position of the added insulation the ratio of the resultant U-values can be either lower or higher than that of the U-values calculated on the basis of one dimensional flow. Either positive or negative difference Is poSSible, depending on the geometry and constructional details of the building. This important fact should be kept in mind.
2. 9 Radiant heat transfer
All surfaces emil radiant energy. The total rate of energy emission per unit area depends on the absolute temperature, on the emiHance of the surface itself and of the receiving surfaces. The heat radiated by a body consists of electromagnetic waves of many diHerent wavelengths. The spectral <istribuHon of the energy depends on the surface temperature.
36
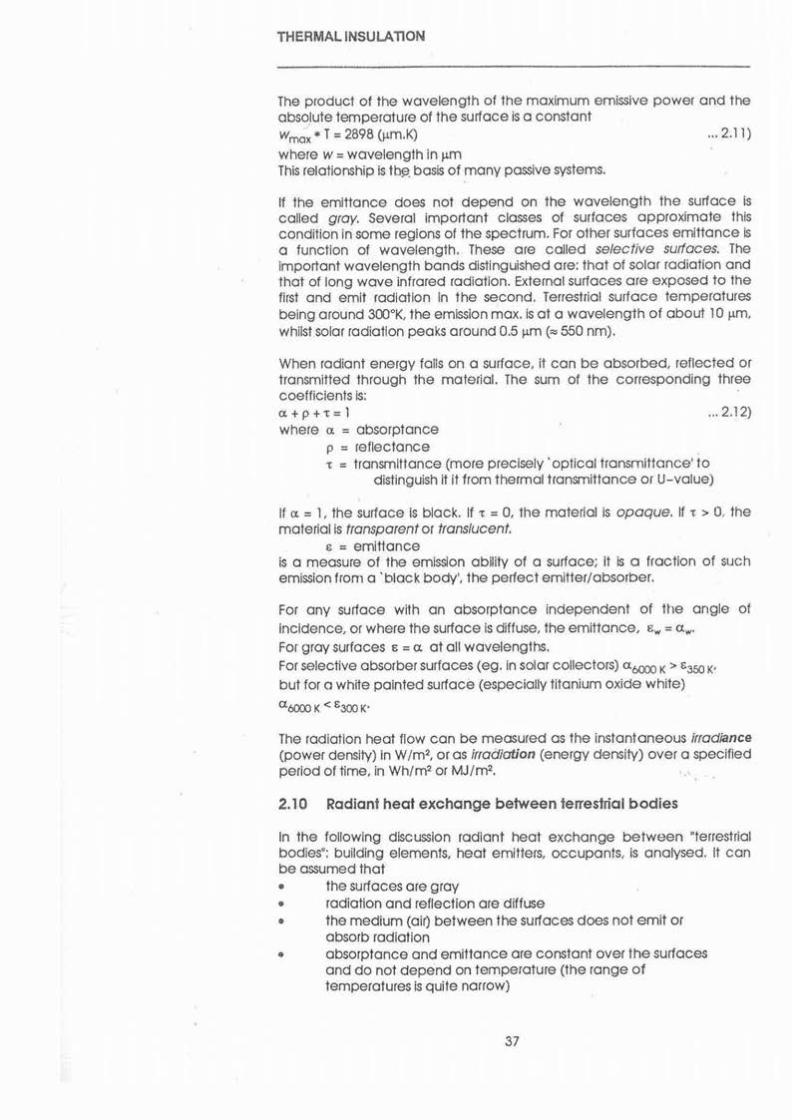
THERMAL INSULA TlON
The product of the wavelength of the maximum emissive power and the absolute temperature of the surface is a constant Wmox • T = 2898 (llm.K) ... 2.11) where w = wavelength in ,.m This relationship Is tb!3. basis of many passive systems.
If the emittance does not depend on the wavelength the surface is called gray. Several important classes of surfaces approximate this condition in some regions of the spectrum. For other surfaces emltlance IS a function of wavelength. These are called selective surfaces. The Important wavelength bands distinguished are: that of solar radiation and that of long wave infrared radiation. External surfaces are exposed to the first and emit radiation In the second. Terrestrial surface temperatures being around 300•K, the emission max. Is at a wavelength of about 10 ,.m, whilst solar radiation peaks around 0.5 ,.m (" 550 nm).
When radiant energy falls on a surface, it can be absorbed, reflected or transmitled through the material. The sum of the corresponding three coefficients is: CL+p+t=l ... 2.12) where "' = absorptance
p = reflectance , = transmltlance (more precisely· optical transmittance' to
distinguish 1111 from thermal transmitlance or U-value)
If "' = 1, the surface Is black. If ' = 0, the material Is opaque. If t > 0, the material is transparent or translucent.
s = emittance is a measure of the emission ablity of a surface; 11 IS a fraction of such emission from a 'black body', the perfect emitter/absorber.
For any surface with an absorptance independent of the angle of incidence, or where the surface is diffuse, the emittance, &w = <Iw.
For gray surfaces & = <X at all wavelengths. For selective absorber surfaces (eg. in solar cOllectors) o;6000 K > e350 K· but foro whHe painted surface (especially titanium oxide white)
(l¢000 K < 8300 K'
The radiation heot flow can be measured as the Instantaneous llladiance (power density) In W/m•. or as irradiation (energy density) over a specified period of time. In Wh/rri' or MJ/m2.
2.10 Radiant heat exchange between terrestrial bodies
In the following discussion radiant heat exchange between •terrestrial bodies': building elements. heat emitlers, occupants, is analysed. It can be assumed that • the surfaces are gray • radiation and reflection are diffuse • the medium (air) between the surfaces does not emit or
absorb radiation • absorptance and emittance are constant over the surfaces
and do not depend on temperature (the range of temperatures is quite narrow)
37
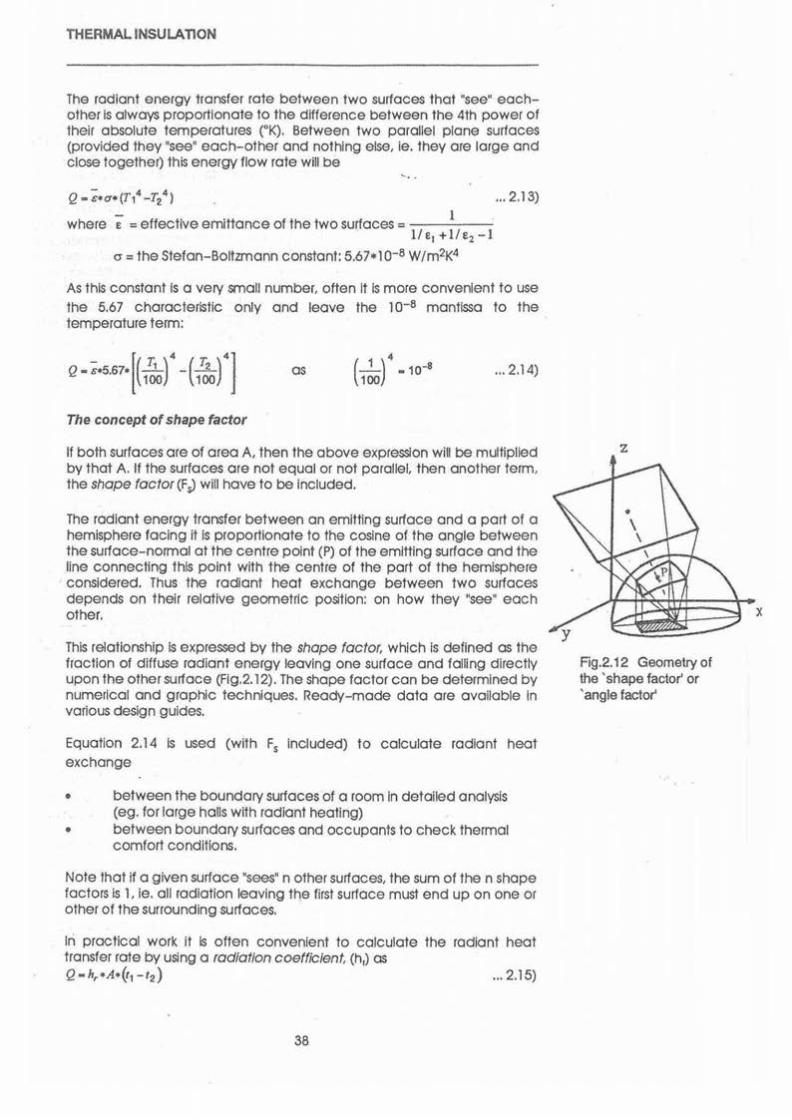
THERMALINSULATION
The radiant energy transfer rote between two surfaces tho! "see• eachother Is olwoys proportionate to the difference between the 4th power of their absolute temperatures ("K). Between two porollel plane surfaces (provided they "see" each-other ond nothing else, le. they ore Iorge ond close together) this energy flOw rote will be -..
... 2.13)
where £ =effective emittance of the two surfaces= 1
I/E1 +I/E1 -1
o =the Stefan-Boltzmann constant: 5.67•10-8 Wtm2K4
As this constant Is o very small number, often Ills more convenent to use the 5.67 chorocferisfic only and leave the 10-a mantissa to the temperature term:
as ... 2.14)
The concept of shape factor
If both surfaces ore of area A, then the above expression will be mutffplled by that A. If the surfaces ore not equal or not parallel, then another term, the shope factor (f J will have to be included.
The rodiont energy transfer between on emitting surface and a port of o hemisphere facing ills proportionate to the cosine of the angle between the surface-normal at the centre point (P) of the emitting surface and the line connecffng thiS point with the centre of the port of the hemisphere conSidered. Thus the radiant heat exchange between two surfaces depends on their relative geometric position: on how they "see" each other.
This relatiOnship Is expressed by the shape factor, which is defined as the traction of diffuse radiant energy leaving one surface and faiUng directly upon the other surface (Fig.2.12). The shape foetor con be determined by numerical and graphic techniques. Ready-mode data are available in various deSign guides.
Equation 2.14 Is used (with F, inCluded) to calculate radiant heat exchange
• between the boundary surtoce.s of o room in detailed analysis (eg. for large halls with radiant heating)
• between boundary surfaces and occupants to check thermal comfort conditions.
Note that if o given surface 'sees' n other surfaces, the sum of the n shape factors is I, ie. oil radiation leaving the first surface must end up on one or other of the surrounding surfaces.
lri practical work If Is often convenient to calculate the radiant heat transfer rote by using o radiation coeffiCient, (h,) as Q•h,•A•~,-t2) ... 2.15)
38
z
Fig.2.12 Geometry of lhe 'shape factor' or 'angle factor'

loss: nAil..--~.,,
equilibrium when: input = loss G•o. = h.(t..-t.) from which: t..=I0 +G•ct/h0
Fig.2. 13 Derivation of the sol-air temperature
THERMAL INSULA TlON
where
F,.&.s.s7· ( .~( -( .1( ~--------L--------~
11- '2 ... 2.16)
and Fs Is the shape foetor, otherwise this is derived from eq. 2.14
2.11 Radiative balance of opaque elements
An opaque surface exposed to sOlar radiation will be healed until its temperature increases to a point when the convective heat loss equals the net radiant gain. If we assume the surface to be adiabatic o.e. there Is no heat flow Into the body behind the surface), then the surface temperature wiD be referred to as the sol-air temperature. The equRibrlum condition wil occur when loss= gain (flg.2.13), le. h.•(t.,. - •.)-G•a - &•tJE ... 2.1 7)
where o. = obsorptonce for solar radiation G = global sOlar irradiance h0 =surface conductance (a lumped parameter: hc+h1)
t50
=surface (sol-air) temperature t0 = outdoor air temperature
" AE =emittance for long-wave infrared radiation = difference in long wave radiatiOn input (from sky
and surroundings) and the emission by o black-body at air temperature.
... 2.18)
This Is the definition of sol-air tempetature, the term indicating that h combines the effects of outdoor air temperature and solar radiation. Although the term sol-air temperature may Imply climatic data, its value depends also on surface properties of building elements.
The heat transfer then, through an envelope element will be (modifying eq.l.6): Q-A•U•(r.., -t1 ) ... 2.19)
The terms •Clark" and ,ighf' normaly refer to surface properties for visible light: wavelengths 380 - 780 nm (nona-metre = w-9 m). Solar radiation is dominantly visible, but contains some UV and much IR wavelengths (up to 3000 nm). Surface temperature depends on the absorptonce for solar radiation and the emittance of the surface in the ' long wove" infrared band (longer than 31XX:l nm).
In some cases the visual Impression may be 'lighr. but for the infrared band the surface is dark (in the thermal sense). This Is the case of selective surfaces mentioned above (in section 2.9), eg. snow cover and most white points. Very high or very low surface temperatures can be achieved by the deliberate use of such selective surfaces, wHh the appropriate o. and c values. The o./& ratio (more precisely the o.1mn/&300< ratio) con be as high as 18 for some solar cOllector surfaces, such as chromium block.
39

THERMAL INSULA. 110N
Emittance of flat roofs may have an important role in both winter and summer, during the night. Flat roofs "see" the sky and their radiant emission depends on the apparent sky temperature. Their radiant heat exchange takes place with the small particles of the atmosphere (primarily watervapour), the temperature of which decreases with the altitude. If the air iS drier, water particles are fewer, the probability of striking one of them in the lower layers of the atmosphere is less, ie. mostly the particles I~ higher layers will form the cool receiving surface and the radiant heat loss of the roof will be greater. Conversely, at higher air humidity the probability of striking a water vapour particle in lower layers is larger, the receiving surface is warmer and the radiant heat loss is less (Fig.2.14). As a result of this phenomenon extra heat losses have to be taken into account while calculating heat load. For normal roof surfaces (except bright metal) it iS usual to take the value of £*6E as 90 W/m2 in a clear sky situation, 50 for a partly cloudy and 20 W /m2 for an overcast sky.
This process is the basis of one of the passive cooling techniques in hotdry climatic conditions.
Roofs are most exposed to such radiant loss, but also to a wide temperature range; therefore thermal movements and the strength of materials must also be considered while designing the waterproofing and thermal Insulation.
2.12 Non-steady one dimensional heat flow
In thiS case the difference of the flows, entering and leaving the system (the wall) results in the variation of stored heat. ThiS variation iS proportionate to the thermal capacity of the body (J/K), which is the product of its mass (M) and the specific heat of the material (c), as well as to the temperature variation. The value of c is usually given in J/kg.K (sometimes on a volumetric basiS as J/m3 K). For building materials (except wood and metal) the values of c are in the narrow range of 850 - 1000 J/kg.K, thus often only the mass of materials is compared without mentioning the specific heat.
Heat transfer can be calculated by subdividing the wall into thin layers. Each has a mass, proportionate to the thickness of the layer and the density of the material. Between two such layers the thermal resistance is proportionate to the distance between the center-planes of the layers and Is Inversely proportionate to the conductivity (Fig.2.15). The temperature (or heat flux) versus time function is given on the boundary as well as the temperature distribution within the wall in a given moment (Initial conditions). The energy balance Is to be calculated step by step for M small time intervals. The balance of the }-th layer for the 1-th time interval is: fi,j-i -fi,j (f.j+l -fi.j f;,j -fi-l,j A-
t.Vo-j(J ici R1_1.J RJ.i+i txt
... 2.20)
where t = temperature (0 C) & = thickness of the layer p =density c = specific heat 6t = small time interval,
· R = thermal resistance Indices J-1, J+l refer to the geometric position of the layers
t-1, t, to the consecutive time Intervals. The number of equations is the same as of unknown temperatures, thus again we "only• need a computer and a fast algorithm.
40
a . .. · . . .... .
Fig.2.14 Radiation to the atmosphere, a: dry, b: hun
1 • I
"' "' I /.. ).. I )..
I I I p I p I p p I p
I I I C I c I c c 1 c I I I I I I I I I I I I I I I • I
AX AX t..x t..x ,
Rg.2.15 The schema layers: resistances an capacitances in serie~

Fig.2.16 Periodic heat flow through a wall: charging and discharging half-cycles
THERMAL INSULATION
2.13 Periodic heat flow
In many cases thermal factors {outdoor temperature. solar radiation) change periodically (the most obvious one being the 24 hour period). In this case the heat transfer con be calculated with analytical methods. The following concepts. originate from such analytical solutions.
These ore usvotty the ratios of values of two harmonic functions. These values ond fhe rolla Itself a re complex numbers. The Imaginary part represents the omplffude (or amplitude ratios). whilst the difference In phose angle (tan-l(frnaglnory/real)) between the external and Internal surface vector gives the phose lag. On the basis of the angular freQuency (2r. radians or 360' corresponds to the period. 24 hours) the phase log con be transformed Into time log (see Flgs.2.16- 2.17).
In the first half of the period. the temperature of one of the surfaces is lncreaseed. A heat flOw starts towards the opposite surface. A port of this heat Is "consumed" by the first thin layer which is cooler than the surface and has to be heated up before it can transmit any heat to the next layer. The process Is continued this way. each layer •consuming• {storing) some heat. Thus, only a fraction of the starting flux reaches the opposite surface. as meanwhile. In the second half of the period. the surface temperature Is lowered and reverse flows develop from and In the wall. releasing the heat stored in the first part of the period (flg.2.16). The ratio of the transferred and stored heat. the movement of the temperature wove towards the opposite surface and bock. the depth of penetration achieved by the "temperature front'. the time log between the peak flows on the opposHe surfaces, etc. depend on the conductivity. moss. specific heat and order of the layers.
I !
1 " 1 ' i
~,
I b) Temperature changes at the The rotating vectors which
at three time- points surface, 113 and 2/3 of thickness produce the sine curves of (b) Fig2.17 Periodic heat flow through a wall. External and internal surface temperalllres and values wilhin the cross section are represented (c) by vectors (complex numbers). The len!Pl of vectors is proportionate to their 3Jl'4)itude, the angles between them to the titM lag. Projecting the rotating vectors produces a set of sine curves showing the temperature versus tine functioos lor di"erent planes (b). Temperatures at a given moment are given by the temperature versus x-axis (lhickness) functioos (a).
The following ore the most common concepts (refer to Section 1.7): Decrement factor: the ratio of amplitudes (about the mean) of ambient and internal surface temperature variatiOns (some authors interpret it as the effect of heat storage capacity or of both capacity and resistance). Its possible maximum value Is 1: tor elements with zero heat st01age capacity. The time-lag Is usually I to 14 hours. Note that for asymmetric cross sections these values depend also on the direction of heat flow. Thermal admittance: a measure of the abWity of internal surfaces to admit or release heat {dimensionolysome as the U-value: Wim•K).
41
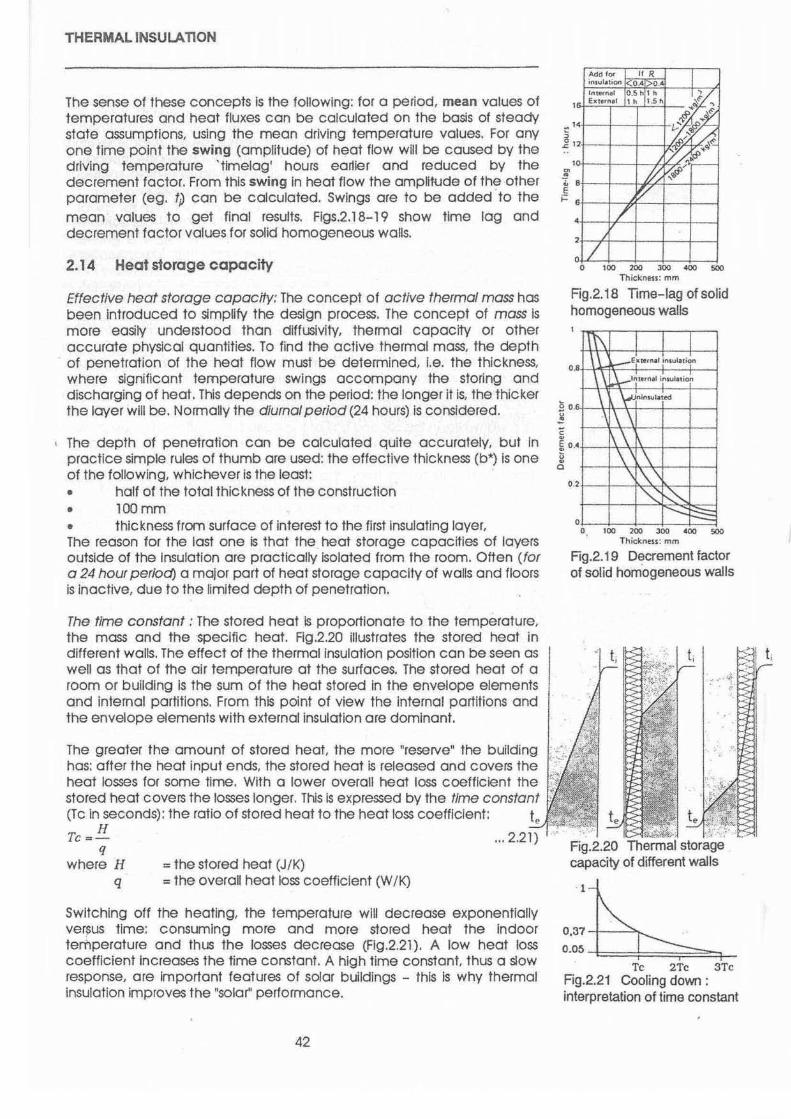
THERMAL INSULA TlON
The sense of these concepts is the following: for a period, mean values of temperatures and heat fluxes can be calculated on the basis of steady state assumptions, using the mean driving temperature values. For any one time point the swing (amplitude) of heat flow will be caused by the driving temperature ' timelag' hours earlier and reduced by the decrement factor. From this swing in heat flow the amplitude of the other parameter (eg. tj) can be calculated. Swings are to be added · to the mean values to get final results. Figs.2.18-19 show time lag and decrement factor values for solid homogeneous walls.
2. 14 Heat s1orage capacity
Effective heat storage capacity: The concept of active thermal mass has been introduced to simplify the design process. The concept of mass Is more easily understood than diffusivity, thermal capacity or other accurate physical quantities. To find the active thermal mass, the depth of penetration of the heat flow must be determined, i.e. the thickness, where significant temperature swings accompany the storing and discharging of heat. This depends on the period: the longer it Is, the thicker the layer will be. Normally the diurnal period (24 hours) is considered.
' The depth of penetration can be calculated quite accurately, but In practice simple rules of thumb ore used: the effective thickness (b*) is one of the following, whichever is the least: • half of the total thickness of the construction • 100 mm • thickness from surface of interest to the first insulating layer, The reason for the last one is that the heat storage capacities of layers outside of the Insulation are practically isolated from the room. Often (for a 24 hour period) a major part of heat storage capacity of walls and floors is Inactive, due to the limited depth of penetration.
The time constant : The stored heat is proportionate to the temperature, the mass and the ·specific heat. Fig.2.20 illustrates the stored heat in different walls. The effect of the thermal insulation position can be seen as well as that of the air temperature at the surfaces. The stored heat of a room or building is the sum of the heat stored in the envelope elements and internal partitions. From this point of view the internal partitions and the envelope elements with external insulation are dominant.
The greater the amount of stored heat, the more "reserve" the building has: after the heat input ends, the stored heat is released and covers the heat losses for some time. With a lower overall heat loss coefficient the stored heat covers the losses longer. This is expressed by the time constant (Tc in seconds): the ratio of stored heat to the heat loss coefficient : te
H Tc =-
q where H
q = the stored heat (J/K) =the overall heat loss coefficient (W / K)
Switching off the heating, the temperature will decrease exponentially verpus time: consuming more and more stored heat the indoor temperature and thus the losses decrease (Fig.2.21 ). A low heat loss coefficient increases the time constant. A high time constant, thus a slow response, are important features of solar buildings - this is why thermal insulation improves the "solar" pe rformance.
42
~ ~ Br--+--~74--~~ E ~ sr--+~~-4--~~
0~-+--+--4--4-~ 0 100 200 300 400 500
Thickness: mm
Fig.2.18 Time- lag of solid homogeneous walls
2 0 .6+---++lr--+-+--4-4-~ ~ c .. ~ 0 .4+---t-'\-\-t-\--+---t----i t;
0
100 200 300 400 500 Thickness: mm
Fig.2.19 Decrement factor of solid hom'ogeneous walls
·:t<:·:···. Fig.2.20 Thermal storage capacity of different walls
1
0,37 -t--~
0.05 --t=~===r=====t--Tc 2Tc 3Tc
Fig.2.21 Cooling down : interpretation of time constant
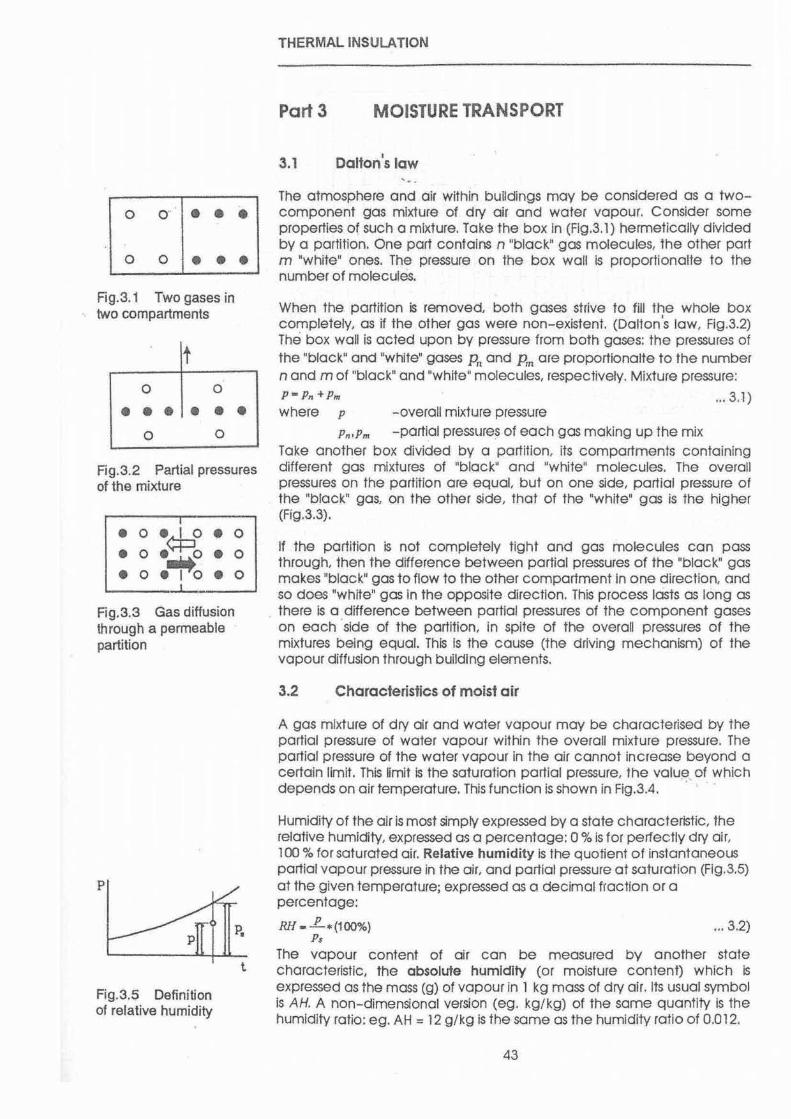
0 0 " •••
0 0 •••
Fig.3.1 Two gases in two compartments
t 0 0
•••••• 0 0
Fig.3.2 Partial pressures of the mixture
I
• 0 ~~0 • 0
• 0 • 0 • 0
• 0 e-rto • 0 I
Fig.3.3 Gas diffusion through a permeable partition
Fig.3.5 Definition of relative humidity
t
THERMAL INSULATION
Part 3 MOISTURE TRANSPORT
3.1 Dalton's law -..
The atmosphere and air within buildings may be considered as a twocomponent gas mixture of dry air and water vapour. Consider some properties of such a mixture. Take the box in (Fig.3.1) hermetically divided by a partition. One part contains n "black" gas molecules, the other part m "white" ones. The pressure on the box wall is proportionalte to the number of molecules.
When the partition iS removed, both gases strive to fill the whole box completely, as if the other gas were non-existent. (Dalton's law, Fig.3.2) The box wall is acted upon by pressure from both gases: the pressures of the "black" and "white" gases Pn and Pm are proportionalte to the number nand m of "black" and "white" molecules, respectively. Mixture pressure: P - Pn+Pm .. . 3.1) where p -overall mixture pressure
Pn•Pm -partial pressure~ of each gas making up the mix Take another box divided by a partition, its compartments containing different gas mixtures of "black" and "white" molecules. The overall pressures on the partition are equal, but on one side, partial pressure of the "black" gas, on the other side, that of the "white" gas is the higher (Fig.3.3).
If the partition is not completely tight and gas molecules can pass through, then the difference between partial pressures of the "black" gas makes "black" gas to flow to the other compartment in one direction, and so does "white" gas in the opposite direction. This process lcists as long as
. there is a difference between partial pressures of the component gases on each ·side of the partition, in spite of the overall pressures of the mixtures being equal. ThiS Is the cause (the driving mechanism) of the vapour diffusion through building elements.
3.2 Characteristics of moist air
A gas mixture of dry air and water vapour may be characterised by the partial pressure of water vapour within the overall mixture pressure. The partial pressure of the water vapour in the air cannot increase beyond a certain limit. This limit is the saturation partial pressure, the value of whic h depends on air temperature. This function is shown in Fig.3.4.
Humidity of the air is most simply expressed by a state characteristic, the relative humidity, expressed as a percentage: 0 o/o is for perfectly dry air, 100 o/o for saturated air. Relative humidity is the quotient of instantaneous partial vapour pressure in the air, and partial pressure at saturation (Fig.3.5) at the given temperature; expressed as a decimal fraction or a percentage:
RH- _E_•(100%) ... 3.2) Ps
The vapour content of air can be measured by another state characteristic, the absolute humidity (or moisture content) which is expressed as the mass (g) of vapour in 1 kg mass of dry air. Its usual symbol is AH. A non-dimensional version (eg. kg/kg) of the same quantity is the humidity ratio: eg. AH = 12 g/kg is the same as the humidity ratio of 0.012.
43
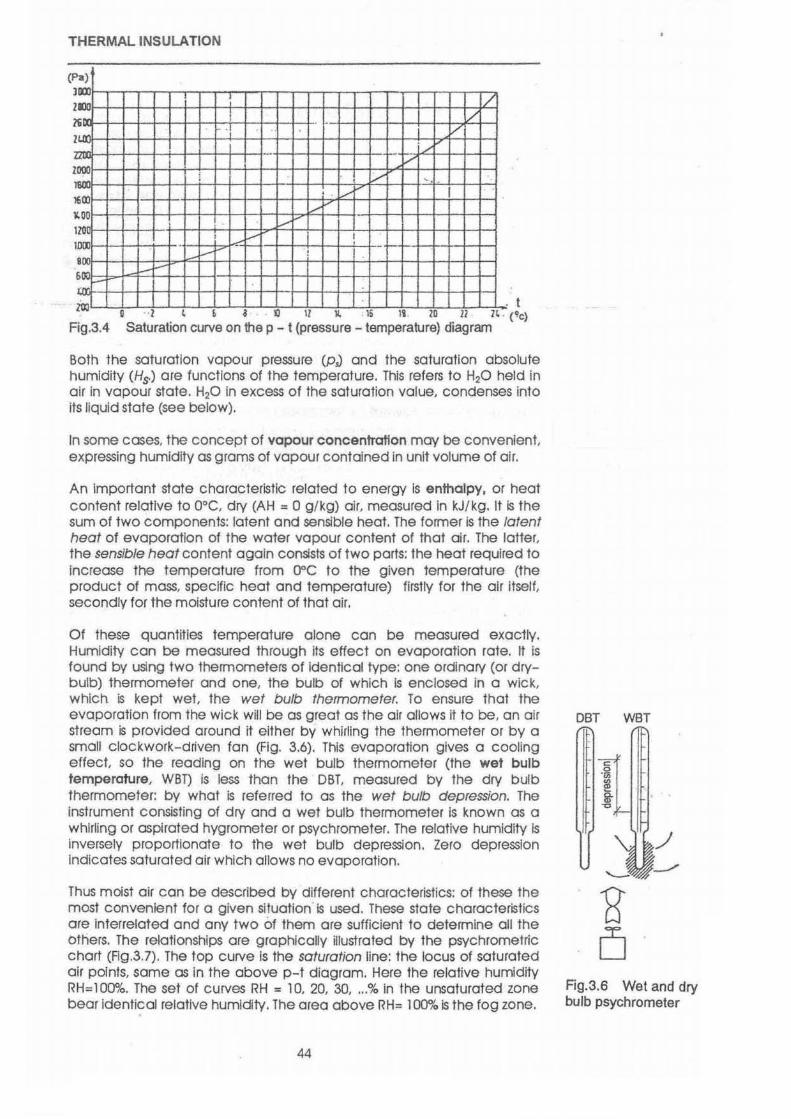
THERMAL INSULATION
(Pa) )IJX)
I / 2110 V' ?&""
. .. i v
2U() -· -v / --
2000 i ~ 1600
. ' · . . vf-""" I 1600 11.00
:,....--
lZOO ' ,...,..
I :..--- I 1000 ~ ---f-"' : 800 1--' &00 --1-, . .....,
t zOO . 0 .. l ~ L a 10 ll 11. . lo 1'& . 10 22 H . ( 9c) Fig.3.4 Saturation curve on the p- t (pressure- temperature) diagram
Both the saturation vapour pressure (PJ and the saturation absolute humidity (Hs) are functions of the temperature. This refers to H20 held in air in vapour state. H20 in excess of the saturation value, condenses into its liquid state (see below).
In some cases, the concept of vapour concentration may be convenient, expressing humidity as grams of vapour contained in unit volume of air.
An important state characteristic related to energy is enthalpy, or heat content relative to 0°C, dry (AH = 0 g/kg) air, measured In kJ/kg. It is the sum of two components: latent and sensible heat. The former is the latent heat of evaporation of the water vapour content of that air. The latter, the sensible heat content again consists of two parts: the heat required to increase the temperature from ooc to the given temperature (the product of moss, specific heat and temperature) firstly for the air Itself, secondly for the moisture content of that air.
Of these quantities temperature alone con be measured exactly. Humidity can be measured through its effect on evaporation rate. It is found by using two thermometers of identical type: one ordinary (or drybulb) thermometer and one, the bulb of which is enclosed in a wick, which is kept wet, the wet bulb thermometer. To ensure that the evaporation from the wick will be as great as the air allows it to be, an air stream is provided around it either by whirling the thermometer or by a small c lockwork-driven fan (Fig. 3.6). This evaporation gives a cooling effect, so the reading on the wet bulb thermometer (the wet bulb temperature, WBT) is less than the DBT, measured by the dry bulb thermometer: by what is referred to as the wet bulb depression. The instrument consisting of dry and a wet bulb thermometer is known as a whirling or aspirated hygrometer or psychrometer. The relative humidity Is inversely proportionate to the wet bulb depression. Zero depression indicates saturated air which allows no evaporation.
Thus moist air can be described by different characteristics: of these the most convenient for a given situation· is used. These state characteristics are interrelated and any two of them are sufficient to determine all the others. The relationships are graphically illustrated by the psychrometric chart (Fig.3.7). The top curve is the saturation line: the locus of saturated air points, same as in the above p-t diagram. Here the relative humidity RH= 100%. The set of curves RH = 10. 20, 30, ... % in the unsaturated zone bear Identical relative humidity. The area above RH= 100% is the fog zone.
44
DBT WBT
Fig.3.6 Wet and dry bulb psychrometer

THERMAL INSULATION
SENSIBLE HE AT . TOTAL HEAT
Fig. 3. 7 The psychrometric chart
45

THERMAL INSULATION
The vertical axis has two scales: AH (in g/kg) and partial pressure of water vapour (in kPa or kN/m~. Sloping lines indicate the wet bulb temperatures and enthalpy values and another set the density (kg/m
3) of the air-water
mix (or its reciprocal, the specific volume, m3/kg).
Note that saturation limit depends on temperature, so at a low temperature a rather low moisture content (absolute· humidity). causes a high relative humidity, whilst at a high temperature, for a comparatively low relative humidity there is a high absolute humidity.
Condensation is due to cooling. As being cooled, the relative humidity of unsaturated air starts increasing. The absolute humidity, and the partial pressure of vapour, remain constant. At a given temperature, the saturation limit is reached (the relative humidity value of RH = l 00%). This is the. dew-point temperature. Upon further cooling, the air can not hold that saturation humidity, but only that allowed by the saturation limit at the new, lower temperature. The excess condenses out as fog (ie. fluid), or as frost (ie. solid) . Condensation also occurs on surfaces with a temperature below the dew-point temperature.
Thi.s process is shown in the psychrometric chart (Fig.3.8). Here point A represents the internal air condition. If this air is cooled, it will reach Its Fig.3.8 Condensation as dew-point at point B (10°C). If it is cooled further, condensation will occur. a consequence of cooling
3.3 Sorption
Most building materials (especially insulation materials) have a porous structure. The developed area of internal surfaces of the pores is quite large, which is important for moisture absorption and fixation. Moisture absorption of materials is characterised by their sorption isotherms. These curves are usually of the form seen in Fig.3.9. The cuNes are recorded at constant temperature by determining the equilibrium moisture content of a specimen kept in air at constant temperature and relative humidity.
The horizontal axis of the sorption isotherm indicates relative humidity of air in contact with the specimen, while the vertical axis indicates the moisture content of the material, expressed as mass or volume percentage (ro). The saturation moisture content is denoted ro5 •
The sorption isotherm curve generally has an inflection point where its ascent abruptly increases. This is the starting point for capillary condensation where moisture does not only coat the pore surfaces but starts to fill up full cross sections of capillaries. This so-called capillary condensation develops at a relative humidity RH ~ 75% for usual building materials. This point is shown In Fig. 3.9 as rocc· It should be noted that such capillary condensation would begin even if the surface is not below the dew-point temperature.
3.4 Convective moisture transport
In an indoor space moisture is produced by occupants and their activities (see Data sheet 7) . Excessive moisture production increases the risk of harmful effects to the building and its users, but moisture production cannot be reduced below a threshold without curtailment of the
I
buildings normal use. Most of the moisture produced in the room leaves with the ventilation air. There is also vapour diffusion through walls and floors, although, for moisture balance in a room, the quantity of moisture leaving by diffusion is negligible.
46
=·r----"----------,
C.Occr---·------- I I I
I I
100%RH Fig.3.9 A typical sorption isotherm. X-axis: relative humidity Y -axis: moisture content of material (mass or volume%)

Fig.3.1 0 Psychrometric processes: fresh air warms up, picks up moisture and cools down at the wall surface. Note that the warmer air absorbs less moisture, because of its higher initial AH
THERMAL INSULATION
WHh this assumption (and in the absence of condensation) the mo~ture balance In the room Is:
W • mt-mo where II' • mo~ture arising from Internal sources. g/h
mr =quantity of moisture leaving wilh venlilatlon air. g/h
m0 =quantity of moisture entering with ventDalion air g/h Introducing the concept of vapour concentration:
... 3.3)
w- Uv; -Lev.-Ucv ' ... 3.4) where cv = vapour quonllly per unit volume of air g/m
L =volume flow of ventaatlon air m'/h w
""" -- ... 3.5) L whiCh expresses the Increase of humidity per unit volume flow of ventUoflon air. this Is fhe removed quantity.
Relying on the temperature and relative humidity of outdoor air the relative humidity ol internal air of a specilied temperature at a given vapour concentration increment <locv con be calculated.
There Is on unambiguous correlation between the air condition in the room and the air condition In contact with the surface. For instance. H surface temperature is 14•C and the maximum permissible relative hLtmld!ty is 75% (if capillary condensation is to be avoided). then in a room ol 2QOC, the relative humidity may be 50%. The absolute humidity determined from the first polr of values is AH = 7.5 g/ kg, which gives o relative humidity of 50% at 2o•c .
The process described above is shown in Fig.3.1 Oo. Here point A represents the external air. The process can be visualised in three consecuflve steps: A-+8: temperature of air. entenng the room increases up to the Indoor temperature (no change in mOisture content) 8-+C: humidity of the air. entering the room increases by Acv • point C representing the Indoor condiflon; C-+D: temperature of Indoor air decreases to that of the surface. at constant absolute humidity. Point D represents the condition at the surface.
To prevent mould growth the RH at point D Should be less than 75%
The deSigner's task is to harmonise the above parameters. Thus. if the surface temperature and moisture development ore given values. """ • minimum air change and acceptable indoor relative humidity con be calculated. Higher outdoor temperatures ore more 'risky" os venlilotion air entering from outdoors has a higher absolute humidity (Fig.3.10b). Although a t higher outdoor temperatures the RH Is lower, the absolute humidity rises with increaSing t0 values.
The evolution period of capulary condensation and mould growth is about five consecutive days, therefore shorter periods con be neglected.
3.5 Vapour diffusion through walls
With a closed btilding. due to the different air conditions indoors and outdoors. normally there is a difference between the partial water vapour pressures of indoor and outdoor air. This pressure difference is the driving
47

THERMAL INSULATION
mechanism of vapour flow (usually called diffusion) through permeable building elements. Note that only the partial water vapour pressure difference is considered. The baromet~c pressure of the Indoor and outdoor moist air ore the same. (Refer to Fig. 3.3). AI equal barometric pressures, if the vapour pressure is higher Inside, the portiol pressure of the dry air is higher Qutside, thus whilSt water molecules wil migrate outwards, a dry air flow· develops in the opposite direction.
The quantity of vapour, leaving the room by diffusion is very small In comparison with that leaving with the ventilation air. However vapour flow through building elements has to be calculated In order to check the partial pressure distribution within the element and to prevent the phenomenon of interstffial condensation. II fOllows from !he above thai vapour diffusion should be analysed if • there is a significant vapour pressure difference between the indoor
space and the ouldoor environment, and • !here is also a significant lemperature difference.
In practice steady slate condillons are assumed. Vapour diffusion is 6 very slow process: !he mean temperature and the mean relative humidity of the outdoor air in the cOldest winter-month ore token as design values.
Resistance to this vapour flow is offered by the envelope elements depending on the mote~ats used. The material property analogous with thermal conductivity Is permeability, (ll) (or vapour diffuslvity in some texts). This is the quantity (g) of vapour flow in unit time (s) at unit pressure difference (Po) between to opposite surfaces of a cube of uri! size of the material (mlm'). The flow is one-dimensional.
The unit of permeabiity is 0 : g,m __ g_
s.m2 Pa s.m.Pa
but as the values encountered in practice are very small, normally the m ' (milli-) prefix (IO- ') is attached and kPa is used as the pressure unit, thus
permeability is measured in: mgl s.m.kPa
Permeance is the quantity analogous with conductance and its value for a layer Is
Q P-
b (unit: mgls.m2kPa)
where ll = permeability b =thickness (breadth)
Vapour resistance is the reciprocal:
... 3.6)
R6
• !!._ [ I m • m.J.nt.kl'o • m2 J.kN I .,2 • !!!:!:!.] ... 3.7) 6 mg s.m.kPu mg mg mg
Resistances ore additive. the vapour resistance of a multilayer element is
R,. • 2: R 6
• 2: ~ ... 3 .8)
In vapour transfer the surface resistance is very small. In practical calculations it can be neglected. Thus, partial pressure at the surface is assumed to be the some as in the air in contact with the surface.
3.6 Vapour pressure distribution in cross section
Similarly to the temperature gradient, the vopour pressure gradient can be established by finding the pressure drop for each Ioyer on the basis of
48
'•'

THERMAL INSULATION
For a mutti ayer building element
;, .l!L=..&. R,
and. for any layer 0 {;pi mi • -
Ri where p1
Thus
P. t;pj
{;pi Ri P;-P. • R,.
or
= partial water vapour pressure In the Indoor air, = partial water vapour pressure In the outdoor olr. = pressure difference between the two boundary
planes of 1 -th Ioyer, = resistance of the element; =resistance of 1 - th Ioyer = vapour flux (moss flow rote).
t;p,: t,p2:t;p3: ..... R,:R2:R3: ....
000 3.9)
... 3.10)
.. . 3.11)
... 3.12)
Partial pressure values are to be calculated for the surfaces and planes between two layers. Within one homogeneous Ioyer the pressure distribution is linear (Fig.3.11).
The task In this stage of design is to check whether the calculated partial pressure values are below the saturation values everywhere In the cross section. The saturation value of the partial vapour pressure Is the function of the temperature (fig.3.11). PlOt the temperature distribution In the cross section and, in several points. plot the saturation pressure from Fig.3.4. If there is no lnlemection of calculated and saturation pressure distnbullon. no condensation is expected.
3.7 Design approach
From Fig.3.11 the actual and the saturation values. p and p,. of vapour pressure can be read. By definition, their ratio is the relative humidity:
R/{ • ..L ... 3.13) Ps
From the sorption isotherm (Fig.3.9) the moisture content (Ol) of the material. belonging to a given relative humidity con be read ond can be plotted on a cross-section of the wall (Fig.3.11 . lower curves).
The ~sk of condensation is the highest In the outSide half of the thermal insulation layers. Thermal Insulation materials hove high reSistance against heal flow (--+ big temperature drop). but their resJstonce against vapour flow Is usuaRy small. The oppoSite is true for materials of load-bearing and outside surface coating layers. This is why the calculated partial pressure is near the saturation value In the outside half of the thermal insulation layer: the temperature is low, the partial pressure is high (Fig.3.11 ).
The risk can be avoided and condensation prevented if • · thermal lnsualion is on the outside (the whole cross section is
kept warm. the only problem is the reSistance of the outside surface)
• there is a slightly ventilated air gap between the outside surface layer and the thermal insulation; In this gap the partial pressure iS practically the same as in the outdoor air (if the thickness of the air gap is minimum 20 mm and it is wen ventilated)
49

THERMAL INSULATION
• there Is a vapour barrier in the construction (o vapour-light membrane, eg. a thin plastic Sheet) having a large resistance (Fig.3.12). In the USA a membrane Is taken as a vapour barrier if Its permeance Is less I han 0.067 mg/s.m•. kPa.
I •• : - I : temperature -.. w
- p, : saturation wopour pressure - p : vapour pressure
- RH : relative humidity
- 01 : moisture content
Fig.3.1 t Temperature and pressure gradients through a sandwich wall
3.8 Graphic analysis
The most time-consuming step of the Gloser-method, presented in Section 3.6 Is to plot the calculated and saturation partial pressure curves, point by point In I he cross section of the wall. A saturation partial pressure versus temperature curve Is available (Fig.3.4). The analysis of the construction becomes eosler and foster if the calculated pressure values ore transformed into this temperature-partial pressure coordinate system. The basis of this tronsformaffon Is, that the position of the surfaces and the planes between the layers In the p-t coordinate system are defined by their temperatures. The mutual equivalence of surfaces and planes of a given temperature can be shown by o simple geometrical transtormaffon (Fig. 3.13) from the wall's temperature gradient to the p-t diagram.
Fig.3.12 Condensation risk reduced by e)(temal insulati or a vapour barrier
Fig. 3.13 Finding saturation pressures from temperature Qr<ldie,nt·l--....l....L.....L.-...L..:;-
50
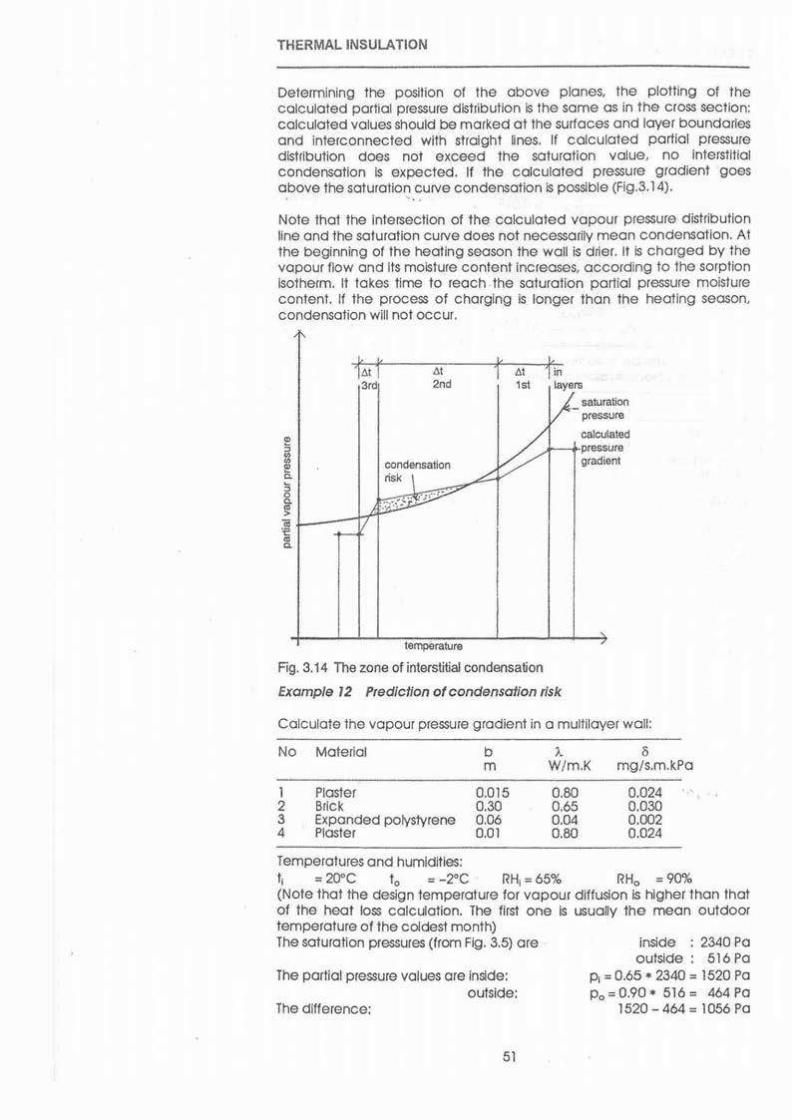
THERMAL INSULATION
Oelermlning the position of the above planes, the plotting of the calculated partial pressure distribution is the some as in the cross section: calculated values should be marked at the surfaces and layer boundaries and Interconnected with straight lnes. If calculated partial pressure distribution does not exceed the saturation value, no interstitial condensation is expected. If the calculated pressure gradient goes above the saturation curve condensation is possible (Fig .3.14). . .. .. Note that the intersection of the calculated vapour pressure distribution line and the saturation curve does not necessarily mean condensation. At the beginning of lhe heating season the wall is drier. II is charged by the vapour flow and Its moisture content increases, according to the sorption isotherm. It tokes time to reach the saturation partial pressure moisture content. If the process of charging is longer than the heating season, condensation will not occur.
1"at 1' ~ ~~ 1 4t
3td 2nd 1st i' in cz _ satur ation
essuro pr
~ calcut press
condensation .,?.
gradi
nsk \
a ted ure ent
~~ .. ;·.~ ...
r-
' terrc>erature
Fig. 3. I 4 The zona of interstitial condensation
Example 12 Prediction of condensation risk
Calculate the vapour pressure gradient in a multilayer wall:
No Material b ). 0 m W/m.K mg/s.m.kPa
1 Plaster 0.015 0.80 0.024 2 Brick 0.30 0.65 0.030 3 Expanded polystyrene 0.06 0.04 0.(X)2 4 Plaster O.Dl 0.80 0.024
Temperatures and humidities: t, = 20"C t0 = -2"C RH, = 65% RH0 = 90% (Note that the design temperature for vapour diffusion is higher than that of the heat loss calculation. The first one is usually the mean outdoor temperature of the coldest month) The saturation pressures (from Fig. 3.5) ore
The partial pressure values ore inside: outside:
The d ifference:
51
inside : 2340 Po outside : 516 Po
A = 0.65 • 2340 = 1520 Po Po= 0.90 • 516 = 464 Po
1520-464 = 1056 Po

THERMAL INSULATION
As in example 1 (p.30), the conductivity of the expanded polystyrene layer is to be corrected with regard to the •wet technology" of plastering. The correction factor is K:0.25, the design value is A.cs..=(1 +0.25}•0.04= 0.05 The thermal resistances are:
Inner surface R" :0.12
1st Ioyer R 0.015 1 ·o:ao ; 0.019
2nd Ioyer R 0.30 2 - 0.65
=0.462
3rd layer R 0.06 3
- 0.05 =1.200
4th layer R 0.01 • - 0.80 = 0.013
outside surface R,. = 0.04
air-to-air resistance : 1.854 :.U- value = 0.54 Calculation of temperature gradient
Rnlflo-o t.t . t
Indoor air 20.00 0.065 1.42
Inner surface 18.58 1stlayer 0.010 0.23
18.35 2nd layer 0.249 5.48
12.87 3rd Ioyer 0.650 14.24
-1.37 4th layer 0.007 0.15 External surface -1.52
0.022 0.48 Ouldoorair -2.00
As it was pointed out in Section 2.1, transfer processes ore similar and the alogrtthm of the calculation is the some. Thus, for vapour diffusion the same procedure Is to be repeated. substituting a different content Into the equations.
The vapour resistances are (surface resistances are negligible):
1st layer (!.) o.o15 = 0.625 I 41.042 = 0,015 6 0.024
2nd layer
3rd layer
4th layer
0.30 0.03 0.06
0.002 0.01
0 .024
vapour resistance
= 10.000 I 41.042 = 0.244
: 30.000141.042 = 0.731
= 0.417 141.042 = 0.010
(air-to-air)
The partlal pressure distribution wul be checked In a p-t cliagrom (Fig. 3.15.) The thickness is drawn to a temperature scale: planes of the wall can be pinpointed accorcling to their calCulated temperature. Thus 18.39 •c corresponds to the inner surface, 18.1s•c to the boundary of the 1st and 2nd layers, 12.01•c to the boundary of the 2nd and 3rd layers. etc. Here the corresponding pressure values are to be marked. These points are to be connected with straight lines (Fig. 3.16.). The lines do not cross the saturation curve, thus no condensation is expected.
52

THERMAL INSULATION
Calculation of vapour pressure gradient
Rvn/Rvo-o 6P p
Indoor air 1520
Inner surface negligible
1520 lsi toyer 0.015 15.84
1504.16 2nd layer 0.244 257.66
1246.50 3rd toyer 0.731 771.94
474.56 4th layer 0.010 10.56 External surface 464
Outdoor air negligible
464
In this example the colclAotlon of heat and vapour nows ore shown seporotely. Cotcutotlon of thermal and diffusion resistances, ratios, temperatura and portiol pressure vdues con bo shown in one comprehensive table.
·2.0 ·1.37 ,..,.,....,. 'C 12.87 IS.3S 20.00 ·I.Sl II.SI
Fig. 3.15 Example 12: comparing vapour pressure gradient with saturation curve
An olfemotiVe Is to find the dew-point temperature ot each toyer boundary, from the psychrometric chart (Fig.3.7), ptot the dew-point temperature curve and compote this with the temperature grodient constructed.
--""ra\Ut~> ""inl \.,.,,..- - - -
---t20"c
i I I deW:!'""- --
L=--~~~~1)(8S~SU~~e~-~r-- 10
60 300 15mm
Fig. 3.16 Temperature and vapour pressure gradients
53
I I
11520 1500
1000
1 500 464

THERMAL INSULATION
3.9 Moisture transport through flat roofs
The special problem of flat roofs if the very high diffusion resistance of the waterproof membrane. If it is on the top of the thermal Insulation, interstitial condensation would be inevitable unless the appropriate structure of the thermal insulation is ventilated (through vents as in Fig.3.18 or along the parapet wall). A safe solution is the , double roof with ventilated air gap (Fig.3.17).
There is no vapour-diffusion related interstitial condensation If a continous high-resistance vapour barrier is located on the supporting structure and the thermal Insulation guarantees that the temperature in the plane of the vapour barrier will be above the dew point temeprature of the indoor air, even on the coldest days.
This solution alone would not be safe enough. There may be moisture in the thermal insulation from the very beginning (eg. rain during construction), or damage of the vapour barier cannot be ruled out. A small quantity of condensed (liquid) water between the vapour barrier and waterproof membrane may not be great problem in itself. However, at higher outdoor temperatures and intensive solar radiation the roof warms up, the water evaporates - and the specific volume of the vapour being about 500 times that of the liquid H20 , it expands. If there were no "exit", the pressure of this vapour would lift up the membrane, forming blisters which may also split. This is why the construction between the vapour barrier and the waterproof membrane should be depressurised (Fig.3.18).
~ I
~~~~~~~~~ I
Fig.3.18 Ventilated air gap under the thermal insulation and depressurisation air gap between the thermal insulation and the waterproof membrane, both connected to the atmosphere through vents or along the parapet wall.
Deperessurisation demands o relief vents to the atmosphere (vents on the roof or along the parapet) • horizontal flow paths to the vents (eg. a layer of gravel, of appropriate
texture for the downfacing surface of hard foam panels, etc.)
In the Inverted Root Membrane Assembly the waterproof membrane is placed directly on the load supporting structure. The extruded polystyrene thermal insulation is outside, on the top (Fig.3.19). This material is not vulnerable to moisture, the temperature at the plane of the membrane is over the dew point temperature of the indoor air (at least theoretically: it can happen that cold rain water flows down between the polystyrene slabs and cools the construction). This phenomenon can be prevented with the dual system where a further thermal insulation is between the supporting structure and the waterproof membrane.
54
Fig.3.17 Ventilated double roof
. '.
\M2~M1 mrrmmcrumns ~
Fig.3.19 The inverted roof : insulation on top of the membrane

. Ov ...... _-.. _._ ....... _ . .... _ ... _ Ot+tb
-·--Or
thickness Fig.4.1 Heat loss as a function of insulation
c 1 ; lrwesttnent.. inSUlation c,.: ln'Yestrl,ent. heating $ystcm Co: opor.ation c1; total co~ /
---·~ .
• • . . . ' • ..!!> ' ' . ~----A.... do d\
&~ Fig.4.2 ' Optimisation' of insulation thickness
cost
' ' ' ~ ......
• Fig.4.3 Comparison of the 'optima' of different materials
THERMAL INSULATION
Part4 ECONOMICS OF THERMAL INSULATION
(note that symbols and abbreviations used in this Part are not induded in the list given on p.4; are defined here and are valid only in this part)
'· . 4.1 Attenuation of heat losses in winter
The higher the surface to volume ratio, the more sensitive the building to added Insulation. It is another question, what the role of transmission losses is in the complete energy balance of the building.
At a given building geometry, transmission losses depend on the overall thermal insulation. Thermal Insulation con be improved theoretically without limitatiOn, however besides technological aspects the economics of this approach has to be considered. In Fig.4.1 fabric losses ore shown as function of fhe thickness of o given insulation material. The lowest curve (Q1) indicates fob~c losses. wn h a simple calculation of one-dimensional heat flow (for a given building) similar curves can be produced. The nexJ higher curve (Q1•t•l also includes the thermal bridge effects. The better the Insulation, the greater the relative importance of thermal brtdges.
The ventilation heat loss (Q.) is token as constant; independent of insulation. The top curve is the total heat loss. It con be seen that beyond a firnt the energy saving due to an added thickness of insulation is reducing. A classic example of lhe law of diminishing returns.
It can also be seen that, beyond a limit, ventilation losses prevail and represent the dominant component of the total losses. In this coso, implementation of a heat recovery system can be more effective than the further improvement of thermal Insulation. This limit strongly depends on the number and activity of occupants: In non-residential buildings the ventilation is usually more important than in dwellings .
4.2 The 'optimum• of the thermal insulation
The minimum ot thennal insulation is determined by fabric protection and thermal comfort requirements. Up to this Umit the necessity of thermal insulation cannot be disputed. Beyond this limit the further improvement is a question of energy balance, economy and pay-bock time.
In this context often on •opfimum thermal insulation' is referred t6. This optimum is usually presented as in Fig.4.2, where a series of curves ore presented as a function of the insulation thickness: • investment cost of insulation ( c0 • Investment cost of heating system ( c") • operating cost of healing for a given number of years (c.) • the total of the above costs (c,).
The thickness where the total cost has a local minimum is token as the •optimum'. As Insulation products ore normamy available in discreet thicknesses, usually on interval of 'optimum• thicknesses is marked. where the tot at cost shows limited variation only .
The methOd, illustrated in Fig.4.2 is an oversimplification, which con produce misleading results. II must be qualified by the following.
55

THERMAL INSULATION
First, here the thickness of only one Insulating material is analysed. Other materials, with other investment costs (including the cost of the material itself, that of the technology, the additional layers, such as a vapour barrier and surface finishing) have to be included in the analysis as well (Fig.4.3) .
Some curves In Fig.4.2. (namely: investment cost of insulation and total cost) have a singularity at zero insulation, marked With small c_ircles in Fig.4.4). This may represent a real option, possibly the "optimum", if the base wall itself (eg. thermal brick) met the minimal requirements. Otherwise only a thickness beyond that fulfilling the minimal requirements can be chosen.
Following the law of diminishing returns, the effect of the initial thickness of added insulation is dramatic, especially if the U-value of the base construction is high. Increasing the thickness, the effect of · further increments becomes less and less, as it was seen in Flg.4.1. This fact suggests, that the rational thickness Is quite small. However, the components of the investment cost must not be forgotten. The costs of the new surface finishing, a possible vapour barrier, scaffolding and labour change very little (if at all) beyond the very first small thickness of insulation. The cost of the insulation materialltse!f is only a fraction of the total Investment cost. Increasing the thickness, (up to a technological limit) Increases only the material cost, thus, the energy saving effect of the further added thickness should be compared with the Incremental· cost of the material only.
The investment cost of thermal Insulation is often represented by a stepped function, partly due to the discreet thicknesses of industrial products, partly because beyond a given thickness mechanical reinforcement, support or other measures may become necessary.
Similarly, the Investment cost of the heating system may also show singularities. In case of a central heating system it is likely that a small increment of thermal insulation allows a reduction of the surface area and cost of heat emitters, whilst the distribution network, pumps, control system and boiler remain unchanged. A further improvement of insulation may allow a reduction of boiler capacity, etc. (Fig.4.5).
It is evident that Improved thermal insulation should be applied in the most efficient way, but it requires a very keen and detailed analysis of numerous possible combinations, far beyond the simplified approach, illustrated by Flg.4.2.
4.3 Cost-benefit analysis
To put it simply: an investment (eg. in insulation) is worthwhile if the benefit (B) is greater than the cost (C), ie. if C < B If C is the capital (investment) cost of insulation and A is the resulting annual saving in heating costs and we are considering a period of y years, then the benefit will be B = A • y and the investment is warranted if C<A•y ... 4.1)
The limiting condition is when C = A • y, from which we get the simple pay-bock period as Y=C/A ie. the number of years when the savings will equal the capital cost.
56
ost
st
dop< =0
--------Ss d
Fig.4.4 Singularities of the total cost curve: the load bearing wall without insulation (c0 } may or may not have an optimum
cost
dopt
Fig.4.5 Singularities in the cost function may appear, due to change in installation method, boiler capacity, etc.

THERMAL INSULATION
However. the cost of money itself should be to~en Into account. If the money is borrowed. on interest must be paid. If the owner's money is used, II could earn some interest If Invested elsewhere. It is usual to corry out the above cost 1 benefit analysis in terms of the present worth of any future costs or benefits. The present worth (P) of o single sum (S) payable in the future. y years hence is
p _ _ s_ '·· ... 4.2) (1+i'f
where f is the annual rote of interest (or 'discount rate') expressed as a decimal traction. From this the present worth factor is
1 F,.--(1+i'f
thus. eq. 4.1 con be written as C < S • F1
The present worth of o regular annual sum (A) (eg. healing cost scJVings) over y years is
(,1_+..!.i 'f_-_1 P·A•-
i(1+i'f frorn which the second term Is the regular series present worfll factOt
Fo= (1+i'f-1 i(1+i'f
Thus the Investment criterion (eqA.l) becomes C < A• Fo
In on inflationary economic clfrnote the Inflation rote (f. expressed as a decimal fraction) must be token Into account in any Investment decision. fhus the present worth foetor wil hove to be adjusted:
F'- ~~~~~-(~:{r] Furthermore. if the inflation will cause the annual savings (the benefit) also to increase. a further adjustment is necessary:
F"- 1+/11-(l+f)'] . . 4.3) i-f 1+1
Besides the above cost analysis. o similar technique con be used tcJkrng into account (instead of the cost) the energy content (embodied energy) of building and insulation materials, that was used for production. fabrication and transport. as well as recycfing. In this case the mil'imum value of the resultant curve represents the minimum of the energy used for erection. operation and demolition of the building, ie. i1s tife cyc.le energy cost.
57

THERMAL INSULATION
5 REFERENCES
ASHRAE (1990): Handbook of Fundamentals Wave~y Press.
CEN pr EN Building Components, Building Elements Oe~nition and Cafwlalion of tho lntema/ and Extema/ Thermal Mass. -..
CEN pr EN Thermal Petformance of Buildings - Calculsdon of Energy Use for 'Headng -Residential Buildings.
CIBSE (1980): Guide, A 3: Thermal properties of building structures. The Ch~ered Institution of Building Services, London
CIEMAT (1988): propuesta para Is extension de Is norms Msica de edificacion de condiciones termicas de los edi~cios, Madrid
EURISOL (1980): U-vslues: cslculslion of thermal transmittance ... Association of British Manufacturers of Mineral Insulating Fibres
Gabor, L & Zold, A (1981): Energiagazdwkodas az epiteszetben (Building Energetics- in Hungarian) Akad~miai Kiad6, Budapest
Goulding, I R, Lewis, J Owen & Steamers, T C (eds) (1992): Energy in Alchitecture: the European Passive Solsr Handbook. Batsford, London
Goulding, I R, Lewis, J Owen & Steamers, T C (eds) (1992): Energy Conscious Design: A Primer for Alchitects Batstord, London
IHVE (1970): Guide, Book A. The lnsm. of Heating and Ventilating Engineers, London
Lechner, R (1990): Heating, Cooling, UghUng Design Methods. Wiley, New York
Ministry of Public Building and Works (1970): Condensation in dwellings. parts 1 & 2, HMSO, London
Regulamento des Garscteristicss de Componamento TBtmico dos Edificios Direccso Geral de Energla, Usboa, 1992.
Serra, R (1993): Les energies a /'srquitectura Edicions UPC, Barcelona
Szokolay, S V (1987 and 1995): Thermal design of buildings. RAJA Education Division, Canberra
Szokolay, S V (1992): Alchitecture and Climate Change. RAJA Education Division, Canberra
Szokolay, S V (1980): Environmental Sciencs Handbook. Wiley, New York
Yannas, S (1993): Heat loss Control and Passive Solar Heating. Ar 6. R. Hohmann- M. Setzer: Bauphysikalische Forrneln und Tabellen WemerVe~ag, Dusseldort
Zold, A (1993): Moisture balance and required sir change of flats in the Hungarian Standard. A TIC lntemational Conference, Brussels
Zold, A (1986): Optimum thermal Insulation or opOmum buUding. Proceedings of IABSELBCP Symposium, Thessaloniki
Zold, A: (1993): Estimation of thermaJ performance before the design of the building. Proceedings of the 3-rd European Conference on Architecture p. 367-371. Aorence
Zold, A (1990): (co-author and ed) Epiiletfizika (fluading Physics - in Hungarian) TIJ, Budapest
58
. .

data sheet 1 THERMAL PROPERllES OF BUILDING MATERIALS
conductivity denstty specific heat W/m.K kgtm• J,1<g.K
WALL MATERIALS adobe blocks ' · 1.250 2050 1000 brickwork, outer leaf 0.840 1700 800 brickwork, inner leaf 0.620 1700 800 concrete, cast, dense 1.400 2100 840
lightweight 0.380 1200 1000 concrete block, heavy 1.630 2300 1000
medium 0.510 1400 1000 light 0.190 600 1000
fibreboard (softboard) 0.060 300 1000 fibrous cement sheet 0.360 700 1050
decking 0.580 1500 1050 glass 1.100 2500 840 plasterboard 0.160 950 840 ply\'.'OOd 0.138 620 1300 stone: matble 2.000 2500 900
sandstone 1.300 2000 800 granite 2.300 2600 820
tile hanging 0.840 1900 800 limber, softwood 0.130 610 1420
hardwood 0.150 680 1200 wood chipboard SURFACING
0.120 660 1300
external rendori':Jl 0.600 1300 1000 plastering, ense 0.500 1300 1000
li htwei hi 0.160 600 1000 ROOF AND FLOgR MAllfERIALS asphalt or bib.Jmenous felt 0.500 1700 1000 concrete slab, dense 1.130 2000 1000 concrete slab, aerated 0.160 500 840 metal deck 50 7800 480 screed 0.410 1200 840 stone chippings 0.960 1800 1000 bles 0.840 1900 800 thatch e) 0.070 240 1420 timber d or wood blocks 0.140 640 1200 INSULAllNG MATERIALS cellulose fibre (fireproofed) 0.039 42
same 0.047 83 cork 0.038 144 1800 ee19rass (zostera marin1, 0.046 21 EP (exp.polystyrene sla ) 0.035 25 340 glass fibre Quilt 0.040 12 840
balls (slab) 0.035 25 880 mineral fibre slab 0.035 35 920
dense 0.044 150 920 perlite, loose fill 0.046 65 phenolic foam 0.040 30 1400 polyurethane board, new 0.016 24 450
aged 0.025 30 450 Slrawboard 0.037 250 1050
compressed, paper laced0.081 320 1450 UF (urea-formaldehyde)foam 0.040 10 1400 vermicuflte, exfoliated 0 .069 128 wood wool slab 0.100 500 1000 METALS aluminium 236 2700 877 copper 384 8900 380 iron 78 7900 437 lead 37 11300 126 steel (mild) 47 7800 480 stainless steel 24 7900 510
59

data sheet 2 THERMAL PROPERTIES OF SURFACES AND CAVITIES
RADIATION PROPERTIES for 6000' solar radiation at50'C abs.& emittance reflectance abs.& emitt.
brick. while, glazed light colours dark colours
roofs aspha~ or bitumen red tiles white tiles aluminium (oxidised)
paint white matt black
weathered surfaces: light medium
SURFACE RESISTANCES (m21<.M')
inside, walls ceiling, floor: heat ftow up
heat flow down ceiling, 45• heat flow up
heat flow down outside, walls, sheltered
normal exposure severe exposure
roofs sheltered normal exposure severe exposure
CAVITY RESISTANCES (m21<.M') mm
nonventilated
ventilated
normal
low emissivity
normal
low emissivity
1 5
10 20 50
1 5
10 20 50
1 5
10 20 50
1 5
10 20 50
0.25 0.75 0.40 0,60 0.80 0.20 0.90 0.10 0.65 0.35 0.40 0.60 0.20 0.80 0.30 0.70 0.96 0.04 0.50 0.50 0.80 0.20
normal surfaces
0.12 0.10 0.14 0.11 0.13 0.08 0.06 0.03 0.07 0.04 0.02
0.95 0.90 0.90 0.96 0.85 0.50 0.11 0.95 0.96 0.60 0.95
low emittance surfaces
0.30 0.22 0.55 0.23 0.38 0.11 0.07 0.03 0.09 0.05 0.02
DIRECTION OF HEAT FLOW: horizontal upward downward
0.035 0.035 O.Q35 0.11 0.11 0.11 0.15 0.13 0.15 0.17 0.14 0.20 0.17 0.14 0.21
O.Q7 0.07 0 .07 0.22 0.22 0.22 0.30 0.25 0.30 0.35 0.28 0.40 0.35 0.28 0.42
0.17 0.17 0.17 0.05 0.05 0.05 0.07 0.06 0.07 0.08 0.07 0.10 0.08 0.07 0.10
0.35 0.35 0.35 0.10 0.10 0.10 0.14 0.12 0.14 0.16 0.14 0.20 0.16 0.14 0.20
60

data sheet 3 THERMAL PROPERTIES OF BUILDING ELEMENTS :WALLS
note: EPS • expanded polystyrene slab U- admit- time- deere-value tance lag ment
W/m'K W/m'K hours factor
brick, single skin 105.mm 3.28 4 .2 2.6 0.87 220mm 2.26 4 .7 6 .1 0.54 335mm 1.73 4 .7 9 .4 0.29
brick, single skin 1 OS mm plastered 3.02 4.1 3.0 0.83 220 mm plastered 2.14 4.5 6 .5 0.49 335 mm plastered 1.79 4 .5 9 .9 0.26
brick, cavity 270 mm plastered 1.47 4 .4 7.7 0.44 - same with 25 mm EPS in cavity 0.72 4.6 8.9 0.34 - same with 40 mm EPS in cavity 0.55 4 .7 9.1 0.32 - same with 50 mm EPS in cavity 0.47 4.7 9.2 0.31
concr.block, solid, 200 mm plasterboard 1.83 2.5 6.8 0.35 - same but foil-backed plasterboard 1.40 1.82 7.0 0.32 - same + 25 mm EPS (no cavity) 0.93 1.2 7.2 0.30 -same but 25 cav.+25 EPS +plasterboard 0.70 1.0 7.3 0.29 -same but lightweight concrete 0.68 1.8 7.4 0.46 - same but foil-backed plasterboard 0.61 1.5 7 .7 0.42 - same + 25 mm EPS (no cavity) 0.50 1.1 8.2 0.36 -same but 25 cav.+25 EPS +plasterboard 0.46 1.0 8.3 0.34 concr.blck, hollow 100 mm inside plastered 2.50 3.8 2.4 0.89
200 mm inside plastered 2.42 4.1 3.0 0 .83
concrete,dense,cast,150 mm 3.48 5.3 4.0 0.70 - same + 50 mm woodwool slab plastered 1.23 1.7 6.0 0.50 - same but lightweight plaster 1.15 1.7 6.3 0.49 concrete,dense,cast,200 mm 3.10 5.5 5.4 0.56 -same+ 50 mm woodwool slab plastered 1.18 2.2 7.7 0.36 - same but lightweight plaster 1.11 1.7 7.6 0.35
concr.precast panel, 75 mm 4.28 4.9 1.9 0.91 -same+ 25 cav.+ 25 EPS +plasterboard 0.84 1.0 3.0 0.82 concr.precast,75+25 EPS+150LIW concr. 0.58 2.3 8.7 0 .41 - same but 50 mm EPS 0.41 2.4 9.2 0.35
brick veneer, 1 OS mm+cavity+plasterboard 1.77 2.2 3.5 0.77 - same but foil-backed plasterboard 1.36 1.7 3.7 0.75 - same with 25 mm EPS or glass fibre 0.78 1.1 4.1 0.71 • same with SO mm EPS or glass fibre 0.50 0.9 4.3 0.69 - same, 25 EPS + foil-back plasterboard 0.69 1.0 4.1 0.71
block veneer, 100 mm, cav. plasterboard 1.57 2.1 4.1 0.72 - same but foil-backed plasterboard 1.24 1.7 4.3 0.69 - same with 25 mm EPS or glass fibre 0 .74 1.1 4.7 0.65 - same with so mm EPS or glass fibre 0.48 0.9 4.9 0.62 -same, 25 EPS + foil-back plasterboard 0.66 1.0 4 .7 0.64
framed, single fibro or galv.iron 5.16 5.2 0 1 - same + cav. + plasterboard 2.20 2.2 0.3 1 - same + 25 mm EPS or glass fibre 0.86 1.1 0.5 0.99 - same + so mm EPS or glass fibre 0.53 0.9 0.7 0.99
framed, 20 mm timber boarding 3.00 3.0 0.4 1 - same + cavity + plasterboard 1.68 1.8 0.8 0.99 - same + 25 mm EPS or glass fibre 0.76 1.0 1.0 0.99 • same + SO mm EPS or glass fibre 0.49 0.9 1.2 0.98 framed,tile-hang+paper+cav+SO EPS+plb'd 0.54 0.78 1.0 0.99 • same but 100 EPS or glass fibre 0.32 0.71 1.0 0.99
61

dalasheet 4 U- VALUES OF WINDOWS W/m'K
sheltered normal exposed
WINDOWS: SINGLE GLAZE'D
wood frame 10% clear glass 4.7 5.3 6.3 20% 4.5 ' ·. 5.0 5.9 30% 4.2 4.7 5.5
metal frame 10% clear glass 5.3 6.0 7.1 20% 5.6 6.4 7.5 30% 5.9 6.7 7.9
discontinuous 10% clear glass 5.1 5.7 6.7 20% 5.2 5.6 6.6 30% 5.2 5.6 6.6
wood frame 10% low-e glass 3.9 4.6 5.7 20% 3.7 4.3 5.3 30% 3.5 4.0 4.9
metal frame 10% low-e glass 4.4 5.2 6.4 20% 4.6 5.5 6 .7 30% 4.9 5.8 7.1
discontinuous 10% low-e glass 4.2 4.9 6.0 20% 4.3 5.0 6 .1 30% 4.3 5.1 6 .2
WINDOWS: DOUBLE GLAZED (6 mm space)
wood frame 10% clear glass 2.6 3.0 3.2 20% 2.7 2.9 3.2 30% 2.7 2.9 3.1
metal frame 10% clear glass 3.3 3.6 4.1 20% 3.9 4.3 4.8 30% 4.4 4.9 5.6
discuntinuous 10% clear glass 3.1 3.3 3.7 20% 3.4 3.7 4.0 30% 3.7 4.0 4.4
wood frame 10% low-e glass 2.2 2.5 2.7 20% 2.1 2.4 2.7 30% 2.1 2.4 2.6
metal frame 10% low-e glass 2.6 2.9 3.5 20% 3.0 3.5 4.1 30% 3.3 3.9 4.5
discontinuous 10% low-e glass 2.4 2.7 3.2 20% 2.6 3.0 3.4 30% 2.8 3.3 3.8
ROOF LIGHTS (excluding frame)
single clear glass 5.7 6.6 7.9 double clear glass (6 mm space) 3.0 3.5 4.1 double ' low-e glass (6 mm space) 2.8 3.1 3.4
plastic dome single 5.8 6.5 6.8 plastic dome double 3.2 4.0 4 .2 horiz.laylighl + skylight or lantern over
ventilated 3.5 3.8 4.2 non-ventilated 2.6 3.0 3.3
Note: "sheltered": lowest 3 floors in ceo areas 'normal' most suburban buildings. floors 4-8 in ceo (taken as 3 m/s} 'exposed': coastal or hilnop sites, above fl.5 in suburban areas. above fl.9 in
ceo areas (city centres} 'low~e' coating is taken as having an emittance of 0.4 %-values indicate frame projected area as fraction of overall window area
62

datasheet 5 U-values OF BUILDING ELEMENTS : ROOFS and EXPOSED FLOORS
note: EPS = expanded polystyrene slab fc = fibrous cement
U- admit-value tance
VNI = wood wool slab Wtm•K W/m2K
FLAT ROOFS 150 c.slab,plaster 75 screed+asphalt 1.8 4 .5 - same but lightweight concrete 0.84 2.3 25 timber deck, bit.felt, plasterboard ceiling 1.81 1.9 - same + 50 mm EPS 0.51 0.8 10 fc.deck,asph.13 fibreb'd,cav,fc.ceiling 1.5 1.9 50 ww.13 scrd.20 asph. cav, pl.b'd ceiling 1.0 1.4 13 fibreb'd,20 asph. cavity,10 foil-back plbd 1.2 1.3 metal deck, bit.felt, 25 mm EPS 1.1 1.2 - same + 13 fibreb'd + plasterboard ceiling 0.73 0.91 - same but 50 mm EPS 0.48 0.75
PITCHED ROOFS parallel sloping ceiling corrugated fibrous cement sheet 4.9 4.9 -same+ cavity+ plasterboard ceiling 2.58 2.6 - same + 50 mm EPS or glass fibre 0.55 1.0 tiles,sarking + cavity + plasterboard ceiling 2.59 2.6 -same + 50 mm EPS or glass fibre 0.54 1.0 tiles,sarking,25mm timber ceiling 1.91 2.1 - same + 50 mm EPS or glass fibre 0.51 1.5 metal sheet (corrougated or profiled) 7.14 7.1 metal sheet + cavity + plasterboard ceiling 2.54 2.6 - same + 50 mm EPS or glass fibre 0.55 1.0
PITCHED ROOFS, horizontal ceiling 10° metal sheet, attic, 10 mm plasterboard 2.69 2.71
same + 50 mm EPS on ceiling 0.56 0.80 30° metal sheet, attic, 1 0 mm plasterboard 2.72 2.74
same + 50 mm EPS on ceiling 0.56 0.80 same but 1 00 mm EPS on ceiling 0.31 0.71 tiles, sarking, attic 10 mm plasterboard 2.48 2.62 same + 50 mm EPS on ceiling 0.55 0.80
40° tiles, sarking, attic 10 mm plasterboard 2.52 2.64 same + 50 mm EPS on ceiling 0.55 0.80 same but 1 00 mm EPS 0.31 0.71
FLOORS, EXPOSED 150 mm r.c.slab + 25 mm screed 2.96 4.77 - same + carpet & underlay 1.19 1.46 - same + also 50 mm woodwool under slab 0.75 1.48 150 mm lighweight conc.slab+25 mm screed 1.60 3.85 200 mm lighweight conc.slab+25 mm screed 1.32 3.89 25 mm T&G boarding, no finish 3.30 3.32 - same + carpet & underlay 1.81 1.82 - same + also 50 mm mineral fibre insulation 0.50 0.99 25 mm particleboard + lino or vinyl 2.47 2.58 -same+ 50 min.fibre ins.+ carpet & underlay0.48 1.07
FLOORS OVER VENTILATED SPACE 25 mm T&G boarding +lino or vinyl6 x 4 m 1.13 3.92 -same 6x6 m 0.99 3.92 - same 10x6 m 0.88 3.92 -same 10 x 10m 0.72 3.92 - same 20 x 10m 0.62 3.92 150 mm r.c.slab + carpet 6x4m 0.93 3.16• -same 6x6 m 0.82 3.16 -same 10 x6 m 0.74 3.16 -same 10 x 10m 0.61 3.16 -same 20 x 10m 0.52 3.16
63
timelag
hours
8 5 0.9 1.3 2.0 3.0 1 1 1 1
0 0.3 0.7 0.5 1.5 1 1.4 0 0.3 0.7
0.22 0.48 0.22 0.48 0.90 0.39 0.66 0.39 0.66 1.08
4.75 5.82 8.08 5.92 7.99 0.32 0.46 1.69 0.63 2.05
0.29 0.29 0.29 0.29 0.29 2.90 2.90 2.90 2.90 2.90
decrement
factor
0.33 0.77 0.99 0.98 0.96 0.93 0.99 0.99 0.99 0.98
1 1 0.99 1 0.97 0.99 0.97 1 1 0.99
1.00 1.00 1.00 1.00 0.99 1.00 1.00 1.00 1.00 0.99
0.61 0.45 0.14 0.59 0.42 1.00 1.00 0.93 0.99 0.90
1.00 1.00 1.00 1.00 1.00 1.00 1.00 1.00 1.00 1.00

data sheet 6 THERMAL PROPERllES OF BUILDING ELEMENTS : FLOORS
Ground floor losses Linear heat transmission coefficients : W /mK
height [h) if floor thermal resistance is relative to [m2K/W] ground level (m) noinsul. 0.2-0.35 0.4-0.55 0.6-0. 75 0.8-1.0 1.05-1.5 1.55-2 2.05-3
>16.01 0 0 0 0 0 0 0 0 -6.00 to -4.05 0.20 0.20 0.15 0.15 0.15 0.15 0.15 0.15 -4.00 to -2.55 0.40 0.40 0.35 0.35 0.35 0.35 0.30 0.30 -2.50 to -1.85 0.60 0.55 0.55 0.50 0.50 0.45 0.45 0.40
-1 .80 to -0.25 0.80 0.70 0.70 0.65 0.60 0.60 0.55 0.45 -1.20 to -0.75 1.00 0.90 0.85 0.80 0.75 0.70 0.65 0.55 -0.70 to -0.45 1.20 1.05 1.00 0.95 0.90 0.80 0.75 0.65 -0.40 to -0.25 1.40 1.20 1.10 1.05 1.00 0.90 0.80 0.70
-0.20 to +0.20 1.75 1.45 1.35 1.25 1.15 1.05 0.95 0.85 +0.25 to +0.40 2.10 1.70 1.55 1.45 1.30 1.20 1.05 0.95 +0.45 to + 1.00 2.35 1.90 1.70 1.55 1.45 1.30 1.15 1.00 + 1 .05 to + 1 .50 2.55 2.05 1.85 1.70 1.55 1.40 1.25 1.10
Losses through earth sheltered walls r---Linear heat transmission coefficients : W /mK
height [h) if U- value of wall itself is below (W/m2K] ground level (m) 0.4-0.49 0.5-0.6 0.65-0.79 0.8-0.99 1-1.19 12-1.49 1.5- 1.79 1.8-22
>6.0 1.40 1.65 1.85 2.05 2.25 2.45 2.65 2.80 6.00 to 5.05 1.30 1.50 1.70 1.90 2.05 2.25 2.45 2.65 5.00 to 4.05 1 '15 1.35 1.50 1.65 1.90 2.05 2.24 2.45 4.00 to 3.05 1.00 1.15 1.30 1.45 1.65 1.85 2.00 2.20
3.00 to 2.55 0.85 1.00 1.15 1.30 1.45 1.65 1.80 2.00 2.50 to 2.05 0.70 0.85 1.00 1.15 1.30 1.45 1.65 1.80 2.00 to 1.55 0.60 0.70 0.85 . 1.00 1.10 1.25 1.40 1.55 1.50 to 1.05 0.45 0.55 0.65 0.75 0.90 1.00 1.15 1.30
1.00 to 0.75 0.35 0.40 0.50 0.60 0.65 0.80 0.90 1.05 0.70 to 0.45 0.20 0.30 0.35 0.40 0.50 0.55 0.65 0.75 0.40 to 0.25 0.10 0.15 0.20 0.25 0.30 0.35 0.40 0.45
64

MOISTURE MOVEMENT DATA
INDOOR MOISTURE PRODUCTION one person
cooking (gas)
dishwashing
floor moppinQ clothes wash~ng clothes drying shower bath
at rest sedentary active breakfast · lunch dinner breakfast luch dinner
40gJh SOQ!h
200 gJh 400g 500g
1200g 100g 100g 300g
1100g 2000g
12 OOOg 200g 100g
PERMEABIUTY OF SOME MATERIALS
brickwork 0.006- 0.042 cement render 0.010 concrete 0.005- 0.035 cork board 0.003- 0.004 expanded ebon~e (Onozote) < 0.0001 expanded polystyrene 0.002 - 0.007 fibreboard (soflboard) 0.020- 0.070 hardboard 0.001- 0.002 mineral wool 0.168 plastering 0.017- 0.025 plasterboard 0.017- 0.023 plywood 0.002- 0.007 polyurethane foam closed cell 0.001
open cell 0.035 strawboard 0.014 - 0.022 timber air dry 0.014- 0.022
wet 0.001- 0.008 wood wool slab 0.024- 0.070
PERMEANCE OF SOME ELEMENTS
aluminium foil < 0.006 bitumenous paper 0.09 brickwork 105mm 0.04- 0.06 concrete blocks 200mmhollow 0.14 cement render or screed, 25 mm 4:1 0.67
1 :1 0.40 corkboard 25mm 0.40- 0.54 paint, 2 coats, oil on plaster 0.09- 0.17 paint, 3 coats, oil, on wood 0.02- 0.06 plaster on lath 25mm 0.63
20mm 0.83 12mm 0.93
plasterboard 10mm 1.7- 2.80 plywood, 6 mm external qual. 0.026- 0.041
internal qual. 0.106- 0.370 polyethylene film 0.06 mm 0.004 softwood (pine) 25mm 0.08
12mm 0.10- 0.17 sltawboard 50mm 0.13- 0.26 wood wool slab 25mm 3.08 - 4.14
datasheet 7
} = 3000 g/day
mg/s.m.kPa
mg/s.m"kPa
[any layer of less than 0.067 mg/s.m"kPa permeance is a vapour barrier)
65

THERMAL INSULATION
Index
added Insulation admittance cavlly resistance condensation
capillary Interstitial
conductance conductivity costs Doll on's law diffusion decrement factor energy use (in buldngs) enthalpy envelope conductance heat now rate
multidimensional heotloss coefficient overau
linear heat storoge capaCity heal transfer
radiant humidity, absolute
relative Insulation, cavity
external lntemal materialS reflective lronsparenl
latent heat moisture tronspon p-I (pressu:e-temper.) dlogrom pe~Odic heat flow permeability permeance pores. porostty present worth psychrometric chart radiation coefficient reslslance roslslance ratio solectlve surfaces sensible heat shape factor specific heat capacity Slob- on-ground flool SOI-olr temperature surface conductance
resistance temperature
Stofan-80ltzmann constant temperature gradient
dew-pain! wet bulb
lhormal bridges points
lime constant lag
transmittance U- value vapour barrier
pressure waterproofing wavelenglh
18-26 41 7-8. 24. 60 44,46 46-47 46,48-53 7-8 6. 11-17,29-30, 59 55-57 43 43, 47-48 10, 41.61 5, 28 44-45 10 6 31-36 10.35 32. 33, 36, 64 42 6,27 36-38 43 43.45-47 7, 8. 24 20,22-23 24 8.9 8 18 44 43,46-47, 54 44 7. 41-42 48 48 9 57 45-47 38-39 7.11-17.27 12.14, 30 23.37,39 44 38 6, 40, 59 17. 21 39 7- 8 7-8, 60 12 38 11-12.14-15.30 46 44 19.31-36 34-35 42 10, 41 , 61 11 8, 11-17, 61-63 21,50 43,48-53 22 37
66