Embed Size (px)
Citation preview
Research ArticleThermal Stabilization of Polyoxymethylene by PEG-Functionalized Hydroxyapatite: Examining the Effects of Reduced Formaldehyde Release and Enhanced Bioactivity
Klaudia Król-Morkisz,1 Ewelina Karaś,1 Tomasz M. Majka,2 Krzysztof Pielichowski ,2 and Kinga Pielichowska 1
1AGH University of Science and Technology, Faculty of Materials Science and Ceramics, Department of Biomaterials and Composites, Al. Adama Mickiewicza 30, 30-059 Kraków, Poland
2Cracow University of Technology, Department of Chemistry and Technology of Polymers, Ul. Warszawska 24, 31-155 Kraków, Poland
Correspondence should be addressed to Kinga Pielichowska; [email protected]
Received 2 July 2019; Accepted 30 August 2019; Published 19 December 2019
Academic Editor: Leonard D. Tijing
Copyright © 2019 Klaudia Król-Morkisz et al. �is is an open access article distributed under the Creative Commons Attribution License, which permits unrestricted use, distribution, and reproduction in any medium, provided the original work is properly cited.
Nanostructured hydroxyapatite (HA) functionalized with poly(ethylene glycol) (HA-g-PEG) of di�erent molar mass was used as a thermal stabilizer to prepare polyoxymethylene (POM) composites by a melt processing method. �e chemical and crystalline structure of (HA-g-PEG) and POM/HA-g-PEG composites was investigated by means of FTIR and XRD. �e thermal properties, degree of crystallinity, and melting behaviour of POM-based composites were analysed with TG, DSC, and TOPEM DSC methods. �e tensile strength, Young’s modulus, toughness, and wettability of POM were investigated as well. A preliminary assessment of bioactivity, in vitro chemical stability, and formaldehyde release from POM/HA-g-PEG composites by Schi� ’s test was also performed. An SEM/EDX method was used to observe the morphology of POM/HA-g-PEG composites. �e results indicate that the addition of 1% HA-g-PEG slightly increases the melting temperature and degree of crystallinity. In small amounts, HA-g-PEG particles probably act as nucleating agents for the POM crystallization process. Incorporation of 5% HA-g-PEG to POM caused a decrease in the crystallinity of the polymer matrix, as a result, some mechanical properties of POM/HA-g-PEG composites also decreased. �e thermal stability of POM/HA-g-PEG composites improved signi�cantly from 309°C for unmodi�ed POM to 342°C for POM/10.0% HA-g-PEG 600. �e most e�ective thermal stabilizer was synthesized with the lowest mass-average molar mass PEG. �e in vitro bioactivity test con�rmed that, as the average molar mass of PEG in HA-g-PEG hybrids increased, POM-based composites indicated higher bioactivity. �e in vitro chemical stability analysis results showed that both the POM matrix and the HA-g-PEG additive remain stable during the whole incubation time. Importantly, a¥er seven days of dynamic incubation, no formaldehyde was detected in all �ltrates, which is crucial in biomedical applications, among others.
1. Introduction
Polyoxymethylene (POM), also known as acetal resin or poly-formaldehyde, is an engineering polymer with a vast spectrum of applications that require high tensile strength and hardness, low coe§cient of friction, and excellent dimensional stability [1, 2]. It has been used in di�erent areas, including the auto-motive and mechanical industries, electronics, consumer goods, home appliances, and also in medical technology as a surgical implant material and in medical devices and drug
delivery systems [3]. POM’s molecular structure consists of a repeating carbon-oxygen linkage [-CH2-O-]n [4]. Acetal that exclusively contains the carbon-oxygen (C-O) bonds in the backbone chain is called a POM homopolymer in contrast to a POM copolymer where some comonomer units (CH2-CH2-O) occur in the main chain [5]. POM copolymer has increased thermal and chemical stability, but a lower degree of crystallinity due to the C-C bond presence. �erefore, its mechanical strengths, hardness, rigidity, and melting tem-perature are slightly lower than for POM homopolymer [6, 7].
HindawiAdvances in Polymer TechnologyVolume 2019, Article ID 9728637, 17 pageshttps://doi.org/10.1155/2019/9728637

Advances in Polymer Technology2
POM homopolymer is based on the polymerization of 1,3,5-trioxane, whereas POM copolymer is manufactured by the copolymerization of 1,3,5-trioxane with cyclic ethers e.g., 1,3-dioxolane or ethylene oxide [8]. POM can be processed using all methods applicable to thermoplastics, such as extru-sion, injection-moulding, and blow-moulding [9].
Despite very good mechanical and tribological properties [10, 11], POM exhibits poor thermal stability due to fast, unstoppable thermal depolymerisation reactions [12, 13]. A certain amount of formaldehyde can be released from the over-heated material [6, 14]. As a result, its range of applications, in particular those in contact with living tissue, is strongly lim-ited. To increase the thermal stability of POM di�erent meth-ods can be used. �e stability of POM can be improved by copolymerisation to obtain C-C linkages at the expense of partial mechanical strength loss. Another method is capping the end groups of POM chains by esteri�cation or etheri�ca-tion. Antioxidants, formaldehyde scavengers, and other ther-mal stabilizers can also be added to the POM [15, 16].
Some attempts towards POM thermal stability enhance-ment have been described in the literature. For example, Hu et al. [17] studied the in¬uence of polyamide (PA) and mel-amine (MA) complexes on the thermal stabilization of POM copolymer. �ey found that the complex stabilizer PA/MA is more e§cient than the use of these formaldehyde scaven-gers separately. �e thermal stability of POM was about 274.8°C (�5%) with PA/MA in the ratio of 0.4/0.04 wt.%. Wacharawichanant et al. [18] investigated the e�ect of zinc oxide (1–8 wt.%) on the thermal properties of POM. �ey observed a signi�cant increase in the thermal stability of POM, as much as 20°C (�5% = 320.0°C for 6 wt.% ZnO). Zhao et al. [19] manufactured a new kind of POM copolymer, based on trioxane and styrene oxide or dioxolane, with improved thermal stability. �ey found that 0.6 mol% styrene oxide comonomer can substantially improve the thermosta-bility of POM (�5% = 191.74°C). However, the styrene oxide presence in the POM structure results in a decrease of crys-tallinity. Consequently, the mechanical strength of the new POM copolymer was also impaired.
Improvement of POM thermal stability was also observed by Meri et al. [20] in POM nanocomposites containing ethyl-ene octene copolymer (EOC) and plasma synthesized tetrapod shaped zinc oxide (ZnO).
POM has been widely used in di�erent long-term ortho-paedic applications like hip and knee prostheses [21]. To improve biocompatibility and bioactivity of POM-based implants POM/HA nanocomposites have been investigated in our previous works [22] because hydroxyapatite ([Ca10(PO4)6(OH)2] (HA)) is a bioceramics which is chemically similar to human inorganic hard tissue [23] and can be easily modi�ed by functionalization [24, 25]. However, the main prob-lem of POM/HA nanocomposites was the degradation of POM matrix in the presence of HAp during melt processing. To improve POM thermal stability and to enable incorporation of larger amounts of HA, we decided to modify HA by the gra¥ing process of PEG on its surface using diisocyanate as a coupling agent. Using such modi�cation hydroxyl groups on HA surface have been replaced by urethane groups linked to PEG, and cat-alytic activity of hydroxyl groups on POM decomposition
process has been reduced [26]. Using such modi�cation it is possible to incorporate higher amounts of HA to POM matrix making them more bioactive than unmodi�ed POM, that is highly desired for long-term bone implants.
In our previous study (Pielichowska et al. [25]) we used chemically modi�ed hydroxyapatite (HA) as a thermal stabi-lizer for POM copolymer. HA was functionalized with poly (ethylene glycol) (PEG) with a molar mass of 2000 and 1, 6-hexamethylene diisocyanate (HDI) as a coupling agent in an HA : HDI : PEG molar ratio of 2 : 2 : 1 and incorporated into the POM matrix by the extrusion method. �e thermal sta-bility of POM was increased by 19°C (�5% = 347°C–1 wt.% HA-g-PEG 2000) and 32°C (�5% = 360°C–5 wt.% HA-g-PEG 2000). Now we investigate the in¬uence of the molar mass of PEG (600, 2000, and 6000) under the HA : HDI : PEG molar ratio of 1 : 2 : 1 on the e�ectiveness of HA-g-PEG hybrids as thermal stabilizers for POM copolymer and on the other properties of composites, especially those related to further biomedical applications.
2. Experimental
2.1. Materials. POM copolymer Ultraform® (MFR2.6 g/10 min), average molar masses �� = 8269 and �� = 78565 (��/�� = 8.96), was produced by BASF (Germany). HA (Ca10(PO4)6(OH)2) nanopowder (nanoparticle size below 100 nm—99% of particles Ca/P ratio 1.67) was manufactured by nGimat Co. (USA). 1, 6-hexamethylene diisocyanate (HDI), poly (ethylene glycol) (PEG) with a mass-average molar mass of 600, 2000, 6000, and dibutyltin dilaurate (DBTDL) were products of Sigma Aldrich. Anhydrous N, N-dimethyleformamide (DMF) and ethanol were purchased from Avantor (Poland). PEG was dried under vacuum at 90°C for 24 hours before use and HA was dried at 110°C for 24 h.
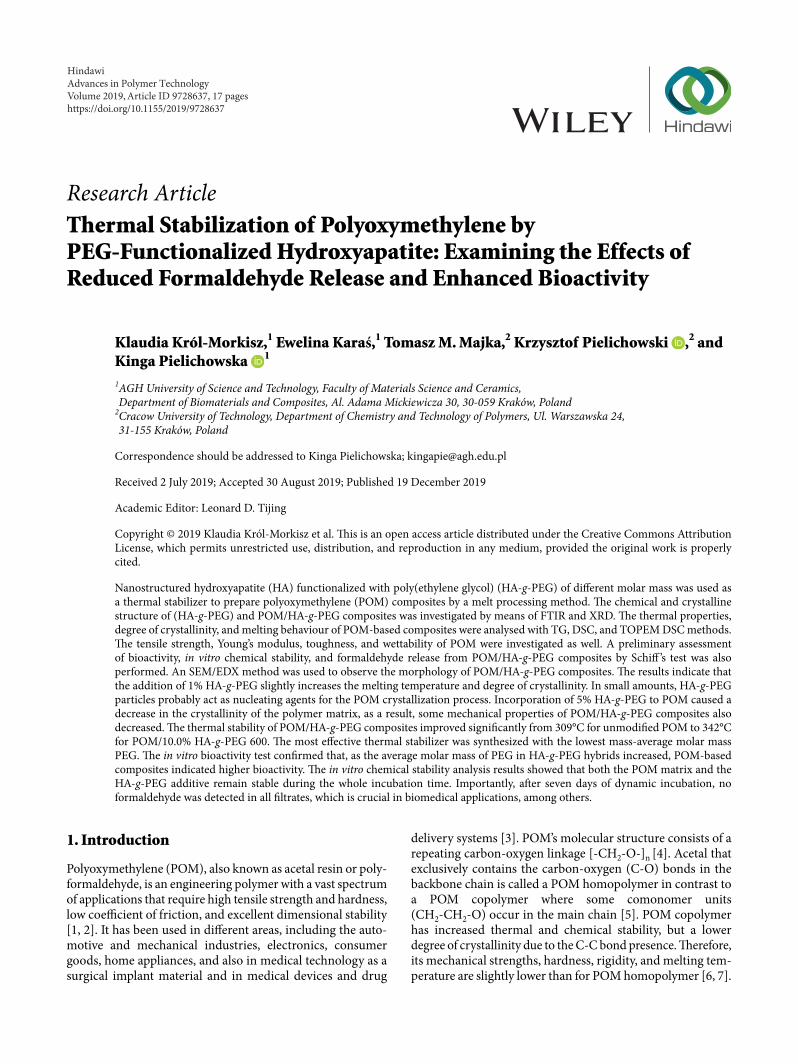
2.2. Gra�ing Process of HA-g-PEG and Processing of POM/HA-g-PEG Composites. �e gra¥ing process via a two-step addition reaction, and processing of POM with HA-g-PEG additive through twin-screw extrusion/injection moulding, were performed according to the procedure described in ref. [25] and as it is presented in Figure 1. Molar ratio of substrates HA : HDI : PEG was 1 : 2 : 1 (Table 1) to keep the balance between the inorganic HA �ller and the biocompatible PEG component. Samples containing 0, 0.5, 1.0, 2.5, 5, and 10.0% w/w of HA-g-PEG (calculated in relation to pristine HA) have been obtained in dumbbell shape.
2.3. Techniques. Fourier transform infrared (FTIR) spectra of POM/HA-g-PEG composites and HA-g-PEG powders were taken using an HATR PIKE attachment with diamond crystal and in KBr pellets, respectively, and a Bruker Vertex 70 V FTIR spectrometer. All measurements were performed in the range of 4000–400 cm−1 with 2 cm−1 resolution at room temperature.
Wide angle X-ray di�raction (WAXD) experiments were performed at room temperature using a Philips X’Pert Pro MD di�ractometer with monochromatic CuKα1 radiation monochromatized by Ge (111) monochromator. Data were collected in Bragg–Brentano geometry with a 2θ scanning
3Advances in Polymer Technology
range from 15–60° and 0.008° step size. �e degree of crystal-linity [��] for HA and HA-g-PEG systems were calculated using the equation:
where: �� [%] is the degree of crystallinity of HA, �300 is the intensity of (300) di�raction peak, and �112/300 is the intensity of the hollow between (112) and (300) di�raction peaks of HA [27]. �e crystal size of HA and HA-g-PEG systems was cal-culated using a Debye–Scherrer equation:
where: � [nm] is the particle size, � is the broadening constant (� = 0.9), � is the wavelength of CuKα radiation (� = 0.15406 nm), � is the peak width at half height, � repre-sents the peak position. �e crystallite size was measured for the (002) re¬ection peak because this Miller index corre-sponds to the �-axis length [28].
DSC curves were recorded using a DSC1 (Mettler-Toledo) operating in dynamic mode. DSC measurements were per-formed in accordance with ISO 11357-3:2009. �e samples (~5 mg each) were placed in 40 �l pierced aluminium pans.
(1)�� =�300 − �112/300�300
,
(2)� = � ⋅ �� ⋅ cos(�) ,
An empty pan was used as a reference. A heating/cooling rate of 10 K/min and a nitrogen atmosphere (¬ow of 30 ml/min) were applied. �e degree of crystallinity (��) of each sample, calculated in relation to pure POM, was determined using Equation (3):
where: �� is the heat of fusion determined from the DSC curves, �0� is the heat of fusion of 100% crystalline POM (�0� = 326.3 J/g) [29] and � is the weight fraction of HA-g-PEG in the POM composites.
�e temperature-modulated di�erential scanning calorim-etry with stochastic temperature modulations (TOPEM-DSC, Metler-Toledo) was also applied. �e conditions for TOPEM measurements were: 1 K amplitude, 15–30 s switching time, and 2 K/min underlying heating rate.
TG measurements were carried out on a Netzsch STA 449 Jupiter thermogravimetric analyser at a 10 K/min heating rate in a nitrogen atmosphere (50 ml/min N2 gas ¬ow rate). �e temperature range was 25–600°C. �e samples (ca. 8 mg) were placed in Al2O3 crucibles. From the TG curves, the tempera-tures of 3, 5, 10, 20, and 50% mass loss were determined (��%—where � is percent of mass loss).
�e tensile tests were performed on a Zwick-Roell univer-sal testing machine with a 50 mm/min crosshead speed (according to ISO 527) at room temperature. Injection mould-ing technique was applied to shape the samples for tensile testing according to ISO 3167 standard. �ree samples in the shape of a dumbbell (1.97 mm ± 0.02 mm in thickness and 4.85 mm ± 0.05 mm in width) were tested for each composite composition. Values of Young’s modulus (�) and ultimate ten-sile strength (��) were taken from stress-strain pro�les. On
(3)�� =���
(1 − w) × Δ�0�× 100%,
Gra�ing process
Composites processing
Hydroxyapatite nanopowder (HAp)
Diisocyanate solution in DMF
DBTL
I stage: 80°C/2h
II stage: 60°C/1.5h
III stage: (1) Centrifuging (2) Washing in ethanol/×3 (3) Drying (4) Pounding
OCN-HAp-NCO
PEG solution in DMF
HAp-g-PEG solutionin DMF
HAp-g-PEG powder
Polyoxymethylene (POM)
granulate
HAp-g-PEG powder
POM/HAp-g-PEG �lament (cutting)
POM/HAp-g-PEG composites
Extrusio
n
210°C/50 rpm
Injection moulding 210°C
Figure 1: Preparation of POM/HA-g-PEG composites.
Table 1: Composition of HA-g-PEG systems.
Sample HA [g]/DMF [ml]
HDI [ml]/DMF [ml]
PEG [g]/DMF [ml]
HA-g-PEG 600 9.0/90 6/12 10.8/11HA-g-PEG 2000 9.0/90 6/12 36.0/36HA-g-PEG 6000 9.0/90 6/12 108.0/108
Advances in Polymer Technology4
the basis of the area under the stress–strain curve, in accord-ance with Equation (4), the toughness, as the amount of energy that was absorbed per unit volume (energy density) of material until break, was calculated.
where: � is the energy density, �� is the strain at fracture, � is strain, and � is stress.
�e water contact angles of sample surfaces were measured on a DSA 10MK2 (Kruss, Germany) contact angle goniometer by the sessile drop method at ambient temperature. 0.2 μl ultra-high quality (UHQ) deionized water droplets were put on the sample surface. Ten data points were collected at ten di�erent positions on the sample surface and the average val-ues were calculated.
�e microstructure of the composites was observed using a FEI Nova Nano SEM 200 scanning electron microscope (SEM) equipped with energy dispersive X-ray (EDX) analyser (EDAX Company) at 5 kV electron beam energy. All samples were coated with a carbon layer just before the measurement.
POM/HA-g-PEG composites were soaked in a 1.5x con-centrated simulated body ¬uid (SBF) at 37°C for 21 days; the sample mass to SBF volume ratio was 1 : 10. �e SBF solution was changed every 3 days. �en, the samples were removed from the SBF, so¥ly rinsed with distilled water, and dried. A¥er SBF incubation, the sample surface was examined by SEM-EDX.
Unmodi�ed POM and POM/HA-g-PEG 600 specimens were incubated at 37°C according to EN ISO 10993:13 for 12 weeks in Ringer ¬uid (RF) and phosphate-bu�ered saline (PBS) solutions. �e pH, conductivity, and mass changes were assessed during the incubation.
Schi� ’s reagent was applied to detect formaldehyde release from POM/HA-g-PEG 600 composites during the incubation in distilled water at 37°C for 4 weeks. �e sample mass to water volume ratio was 1 : 10. �e water was changed every 24 h and
(4)� = ∫��0 � ⋅ ��,
Schi� ’s test was performed a¥er 1, 21, and 28 days. During Schi� ’s test, the water was decanted into test tubes, 3 drops of Schi� ’s reagent were added to every test tube and the solutions were mixed well. Distilled water was used as a reference sam-ple. �e changes in the solutions’ colour were monitored and photographed.
3. Results and Discussion
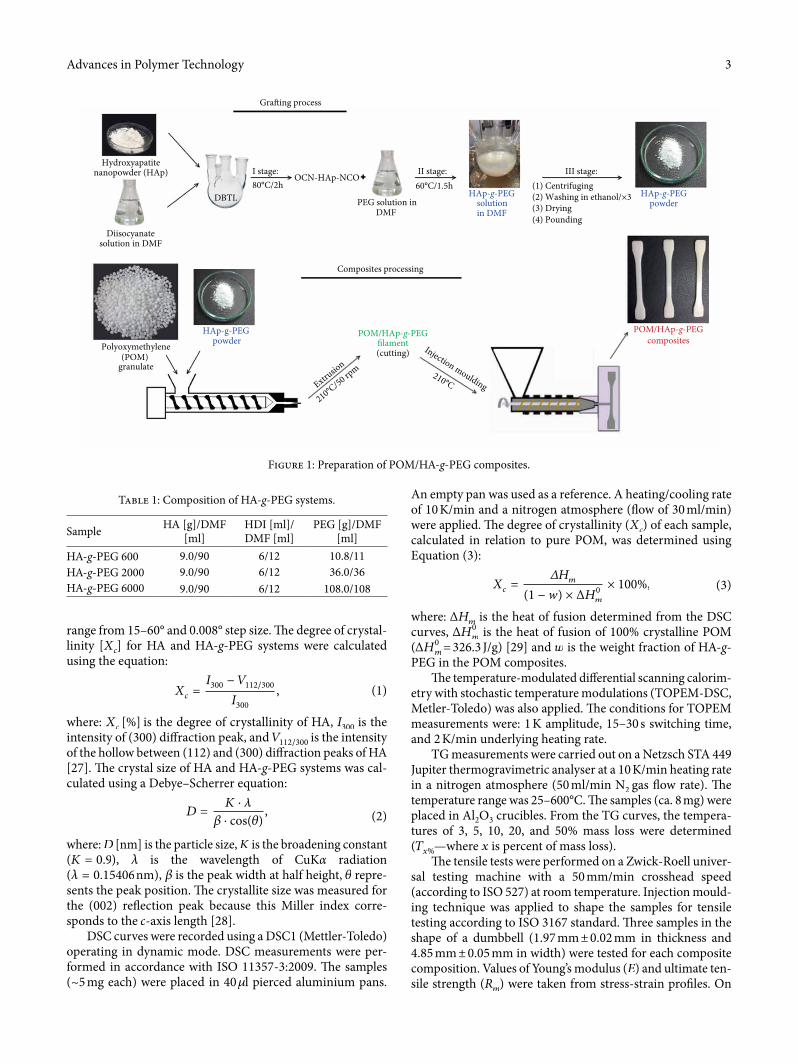
3.1. FTIR and XRD Analysis of HA-g-PEG. �e chemical structure and functional groups of pristine HA and HA-g-PEG systems were analysed using FTIR spectroscopy. �e FTIR spectra of HA and HA-g-PEGs are shown in Figure 2(a). In the FTIR spectrum for unmodi�ed HA, the bands at 3571 cm−1 and 632 cm−1 are associated with O-H groups stretching and the liberation vibrations of HA nanoparticles, respectively. A broad band in the 3550–3250 cm−1 range is related to absorbed water in the sample. Absorption bands at 1150–900 cm−1 and 620–500 cm−1 are due to the vibration of PO3−4 groups. For all HA-g-PEG systems absorption bands at 3330 cm−1, connected with the N-H urethane stretching vibration, is observed [30]. �ere are also two absorption bands from CH2 groups at about 2930 and 2860 cm−1. �e absorption bands at 1725 and 1630 cm−1 are due to the vibration of C=O (carbonyl) groups in urethane bonds (I amide absorption band). �e band at around 1585 cm−1 corresponds with N-H stretching vibration
Table 2: Crystallinity [�� [%]] and crystal size [� [nm]] of HA and HA-g-PEG systems based on XRD characterization (β—the peak width at half height [rad]).
Sample �� [%] β [rad] 2θ [rad] � (002) [nm]HA 87.35 0.0040 0.4503 35.43HA-g-PEG 600 76.57 0.0035 0.4527 40.76HA-g-PEG 2000 84.51 0.0030 0.4521 47.95HA-g-PEG 6000 71.87 0.0037 0.4506 38.44
Figure 2: FTIR spectra (a) and XRD patterns (b) of HA and HA-g-PEG.
400900140019002400290034003900
Abs
orba
nce
Wavenumber (cm–1)
Pure HA
HA-g-PEG 600
HA-g-PEG 2000
HA-g-PEG 6000
(a)
15 25 35 45 55
Inte
nsity
2 theta (°)
Pure HAHA-g-PEG 60 0
HA-g-PEG 2000HA-g-PEG 6000
002
211
300
310
222 213
200
111
102
112
202
210
004
(b)
5Advances in Polymer Technology
in urethane groups (II amide absorption band). �e band at 1253 cm−1 is consistent with C-N stretching vibrations (II amide absorption band) [31, 32]. �e bands in the 1150–950 cm−1 range from the ether C-O-C groups from PEG [33] are covered with bands related to PO3−4 groups from HA [34], but the bands in this range are broader than for pristine HA.
For all HA-g-PEG samples, all components of the urethane bond are visible in the FTIR spectrum in accordance with the literature [35]. �e lack of an –N=C=O (isocyanate) absorp-tion band at about 2260 cm−1 con�rmed a total conversion of HDI with –OH groups; as a result, urethane bonds (-NH-CO-O-) were created. Based on the obtained results, it can be assumed that the gra¥ing process of PEG using HDI as a coupling agent has been successfully performed.
Additionally, the XRD di�raction measurements for pure HA and HA-g-PEG were performed and the results are shown in Figure 2(b). �e XRD pattern of pure HA includes all char-acteristic peaks corresponding to stoichiometric HA [36]. �e di�ractograms of all HA-g-PEG samples did not reveal any extra peaks. However, as compared to pure HA, the HA-g-PEG’s di�raction peaks were slightly out of phase and the size of peaks was subtly changed. Data from XRD patterns were recal-culated using Equations (1) and (2) to yield crystallinity of samples and the crystal size of HA—Table 2.
�e crystallinity of HA was reduced for all modi�ed sam-ples by up to 15.48% for HA-g-PEG 6000. �e crystal size of modi�ed samples increased from 8.5% (for HA-g-PEG 6000) to 35% (for HA-g-PEG 2000). �ese results suggest that the gra¥ing process of PEG on the HA surface strongly a�ects the crystallographic structure of stoichiometric HA. �e unit cell size of modi�ed HA was expanded, but there were no extra crystallographic planes in the HA unit cells. Considering the crystal size of the HA-g-PEG samples, the results proved that the modi�ed HA still remains in the form of nanoparticles. Similar e�ects were observed by Li et al. [37] where a¥er mod-i�cation of HA by strontium a decrease in the HA crystallinity
and expansion of crystal size have been observed. In case of HA-g-PEG, such e�ects can be connected to incorporation of polymer chains to HA crystal lattice. In HA-g-PEG systems, the amount of organic phase (as determined from TG) was 22.3, 24.1, and 17.1% for PEG 600, 2000, and 6000, respec-tively. Such results suggest that smaller amounts of chemically surface—bonded polymer chains allows other chains to be incorporated into HA structure, while larger amounts of pol-ymer chains on HA surface hinder further incorporation and, in consequence, changes in HA di�raction parameters are lower.
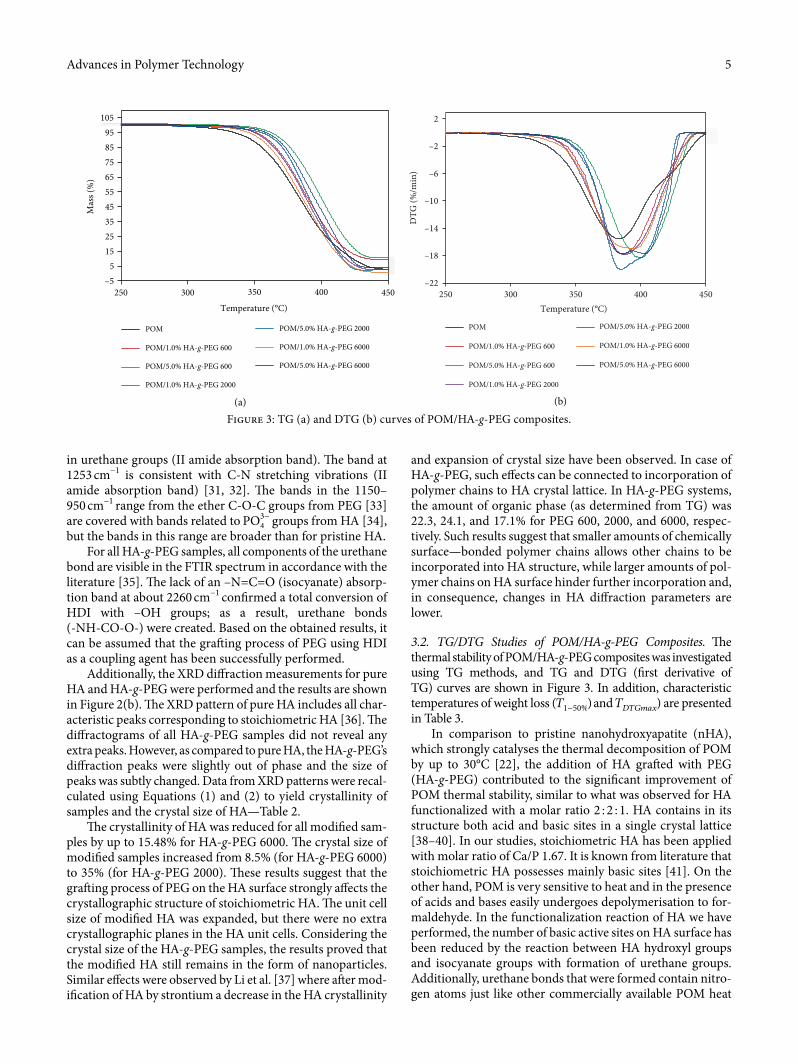
3.2. TG/DTG Studies of POM/HA-g-PEG Composites. �e thermal stability of POM/HA-g-PEG composites was investigated using TG methods, and TG and DTG (�rst derivative of TG) curves are shown in Figure 3. In addition, characteristic temperatures of weight loss (�1−50%) and �������) are presented in Table 3.
In comparison to pristine nanohydroxyapatite (nHA), which strongly catalyses the thermal decomposition of POM by up to 30°C [22], the addition of HA gra¥ed with PEG (HA-g-PEG) contributed to the signi�cant improvement of POM thermal stability, similar to what was observed for HA functionalized with a molar ratio 2 : 2 : 1. HA contains in its structure both acid and basic sites in a single crystal lattice [38–40]. In our studies, stoichiometric HA has been applied with molar ratio of Ca/P 1.67. It is known from literature that stoichiometric HA possesses mainly basic sites [41]. On the other hand, POM is very sensitive to heat and in the presence of acids and bases easily undergoes depolymerisation to for-maldehyde. In the functionalization reaction of HA we have performed, the number of basic active sites on HA surface has been reduced by the reaction between HA hydroxyl groups and isocyanate groups with formation of urethane groups. Additionally, urethane bonds that were formed contain nitro-gen atoms just like other commercially available POM heat
Figure 3: TG (a) and DTG (b) curves of POM/HA-g-PEG composites.
–55
152535455565758595
105
250 300 350 400 450
Mas
s (%
)
Temperature (°C)
POM
POM/1.0% HA-g-PEG 600
POM/5.0% HA-g-PEG 600
POM/1.0% HA-g-PEG 2000
POM/5.0% HA-g-PEG 2000
POM/1.0% HA-g-PEG 6000
POM/5.0% HA-g-PEG 6000
(a)
–22
–18
–14
–10
–6
–2
250 300 350 400 450
DTG
(%/m
in)
Temperature (°C)
POM
POM/1.0% HA-g-PEG 600
POM/5.0% HA-g-PEG 600
POM/1.0% HA-g-PEG 2000
POM/5.0% HA-g-PEG 2000
POM/1.0% HA-g-PEG 6000
POM/5.0% HA-g-PEG 6000
2
(b)
Advances in Polymer Technology6
Table 3: �ermal stability of POM/HA-g-PEG composites.
∗Data for unmodi�ed POM were taken from Ref. [25].
Sample �3% [°C] �5% [°C] �10% [°C] �20% [°C] �50% [°C] TDTG[°C]
POM∗ 319.0 328.1 341.2 355.1 382.0 388.1POM/1.0% HA-g-PEG 600 343.8 351.0 360.3 370.4 390.0 387.0POM/5.0% HA-g-PEG 600 351.9 359.8 369.4 379.8 399.6 401.3POM/10.0% HA-g-PEG 600 356.7 365.2 376.0 386.6 405.9 402.0POM/1.0% HA-g-PEG 2000 343.0 349.3 358.3 368.8 388.7 387.0POM/5.0% HA-g-PEG 2000 344.9 354.6 365.0 374.4 391.1 384.5POM/10.0% HA-g-PEG 2000 342.9 354.8 367.2 377.8 395.5 387.5POM/1.0% HA-g-PEG 6000 334.8 343.6 354.6 365.4 385.9 391.3POM/5.0% HA-g-PEG 6000 347.2 356.8 366.3 376.2 394.9 389.2POM/10.0% HA-g-PEG 6000 341.9 351.8 363.5 375.4 396.5 405.0
Figure 4: DSC curves (a) (the second heating run) and TOPEM-DSC pro�les (b–d) of POM/HA-g-PEG composites.
50 75 100 125 150 175
Hea
t �ow
(mW
)
Temperature (°C)POMPOM/1.0% HA-g-PEG 600POM/5.0% HA-g-PEG 600POM/1.0% HA-g-PEG 2000
POM/5.0% HA-g-PEG 2000POM/1.0% HA-g-PEG 6000
exo
POM/5.0% HA-g-PEG 6000
Reve
rsin
g he
at �
ow (m
W)
exo
160 162 164 166 168 170
Temperature (°C)
POM/5.0% HA-g-PEG 6000
POM/1.0% HA-g-PEG 6000
POM/5.0% HA-g-PEG 2000
POM/1.0% HA-g-PEG 2000
POM/5.0% HA-g-PEG 600
POM/1.0% HA-g-PEG 600
(a)
(c)
160 162 164 166 168 170
Tota
l hea
t �ow
(mW
)
POM/5.0% HA-g-PEG 6000
POM/1.0% HA-g-PEG 6000
POM/5.0% HA-g-PEG 2000
POM/1.0% HA-g-PEG 2000
POM/5.0% HA-g-PEG 600
POM/1.0% HA-g-PEG 600
Temperature (°C)
exo
Non
-rev
ersin
g he
at �
ow (m
W) ex
o
160 162 164 166 168 170
Temperature (°C)
POM/5.0% HA-g-PEG 6000
POM/1.0% HA-g-PEG 6000
POM/5.0% HA-g-PEG 2000
POM/1.0% HA-g-PEG 2000
POM/5.0% HA-g-PEG 600
POM/1.0% HA-g-PEG 600
(b)
(d)
7Advances in Polymer Technology
stabilizers, such as polyamides, aromatic amines, and dicyan-diamines [8]. In consequence, reduction in the number of hydroxyl groups and incorporation of nitrogen atoms lead to remarkable improvements in POM thermal stability that broadens the application �eld of this important engineering polymer.
As seen in the TG data, for 3% HA-g-PEG in POM com-posites, a thermal stability improvement (�3%) from 15.8°C for 10% HA-g-PEG 2000 to 37.7°C for 10% HA-g-PEG 600 was observed. Generally, for HA functionalized with PEG 2000 at a molar ratio of 2 : 2 : 1, improvement in thermal stability was higher (ca. 30°C for 10% HA-g-PEG 2000 [25]) compared to HA functionalized with a molar ratio of 1 : 2 : 1, where improve-ment in thermal stability was 23.9°C for 10% HA-g-PEG 2000. However, the best results were found for HA functionalized with PEG 600 at a molar ratio of 1 : 2 : 1. A strong relationship between the average molar mass of PEG and the e§ciency of HA-g-PEG additive was observed. �e shorter the chains of PEG used, the higher the thermal stability of the POM com-posites was achieved. �is e�ect is probably the result of the higher PEG chain mobility that leads to a more e§cient gra¥-ing process and reduction of hydroxyl groups in HA by the reaction of -OH groups with isocyanate groups from HDI with the formation of urethane bonds on the HA surface. Moreover, in the synthesis reaction of HA-g-PEG, when PEG of lower molar mass (600) is used, the mixture is less viscous due to a modest amount of PEG (see Table 1) and the PEG chains are more mobile. �erefore, they can more easily react with other compounds and more -OH groups can be substituted—as a result, the HA-g-PEG thermal stabilizer is more e�ective. �us, the e�ect of heat stabilization by nitrogen-containing HA-g-PEG can be intensi�ed.
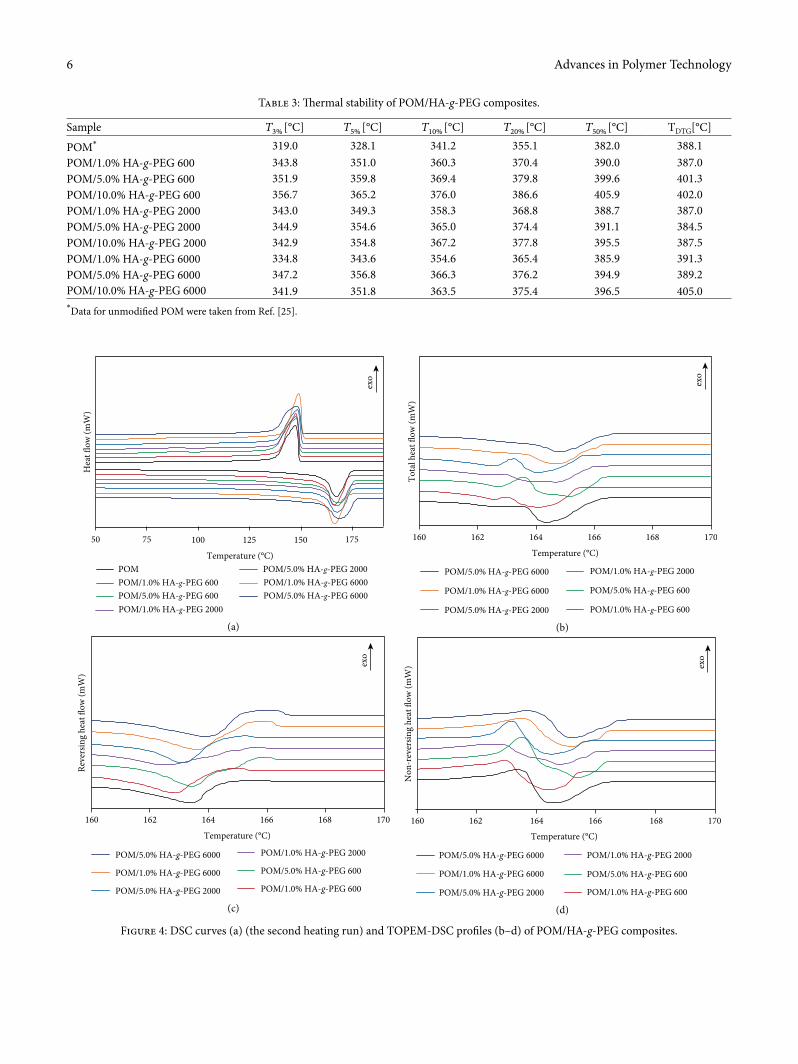
3.3. DSC and TOPEM-DSC Results of POM/HA-g-PEG Composites. POM/HA-g-PEG composites, that were manufactured using melt processing techniques such as extrusion and injection moulding, were characterized by DSC (Figure 4(a)). Temperatures of phase transitions (1st and 2nd melting, crystallization) and the values of the corresponding heat of phase transition are collected in Table 4. Based on the DSC results, the degree of crystallinity of the POM matrix in composites and supercooling of composites was calculated and correlated in Table 4.
�ere is very little impact of HA-g-PEG additives on the shape of DSC curves, the melting point temperature, the degree of crystallinity, and supercooling. Moreover, no signif-icant in¬uence of PEG average molar mass on the phase behaviour of POM composites was observed. Additionally, when comparing the obtained results to results of POM/HAp-g-PEG 2000 gra¥ed at the HAp:HDI:PEG molar ratio of 2 : 2 : 1 [25], no in¬uence of substrate ratio on melting and crystalli-zation behaviour of POM composites can be found. �e melt-ing temperature of POM/HA-g-PEG composites decreased by 1–2°C, except for POM/1.0% HA-g-PEG 600, where an increase of 1.5°C was detected. For the second melting run, the melting temperature decreased by ca. 0.3–0.8°C. �e addi-tion of HA-g-PEG in composites alters the crystallinity of the POM matrix (a decrease of 1%). Only for the composite
containing 1% HA-g-PEG 6000 was an increase of 0.8% in POM crystallinity detected. Furthermore, a slight decrease by ca. 1–3°C of supercooling of all composites was observed, which con�rms the nucleating e�ect of additives on POM crystallization. �ere was a lack of melting peak in the range 15–70°C corresponding to PEG melting for all three PEG com-ponents. �is indicates that PEG was chemically bonded in an organic–inorganic HA-g-PEG compound, so the mobility of PEG chains was strongly limited and as a result, PEG crys-tallization was hindered. �ere was only one maximum in the melting peak, both in the �rst and second runs in contrast to our previous study, where pure HA was added to the POM matrix [22]. �is can indicate that HA-g-PEG systems a�ect the lamellar thickness of POM crystals.
To obtain more information about the thermal behaviour of POM/HA-g-PEG composites TOPEM DSC was applied. TOPEM DSC pro�les (total heat ¬ow is presented in Figure 4(b)) were separated to reversing (Figure 4(c)) and nonre-versing (Figure 4(d)) heat ¬ow. As it can be seen from the TOPEM DSC traces, melting transitions, are found at signif-icantly lower temperatures than those of the classical DSC. �is phenomenon was also observed by other researchers [42] and can be attributed to lower heating rates that are required in modulated DSC measurements. For unmodi�ed POM, one melting peak is visible in total heat ¬ow, whereas on the nonreversing curve, a minor exothermic peak ascribed to the recrystallization of less ideal POM crystals can be observed. For composites containing HA-g-PEG, a double melting peak in the total heat ¬ow curve is present. It can be clearly seen that maximum melting peak depends both on the PEG average molar mass and HAp-g-PEG content. With an increase in PEG molar mass and HA-g-PEG content, the maximum peaks were shi¥ed to higher temperatures, and the highest temperatures were observed for POM modi�ed with 5% of HA-g-PEG 6000. �is e�ect can be attributed to the highest crystallization ability of PEG 6000 compared to PEG with lower molar mass, and better a§nity of longer PEG chains to embed in the crystal structures of POM. �is can be con�rmed by the lower recrystallization e�ect for com-posites with HA-g-PEG 6000 in TOPEM nonreversing heat ¬ow pro�les and the highest degree of crystallinity of POM/HA-g-PEG 6000 composites. Along with an HA-g-PEG con-tent increase, a stronger recrystallization e�ect and complete melting processes are detected in nonreversing curves, espe-cially for 5% HA-g-PEG 600 and HA-g-PEG 2000. �e two melting peaks are probably associated with melting of dys-functional POM crystals that were disturbed by HA-g-PEG with shorter PEG chains. Similar e�ects were observed for polyurethane (MDI-PEG-BDO) samples modi�ed with graphite nano�ller [43].
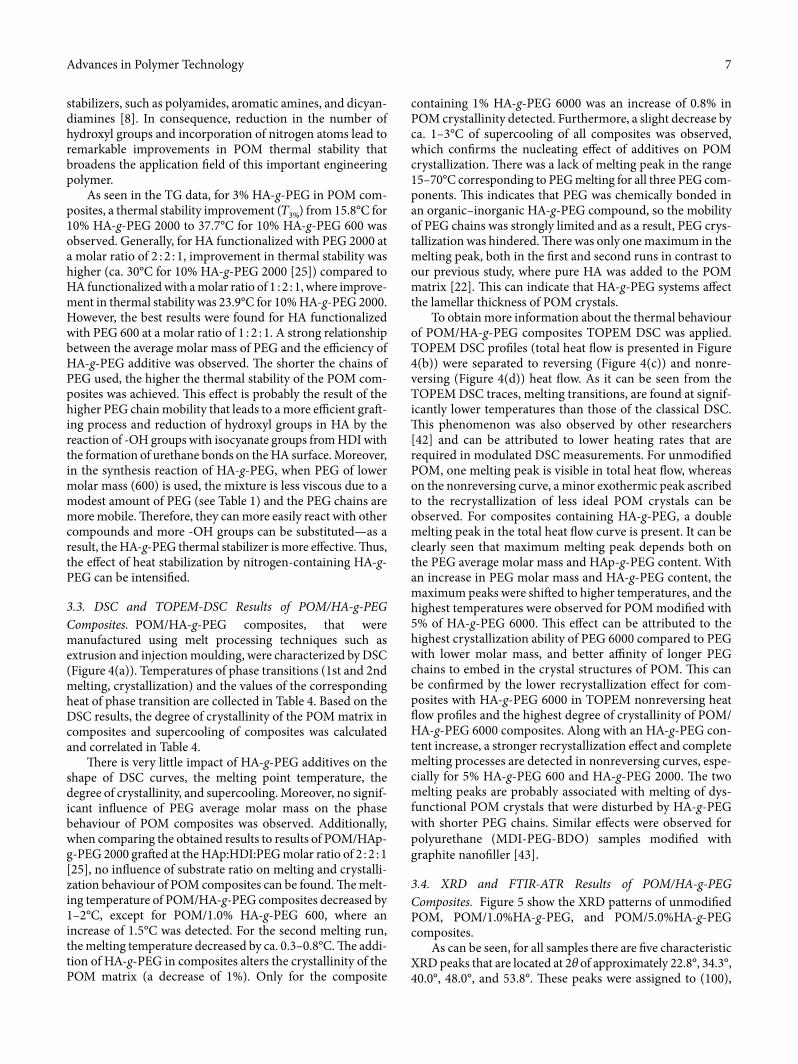
3.4. XRD and FTIR-ATR Results of POM/HA-g-PEG Composites. Figure 5 show the XRD patterns of unmodi�ed POM, POM/1.0%HA-g-PEG, and POM/5.0%HA-g-PEG composites.
As can be seen, for all samples there are �ve characteristic XRD peaks that are located at 2θ of approximately 22.8°, 34.3°, 40.0°, 48.0°, and 53.8°. �ese peaks were assigned to (100),
Advances in Polymer Technology8
(105), (110), (115), and (205) re¬ections of POM hexagonal crystals, respectively. �e crystal structure of all samples was con�rmed with XRD and it was consistent with XRD patterns for POM that are available in the literature [9, 44, 45]. For composites containing 5% of HA-g-PEG, peaks derived from HA start to show up at 25.9° (002), 29.2° (210), 31.7° (211), 32.1° (112), 32.8° (300), 46.5° (222), and 49.5° (213) which is in accordance with XRD patterns for HA-g-PEG (Figure 2(b)). In Figure 5, the di�raction intensity of the (100) plane is plot-ted closely. Both HA-g-PEG content and the molecular mass of PEG in¬uence the size of this peak by decreasing its inten-sity. �is indicates that the crystallinity of POM composites decreases as the amount of modi�er increases and the molar mass of PEG that was used in the HA-g-PEG system increases, which is consistent with the DSC results (Table 4). �e
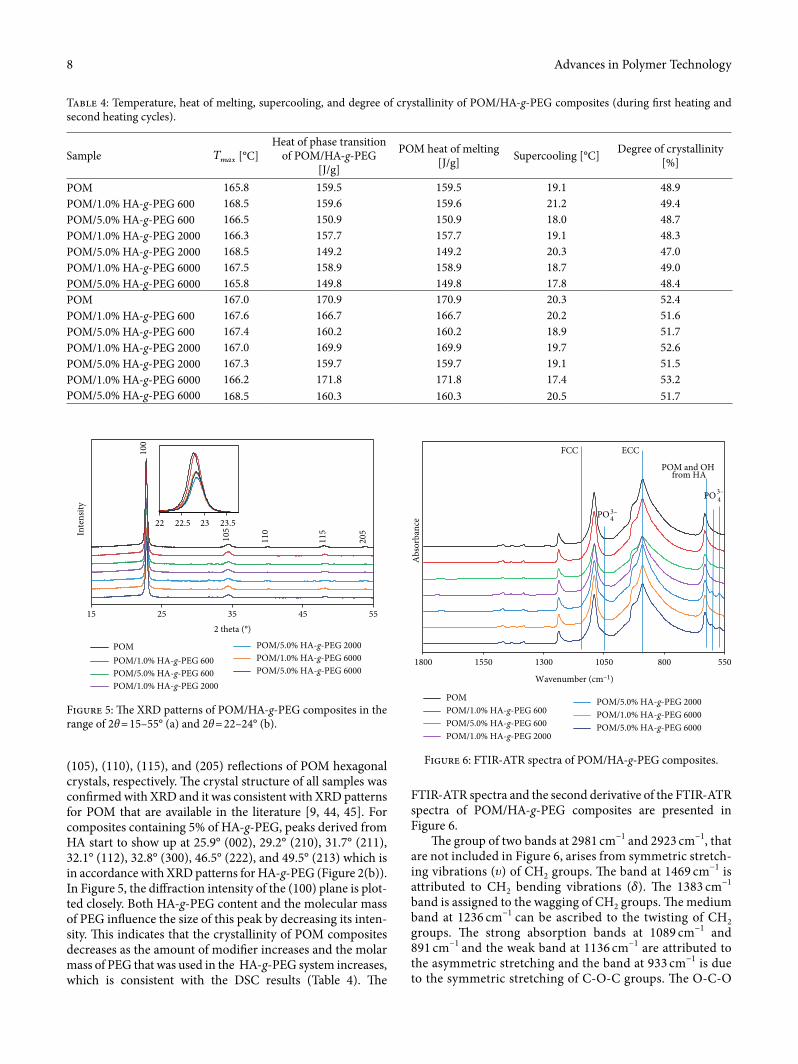
FTIR-ATR spectra and the second derivative of the FTIR-ATR spectra of POM/HA-g-PEG composites are presented in Figure 6.
�e group of two bands at 2981 cm−1 and 2923 cm−1, that are not included in Figure 6, arises from symmetric stretch-ing vibrations (�) of CH2 groups. �e band at 1469 cm−1 is attributed to CH2 bending vibrations (�). �e 1383 cm−1
band is assigned to the wagging of CH2 groups. �e medium band at 1236 cm−1 can be ascribed to the twisting of CH2groups. �e strong absorption bands at 1089 cm−1 and 891 cm−1 and the weak band at 1136 cm−1 are attributed to the asymmetric stretching and the band at 933 cm−1 is due to the symmetric stretching of C-O-C groups. �e O-C-O
Table 4: Temperature, heat of melting, supercooling, and degree of crystallinity of POM/HA-g-PEG composites (during �rst heating and second heating cycles).
Sample ���� [°C]Heat of phase transition
of POM/HA-g-PEG [J/g]
POM heat of melting [J/g] Supercooling [°C] Degree of crystallinity
[%]
POM 165.8 159.5 159.5 19.1 48.9POM/1.0% HA-g-PEG 600 168.5 159.6 159.6 21.2 49.4POM/5.0% HA-g-PEG 600 166.5 150.9 150.9 18.0 48.7POM/1.0% HA-g-PEG 2000 166.3 157.7 157.7 19.1 48.3POM/5.0% HA-g-PEG 2000 168.5 149.2 149.2 20.3 47.0POM/1.0% HA-g-PEG 6000 167.5 158.9 158.9 18.7 49.0POM/5.0% HA-g-PEG 6000 165.8 149.8 149.8 17.8 48.4POM 167.0 170.9 170.9 20.3 52.4POM/1.0% HA-g-PEG 600 167.6 166.7 166.7 20.2 51.6POM/5.0% HA-g-PEG 600 167.4 160.2 160.2 18.9 51.7POM/1.0% HA-g-PEG 2000 167.0 169.9 169.9 19.7 52.6POM/5.0% HA-g-PEG 2000 167.3 159.7 159.7 19.1 51.5POM/1.0% HA-g-PEG 6000 166.2 171.8 171.8 17.4 53.2POM/5.0% HA-g-PEG 6000 168.5 160.3 160.3 20.5 51.7
15 25 35 45 55
Inte
nsity
2 theta (°)
100
105
110
115
205
22 22.5 23 23.5
POMPOM/1.0% HA-g-PEG 600POM/5.0% HA-g-PEG 600POM/1.0% HA-g-PEG 2000
POM/5.0% HA-g-PEG 2000POM/1.0% HA-g-PEG 6000POM/5.0% HA-g-PEG 6000
Figure 5: �e XRD patterns of POM/HA-g-PEG composites in the range of 2θ = 15–55° (a) and 2θ = 22–24° (b).
5508001050130015501800
Abs
orba
nce
Wavenumber (cm–1)
POMPOM/1.0% HA-g-PEG 600POM/5.0% HA-g-PEG 600POM/1.0% HA-g-PEG 2000
POM/5.0% HA-g-PEG 2000POM/1.0% HA-g-PEG 6000POM/5.0% HA-g-PEG 6000
FCC ECC
PO 43–
POM and OH from HA
PO43–
Figure 6: FTIR-ATR spectra of POM/HA-g-PEG composites.
9Advances in Polymer Technology
bending vibration peak appears at 630 cm−1 [46]. No changes in the FTIR band position for all composites were detected. Additionally, for samples containing 5% HA-g-PEG, the 602 cm−1 and 567 cm−1 bands, arising from PO3−4 asymmetric bending, were detected. As is known, the most common crystallographic form of POM is a hexagonal system, which consists of a 9/5 helical conformation, and it is the most stable form in terms of saving energy. In some speci�c con-ditions, POM can create orthorhombic crystals that are made up of 2/1 helical molecules. �e typical hexagonal morphology of POM is usually a hybrid system which con-tains both folded chain crystals (FCC) and extended chain crystals (ECC). Although it is possible to separate bands from EEC and FCC based on IR spectra, these bands can overlap, and they may become indistinguishable. According to the literature [47], there are only two bands that are
strongly related to only one kind of crystal morphology: the band at 1136 cm−1 that belongs only to FCC and band at and 891 cm−1 which is the vibrations of only an ECC structure. �e other bands (1236 cm−1, 1089 cm−1, 933 cm−1, and 630 cm−1) come from the vibrations of both FCC and ECC crystal structures.
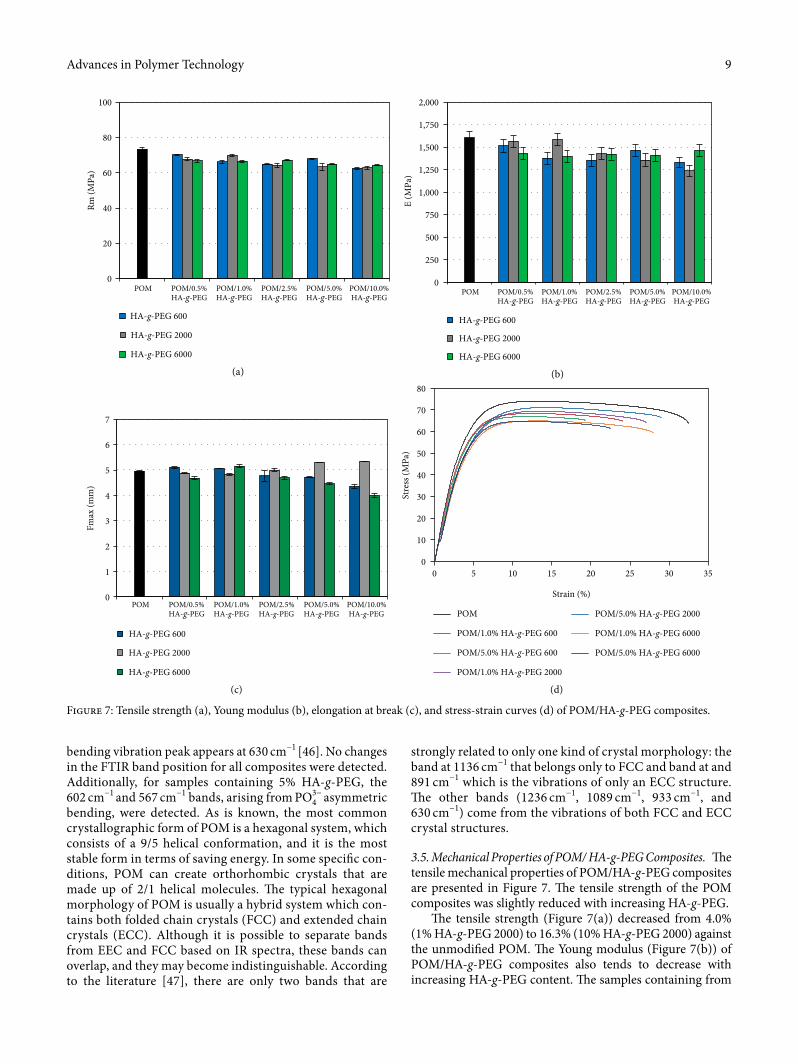
3.5. Mechanical Properties of POM/ HA-g-PEG Composites. �e tensile mechanical properties of POM/HA-g-PEG composites are presented in Figure 7. �e tensile strength of the POM composites was slightly reduced with increasing HA-g-PEG.
�e tensile strength (Figure 7(a)) decreased from 4.0% (1% HA-g-PEG 2000) to 16.3% (10% HA-g-PEG 2000) against the unmodi�ed POM. �e Young modulus (Figure 7(b)) of POM/HA-g-PEG composites also tends to decrease with increasing HA-g-PEG content. �e samples containing from
(a)
0
20
40
60
80
100
POM POM/0.5%HA-g-PEG
POM/1.0%HA-g-PEG
POM/2.5%HA-g-PEG
POM/5.0%HA-g-PEG
POM/10.0%HA-g-PEG
Rm (M
Pa)
HA-g-PEG 600
HA-g-PEG 2000
HA-g-PEG 6000
(b)
0
250
500
750
1,000
1,250
1,500
1,750
2,000
POM POM/0.5%HA-g-PEG
POM/1.0%HA-g-PEG
POM/2.5%HA-g-PEG
POM/5.0%HA-g-PEG
POM/10.0%HA-g-PEG
E (M
Pa)
HA-g-PEG 600
HA-g-PEG 2000
HA-g-PEG 6000
(c)
0
1
2
3
4
5
6
7
POM POM/0.5%HA-g-PEG
POM/1.0%HA-g-PEG
POM/2.5%HA-g-PEG
POM/5.0%HA-g-PEG
POM/10.0%HA-g-PEG
Fmax
(mm
)
HA-g-PEG 600
HA-g-PEG 2000
HA-g-PEG 6000
(d)
0
10
20
30
40
50
60
70
80
0 5 10 15 20 25 30 35
Stre
ss (M
Pa)
Strain (%)
POM
POM/1.0% HA-g-PEG 600
POM/5.0% HA-g-PEG 600
POM/1.0% HA-g-PEG 2000
POM/5.0% HA-g-PEG 2000
POM/1.0% HA-g-PEG 6000
POM/5.0% HA-g-PEG 6000
Figure 7: Tensile strength (a), Young modulus (b), elongation at break (c), and stress-strain curves (d) of POM/HA-g-PEG composites.
Advances in Polymer Technology10
0.5–1% HA-g-PEG 2000 are an exception to this rule, and for these samples, the Young modulus is almost the same as for unmodi�ed POM (the di�erence is from ~0.1–0.3%). �is e�ect can be explained by the higher crystallinity of compos-ites with lower additive content. �e greatest loss in Young modulus, ~24.5 %, was detected for samples containing 10% HA-g-PEG 2000. �ere was no signi�cant impact of HA-g-PEG on elongation at break up to 2.5% concentration of addi-tive. HA-g-PEG 6000 contributed to the biggest decrease in
���� by decreasing the value of elongation at break by ~22% for a 10% HA-g-PEG 6000 load.
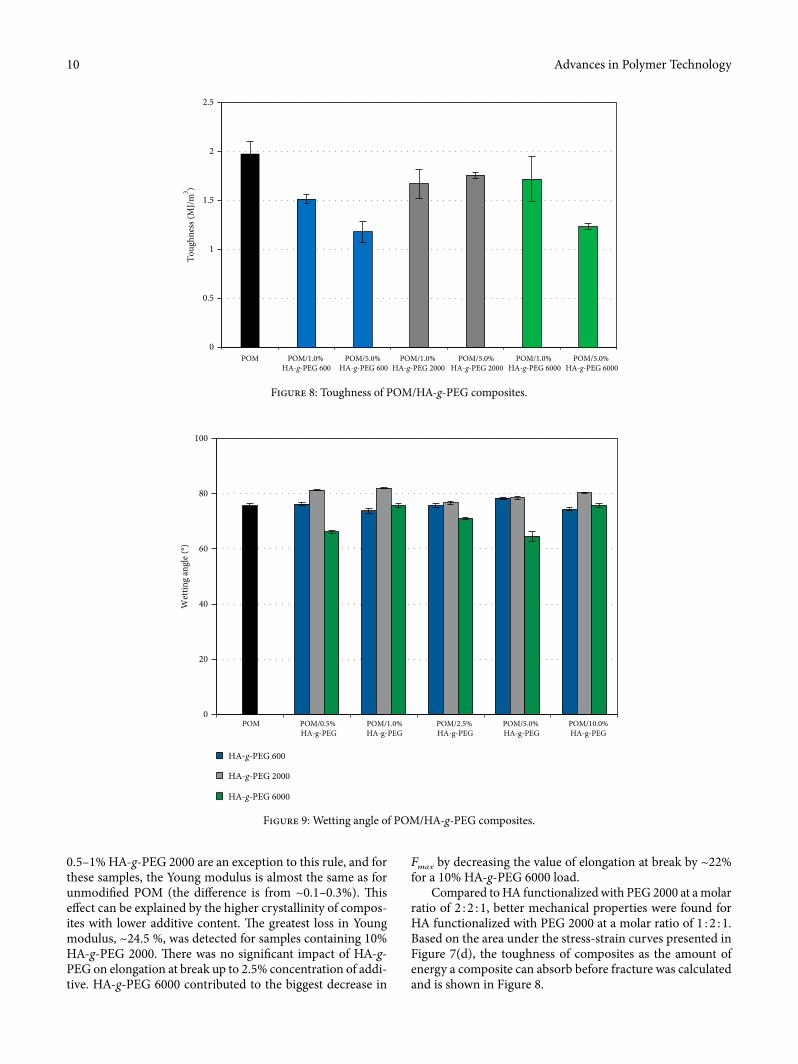
Compared to HA functionalized with PEG 2000 at a molar ratio of 2 : 2 : 1, better mechanical properties were found for HA functionalized with PEG 2000 at a molar ratio of 1 : 2 : 1. Based on the area under the stress-strain curves presented in Figure 7(d), the toughness of composites as the amount of energy a composite can absorb before fracture was calculated and is shown in Figure 8.
0
0.5
1
1.5
2
2.5
POM POM/1.0% HA-g-PEG 600
POM/5.0% HA-g-PEG 600
POM/1.0% HA-g-PEG 2000
POM/5.0% HA-g-PEG 2000
POM/1.0% HA-g-PEG 6000
POM/5.0% HA-g-PEG 6000
Toug
hnes
s (M
J/m
3 )
Figure 8: Toughness of POM/HA-g-PEG composites.
0
20
40
60
80
100
POM POM/0.5% HA-g-PEG
POM/1.0% HA-g-PEG
POM/2.5% HA-g-PEG
POM/5.0% HA-g-PEG
POM/10.0%HA-g-PEG
Wet
ting
angl
e (°
)
HA-g-PEG 600
HA-g-PEG 2000
HA-g-PEG 6000
Figure 9: Wetting angle of POM/HA-g-PEG composites.
11Advances in Polymer Technology
�e measurements of the wetting angle of POM/HA-g-PEG composites in Figure 9 show quite a signi�cant in¬uence of the hybrid additive on POM wettability.
�e contact angle of unmodi�ed POM was 75.6° ± 1.5°, which is a characteristic value for POM [46, 48]. Changes in POM wettability depend on the molar mass of PEG and its content in composites. For HA-g-PEG 600 there is only a minor decrease in POM wettability. For HA-g-PEG 2000, the biggest wettability increase, up to 8.5% higher than for pure POM for POM/1.0% HA-g-PEG 2000, is observed. By contrast, POM/HA-g-PEG 6000 composites are characterized by the lowest wettability, up to 14.7% lower than for unmodi�ed POM.
Generally, a POM surface is considered as amphoteric (hydrophobic/hydrophilic), as the contact angle value is between 45° and 90° [49]. Some changes in POM wettability are caused by di�erent con�gurations of POM chains. If the oxygen atoms in POM chains are exposed on the top of the surface, it becomes more hydrophilic. If oxygen atoms face
�e addition of HA-g-PEG in¬uenced the toughness of composites. Apart from HA-g-PEG 2000, the toughness of POM composites decreased with an increase in HA-g-PEG concentration. �erefore, the modi�ed samples became more brittle; they broke much faster and the elongation was signif-icantly smaller. Changes in mechanical properties of POM/HA-g-PEG composites are caused by changes in POM crys-tallinity due to the HA-g-PEG additive, which can disturb the formation of POM crystals, but can also act as a nucleating agent. �erefore, HA-g-PEG presence in POM can aid the growth of smaller crystals and strongly a�ect the kinetics of crystallization. �ere is also a strong relation between DSC studies and the mechanical test. Along with the degree of crys-tallinity increase, there is a proportional increase in elongation at break of composites.
3.6. Wetting Properties of POM/HA-g-PEG Composites. As POM is characterized by high lubricity, the HA-g-PEG in¬uence on the wettability of POM surface was investigated.
(a)
(c)
(b)
(d)
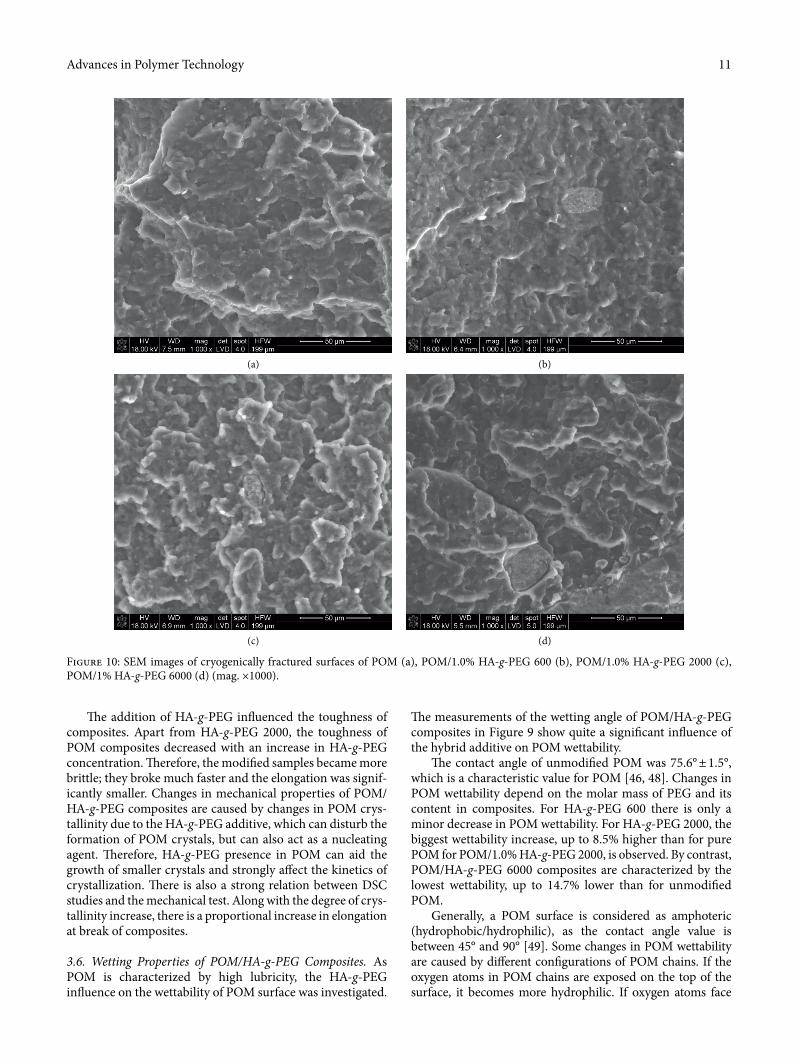
Figure 10: SEM images of cryogenically fractured surfaces of POM (a), POM/1.0% HA-g-PEG 600 (b), POM/1.0% HA-g-PEG 2000 (c), POM/1% HA-g-PEG 6000 (d) (mag. ×1000).
Advances in Polymer Technology12
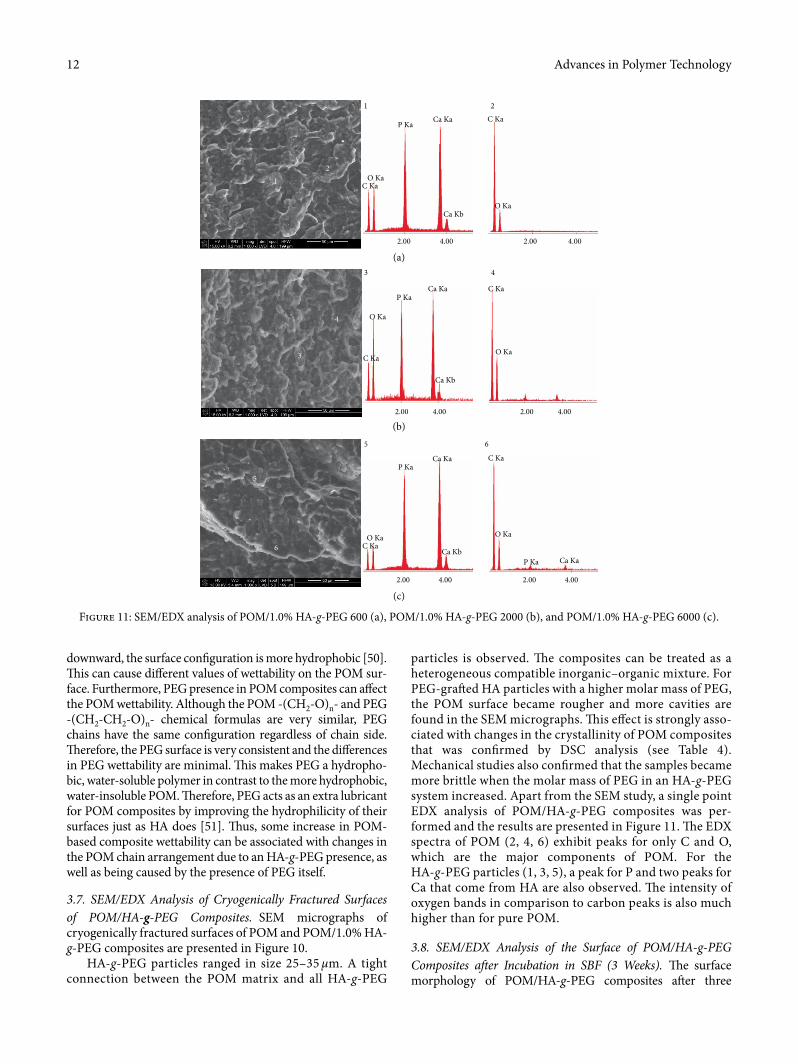
particles is observed. �e composites can be treated as a heterogeneous compatible inorganic–organic mixture. For PEG-gra¥ed HA particles with a higher molar mass of PEG, the POM surface became rougher and more cavities are found in the SEM micrographs. �is e�ect is strongly asso-ciated with changes in the crystallinity of POM composites that was con�rmed by DSC analysis (see Table 4). Mechanical studies also con�rmed that the samples became more brittle when the molar mass of PEG in an HA-g-PEG system increased. Apart from the SEM study, a single point EDX analysis of POM/HA-g-PEG composites was per-formed and the results are presented in Figure 11. �e EDX spectra of POM (2, 4, 6) exhibit peaks for only C and O, which are the major components of POM. For the HA-g-PEG particles (1, 3, 5), a peak for P and two peaks for Ca that come from HA are also observed. �e intensity of oxygen bands in comparison to carbon peaks is also much higher than for pure POM.
3.8. SEM/EDX Analysis of the Surface of POM/HA-g-PEG Composites a�er Incubation in SBF (3 Weeks). �e surface morphology of POM/HA-g-PEG composites a¥er three
downward, the surface con�guration is more hydrophobic [50]. �is can cause di�erent values of wettability on the POM sur-face. Furthermore, PEG presence in POM composites can a�ect the POM wettability. Although the POM -(CH2-O)n- and PEG -(CH2-CH2-O)n- chemical formulas are very similar, PEG chains have the same con�guration regardless of chain side. �erefore, the PEG surface is very consistent and the di�erences in PEG wettability are minimal. �is makes PEG a hydropho-bic, water-soluble polymer in contrast to the more hydrophobic, water-insoluble POM. �erefore, PEG acts as an extra lubricant for POM composites by improving the hydrophilicity of their surfaces just as HA does [51]. �us, some increase in POM-based composite wettability can be associated with changes in the POM chain arrangement due to an HA-g-PEG presence, as well as being caused by the presence of PEG itself.
3.7. SEM/EDX Analysis of Cryogenically Fractured Surfaces of POM/HA-g-PEG Composites. SEM micrographs of cryogenically fractured surfaces of POM and POM/1.0% HA-g-PEG composites are presented in Figure 10.
HA-g-PEG particles ranged in size 25–35 μm. A tight connection between the POM matrix and all HA-g-PEG
1 2
2.00 4.00 2.00 4.00
C KaO Ka
P KaCa Ka
Ca Kb
C Ka
O Ka
12
3 4
2.00 4.00 2.00 4.00
C Ka
O Ka
P KaCa Ka
Ca Kb
C Ka
O Ka3
4
5 6
2.00 4.00 2.00 4.00
C KaO Ka
P KaCa Ka
Ca Kb
C Ka
O Ka
P Ka Ca Ka6
5
Figure 11: SEM/EDX analysis of POM/1.0% HA-g-PEG 600 (a), POM/1.0% HA-g-PEG 2000 (b), and POM/1.0% HA-g-PEG 6000 (c).
(a)
(b)
(c)
13Advances in Polymer Technology
HA. In our previous work it was found that the possibility of incorporation of higher amounts of HA to POM matrix is limited by the degradation of POM matrix that also limits bioactivity enhancement [22]. A¥er HA functionalization no
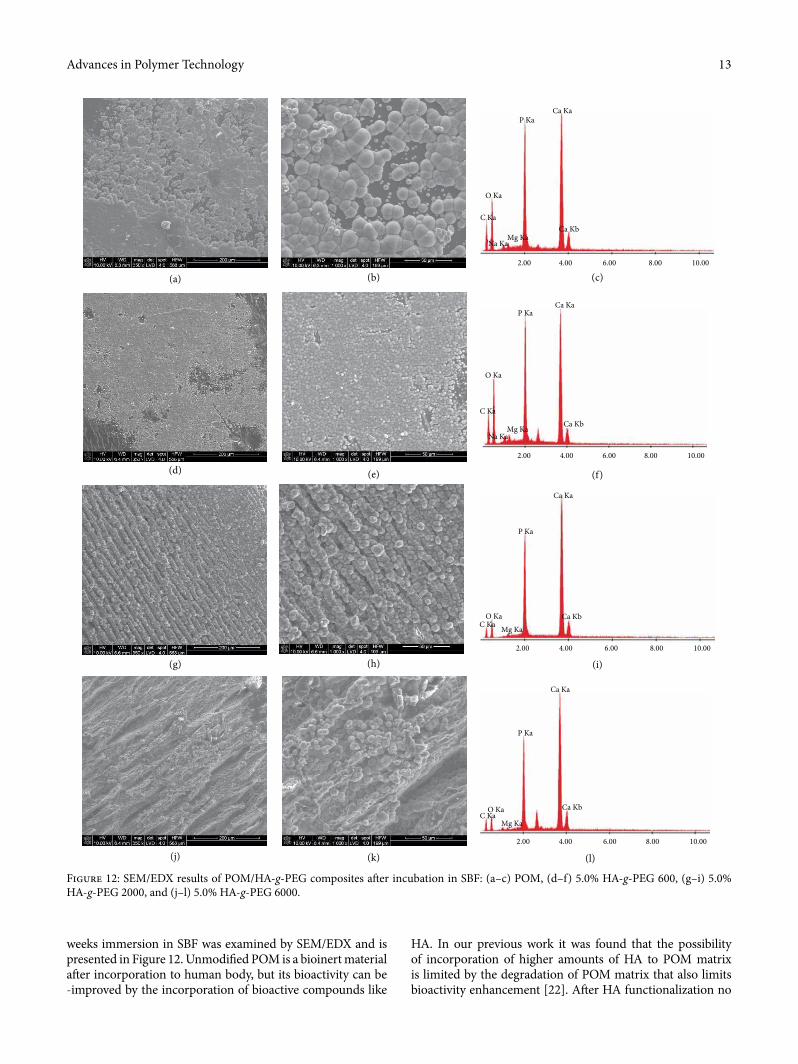
weeks immersion in SBF was examined by SEM/EDX and is presented in Figure 12. Unmodi�ed POM is a bioinert material a¥er incorporation to human body, but its bioactivity can be -improved by the incorporation of bioactive compounds like
Figure 12: SEM/EDX results of POM/HA-g-PEG composites a¥er incubation in SBF: (a–c) POM, (d–f) 5.0% HA-g-PEG 600, (g–i) 5.0% HA-g-PEG 2000, and (j–l) 5.0% HA-g-PEG 6000.
(d)
(g)
(j)
(a) (b)
(e)
(h)
(k)
2.00 4.00 6.00 8.00 10.00
C Ka
O Ka
Mg KaNa Ka
P KaCa Ka
Ca Kb
(c)
2.00 4.00 6.00 8.00 10.00
C KaO Ka
Mg Ka
P Ka
Ca Ka
Ca Kb
(f)
2.00 4.00 6.00 8.00 10.00
C KaO Ka
Mg Ka
P Ka
Ca Ka
Ca Kb
(i)
2.00 4.00 6.00 8.00 10.00
C Ka
O Ka
Mg KaNa Ka
P KaCa Ka
Ca Kb
(l)
Advances in Polymer Technology14
up to 20 μm in diameter, with Ca/P ratio of 1.52 at.% (1.96 wt.%) were crystallized on the pristine POM surface. �e surface of POM/5.0% HA-g-PEG 600 composite (Figures 12(d)–12(e)) was covered with �ne apatite crystals, below 5 μm in diameter. �e POM/HA-g-PEG composite surface was still not completely covered by the single layer of close-grained apatite crystals. �e Ca/P ratio for apatite on the POM/ HA-g-PEG 600 composite decreased to 1.47 at.% (1.90 wt.%). In the POM/5.0% HA-g-PEG 2000 composite (Figures 12(g)–12(i)), the formation of a thick apatite multi-layer was observed. �e apatite particles had a characteristic cauli¬ower-like morphology and they formed long, parallel rows. �e most non-homogeneous microstructure of apatite was observed for POM/5.0% HA-g-PEG 6000. �e apatite crystals di�ered in size and were not evenly deployed on the composite surface.
�e addition of HA-g-PEG strongly improved apatite for-mation on the POM/HA-g-PEG composites along with an increase in the molar mass of PEG; however, the formed apa-tite became less stoichiometric.
POM degradation during processing was observed even for 10 wt. % of HA. As it can be seen incorporation of such relatively large amount of HA leads to signi�cant improvement of POM bioactivity via formation of continuous layer of apatites. �e Ca/P ratio (wt.% and at.%) of formed apatite layers was determined using EDX analysis and correlated in Table 5.
Results show that for pure POM (Figures 12(a)–12(c)) a single, discontinuous layer of apatite was formed on the POM surface. Well-formed, spherical microcrystallites of apatite,
Table 5: EDX chemical ratio of Ca/P of apatite on the surface of POM/HA-g-PEG composites.
SampleCa/P ratio
at.% wt.%POM 1.52 1.96POM/5.0% HA-g-PEG 600 1.47 1.90POM/5.0% HA-g-PEG 2000 1.83 2.37POM/5.0% HA-g-PEG 6000 2.03 2.63
0
1
2
3
4
5
6
7
8
0 1 2 3 4 5 6 7 8 9 10 11 12 13
pH
0
1
2
3
4
5
6
7
8
pH
Time (weeks)
POM
POM/2.5% HA-g-PEG 600
POM/5.0% HA-g-PEG 600
POM/10.0% HA-g-PEG 600
0 1 2 3 4 5 6 7 8 9 10 11 12 13Time (weeks)
POM
POM/2.5% HA-g-PEG 600
POM/5.0% HA-g-PEG 600
POM/10.0% HA-g-PEG 600
02468
101214161820
0 1 2 3 4 5 6 7 8 9 10 11 12 13
Con
duct
ivity
(μS)
Time (weeks)
POM
POM/2.5% HA-g-PEG 600
POM/5.0% HA-g-PEG 600
POM/10.0% HA-g-PEG 600
02468
101214161820
0 1 2 3 4 5 6 7 8 9 10 11 12 13
Con
duct
ivity
(μS)
Time (weeks)
Incubation in PBS
Incubation in PBS
Incubation in RF
Incubation in RF
POM
POM/2.5% HA-g-PEG 600
POM/5.0% HA-g-PEG 600
POM/10.0% HA-g-PEG 600
Figure 13: pH and conductivity changes of PBS and RF solutions as a function of incubation time of pristine POM and POM/HA-g-PEG 600 samples.
15Advances in Polymer Technology
600 into the POM matrix improved the thermal stability of POM. In addition, the signi�cant amount of HA in the HA-g-PEG system improves the biocompatibility of POM intended for application as long-term bone implants.
4. Conclusions
In this work, three di�erent HA-g-PEG hybrid �llers, made from PEG with a molar mass of 600, 2000, or 6000 that was gra¥ed on the HA surface using HDI as a coupling agent, were successfully introduced into POM matrix by melt processing methods. �e highest increase in melting point and crystal-linity was detected for POM/1.0% HA-g-PEG 600, which sug-gests that HA-g-PEG �ller acts as a nucleating agent in POM. For a higher concentration of HA-g-PEG (5%) the POM crys-tallization process is disturbed, and a strong recrystallization e�ect is observed. Changes in the crystallinity of POM-based composites transfer to fractional decreases in the mechanical properties of these materials, such as (tensile strength, elon-gation at break, and Young’s modulus). However, no phase shi¥ in the XRD spectra of POM/HA-g-PEG composites in comparison to pure POM suggests that HA-g-PEG additive does not alter the hexagonal form of POM crystallites. �e in vitro studies proved that incorporation of HA-g-PEG to a POM matrix improved bioactivity of the POM composites along with a PEG molar mass increase. Moreover, both the POM matrix and HA-g-PEG additive indicate very good in vitro chemical stability. Schi� ’s test con�rmed the very low level of formaldehyde released from all POM/HA-g-PEG
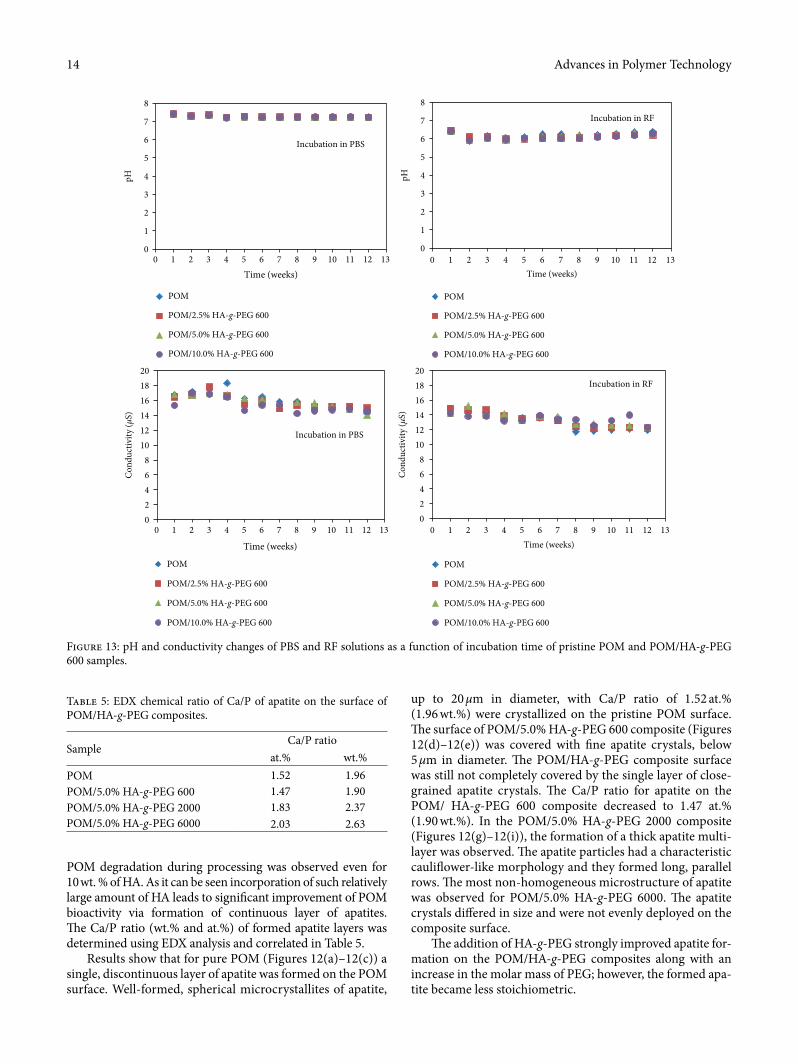
3.9. In Vitro Chemical Stability of POM/HA-g-PEG 600 Composites during a 3-month Incubation. �e in vitro chemical stability of POM/HA-g-PEG 600 composites was assessed by measurement of changes in pH and conductivity of PBS and Ringer’s ¬uid during a three-month incubation at 37°C. Figure 13 shows that there were no signi�cant changes in pH for both solutions; a minor decrease in the conductivity was detected. Samples containing 2.5%, 5.0% and even 10.0% of HA-g-PEG additives showed similar behaviour to unmodi�ed POM. Moreover, the mass of all samples (Table 6), before and a¥er incubation remained practically unchanged. �ese observations proved that both the POM matrix and HA-g-PEG 600 additive show good in vitro stability.
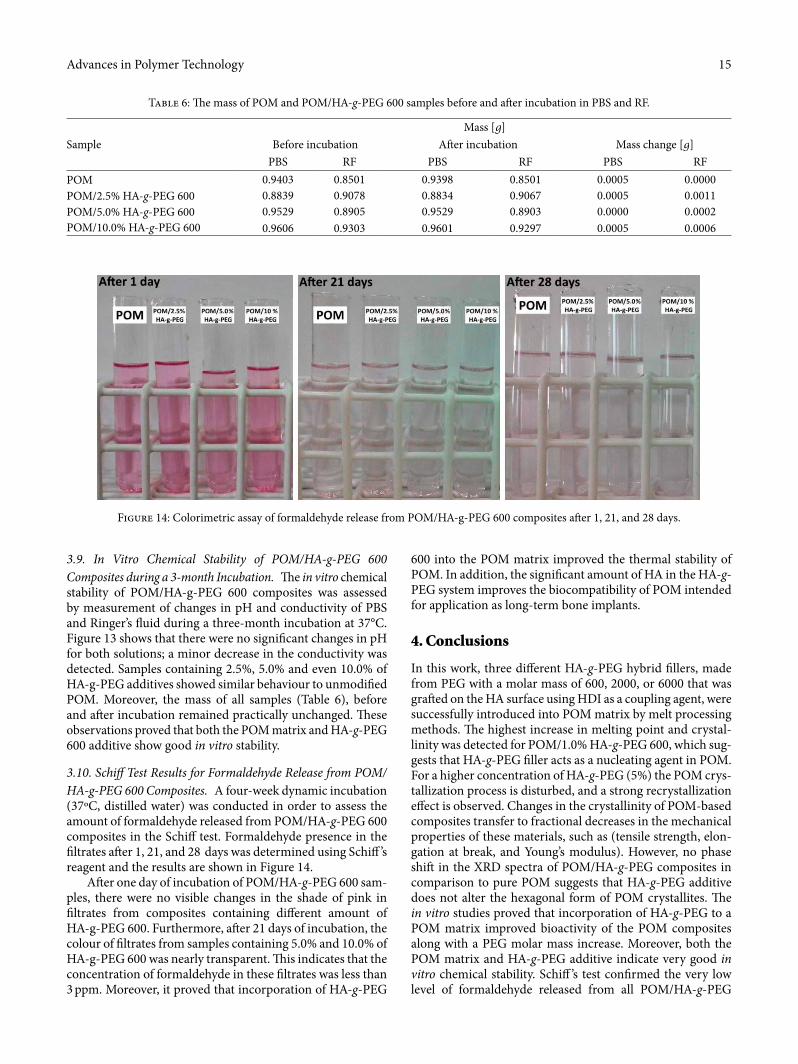
3.10. Schi¢ Test Results for Formaldehyde Release from POM/HA-g-PEG 600 Composites. A four-week dynamic incubation (37ºC, distilled water) was conducted in order to assess the amount of formaldehyde released from POM/HA-g-PEG 600 composites in the Schi� test. Formaldehyde presence in the �ltrates a¥er 1, 21, and 28 days was determined using Schi� ’s reagent and the results are shown in Figure 14.
A¥er one day of incubation of POM/HA-g-PEG 600 sam-ples, there were no visible changes in the shade of pink in �ltrates from composites containing di�erent amount of HA-g-PEG 600. Furthermore, a¥er 21 days of incubation, the colour of �ltrates from samples containing 5.0% and 10.0% of HA-g-PEG 600 was nearly transparent. �is indicates that the concentration of formaldehyde in these �ltrates was less than 3 ppm. Moreover, it proved that incorporation of HA-g-PEG
Table 6: �e mass of POM and POM/HA-g-PEG 600 samples before and a¥er incubation in PBS and RF.
SampleMass [�]
Before incubation A¥er incubation Mass change [�]PBS RF PBS RF PBS RF
POM 0.9403 0.8501 0.9398 0.8501 0.0005 0.0000POM/2.5% HA-g-PEG 600 0.8839 0.9078 0.8834 0.9067 0.0005 0.0011POM/5.0% HA-g-PEG 600 0.9529 0.8905 0.9529 0.8903 0.0000 0.0002POM/10.0% HA-g-PEG 600 0.9606 0.9303 0.9601 0.9297 0.0005 0.0006
Figure 14: Colorimetric assay of formaldehyde release from POM/HA-g-PEG 600 composites a¥er 1, 21, and 28 days.
Advances in Polymer Technology16
polyoxymethylene nanocomposites prepared by the spray method,” Journal of Composite Materials, vol. 51, no. 21, pp. 3053–3064, 2017.
[11] K. Pielichowska, D. M. Bielinski, M. Dworak, E. Kilian, B. Macherzyńska, and S. Blazewicz, “�e influence of nanohydroxyapatite on the thermal, mechanical and tribological properties of polyoxymethylene nanocomposites,” International Journal of Polymer Science, vol. 2017, pp. 1–11, 2017.
[12] Z.-Y. Wang, Y. Liu, and Q. Wang, “Flame retardant polyoxymethylene with aluminium hydroxide/melamine/novolac resin synergistic system,” Polymer Degradation and Stability, vol. 95, no. 6, pp. 945–954, 2010.
[13] V. M. Archodoulaki, S. Lu�l, and S. Seidler, “Stabiliser consumption of polyoxymethylene investigated by means of the pressure oxidative induction time method,” Polymer Testing, vol. 27, no. 2, pp. 234–242, 2008.
[14] R. P. Kusy and J. Q. Whitley, “Degradation of plastic polyoxymethylene brackets and the subsequent release of toxic formaldehyde,” American Journal of Orthodontics and Dentofacial Orthopedics, vol. 127, no. 4, pp. 420–427, 2005.
[15] Anon, “UV degradation & stabilization of polymers & rubbers,” Handbook of UV Degradation and Stabilization, ChemTec Publishing, pp. 177–292, 2nd edition, 2015.
[16] E. Richaud, “Polyoxymethylene additives,” Polyoxymethylene Handbook, John Wiley & Sons, Inc., pp. 53–105, 2014.
[17] Y. Hu, X. Zheng, and L. Ye, “Synergistic thermal stabilization effect of polyamide/melamine on polyoxymethylene,” Journal of Applied Polymer Science, vol. 97, no. 6, pp. 2387–2391, 2005.
[18] S. Wacharawichanant, S. �ongyai, A. Phutthaphan, and C. Eiamsam-ang, “Effect of particle sizes of zinc oxide on mechanical, thermal and morphological properties of polyoxymethylene/zinc oxide nanocomposites,” Polymer Testing, vol. 27, no. 8, pp. 971–976, 2008.
[19] X. Zhao, L. Gan, and L. Ye, “Structure and property of polyoxymethylene copolymerized with styrene oxide,” Journal of Polymer Research, vol. 22, no. 1, 2015.
[20] R. M. Meri, J. Zicans, A. Abele, T. Ivanova, and M. Kalnins, “Characterization of thermal destruction behavior of hybrid composites based on polyoxymethylene, ethylene-octene copolymer impact modifier and ZnO nanofiller,” in AIP Conference Proceedings, vol. 1736, no. 1, p. 020141 USA, 2016.
[21] J. H. Dumbleton, “Delrin as a material for joint prosthesis – a review,” American Society for Testing and Materials, Philadelphia, 1979, AST Corrosion and degradation of implant materials M Special Technical Publication.
[22] K. Pielichowska, A. Szczygielska, and E. Spasówka, “Preparation and characterization of polyoxymethylene-copolymer/hydroxyapatite nanocomposites for long-term bone implants,” Polymers for Advanced Technologies, vol. 23, no. 8, pp. 1141–1150, 2012.
[23] E. Bouyer, F. Gitzhofer, and M. I. Boulos, “Morphological study of hydroxyapatite nanocrystal suspension,” Journal of Materials Science: Materials in Medicine, vol. 11, pp. 523–531, 2000.
[24] Q. Liu, W. Guo, M. Yang, K. Wang, W. Liu, and F. Wu, “Release behavior of folic acid gra�ed hollow hydroxyapatite as drug carrier,” Advances in Polymer Technology, vol. 2019, pp. 1–9, 2019.
[25] K. Pielichowska, K. Król, and T. M. Majka, “Polyoxymethylene-copolymer based composites with PEG-gra�ed hydroxyapatite with improved thermal stability,” �ermochimica Acta, vol. 633, pp. 98–107, 2016.
composites and that all formaldehyde residue that comes from the POM processing was rinsed off the composites during the incubation. Moreover, there was no trace of new formalde-hyde, which confirmed the good stability of all POM compos-ites during the two-week incubation time.
Data Availability
All data used to support the findings of this study are included within the article.
Conflicts of Interest
�e authors declare that they have no conflicts of interest.
Acknowledgments
�e authors are grateful to the Polish National Science Centre for financial support under the Contract No. UMO-2016/21/B/ST8/00449.
References
[1] A. K. Bledzki, A. A. Mamun, and M. Feldmann, “Polyoxymethylene composites with natural and cellulose fibres: toughness and heat deflection temperature,” Composites Science and Technology, vol. 72, no. 15, pp. 1870–1874, 2012.
[2] L. Guo, X. Xu, Y. Zhang, and Z. Zhang, “Effect of functionalized nanosilica on properties of polyoxymethylene-matrix nanocomposites,” Polymer Composites, vol. 35, no. 1, pp. 127–136, 2014.
[3] S. Lü�l, P. M. Visakh, and S. Chandran, Polyoxymethylene Handbook: Structure, Properties, Applications and their Nanocomposites, Wiley, 2014.
[4] S. Lü�l, V. M. Archodoulaki, and S. Seidler, “�ermal-oxidative induced degradation behaviour of polyoxymethylene (POM) copolymer detected by TGA/MS,” Polymer Degradation and Stability, vol. 91, no. 3, pp. 464–471, 2006.
[5] L. W. McKeen, “3-polyether plastics,” �e Effect of Temperature and Other Factors on Plastics and Elastomers, Oxford: William Andrew Publishingpp. 91–142, 3rd edition, 2014.
[6] S. Lü�l, V. M. Archodoulaki, M. Glantschnig, and S. Seidler, “Influence of coloration on initial material properties and on thermooxidative ageing of a polyoxymethylene copolymer,” Journal of Materials Science, vol. 42, no. 4, pp. 1351–1359, 2007.
[7] V.-M. Archodoulaki, T. Koch, S. Lü�l, S. Seidler, and R. Stoiber, “Correlation between molar mass and thermal/mechanical properties of polyoxymethylene (POM) copolymers,” MoDeSt 2010; Athens, Greece.
[8] K. Pielichowska, “Polyacetals,” Plastics Engineering, CRC Press pp. 193–249, 2nd edition, 2015, Handbook of �ermoplastics.
[9] Y. Wang, W. Zhao, X. Wang, and D. Wu, “Preparation, mechanical properties and microstructure of polyoxymethylene fiber through melt spinning and hot drawing by using injection-molding grade resins,” Fibers and Polymers, vol. 17, no. 9, pp. 1464–1474, 2016.
[10] H. Asadollahi-yazdi, M. Shariati, A. Imam, and M. Ghatee, “Investigating the mechanical properties of layered graphene/
17Advances in Polymer Technology
[41] Y. Matsumura and J. B. Moffat, “Methanol adsorption and dehydrogenation over stoichiometric and non-stoichiometric hydroxyapatite catalysts,” Journal of the Chemical Society, Faraday Transactions, vol. 92, no. 11, pp. 1981–1984, 1996.
[42] F. Barroso-Bujans, F. Fernandez-Alonso, J. A. Pomposo, S. Cerveny, A. Alegría, and J. Colmenero, “Macromolecular structure and vibrational dynamics of confined poly(ethylene oxide): from subnanometer 2D-intercalation into graphite oxide to surface adsorption onto graphene sheets,” ACS Macro Letters, vol. 1, no. 5, pp. 550–554, 2012.
[43] K. Pielichowska, J. Bieda, and P. Szatkowski, “Polyurethane/graphite nano-platelet composites for thermal energy storage,” Renewable Energy, vol. 91, pp. 456–465, 2016.
[44] X. Liu, S. Bai, M. Nie, and Q. Wang, “Effect of blend composition on crystallization behavior of polyoxymethylene/poly(ethylene oxide) crystalline/crystalline blends,” Journal of Polymer Research, vol. 19, no. 1, Article ID 9787, 2011.
[45] M. Raimo, “Structure and morphology of polyoxymethylene,” Polyoxymethylene Handbook, John Wiley & Sons, Inc. pp. 163–91, 2014.
[46] M. S. Rahman, U. Shaislamov, J.-K. Yang et al., “Effects of electron beam irradiation on tribological and physico-chemical properties of polyoxymethylene copolymer (POM-C),” Nuclear Instruments and Methods in Physics Research Section B: Beam Interactions with Materials and Atoms, vol. 387, pp. 54–62, 2016.
[47] Y. Li, T. Zhou, Z. Chen, J. Hui, L. Li, and A. Zhang, “Non-isothermal crystallization process of polyoxymethylene studied by two-dimensional correlation infrared spectroscopy,” Polymer, vol. 52, no. 9, pp. 2059–2069, 2011.
[48] A. J. Jose and M. Alagar, “Development and characterization of organoclay-filled polyoxymethylene nanocomposites for high performance applications,” Polymer Composites, vol. 32, no. 9, pp. 1315–1324, 2011.
[49] A. Abdelbary, Wear of Polymers and Composites, Elsevier, pp. 133–158, 2015.
[50] H. Yasuda, Magneto Luminous Chemical Vapor Deposition, CRC Press, 2011.
[51] T. G. Tihan, M. D. Ionita, R. G. Popescu, and D. Iordachescu, “Effect of hydrophilic–hydrophobic balance on biocompatibility of poly(methyl methacrylate) (PMMA)–hydroxyapatite (HA) composites,” Materials Chemistry and Physics, vol. 118, no. 2-3, pp. 265–269, 2009.
[26] K. Pielichowska, “�ermooxidative degradation of polyoxymethylene homo- and copolymer nanocomposites with hydroxyapatite: Kinetic and thermoanalytical study,” �ermochimica Acta, vol. 600, pp. 7–19, 2015.
[27] G. M. Poralan, J. E. Gambe, E. M. Alcantara, and R. M. Vequizo, “X-ray diffraction and infrared spectroscopy analyses on the crystallinity of engineered biological hydroxyapatite for medical application,” IOP Conference Series Materials Science and Engineering, vol. 79, no. 1, p. 012028, 2015.
[28] R. Barabás, M. Czikó, I. Dékány, L. Bizo, and E. S. Bogya, “Comparative study of particle size analysis of hydroxyapatite-based nanomaterials,” Chemical Papers, vol. 67, no. 11, 2013.
[29] http://download.springer.com/static/pdf/98/bbm%253A978-3-540-26360-9%252F1.pdf ?auth66=1426842262fe2f3 201d3bfe0d62667e8e9f849fa02&ext=pdf.
[30] M. Fuensanta, J. A. Jofre-Reche, F. Rodríguez-Llansola, V. Costa, J. I. Iglesias, and J. M. Martín-Martínez, “Structural characterization of polyurethane ureas and waterborne polyurethane urea dispersions made with mixtures of polyester polyol and polycarbonate diol,” Progress in Organic Coatings, vol. 112, pp. 141–152, 2017.
[31] A. Güney and N. Hasirci, “Properties and phase segregation of crosslinked PCL-based polyurethanes,” Journal of Applied Polymer Science, vol. 131, no. 1, pp. n/a–n/a, 2014.
[32] M. A. Javaid, R. A. Khera, K. M. Zia, K. Saito, I. A. Bhatti, and M. Asghar, “Synthesis and characterization of chitosan modified polyurethane bio-nanocomposites with biomedical potential,” International Journal of Biological Macromolecules, vol. 115, pp. 375–384, 2018.
[33] F. E. Bailey and J. V. Koleske, Poly(ethylene oxide), Academic Press, 1976.
[34] A. Rapacz-Kmita, C. Paluszkiewicz, A. Ślósarczyk, and Z. Paszkiewicz, “FTIR and XRD investigations on the thermal stability of hydroxyapatite during hot pressing and pressureless sintering processes,” Journal of Molecular Structure, vol. 747, pp. 653–656, 2005.
[35] B. R. Barrioni, S. M. de Carvalho, R. L. Oréfice, A. A. R. de Oliveira, and M. D. M. Pereira, “Synthesis and characterization of biodegradable polyurethane films based on HDI with hydrolyzable crosslinked bonds and a homogeneous structure for biomedical applications,” Materials Science and Engineering: C, vol. 52, pp. 22–30, 2015.
[36] M. S. M. Arsad, P. M. Lee, and L. Kong Hung, “Synthesis and characterization of hydroxyapatite nanoparticles and β-TCP particles,” International Conference on Biotechnology and Food Science, 2011.
[37] Z. Y. Li, W. M. Lam, C. Yang et al., “Chemical composition, crystal size and lattice structural changes a�er incorporation of strontium into biomimetic apatite,” Biomaterials, vol. 28, no. 7, pp. 1452–1460, 2007.
[38] T. Tsuchida, J. Kubo, T. Yoshioka, S. Sakuma, T. Takeguchi, and W. Ueda, “Reaction of ethanol over hydroxyapatite affected by Ca/P ratio of catalyst,” Journal of Catalysis, vol. 259, no. 2, pp. 183–189, 2008.
[39] C. L. Kibby and W. K. Hall, “Dehydrogenation of alcohols and hydrogen transfer from alcohols to ketones over hydroxyapatite catalysts,” Journal of Catalysis, vol. 31, no. 1, pp. 65–73, 1973.
[40] S. J. Joris and C. H. Amberg, “Nature of deficiency in nonstoichiometric hydroxyapatites. I. Catalytic activity of calcium and strontium hydroxyapatites,” �e Journal of Physical Chemistry, vol. 75, no. 20, pp. 3167–3171, 1971.

CorrosionInternational Journal of
Hindawiwww.hindawi.com Volume 2018
Advances in
Materials Science and EngineeringHindawiwww.hindawi.com Volume 2018
Hindawiwww.hindawi.com Volume 2018
Journal of
Chemistry
Analytical ChemistryInternational Journal of
Hindawiwww.hindawi.com Volume 2018
Scienti�caHindawiwww.hindawi.com Volume 2018
Polymer ScienceInternational Journal of
Hindawiwww.hindawi.com Volume 2018
Hindawiwww.hindawi.com Volume 2018
Advances in Condensed Matter Physics
Hindawiwww.hindawi.com Volume 2018
International Journal of
BiomaterialsHindawiwww.hindawi.com
Journal ofEngineeringVolume 2018
Applied ChemistryJournal of
Hindawiwww.hindawi.com Volume 2018
NanotechnologyHindawiwww.hindawi.com Volume 2018
Journal of
Hindawiwww.hindawi.com Volume 2018
High Energy PhysicsAdvances in
Hindawi Publishing Corporation http://www.hindawi.com Volume 2013Hindawiwww.hindawi.com
The Scientific World Journal
Volume 2018
TribologyAdvances in
Hindawiwww.hindawi.com Volume 2018
Hindawiwww.hindawi.com Volume 2018
ChemistryAdvances in
Hindawiwww.hindawi.com Volume 2018
Advances inPhysical Chemistry
Hindawiwww.hindawi.com Volume 2018
BioMed Research InternationalMaterials
Journal of
Hindawiwww.hindawi.com Volume 2018
Na
nom
ate
ria
ls
Hindawiwww.hindawi.com Volume 2018
Journal ofNanomaterials
Submit your manuscripts atwww.hindawi.com